Abstract
The current gold standard for extracting highlight clips from soccer games is the use of manual annotations and clippings, where human operators define the start and end of an event and trim away the unwanted scenes. This is a tedious, time-consuming, and expensive task, to the extent of being rendered infeasible for use in lower league games. In this paper, we aim to automate the process of highlight generation using logo transition detection, scene boundary detection, and optional scene removal. We experiment with various approaches, using different neural network architectures on different datasets, and present two models that automatically find the appropriate time interval for extracting goal events. These models are evaluated both quantitatively and qualitatively, and the results show that we can detect logo and scene transitions with high accuracy and generate highlight clips that are highly acceptable for viewers. We conclude that there is considerable potential in automating the overall soccer video clipping process.
1. Introduction
Sports broadcasting and streaming are becoming increasingly popular, and the interest for viewing videos from sports events grows daily. For example, billion viewers tuned in to watch the 2018 FIFA World Cup [1], and as of 2020, soccer had a global market share of about of the 250 billion USD spectator sports industry [2]. The amount of content worldwide, such as footage, event highlights, goal and player statistics, scores, and rankings, is enormous, not to mention rapidly growing, and there is a huge interest from numerous actors to consume this available content. In this respect, it is important to provide game summaries, as has been done for decades, and more recently, to dedicate streams for particular categories of events, such as goals, cards, saves, and penalties. However, generating such summaries and event highlights requires the tedious and expensive task of manually detecting and clipping events. The process of generating summaries, event highlights, and tags is often performed redundantly by different actors for different purposes.
A typical tagging center in live operation for both broadcast and streaming services is shown in Figure 1, where a first-level operator can follow one or more games concurrently, and by the push of a button at the time of an event, publish the event to users. Note that not all tagging centers neccessarily use the same kind of pipeline (two levels of operation introduced to reduce the publishing latency, by annotating first and refining the event later); however, the same type of costly operations are still required, regardless of the complexity of the labeling procedure, i.e., splitting the task into two levels, or undertaking it as a single combined procedure. The published event is then often automatically clipped using static “−A” frames and “+B” frames from the annotated event position. Depending on the available resources, a second-level manual and more fine-granular annotation operation can be performed. This is a relatively time-consuming operation, but it is of significant importance to improve the user experience of viewers.

Figure 1.
Tagging center in live operation. Several persons involved and a large number of buttons to press in a cumbersome, error-prone, and tedious manual process, affecting costs and quality. (a) One person can follow multiple games. (b) Adding metadata and fine-granular clipping.
In this context, automating the entire pipeline is considered to be the “holy grail” in sports video production, since it would allow for the faster generation of game highlights at a much lower cost and with lower latency. Here, recent developments in artificial intelligence (AI) technology have shown great potential, but state-of-the-art results [3,4,5,6,7] are far from good enough for practical scenarios that have demanding real-time requirements, where the detection of certain events such as goals and cards must have accuracy. Even though the detection operation has by far received the most attention, it is probably the easiest initial operation in the overall tagging pipeline, which potentially includes various other operations after event detection.
In this paper, we focus on improving the second level of operations—namely, the more time-consuming and expensive, fine-grained annotation stage, where manually detected events are enhanced and refined. Automating this process has the potential to both save resources and improve quality, as this last production step is often not performed due to time limitations and costs. We aim to develop an AI-based solution to identify appropriate time intervals to highlight clips on a video’s timeline by defining the optimal start and stop point for each event. Thus, instead of a human operator manually searching frame-by-frame back and forth, we use AI technology to find scene changes, game turnovers, logo transitions, cheering, and replays to detect an event’s time interval automatically. In particular, after experimenting with a variety of Machine Learning (ML) models, we present a system that can find logo transitions using models based on ResNet [8] and VGG [9] and undertake scene boundary detection using a TransNet V2 [10] model pre-trained on the ClipShots [11] and IACC.3 [12] datasets. Cheering by players and fans can optionally be removed by detecting scenes between the event and replays. These sub-systems are then combined into an automated clipping system. Our experimental results show that both scene changes and logo transitions are detected with high accuracy, and a subjective assessment from 61 participants clearly indicates that an automated system can provide event highlights of high quality.
This work is a continuation of [13], where an initial event detection framework based on logo transition and scene boundary detection was proposed. We extend this work by making the following contributions:
- We elaborate further on the logo detection component, providing more details on the technical implementation, and additionally present a complexity analysis in terms of execution time;
- We elaborate further on the scene boundary detection component, providing more details on the technical implementation, and additionally present an analysis of misclassified transitions (false positives and false negatives);
- We add a new component to our pipeline, whereby cheering and celebration scenes can optionally be trimmed;
- We provide a more detailed description of the datasets and performance metrics we have used;
- We run a subjective evaluation (user study) involving 61 participants in order to evaluate the quality of our overall pipeline and present the results in the form of an A/B study across various participant classes;
- We add a discussion of the potential pitfalls of our pipeline and the generalizability of our approach.
In summary, we have developed an algorithmic video clipping system for soccer, which is able to perform in real-time, automating the most labor-intensive part of the highlight generation process and potentially reducing production costs. Such a system is applicable to various other sports broadcasts such as skiing, handball, or ice hockey, and presents a viable potential to affect future sports productions.
The rest of this paper is organized as follows. In Section 2, we provide a brief overview of related work in the fields of action detection and event clipping. We elaborate on our proposed framework in Section 3, followed by our implementation and experiments in Section 4. We present the results from our subjective evaluation campaign in Section 5. We raise a number of discussion points in Section 6 and conclude the paper in Section 7.
2. Related Work
Recent research has successfully used ML to solve video-related problems and to present viewers with video segments of desired events in an efficient manner. Here, we present selected works in the area of event detection and event clipping.
Event detection, also called action detection or action spotting, has lately received a great deal of attention. For example, multiple variants of two-stream convolutional neural networks (CNNs) have been applied to the problem [14,15] and extended to include 3D convolution and pooling [16,17]. Wang et al. [18,19] proposed temporal segment networks (TSN), and C3D [20] explored 3D convolution learning spatio-temporal features. Tran et al. [21] used (2+1)D convolutions to allow the network to learn spatial and temporal features separately. Further approaches aim at finding temporal points in the timeline [3,7,22,23,24,25,26], but even though many of these works present interesting approaches and promising results, such technologies are not yet ready to be used in real-life deployments. The reason is that most of the proposed models are computationally expensive and relatively inaccurate. In deployments where action/event annotation results are used in an official context (e.g., live sports broadcasts), these must be accurate—i.e., no false alarms or missed events are allowed—so manual operations are still needed. In this paper, our goal is to automate the manual process of event tagging for soccer videos, while maintaining accuracy and efficiency.
In the area of event clipping, the amount of existing work is limited. Koumaras et al. [27] presented a shot detection algorithm, and Zawbaa et al. [28] implemented a more tailored algorithm to handle cuts that transitioned gradually over several frames. Zawbaa et al. [29] classified soccer video scenes as long, medium, close-up, and audience/out of field, and several papers presented good results regarding scene classification [29,30,31]. Video clips can also contain replays after an event, and replay detection can help to filter out irrelevant replays. Ren et al. [32] introduced the class labels play, focus, replay, and breaks. Detecting replays in soccer games using a logo-based approach was shown to be effective using a support vector machine (SVM) algorithm, but not as effective using an artificial neural network (ANN) [28,29]. Furthermore, it was shown that audio may be an important modality for finding good clipping points. Raventos et al. [33] used audio features to give an importance score to video highlights, and Tjondronegoro et al. [34] used audio for a summarization method, detecting whistle sounds based on the frequency and pitch of the audio. Finally, some work focused on learning spatio-temporal features using various ML approaches [15,17,21], and Chen et al. [35] used an entropy-based motion approach to address the problem of video segmentation in sports events.
These works indicate a potential for the AI-supported production of sports videos. For example, extracting temporal information can be very useful for generating highlight clips. However, the presented results are still limited, and most importantly, the actual event clipping operation is not addressed. Computing should be possible to undertake with very low latency, as the production of highlight clips needs to be done in real-time, for the majority of use cases.
3. Proposed Framework
We propose an AI-based framework for the automatic clipping of soccer videos. Our framework is based on observations from real production environments in Norway and Sweden, such as the environment shown in Figure 1. In this section, we give a brief overview of our proposed solution.
3.1. Motivation
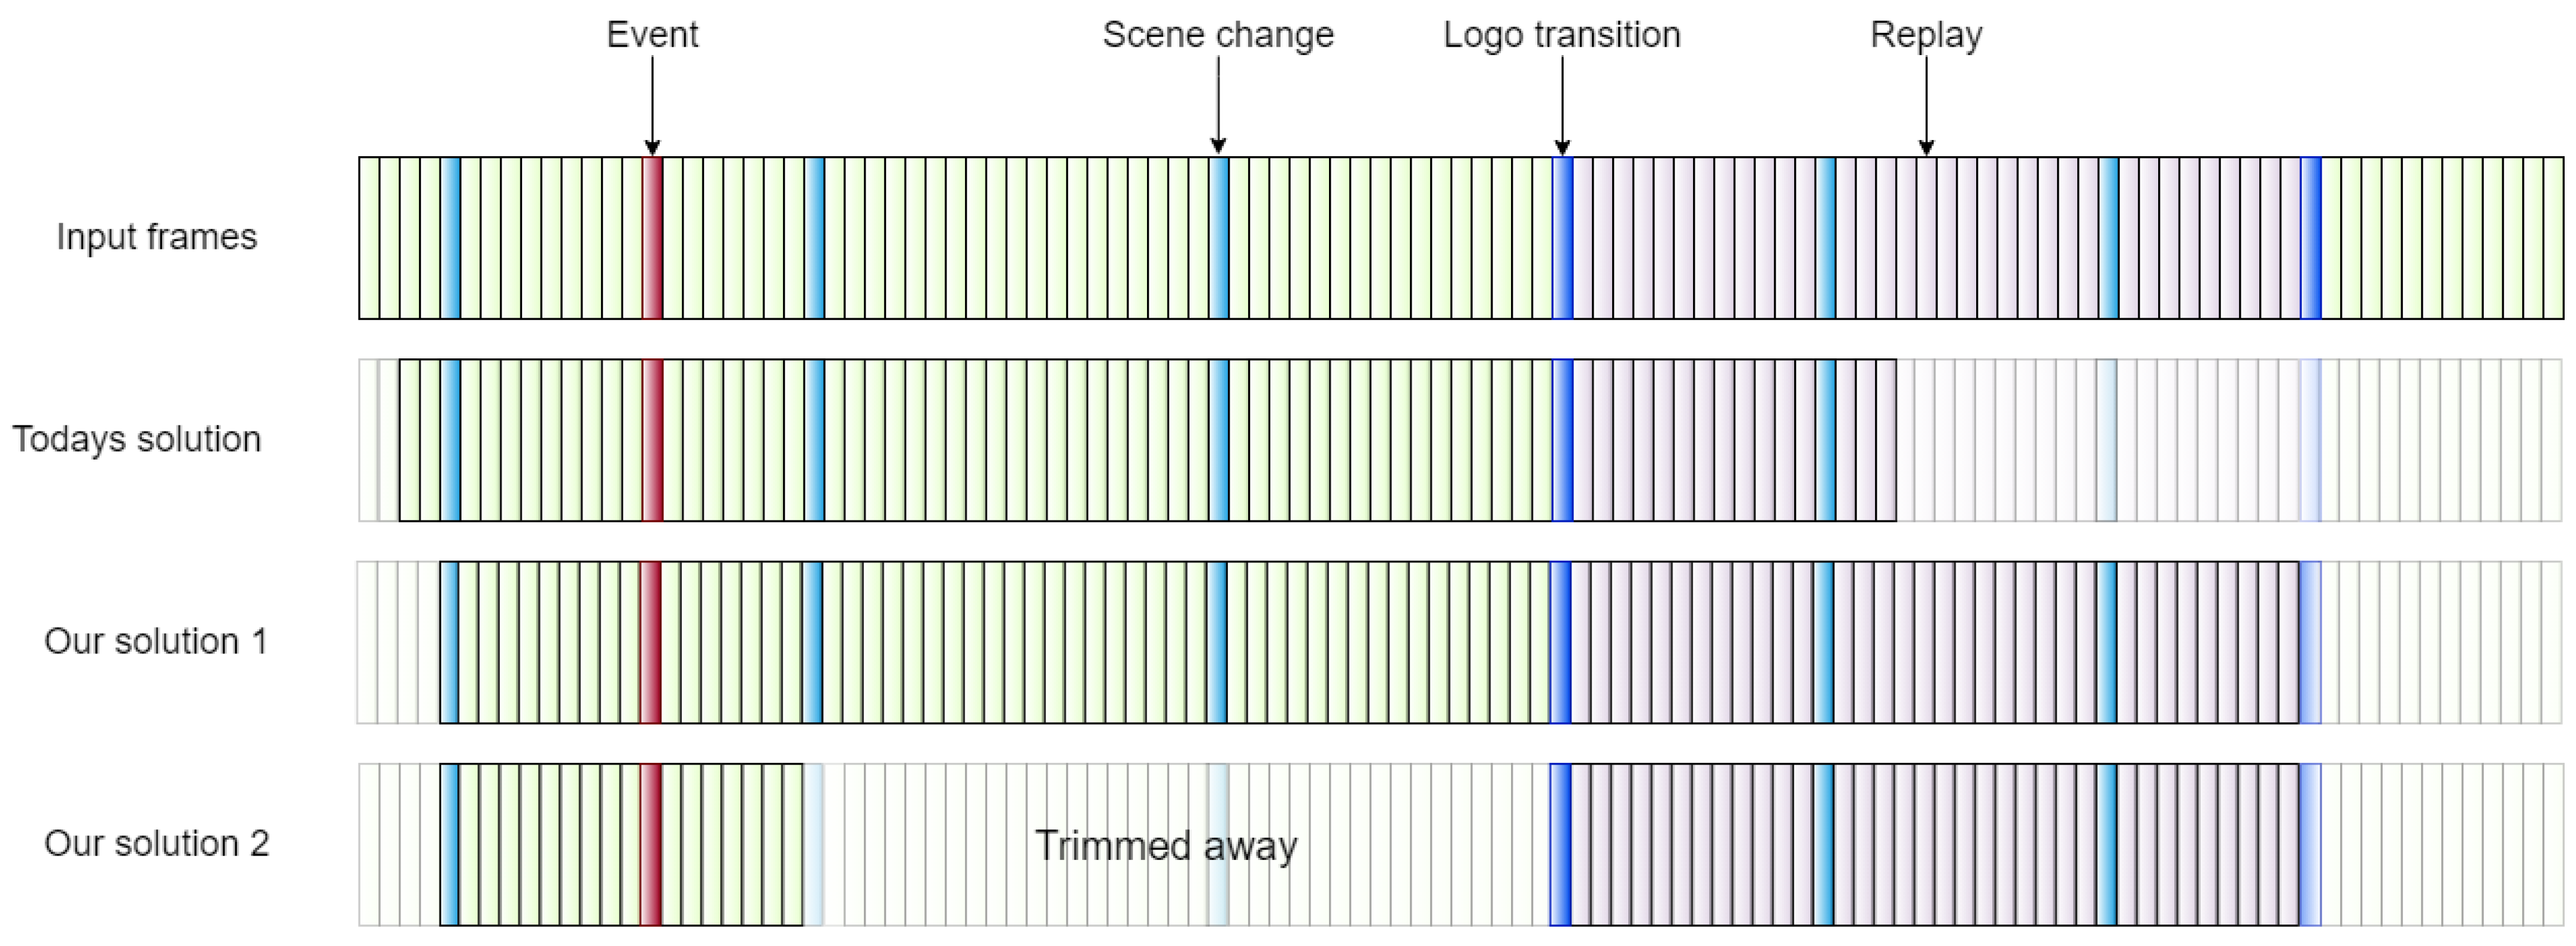
Clipping a video event is a tedious and expensive task. For example, consider the first row in Figure 2, depicting the video frames around an event occurring at the red frame. The produced video has scene changes, where different cameras capture the event from different angles and cover different parts of the soccer field. A goal typically consists of a small part of the attack leading to the goal; then, players are celebrating, the audience is cheering, and finally, several replays of the goal are shown. The viewers often want a clip to start a little before the goal event and to include the goal itself, possibly some cheering, and a clean-cut after some replays.
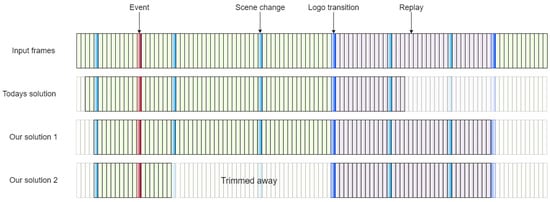
Figure 2.
Example of original frame sequence and the clipping solutions.
To save time and promote certain events with low latency, elite soccer leagues in Norway and Sweden use a multi-level annotation scheme. The first level annotator (Figure 1a) marks the event on the timeline, tags the event with the scoring team, and publishes the event with a static clipping at the start (e.g., −A frames from the event frame) and stop (e.g., +B frames) timestamps, as shown in the second row in Figure 2. This means that the clips often start far too early or in the middle of the event of interest, and they often end abruptly in the middle of a replay. Then, if time and resources are available, a second-level annotator (Figure 1b) searches for a better clipping position in the frame sequence, which is a time-consuming and costly process. Our basic idea is to automate this second-level annotation (clipping), as shown in the third row in Figure 2, and further optimize by removing some of the celebrations and cheering to reduce the length of the entire clip (fourth row in Figure 2).
In the following, we describe a framework for automating this task through ML, using state-of-the-art deep learning models for event clipping. Our proposed framework for automated highlight generation uses a combination of logo detection, scene boundary detection, and optional trimming.
3.2. Logo Detection
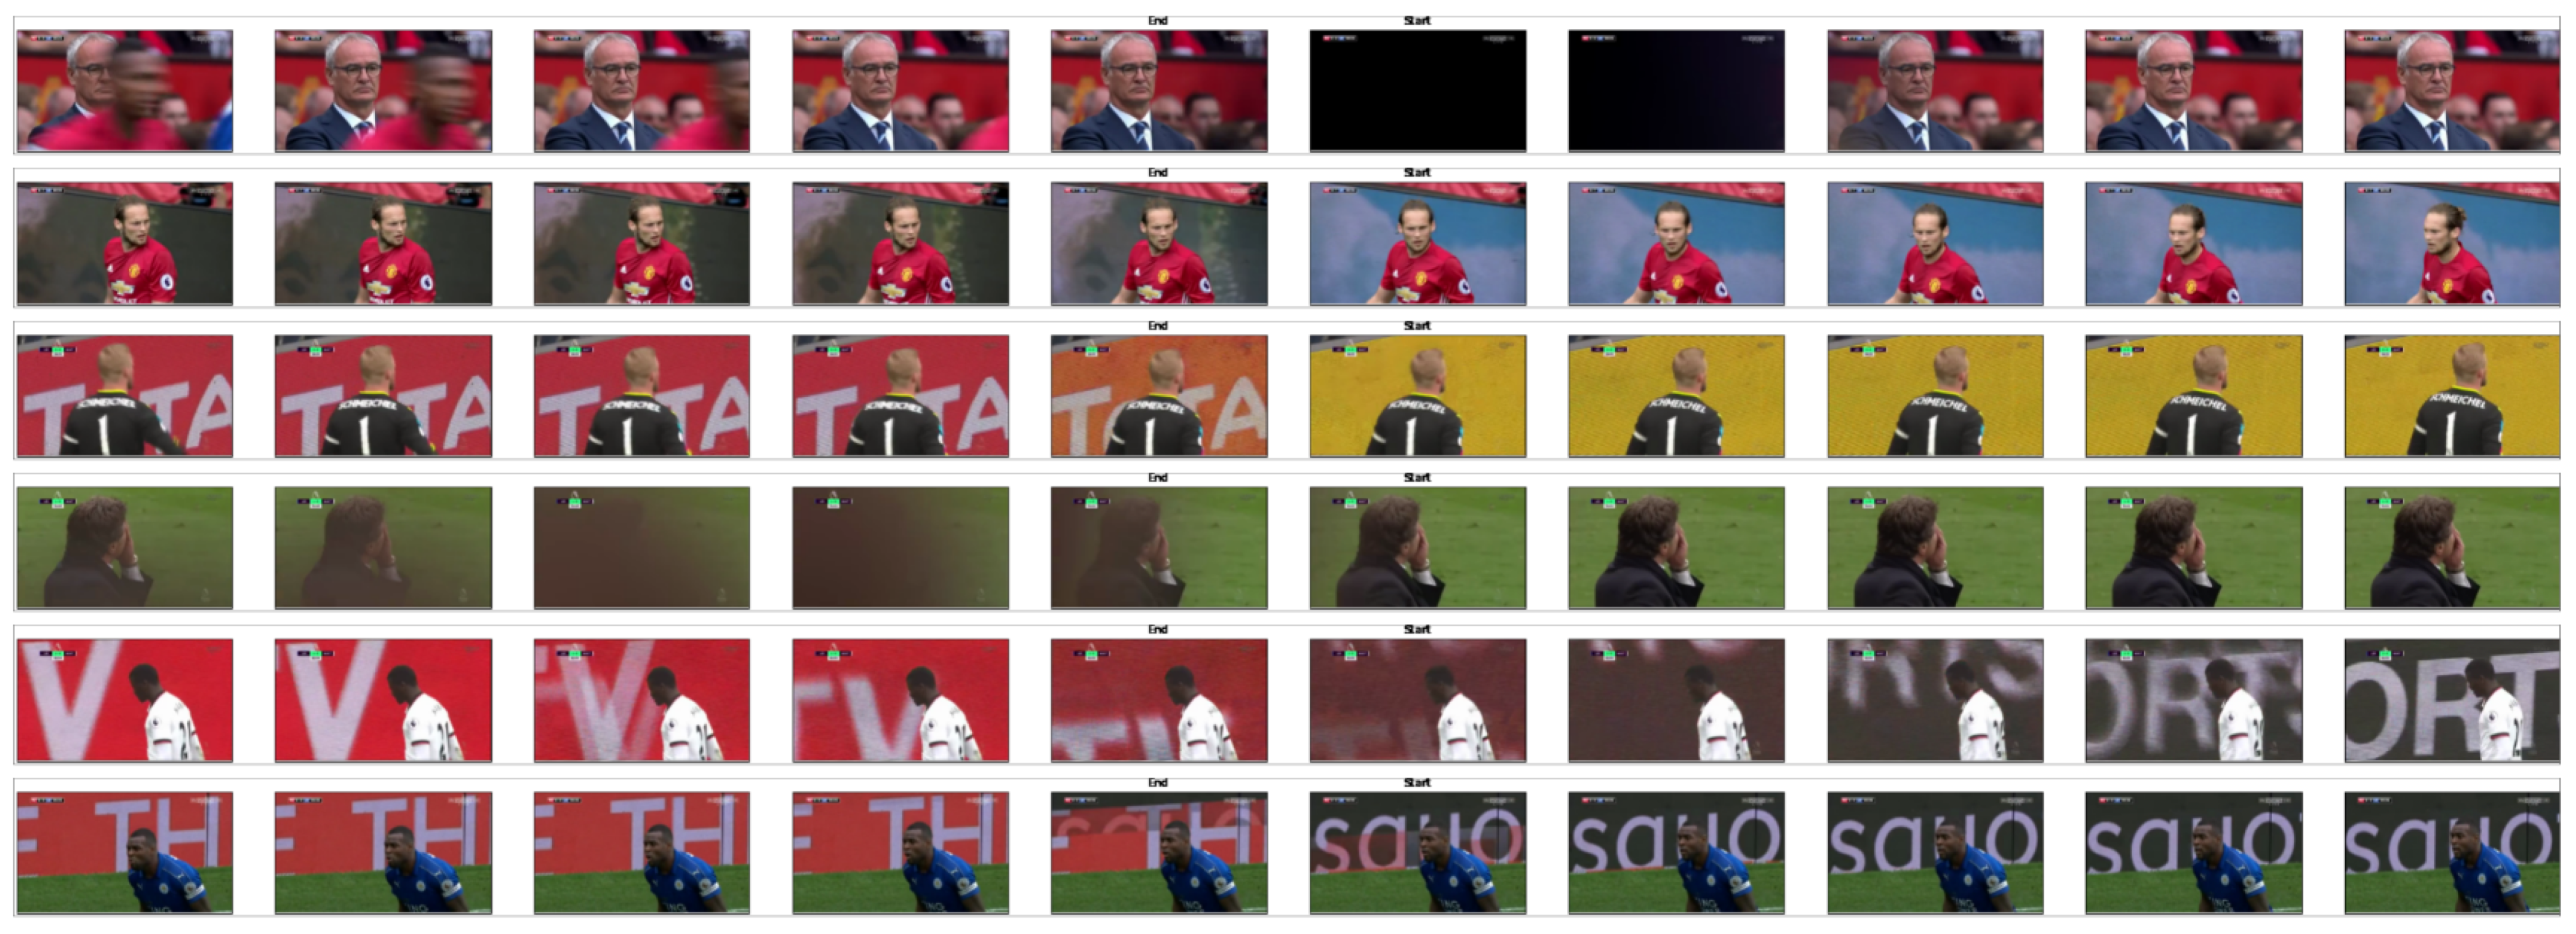
A typical goal event has logo transitions between the cheering, the replays, and when the event is finished (see Figure 3 for examples from the Norwegian Eliteserien). These can be used as temporal anchors for clipping by an automated framework, and thus, it is important to accurately detect logo transitions. We propose the use of a sliding window approach, searching the video for logos and extracting relevant features, such as shapes, edges, motions, and complex patterns. The challenge here is to reduce the computational cost and memory usage of extracting these features while still keeping all the relevant information for our model. For this task, we propose the use of relatively complex state-of-the-art models that have performed well on similar tasks; i.e., we build our system based on models such as VGG16 [9] and ResNet [8]. As a comparison, a smaller CNN and a lightweight VGG, which are computationally cheaper, can be used to see how well they perform compared to the state-of-the-art models. Moreover, Zambaa et al. [29] presented good results using SVM models for logo detection, so we also test SVM together with state-of-the-art CNN feature extractors. Through this comparison, our goal is to find a model that provides sufficiently good predictions while still remaining computationally cheap.

Figure 3.
Typical logo transitions from the Norwegian Eliteserien dataset.
3.3. Scene Boundary Detection
Another well-suited place to clip a video sequence is at a scene change (or a “shot boundary”) where, for example, the camera angle changes. For this task, we propose to use TransNet V2 [10]: a state-of-the-art scalable architecture for scene boundary detection that has achieved superb performance on shot-boundary datasets, such as ClipShots [11], RAI [36], and BBC [37]. The network takes a sequence of consecutive video frames and uses a series of convolutions together with handcrafted image features. The features are concatenated, and then the system returns a prediction for every frame in the input [10,38]. The TransNet model is pre-trained on transitions extracted from ClipShots [11] and the TRECVid IACC.3 [12] datasets. We propose to compare this pre-trained model with a model trained from scratch on different soccer video clips and identify the influencing factors on performance so that an optimal scene boundary detection model can be integrated into our overall pipeline.
3.4. Trimming of Cheering Scenes
Another observation we make regarding typical goal events is that the event might be followed by a variable duration of cheering and celebration scenes. The importance of these scenes depends heavily on game context, as well as the potential limit on the desired duration of each highlight clip. Therefore, we propose that the component for trimming the cheering scenes is optional, depending on whether there is a need to reduce the length of a highlight clip or not. For this task, we derive an empirical rule-based solution, taking into account the following observations: (1) scene changes between the main goal event and the replays often start with a logo transition; (2) the first goal scene is almost always from a single camera, meaning that all camera/scene changes before the logo transition are most likely spectators cheering and players celebrating; and (3) celebration scenes provide a useful context for highlight clips—therefore, a nonzero duration of cheering should be included after the goal and before the replay, albeit short if necessary.
4. Experiments and Results
In the following, we explain how we combined the individual components mentioned in Section 3 into a full-fledged automated event clipping system. We experimented with various approaches for each component of our pipeline, and we finally present two models that automatically find the appropriate time interval for goal event extraction.
4.1. Datasets
To develop our automated clipping system, we used two different soccer datasets. We used the open SoccerNet v2 [39] dataset and an in-house collected dataset of goals from the Norwegian “Eliteserien”. SoccerNet contains a large number of manually annotated, complete games with more than 100,000 different annotations across various event classes, with 1643 goals in particular, and around 150,000 scene change timestamps. Our “Eliteserien” dataset is smaller, with 300 clips of goals. These clips start 25 s before the annotated goal and end 50 s after. Furthermore, for scene boundary detection, we extracted 100 frames around each of the scene change timestamps of SoccerNet. We analyzed several sequences to get a better idea about how a goal event is built up and concluded that these events are typically structured as shown in the first row in Figure 2.
4.2. Implementation Details
Our tested models were implemented using Python version 3.7.10 (gcc version 7.3.0) with Numpy 1.19.2, Keras 2.4.3, Sklearn 0.24.1, and Tensorflow 2.4.1, and the experiments were run on a DGX-2 server. Both datasets were split into train, validation, and test sets. For Eliteserien, we split each of the 50 clips into train, validation, and test sets. The SoccerNet dataset is split according to the game that the frames are extracted from, and we used the split recommended by the SoccerNet team. This resulted in 29 games for training, 6 for validation, and 5 for testing. To avoid large weight values and to prevent the exploding gradient problem, we normalized our pixel values to be centered around zero—i.e., between and 1—similar to the pre-processing function of ResNet50 V2 in Keras [40]. Furthermore, when training our models, we augmented each image in the training set with a random degree of shear between 0 and . Shear distorts the image along an axis to rectify the perception angles and can represent looking at an object from different angles. The images also were subjected to a random value between 0–20% of zoom for each axis independently. The lost pixels were filled with the nearest pixel’s value. There was also a chance of horizontal flip. These augmentations happened on the fly with the use of Keras ImageDataGenerator [41].
4.3. Metrics
To evaluate the performance of different ML models, we have used precision, recall, and F1-score. Given that the true positive (TP) is the number of samples correctly identified as positive, true negative (TN) is the number of samples correctly identified as negative, false positive (FP) is the number of samples wrongly identified as positive, and false negative (FN) is the number of samples wrongly identified as negative, these metrics are defined as follows:
- Recall
- is a measure of sensitivity and is defined as the ratio of samples that are correctly identified as positive over all positive samples:
- Precision
- is also called Positive Predictive Value (PPV) and is defined as the ratio of samples that are correctly identified as positive over all samples that are identified as positive (i.e., the fraction of retrieved samples that are actually relevant):
- F1 score
- is defined as the harmonic mean of the precision and recall:
In addition to the above metrics, system performance metrics such as complexity, processing speed, and resource consumption are of interest. In our work, we have used the achieved frame rate (FPS) as a metric representing the ability of the system for performing in real-time.
4.4. Logo Detection Performance
As mentioned in Section 3, we used VGG16 [9], ResNet [8], a simple CNN, and a lightweight VGG for the task of logo detection. To train the CNN models, we initialized the weights using the Glorot uniform initialization [42] with the Adam optimizer [43] to improve the weights. We used binary cross-entropy as the loss function. Because ResNet50 V2 comes with pre-trained weights on ImageNet [44], we used these, and all data were pre-processed as described above. In general, we used a learning rate of and a batch size of 32. We ran training with early stopping using a patience of 10 epochs, meaning that we stopped if the loss of the validation set did not improve for 10 epochs. We also reduced the learning rate by a factor of 10, with a patience of 7 epochs on plateau, meaning that there was no improvement for validation loss. This was to fine-tune the model in the last epochs. We ran training for a maximum of 40 epochs. For both Eliteserien and Premier League data, we used several input resolutions and switched between RGB (3 channels) and grayscale (1 channel) images as a trade-off between computation time and accuracy. To train the SVM models, we started by extracting features either using the VGG16 network or the simple CNN. Then, we used a grid search for hyper-parameter tuning (across different regularization parameter and learning rate values), which returned the best estimator. We defined a max iteration of 100 epochs.
Table 1 shows the top 10 models for the Eliteserien dataset, as tested on 50 different clips. It can be observed from these results that there is a good performance on the test set, with the VGG-inspired model using a grayscale input reaching recall and precision. The SVM-based model with different inputs shows similar scores, albeit slightly worse. We noticed that some models had a significant decrease in performance, especially on the recall, between the training and testing. This may be due to overfitting, which is discussed in Section 6. The models correctly identify more than 15 frames, meaning they will still perform well as part of the logo detection component. As the test set is quite small and includes some team logos that are not present in the training set, even one misclassified logo frame can have a significant impact on the recall. While investigating the performance of the models on the full clips from Eliteserien, we deduced that all models perform well enough to find all logos we tested on without any false positives.

Table 1.
Best logo detection results on the Eliteserien test set, after optimizing the model configurations on the validation set.
Table 2 shows the top 10 models for the larger Premier League dataset (extracted from SoccerNet), using the best configurations tuned on the validation set. The results for the CNNs are overall good, where the models are capable of finding most logos with few false negatives. If we consider the two-level tagging scenario mentioned earlier, where the first level marks the event on the timeline and publishes the event with a static clipping at the start (−A frames from the event frame) and stop (+B frames) times (see Figure 1a), our module will have significantly fewer background frames, and the false negatives are a much smaller problem. We find that, even with more complex logos, our strategy works well.

Table 2.
Best logo detection results on the Premier League test set, after optimizing the model configurations on the validation set.
Finally, to determine whether logos can be detected in real-time, we present the computational efficiency of various models and inputs in Table 3. Regardless of the tested configurations, we observe that the processed frame rate is far beyond a 30 or 50 FPS real-time threshold. Even though the execution cost for the different CNN models is relatively high, we do not need to compromise in order to get acceptable performance in practice.

Table 3.
Logo detection execution times.
For use in our final system, we select the best-performing models on both datasets. The best model for Eliteserien is VGG-inspired with an input resolution of ( F1-score), and the best model for SoccerNet is ResNet with an input resolution of ( F1-score).
4.5. Scene Boundary Detection Performance
As mentioned in Section 3, we used the TransNet V2 [10] model for the task of scene boundary detection, which comes with a pre-trained model. We first compared the pre-trained model with the model trained on our soccer clips exclusively.
The SoccerNet scene boundary detection (SBD) dataset is a set of clips made from all shot boundary transitions in SoccerNet [39], classified into abrupt, smooth, and logo transitions. TransNet V2 takes 100 frames as input in resolution, and we therefore extracted 100 frames from each shot boundary. To make it more robust towards the variable placement of the boundary frame, we randomly selected a frame between frames 30 and 60, which were considered the shot boundary. We also made sure that close shot boundaries were also annotated for each of our clips. The dataset contains over 150,000 shot boundaries, with 43,000 logo transitions, 85,000 abrupt transitions, 28,000 smooth transitions, and 153 labeled “other”. The dataset uses the same train, validation, and test split as provided by [3] in order to evaluate full-length matches as well. For the presented results, we used a tolerance of a predicted value of frames, meaning the prediction must be within a distance of 24 frames of the actual scene change to be considered a true positive (correct prediction).
We start by testing on the SoccerNet SBD dataset to identify the performance on extracted scene changes. The results are presented in Table 4. There are only small differences, but we can observe that the pre-trained model performs better than the model trained from scratch on all classes except for the abrupt class. On the abrupt class with the trained model, we observe a higher recall than that of the pre-trained model. We experience the same when we combine abrupt and gradual transitions in one metric. In the context of the function the component has in our system, we prioritize precision over recall, as the recall is high for both. The consequences of a false positive are more severe than those of a false negative, as it may result in a clip in the middle of a scene sequence. A false negative will lead to the system making a default cut, but false positives will potentially fool the system into including/excluding scenes that it is not supposed to.

Table 4.
Performance of scene detection for each transition type (abrupt scene transition, gradual scene transition, logo transition) on our SoccerNet SBD test set.
To determine how accurately the model can predict scene changes on the entire videos, not only the single boundary clips, we repeated the experiment on the full SoccerNet test set, containing 100 full-length games. The results are shown in Table 5. The recall performance is in line with the previous test, but we observe lower scores in general.

Table 5.
Boundary detection results for full-length video test set.
When analyzing the results per game, we observed an almost perfect score of above for some, while models predicted hundreds of false positives for others. This may be due to various match properties, such as team jersey and advertising board colors, lighting conditions, production style, etc., which caused a model to detect false positives. It is also possible that the quality of some of the annotations was poor, as false positives were clustered in the same matches. However, to investigate further, we manually reviewed some of the false positives and false negatives predicted by the pre-trained model.
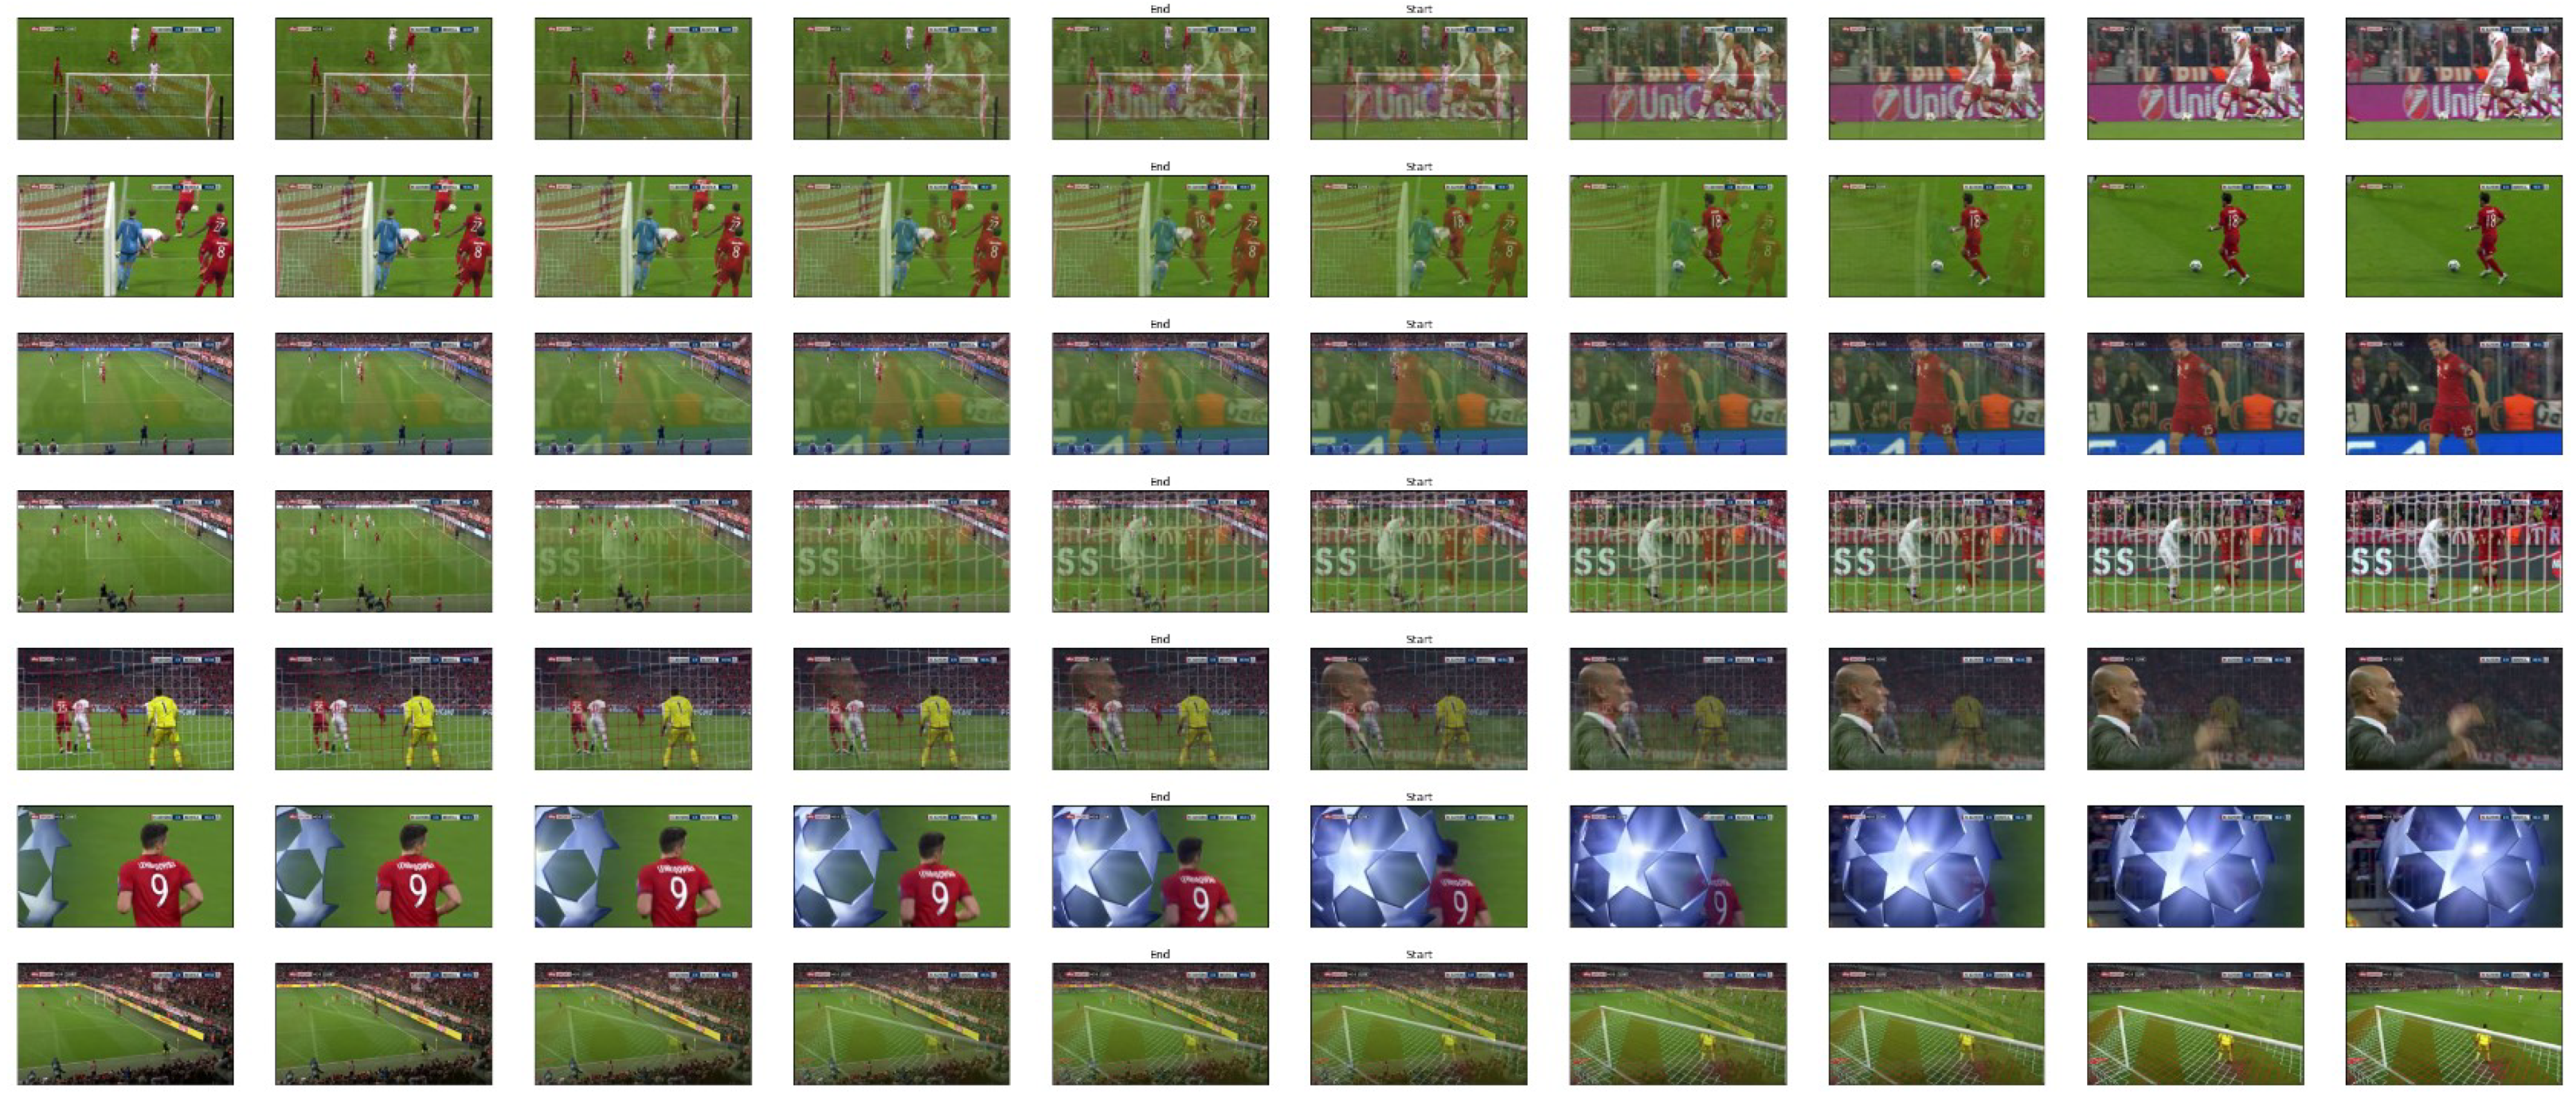
We started with the matches from the test set from Premier League season 2016–2017. More carefully checking a large number of “false predictions”, we observed that several of them were wrongly classified as false; i.e., the annotators seem to have missed or omitted several scene changes in the annotation process. To identify more details, we analyzed 10 random soccer periods from 10 different games. After thoroughly considering 1378 false positives, we surprisingly learned that only 2 of them were actual errors. Almost all cases of the false negatives we observed were abrupt or smooth transitions. Moreover, looking at the false positives in Figure 4, it is possible to observe the change of the background, which may easily be misclassified as an abrupt or fade transition. For false negatives (scene boundaries that the model misses to identify), we observed that these were mostly logos and smooth transitions. As illustrated in Figure 5, these are very challenging cases.
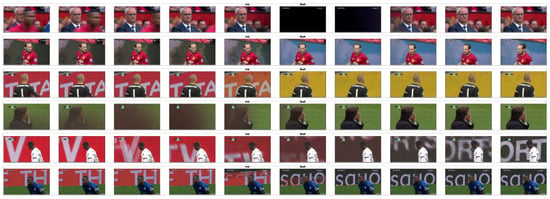
Figure 4.
The predicted false positive scene changes, where there are close similarities to abrupt and fade transitions.
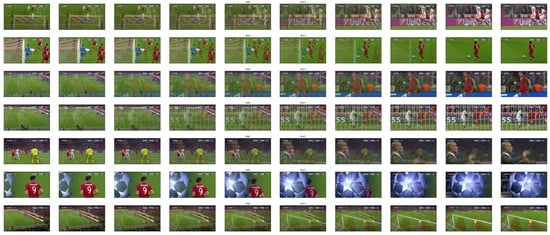
Figure 5.
Some of the transitions the model misses.
Overall, we conclude that our scene boundary detection component has a good performance, and due to the slightly higher values for the pre-trained model, we use this model in our final pipeline. It should be noted here that in order to remain consistent and comparable with existing studies using the same well-established and benchmarked dataset, we chose to use our results based on the SoccerNet dataset as it is (without modification, e.g., with respect to potentially mislabeled samples) in our final pipeline.
4.6. Optional Trimming Performance
Our system can optionally remove cheering and celebration scenes to further reduce the length of a highlight clip. This is done by identifying scene changes between the main goal event and the replays, which often start with a logo transition. The first goal scene is almost always from a single camera, meaning that all camera/scene changes before the logo transition are most likely spectators cheering and players celebrating.
After the goal, we include X seconds of celebration. Empirically derived, we search for a scene change between 5–10 s after the goal, but if not found, we clip after 8 s by default. In order for the replay clips not to come in abruptly, we also include a part of the last scene before the replay begins; i.e., up to the last Y seconds of the last scene before the replay is included, with a maximum of 5 s. Our assumption is that a replay always comes with a logo transition before or after. If two logo transitions are detected, we assume that the replay begins after the first.
4.7. Final Pipeline
In our final pipeline, we combine the three components described above. In Section 4.4, we have shown that the logo transition detection component performs well on both logo frame datasets. The best model for Eliteserien is VGG-inspired with an input resolution of (100% F1-score), and the best model for SoccerNet is ResNet with an input resolution of (% F1-score). We use these models in our final pipeline. In Section 4.5, we achieved good results from training TransNet V2 [10] on SoccerNet; however, it did not outperform the pre-trained model trained on ClipShots [11] and IACC.3 [12]. We therefore use the pre-trained model in our final pipeline. In Section 4.6, we described our initial tests to find suitable thresholds for trimming the video clip further by removing frames between the goal event and the replay. This component was designed by examining the production patterns in real soccer broadcasts. Clipping at scene changes can improve the quality by avoiding the scenario where a clip starts a few frames before a scene change. This utilizes the broadcast production as well, as a scene changes often happen when something exciting happens.
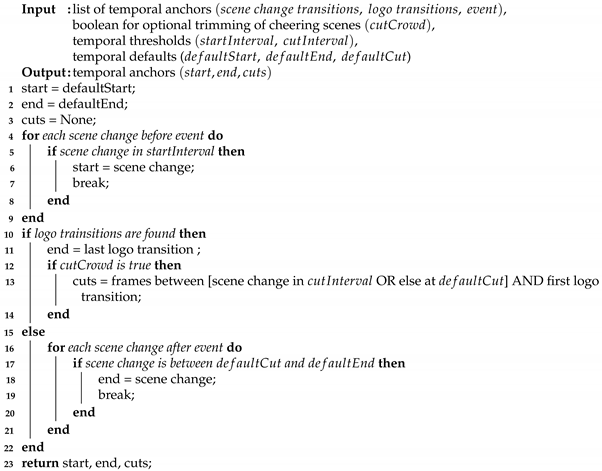
Our clipping system is depicted in Figure 6. The input to the system is a frame sequence containing an annotated event from the first-level tagging operation, with enough video available on both sides of the event’s point in time. The system first identifies logo and scene boundary transitions, which are marked with timestamps. These timestamps are then used by a video processing module, which converts the input frame sequence into a final highlight clip based on the clipping protocol described in Algorithm 1.

Figure 6.
An overview of our final pipeline, over an example frame sequence where the time of the event is given as input. Frames where a cutting operation would be appropriate are found using SBD and logo transition detection, and the overall clipping protocol is described in Algorithm 1.
As shown in Figure 6, the SBD component is run from the start of the frame sequence and identifies a set of temporal anchor points (timestamps) that are potential clipping points. The logo transition detection component is run between the event itself and the end of the frame sequence and returns temporal anchor points that are potential clipping points for the end of the highlight clip. Together with the temporal anchor point of the annotated event itself (manually tagged by the first-level operator), these anchor points are inputs to the clipping procedure described in Algorithm 1 as scene change transitions, logo transitions, event, and the actual clipping is undertaken by the module shown as “video processing” in Figure 6.
The clipping protocol works as follows (Algorithm 1): it determines the start point based on the scene that starts 12 to 5 s (startInterval) before the goal event. It chooses the scene furthest from the event. If there is no scene change, a default value of 10 s (defaultStart) is used. The end point is chosen to be in the middle of the last logo transition, or if no logo transition is found, as the last scene between 8 s (defaultCut) and 25 s (defaultEnd) after the event. The defaultEnd value is used if no scene change or logo transition is found. If the option to trim celebration scenes is enabled, the first 5–10 s (cutInterval) after the event are searched for a scene change to identify the start of the cut. If no scene change is found, then the defaultCut value is used as the start of the cut. All frames between this point and the first logo transition are cut.
| Algorithm 1: Clipping protocol for goal events. |
 |
5. Subjective Evaluation
The quality of a highlight clip is strongly subjective. Therefore, we also evaluated the performance of our pipeline in terms of end-user perception, in comparison to the static clipping method used by the industry today. We ran a subjective evaluation campaign via an online survey, where the participants were asked to visually compare and score different clipping methods. In particular, our goal was to benchmark the static clipping method with our pipeline (automatically generated highlight clips, with and without cheering scenes).
In total, 64 people participated in a user study, giving their consent for the collection of their metadata and answers. Participant metadata consisted of information about the participants such as age, gender, whether they have an interest in sports/soccer, their viewing habits, and whether they have video editing experience. In order to limit the length of our user study to 10–12 min, we randomly selected five events representing different goal situations as listed in Table 6. We ran the following algorithms in various combinations on these five events:

Table 6.
Model comparisons in the subjective evaluation.
- Original: The default static clipping of −A and +B seconds around the identified point in time where the event happened;
- Our model—full: Automatic clipping using logo transition and scene boundary detection;
- Our model—short: Automatic clipping using logo transition and scene boundary detection, where we also shortened the clip by removing cheering and celebration scenes.
In each question corresponding to one event, a brief description of the event was provided, and the participants were asked to rate two alternative clips on a scale between 1 (very poor) to 10 (broadcast ready) and optionally give comments. Overall, all participants assessed the same 10 clips, in the same pairwise fashion, to provide trustful results and direct comparisons. After removing 3 outliers (participants who responded with a maximum rating to all clips), we ended up with 61 participants, male and female, in an age range between 19 and 59 years old.
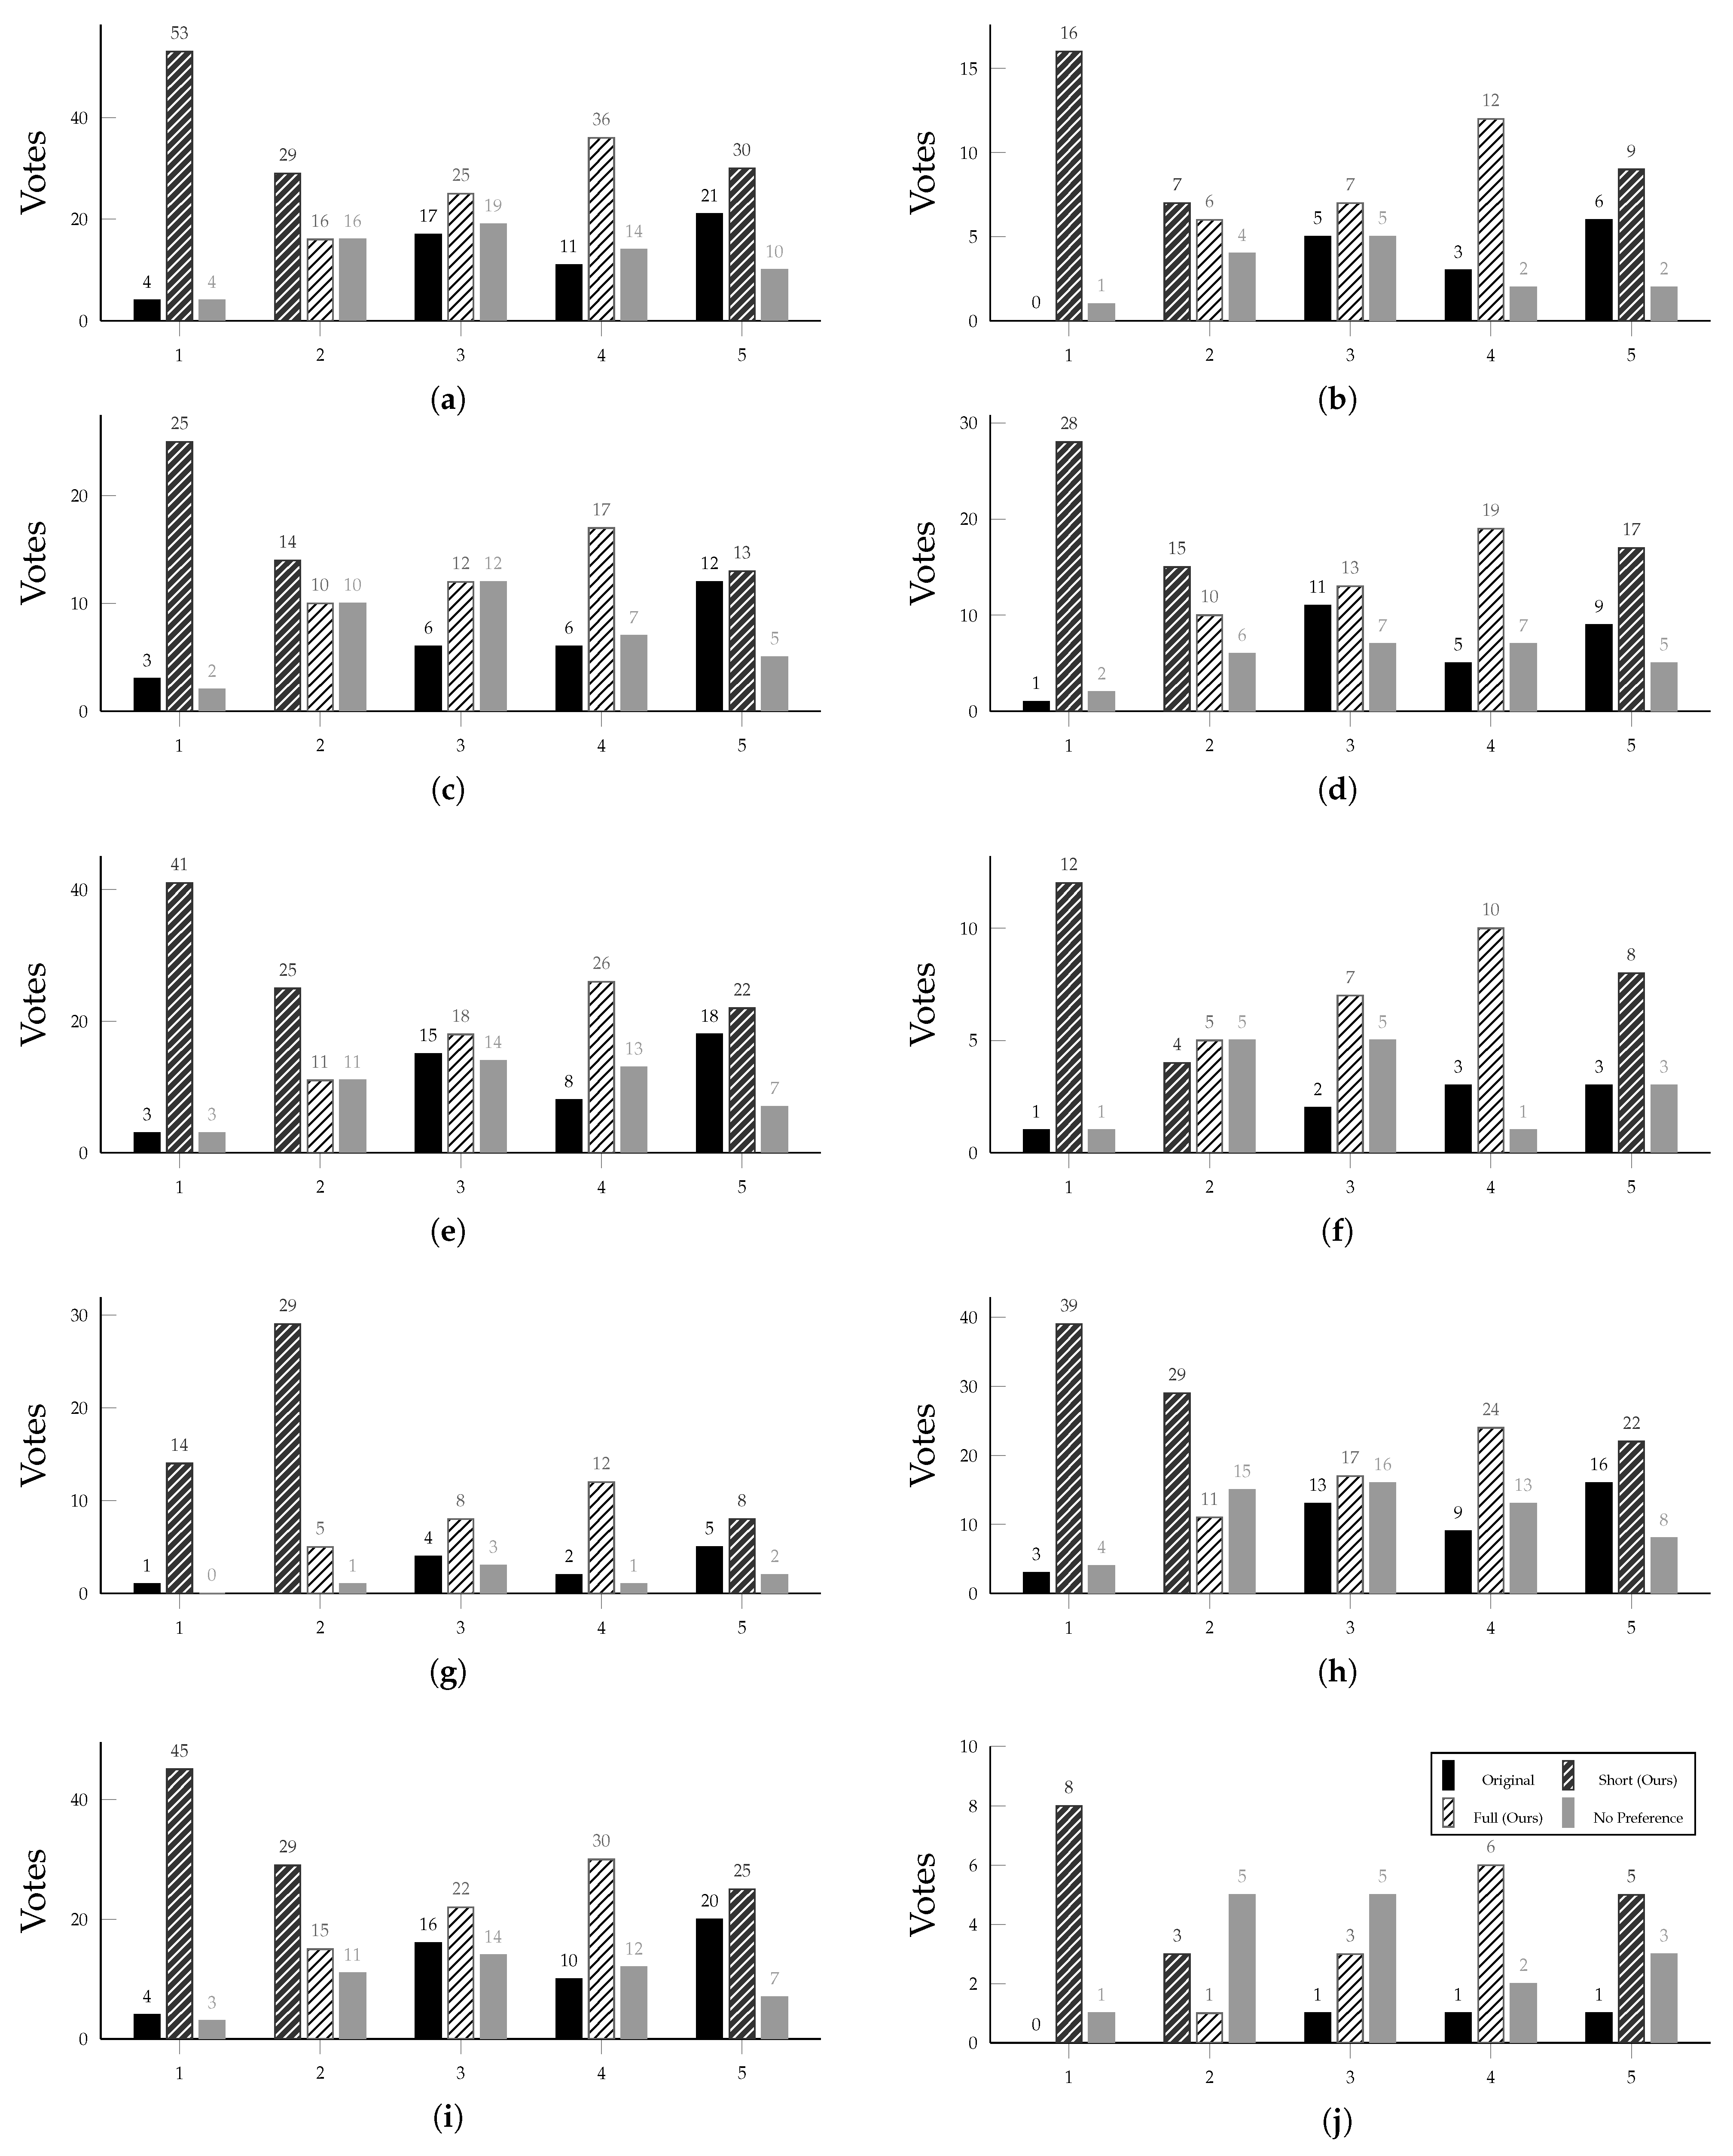
Figure 7 presents the results from our study, in the form of an A/B test. The overall scores over all participants are shown in Figure 7a. As we can observe, our models received better scores over all comparisons, and the additional clipping that removed cheering scenes produced the most preferred highlight clips. Our “short” model received an average score of , our “full” model an average of , and the original model an average of . Details about the scores for each participant class can be found in Table 7. Among the participant class (b), those with video editing experience, two participants were professional editors. Both confirmed that our models result in a significant improvement over the original; i.e., giving our models and higher average scores on the Likert scale, respectively. However, the results also show that there is still some room for improvement. Considering the additional features often employed by traditional broadcast productions, such as scene fading, custom transitions, new audio tracks targeted for specific clips, etc., to improve viewer experience, it can be said that automated pipelines have some room to improve.
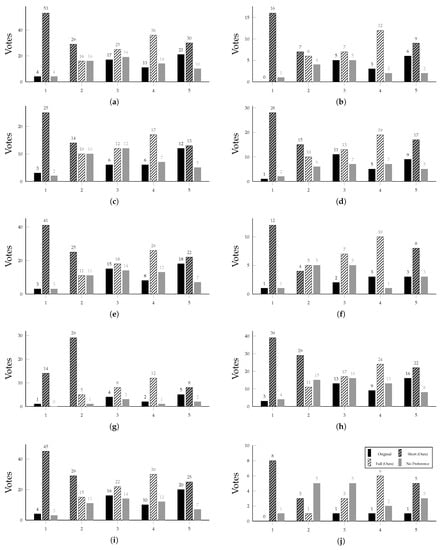
Figure 7.
Subjective evaluation: preferred model per question for different participant classes. Note that two clips are compared per question. The bar legend is shown in the bottom right plot. (a) Overall (61 persons). (b) Video editing experience (17 persons). (c) Soccer fans (30 persons). (d) Not soccer fans (31 persons). (e) Sport fans (47 persons). (f) Not sport fans (14 persons). (g) Females (15 persons). (h) Males (46 persons). (i) Age 29 and below (52 persons). (j) Age 30 and above (9 persons).

Table 7.
Detailed scores per A/B test in the subjective evaluation.
6. Discussion
Our proposed pipeline generates highlight clips that are accurate in terms of capturing logo transition and scene change boundaries, as well as being better perceived by viewers compared to traditional clipping methods. However, there was an open issue that we would like to address in this section.
Taking into account the results from Section 4.4 for Eliteserien and comparing the performance of various models on the validation and test sets, we identified a possible overfitting problem. Figure 8 presents the learning curves for Simple CNN and ResNet, where ResNet training ran for 12 epochs, and the simple CNN ran for 14 epochs. For the ResNet model (Figure 8c,d), the validation loss stops improving already after two epochs, while the training loss keeps improving. This suggests overfitting. The simple CNN model has a steadier decrease of loss before it stops improving afterseven epochs. This can be the result of a small dataset and low complexity.

Figure 8.
Overfitting analysis: comparing training and validation loss (low is better) and accuracy (high is better). (a) Accuracy: Simple CNN. (b) Loss: Simple CNN. (c) Accuracy: ResNet. (d) Loss: ResNet.
Focusing in detail on the logos that are missed, we observed that most are within the first five frames of a team logo transition, and we noticed that these team logos are not present in the training set. To tackle this problem, we generated a synthetic dataset to train the models to recognize all team logos. We created a logo collection by extracting images from both Eliteserien and Premier League using the FFmpeg tool and then the surrounding frames to obtain the logo transition. Each lasted for 20 frames in total, 10 of which were fade-in, 5 fully covered the logo, and 5 were fade-outs. For a number of selected models, we checked the validation results from training on the dataset supplemented with synthetic logo frames. The results of this experiment demonstrated that training with the original training set together with our synthetic logo images led to an increase of recall and helped the models to recognize team logos that were not encountered during training. However, we also observed a decrease in precision for all models, as more backgrounds were now misclassified. Although overfitting can be a significant problem for some tasks, there is a limit to how much harm it can do for the task of logo detection, due to most frames in the transition being very similar. We observed that the models only misclassify the earliest frames while still hitting all the rest. Since all the frames later in the transition were correctly classified, we did not consider the trade-off to be worth the change in this case and decided not to go forward with these models. It should also be noted that the results of our study are hard to generalize across different broadcaster domains and production environments (e.g., different leagues). As can be seen from Table 1 and Table 2, even within the same content domain (soccer video), different models can be optimal for different datasets (Eliteserien and Premier League). Model configurations and training depend heavily on the target soccer league, as different leagues even have different logo transitions, and there are different production protocols on how scenes and replays are presented. Therefore, one cannot necessarily rely on the current version of our pipeline in plug-and-play form, and our selected models may need to be re-trained with relevant datasets from the corresponding soccer league.
7. Conclusions
An AI-based production pipeline can be of great value for broadcasters and streaming services that provide sports videos. In this context, we have experimented with automating the process of event clipping from soccer videos, using logo transition and scene boundary detection, and optional trimming. We found that different ML models work best for different datasets (soccer leagues from different countries). For logo detection, a VGG-inspired CNN using a grayscale input resolution of was best for the Norwegian Eliteserien dataset, achieving a F1-score, but for the more complex English Premier League logo dataset, a ResNet using an RGB input of resolution was the best fit, achieving an F1-score. Regarding scene boundary detection, we trained and evaluated TransNet-V2 [10] on the SoccerNet shot boundary dataset but found the performance of the pre-trained version to be better, yielding an F1-score of . We combined these models in an end-to-end event clipping pipeline. Running a subjective user study, we saw that our pipeline could consistently produce more compelling highlight clips compared to the traditional method based on static clipping, which is currently used in Eliteserien.
Based on objective metrics as well as a subjective evaluation, we showed that an automated pipeline is able to provide highlight clips of a reliable standard. We also identified that what is considered a compelling highlight clip is subjective, and there might be differences in the production strategy preferred by different viewers. Nevertheless, our work gives a strong foundation and motivation for future studies using ML to generate automatic highlight clips from soccer videos. AI-based automated systems can potentially save a great deal of manual resources and reduce costs for existing tagging centers, as well as facilitating the deployment of such centers for lower level leagues which do not have sufficient resources in the first place.
There are a number of aspects of our work that we plan to improve as future work. These include the handling of different types and even sub-types of events (e.g., different events in the same category such as corner goals, penalty goals, and counter-attack goals, as well as altogether different events such as cards and substitutions), the investigation of multiple modalities for event detection and clipping (e.g., using stadium and commentary audio alongside video), the exploration of different scene transitions (e.g., fade-in and fade-out at the cuts), and a large-scale benchmark study to compare against professionally clipped events in order to solidify the effectiveness of our system.
Author Contributions
Conceptualization, J.O.V., H.K., S.A.H., M.A.R. and P.H.; methodology, J.O.V., H.K., S.A.H., M.A.R. and P.H.; software, J.O.V. and H.K.; validation, J.O.V., H.K., S.A.H., M.A.R. and P.H.; investigation, all authors; resources, J.O.V., H.K., S.A.H., T.K., D.J., M.A.R. and P.H.; data curation, J.O.V., H.K. and P.H.; writing, all authors; visualization, all authors; supervision, S.A.H., V.L.T., D.J., M.A.R. and P.H.; funding acquisition, M.A.R. and P.H. All authors have read and agreed to the published version of the manuscript.
Funding
This research was funded by the Norwegian Research Council, project number 327717 (AI-producer).
Institutional Review Board Statement
Not applicable.
Informed Consent Statement
Not applicable.
Data Availability Statement
The SoccerNet dataset is made available by Giancola et al. [3].
Acknowledgments
The research has benefited from the Experimental Infrastructure for Exploration of Exascale Computing (eX3), which is financially supported by the Research Council of Norway under contract 270053. We also acknowledge the use of video data from Norsk Toppfotball (NTF).
Conflicts of Interest
T.K., D.J. and P.H. have interests in Forzasys AS, but the current study is not part of any product or service from this company.
References
- FIFA.com. More Than Half the World Watched Record-Breaking 2018 World Cup. 2018. Available online: https://www.fifa.com/worldcup/news/more-than-half-the-world-watched-record-breaking-2018-world-cup (accessed on 4 December 2021).
- Why the Sports Industry is Booming in 2020 (and Which Key Players Are Driving Growth). 2020. Available online: https://www.torrens.edu.au/blog/why-sports-industry-is-booming-in-2020-which-key-players-driving-growth (accessed on 4 December 2021).
- Giancola, S.; Amine, M.; Dghaily, T.; Ghanem, B. SoccerNet: A Scalable Dataset for Action Spotting in Soccer Videos. In Proceedings of the IEEE Conference on Computer Vision and Pattern Recognition (CVPR) Workshops, Salt Lake City, UT, USA, 18–22 June 2018; pp. 1711–1721. [Google Scholar] [CrossRef] [Green Version]
- Kapela, R.; McGuinness, K.; Swietlicka, A.; O’Connor, N.E. Real-Time Event Detection in Field Sport Videos. In Proceedings of CVPR; Springer: Cham, Switzerland, 2014. [Google Scholar] [CrossRef] [Green Version]
- Cioppa, A.; Deliege, A.; Giancola, S.; Ghanem, B.; Droogenbroeck, M.; Gade, R.; Moeslund, T. A Context-Aware Loss Function for Action Spotting in Soccer Videos. In Proceedings of the IEEE/CVF Conference on Computer Vision and Pattern Recognition (CVPR), Seattle, WA, USA, 14–19 June 2020. [Google Scholar] [CrossRef]
- Tomei, M.; Baraldi, L.; Calderara, S.; Bronzin, S.; Cucchiara, R. RMS-Net: Regression and Masking for Soccer Event Spotting. arXiv 2021, arXiv:2102.07624. [Google Scholar]
- Rongved, O.A.N.; Hicks, S.A.; Thambawita, V.; Stensland, H.K.; Zouganeli, E.; Johansen, D.; Riegler, M.A.; Halvorsen, P. Real-Time Detection of Events in Soccer Videos using 3D Convolutional Neural Networks. In Proceedings of the IEEE International Symposium on Multimedia (ISM), Naples, Italy, 2–4 December 2020; pp. 135–144. [Google Scholar] [CrossRef]
- He, K.; Zhang, X.; Ren, S.; Sun, J. Deep Residual Learning for Image Recognition. arXiv 2015, arXiv:1512.03385. [Google Scholar]
- Simonyan, K.; Zisserman, A. Very Deep Convolutional Networks for Large-Scale Image Recognition. arXiv 2015, arXiv:1409.1556. [Google Scholar]
- Souček, T.; Lokoč, J. TransNet V2: An effective deep network architecture for fast shot transition detection. arXiv 2020, arXiv:2008.04838. [Google Scholar]
- Tang, S.; Feng, L.; Kuang, Z.; Chen, Y.; Zhang, W. Fast Video Shot Transition Localization with Deep Structured Models. arXiv 2018, arXiv:1808.04234. [Google Scholar]
- Awad, G.; Butt, A.A.; Curtis, K.; Lee, Y.; Fiscus, J.; Godil, A.; Delgado, A.; Zhang, J.; Godard, E.; Diduch, L.; et al. TRECVID 2020: Comprehensive campaign for evaluating video retrieval tasks across multiple application domains. In Proceedings of TREC Video Retrieval Evaluation (TRECVID); NIST: Gaithersburg, MD, USA, 2020. [Google Scholar]
- Valand, J.O.; Haris, K.; Hicks, S.A.; Thambawita, V.; Midoglu, C.; Kupka, T.; Johansen, D.; Riegler, M.A.; Halvorsen, P. Automated Clipping of Soccer Events using Machine Learning. In Proceedings of the IEEE International Symposium on Multimedia (ISM), Naples, Italy, 6–8 December 2021. [Google Scholar]
- Karpathy, A.; Toderici, G.; Shetty, S.; Leung, T.; Sukthankar, R.; Fei-Fei, L. Large-Scale Video Classification with Convolutional Neural Networks. In Proceedings of the IEEE Conference on Computer Vision and Pattern Recognition (CVPR), Columbus, OH, USA, 23–28 June 2014; pp. 1725–1732. [Google Scholar] [CrossRef] [Green Version]
- Simonyan, K.; Zisserman, A. Two-Stream Convolutional Networks for Action Recognition in Videos. In Proceedings of the Advances in Neural Information Processing Systems (NIPS), Montreal, QC, Canada, 8–13 December 2014; pp. 568–576. [Google Scholar]
- Feichtenhofer, C.; Pinz, A.; Zisserman, A. Convolutional Two-Stream Network Fusion for Video Action Recognition. In Proceedings of the IEEE Conference on Computer Vision and Pattern Recognition (CVPR), Las Vegas, NV, USA, 27–30 June 2016; pp. 1933–1941. [Google Scholar] [CrossRef] [Green Version]
- Carreira, J.; Zisserman, A. Quo Vadis, Action Recognition? A New Model and the Kinetics Dataset. In Proceedings of the IEEE Conference on Computer Vision and Pattern Recognition (CVPR), Honolulu, HI, USA, 21–26 July 2017; pp. 4724–4733. [Google Scholar]
- Shou, Z.; Wang, D.; Chang, S.F. Temporal Action Localization in Untrimmed Videos via Multi-stage CNNs. In Proceedings of the IEEE Conference on Computer Vision and Pattern Recognition (CVPR), Las Vegas, NV, USA, 27–30 June 2016; pp. 1049–1058. [Google Scholar] [CrossRef] [Green Version]
- Wang, L.; Xiong, Y.; Wang, Z.; Qiao, Y.; Lin, D.; Tang, X.; Gool, L.V. Temporal Segment Networks: Towards Good Practices for Deep Action Recognition. In Proceedings of the European Conference Computer Vision (ECCV), Amsterdam, The Netherlands, 11–14 October 2016; pp. 20–36. [Google Scholar]
- Tran, D.; Bourdev, L.; Fergus, R.; Torresani, L.; Paluri, M. Learning Spatiotemporal Features with 3D Convolutional Networks. In Proceedings of the IEEE International Conference on Computer Vision (ICCV), Santiago, Chile, 7–13 December 2015; pp. 4489–4497. [Google Scholar] [CrossRef] [Green Version]
- Tran, D.; Wang, H.; Torresani, L.; Ray, J.; LeCun, Y.; Paluri, M. A Closer Look at Spatiotemporal Convolutions for Action Recognition. In Proceedings of the IEEE Conference on Computer Vision and Pattern Recognition (CVPR), Salt Lake City, UT, USA, 18–22 June 2018; pp. 6450–6459. [Google Scholar] [CrossRef] [Green Version]
- Idrees, H.; Zamir, A.R.; Jiang, Y.; Gorban, A.; Laptev, I.; Sukthankar, R.; Shah, M. The THUMOS challenge on action recognition for videos “in the wild”. Comput. Vis. Image Underst. 2017, 155, 1–23. [Google Scholar] [CrossRef] [Green Version]
- Ren, S.; He, K.; Girshick, R.; Sun, J. Faster R-CNN: Towards Real-Time Object Detection with Region Proposal Networks. In Proceedings of the International Conference on Neural Information Processing Systems (NIPS), Montreal, QC, Canada, 7–12 December 2015; pp. 91–99. [Google Scholar]
- Xu, H.; Das, A.; Saenko, K. R-C3D: Region Convolutional 3D Network for Temporal Activity Detection. In Proceedings of the IEEE International Conference on Computer Vision (ICCV), Venice, Italy, 22–29 October 2017. [Google Scholar]
- Lin, T.; Liu, X.; Li, X.; Ding, E.; Wen, S. BMN: Boundary-Matching Network for Temporal Action Proposal Generation. In Proceedings of the IEEE International Conference on Computer Vision (ICCV), Seoul, Korea, 27–28 October 2019. [Google Scholar]
- Lin, T.; Zhao, X.; Su, H.; Wang, C.; Yang, M. BSN: Boundary Sensitive Network for Temporal Action Proposal Generation. In Proceedings of the European Conference Computer Vision (ECCV), Munich, Germany, 8–14 September 2018. [Google Scholar]
- Koumaras, H.; Gardikis, G.; Xilouris, G.; Pallis, E.; Kourtis, A. Shot boundary detection without threshold parameters. J. Electron. Imaging 2006, 15, 020503. [Google Scholar] [CrossRef] [Green Version]
- Zawbaa, H.M.; El-Bendary, N.; Hassanien, A.E.; Abraham, A. SVM-based soccer video summarization system. In Proceedings of the World Congress on Nature and Biologically Inspired Computing, Salamanca, Spain, 19–21 October 2011; pp. 7–11. [Google Scholar] [CrossRef] [Green Version]
- Zawbaa, H.; El-Bendary, N.; Hassanien, A.E.; Kim, T.H. Event Detection Based Approach for Soccer Video Summarization Using Machine learning. Int. J. Multimed. Ubiquitous Eng. (IJMUE) 2012, 7, 63–80. [Google Scholar]
- Xu, P.; Xie, L.; Chang, S.F.; Divakaran, A.; Vetro, A.; Sun, H. Algorithms and system for segmentation and structure analysis in soccer video. In Proceedings of the IEEE International Conference on Multimedia and Expo (ICME), Tokyo, Japan, 22–25 August 2001; pp. 721–724. [Google Scholar] [CrossRef]
- Rafiq, M.; Rafiq, G.; Agyeman, R.; Jin, S.I.; Choi, G.S. Scene Classification for Sports Video Summarization Using Transfer Learning. Sensors 2020, 20, 1702. [Google Scholar] [CrossRef] [PubMed] [Green Version]
- Ren, R.; Jose, J.M. Football Video Segmentation Based on Video Production Strategy. In Proceedings of ECIR—Advances in Information Retrieval; Springer: Berlin/Heidelberg, Germany, 2005; pp. 433–446. [Google Scholar]
- Raventos, A.; Quijada, R.; Torres, L.; Tarres, F. Automatic Summarization of Soccer Highlights Using Audio-visual Descriptors. arXiv 2014, arXiv:1411.6496. [Google Scholar] [CrossRef] [PubMed] [Green Version]
- Tjondronegoro, D.; Chen, Y.P.P.; Pham, B. Sports video summarization using highlights and play-breaks. In Proceedings of the ACM SIGMM International Workshop on Multimedia Information Retrieval (MIR), Berkeley, CA, USA, 7 November 2003; pp. 201–208. [Google Scholar] [CrossRef] [Green Version]
- Chen, C.Y.; Wang, J.C.; Wang, J.F.; Hu, Y.H. Motion Entropy Feature and Its Applications to Event-Based Segmentation of Sports Video. EURASIP J. Adv. Signal Process. 2008, 2008, 460913. [Google Scholar] [CrossRef] [Green Version]
- Baraldi, L.; Grana, C.; Cucchiara, R. Shot and Scene Detection via Hierarchical Clustering for Re-using Broadcast Video. In Proceedings of the International Conference on Computer Analysis of Images and Patterns (CAIP), Valletta, Malta, 2–4 September 2015; pp. 801–811. [Google Scholar] [CrossRef] [Green Version]
- Baraldi, L.; Grana, C.; Cucchiara, R. A Deep Siamese Network for Scene Detection in Broadcast Videos. In Proceedings of the ACM conference on multimedia (ACM MM), Brisbane, Australia, 26–30 October 2015; pp. 1199–1202. [Google Scholar] [CrossRef] [Green Version]
- Souček, T. Deep Learning-Based Approaches for Shot Transition Detection and Known-Item Search in Video. 2019. Available online: https://github.com/soCzech/MasterThesis (accessed on 4 December 2021).
- Deliège, A.; Cioppa, A.; Giancola, S.; Seikavandi, M.J.; Dueholm, J.V.; Nasrollahi, K.; Ghanem, B.; Moeslund, T.B.; Droogenbroeck, M.V. SoccerNet-v2: A Dataset and Benchmarks for Holistic Understanding of Broadcast Soccer Videos. arXiv 2020, arXiv:2011.13367. [Google Scholar]
- Keras. ResNet and ResNetV2. 2021. Available online: https://keras.io/api/applications/resnet/ (accessed on 4 December 2021).
- Chollet, F. Keras. 2015. Available online: https://keras.io (accessed on 4 December 2021).
- Glorot, X.; Bengio, Y. Understanding the difficulty of training deep feedforward neural networks. J. Mach. Learn. Res.—Proc. Track 2010, 9, 249–256. [Google Scholar]
- Kingma, D.P.; Ba, J. Adam: A Method for Stochastic Optimization. arXiv 2017, arXiv:1412.6980. [Google Scholar]
- Deng, J.; Dong, W.; Socher, R.; Li, L.J.; Li, K.; Fei-Fei, L. ImageNet: A large-scale hierarchical image database. In Proceedings of the IEEE Conference on Computer Vision and Pattern Recognition (CVPR), Miami, FL, USA, 22–24 June 2009; pp. 248–255. [Google Scholar] [CrossRef] [Green Version]
Publisher’s Note: MDPI stays neutral with regard to jurisdictional claims in published maps and institutional affiliations. |
© 2021 by the authors. Licensee MDPI, Basel, Switzerland. This article is an open access article distributed under the terms and conditions of the Creative Commons Attribution (CC BY) license (https://creativecommons.org/licenses/by/4.0/).


