Exploring the Eating Disorder Examination Questionnaire, Clinical Impairment Assessment, and Autism Quotient to Identify Eating Disorder Vulnerability: A Cluster Analysis


Abstract
1. Introduction
2. Background
2.1. Factors in Manifestation
2.1.1. Biological
2.1.2. Sociocultural
2.1.3. Psychological
2.2. Previous Research
2.3. Current Assessment Tools
2.4. Treatment
2.5. Unsupervised Machine Learning
3. Method
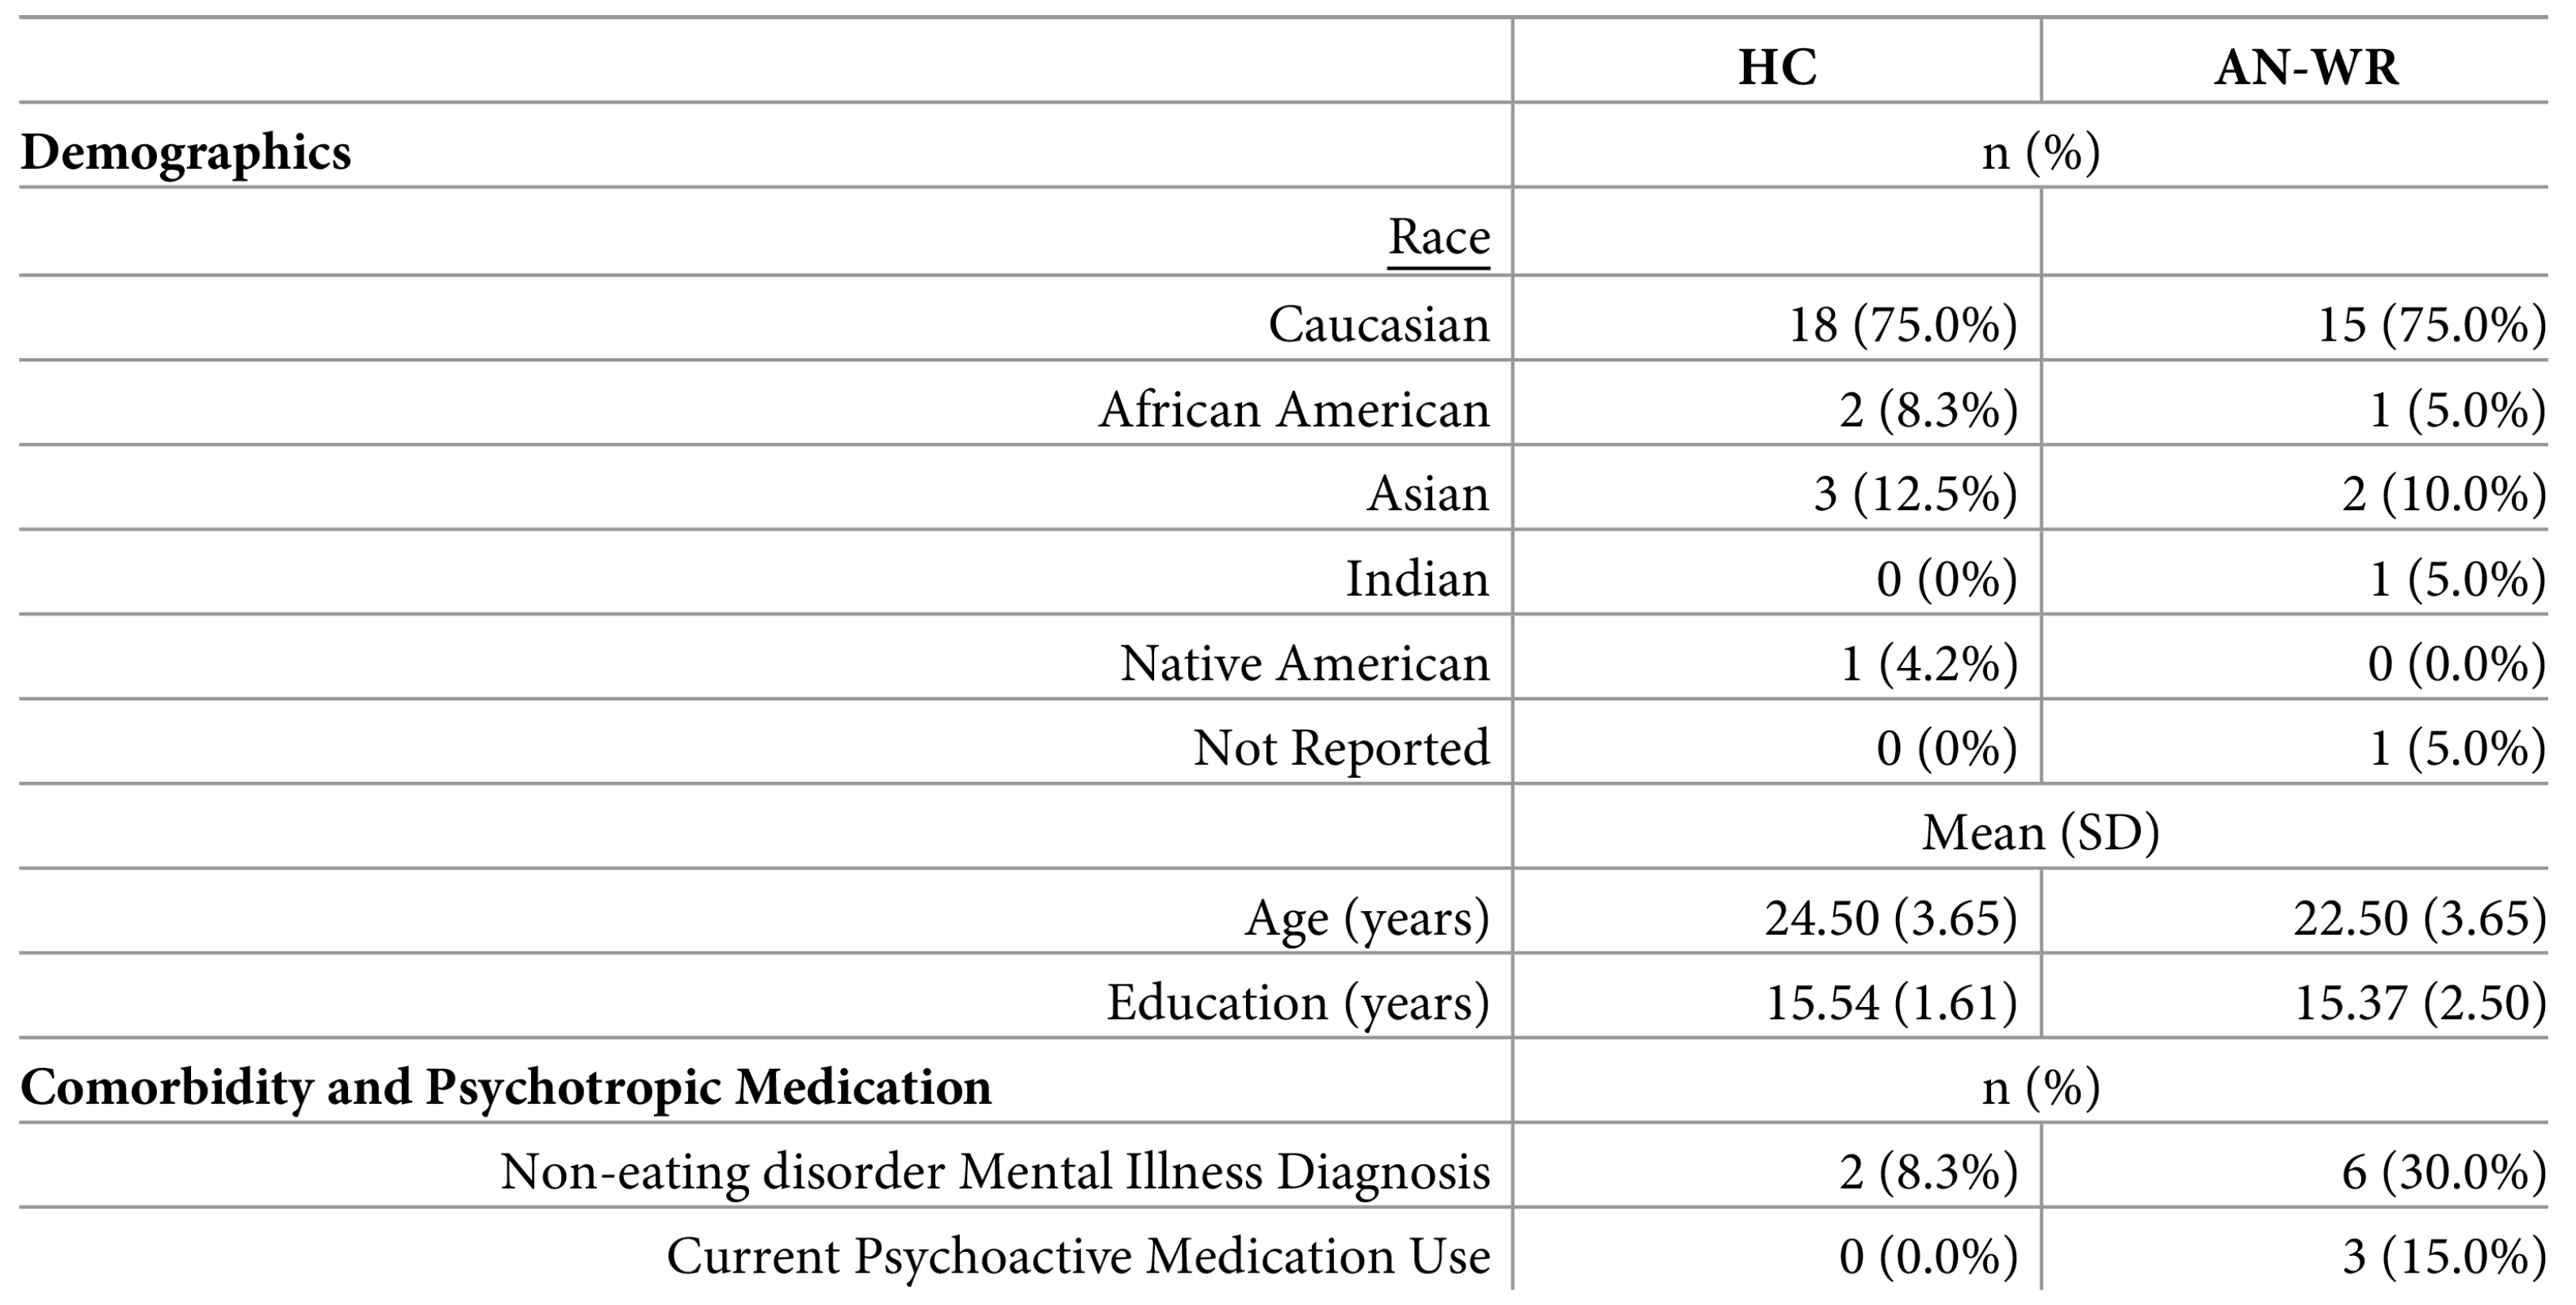
3.1. Dataset
3.2. Survey Measures
3.2.1. EDE-Q
3.2.2. CIA
3.2.3. AQ
3.3. Clustering Model
- Assignment
- (a)
- For each new point , determine the closest centroid and assign m to this group. The distance is calculated using some distance measure. In this paper, we emulated MacQueen’s [62] original application of this algorithm and used Euclidean distance:
- Recalculation
- (a)
- Recalculate the centroid value.
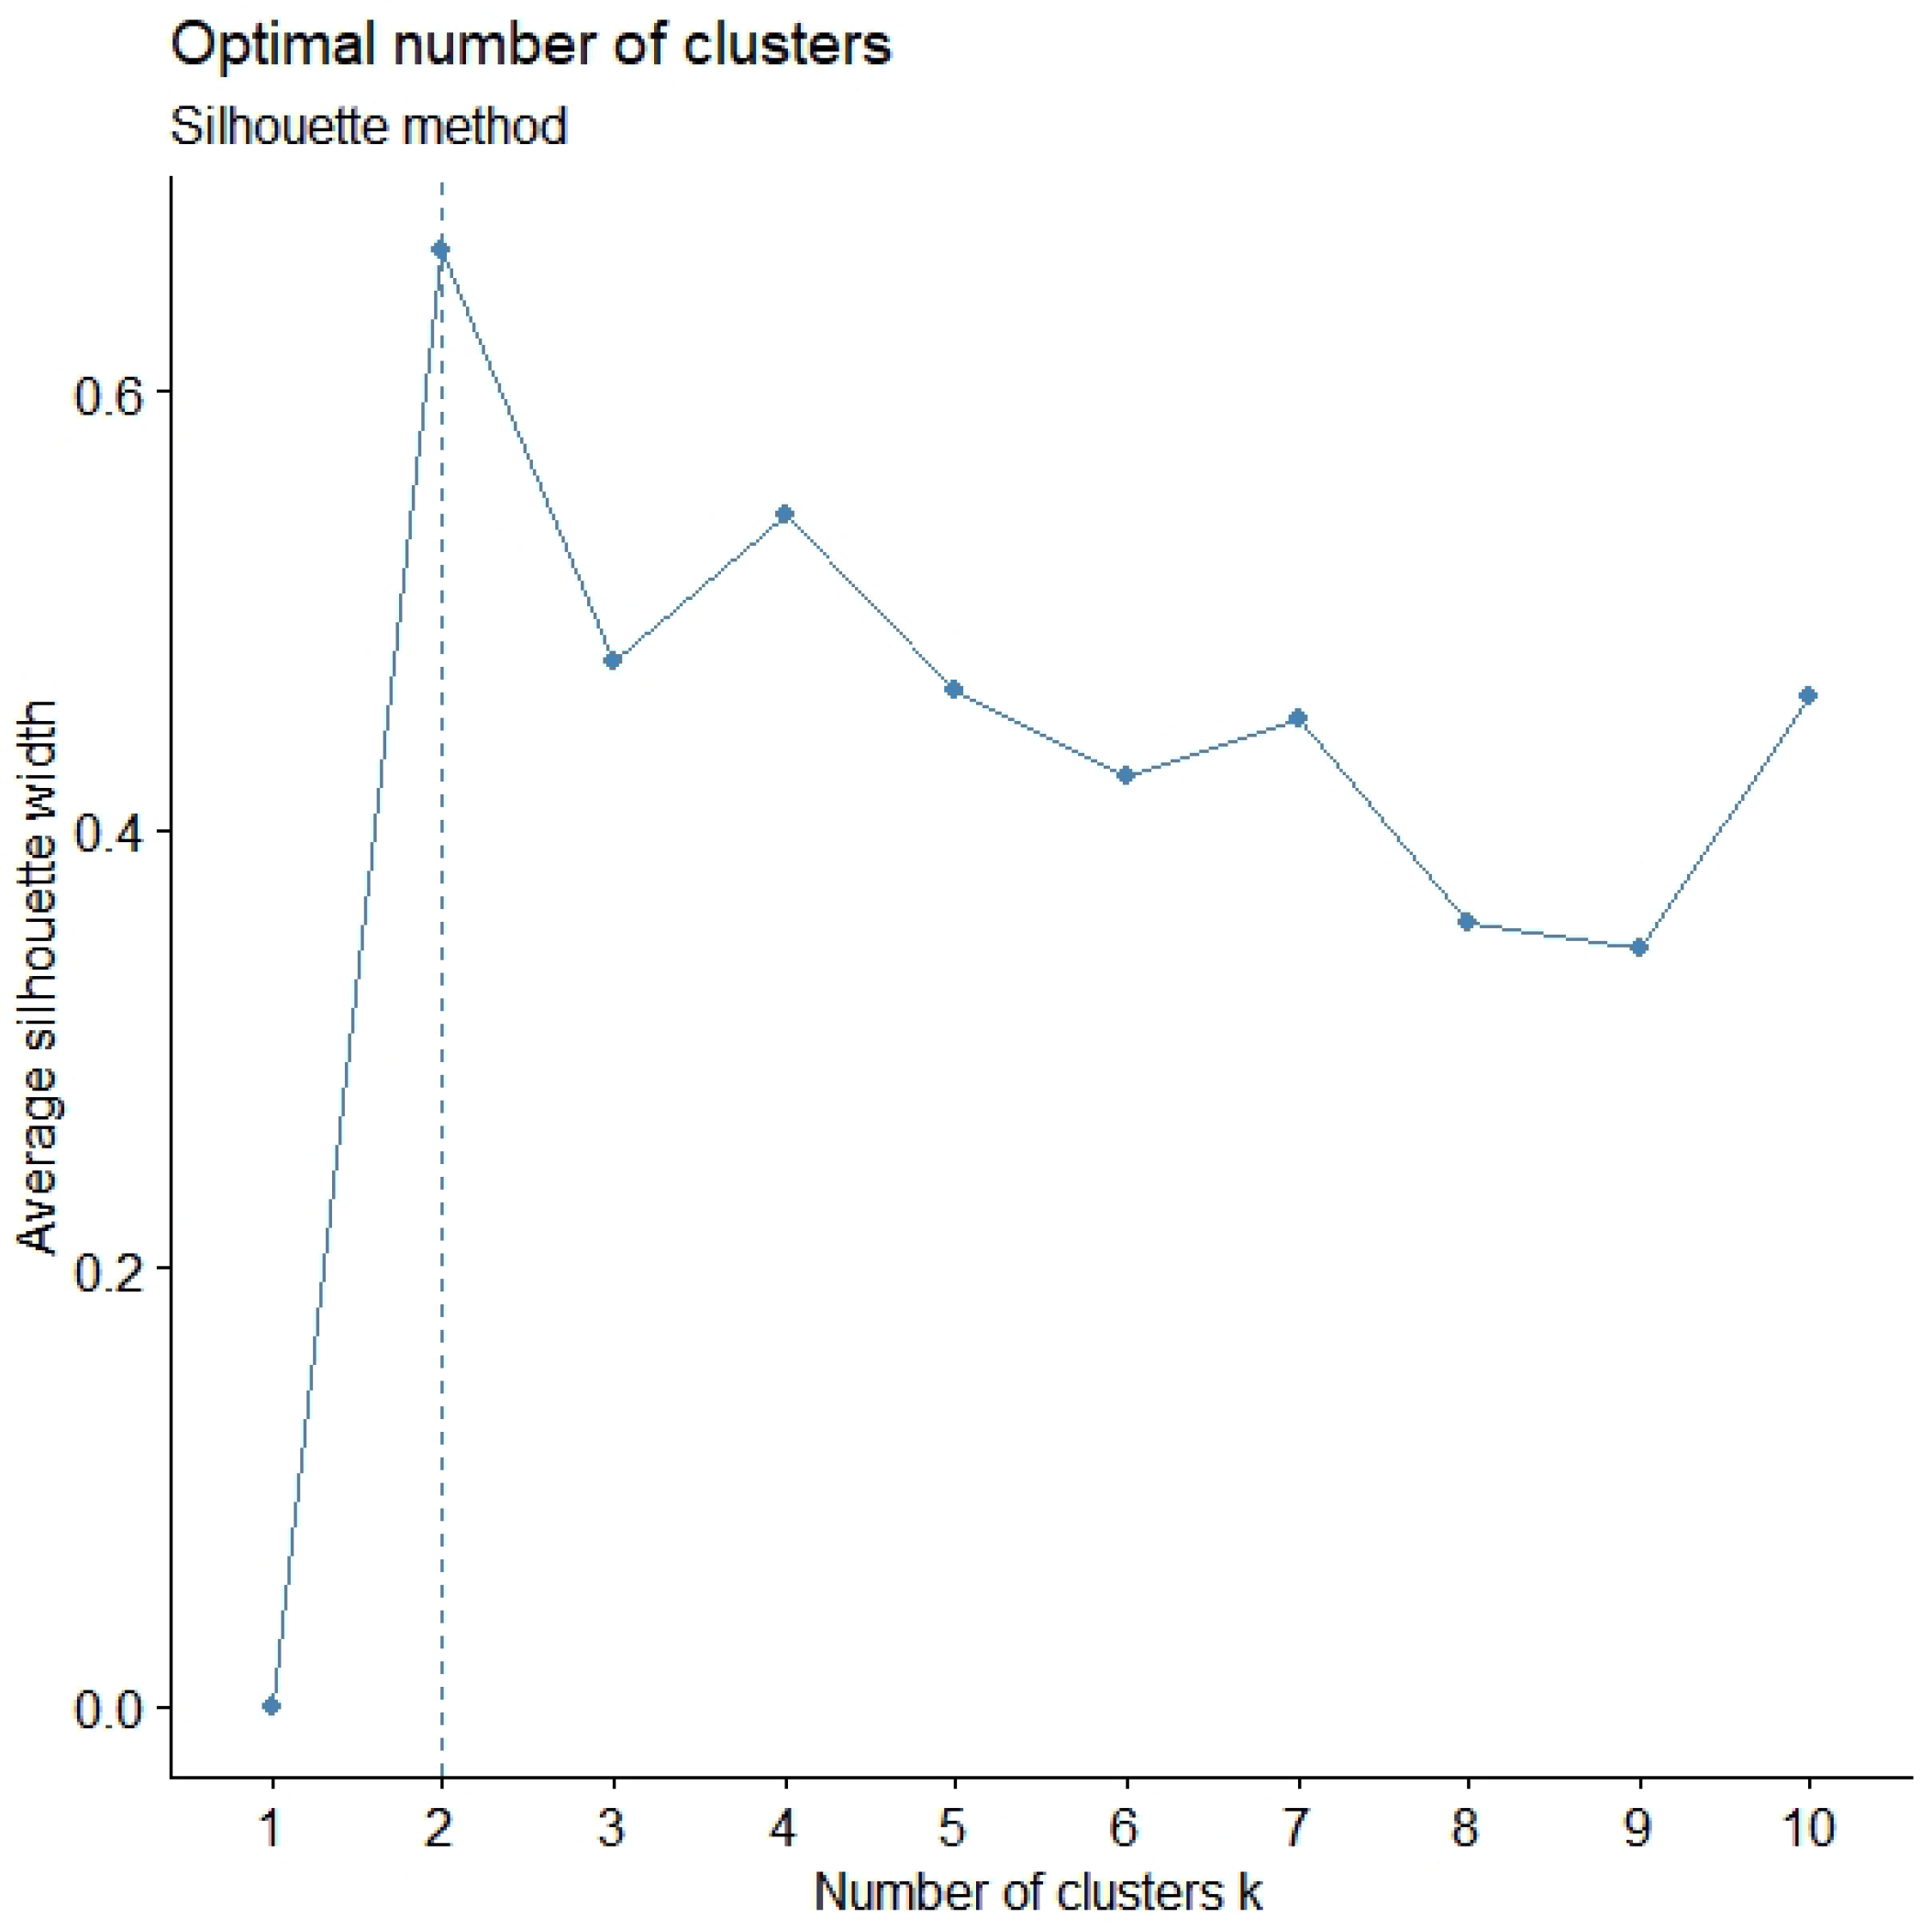
3.4. Validation Measures
4. Results
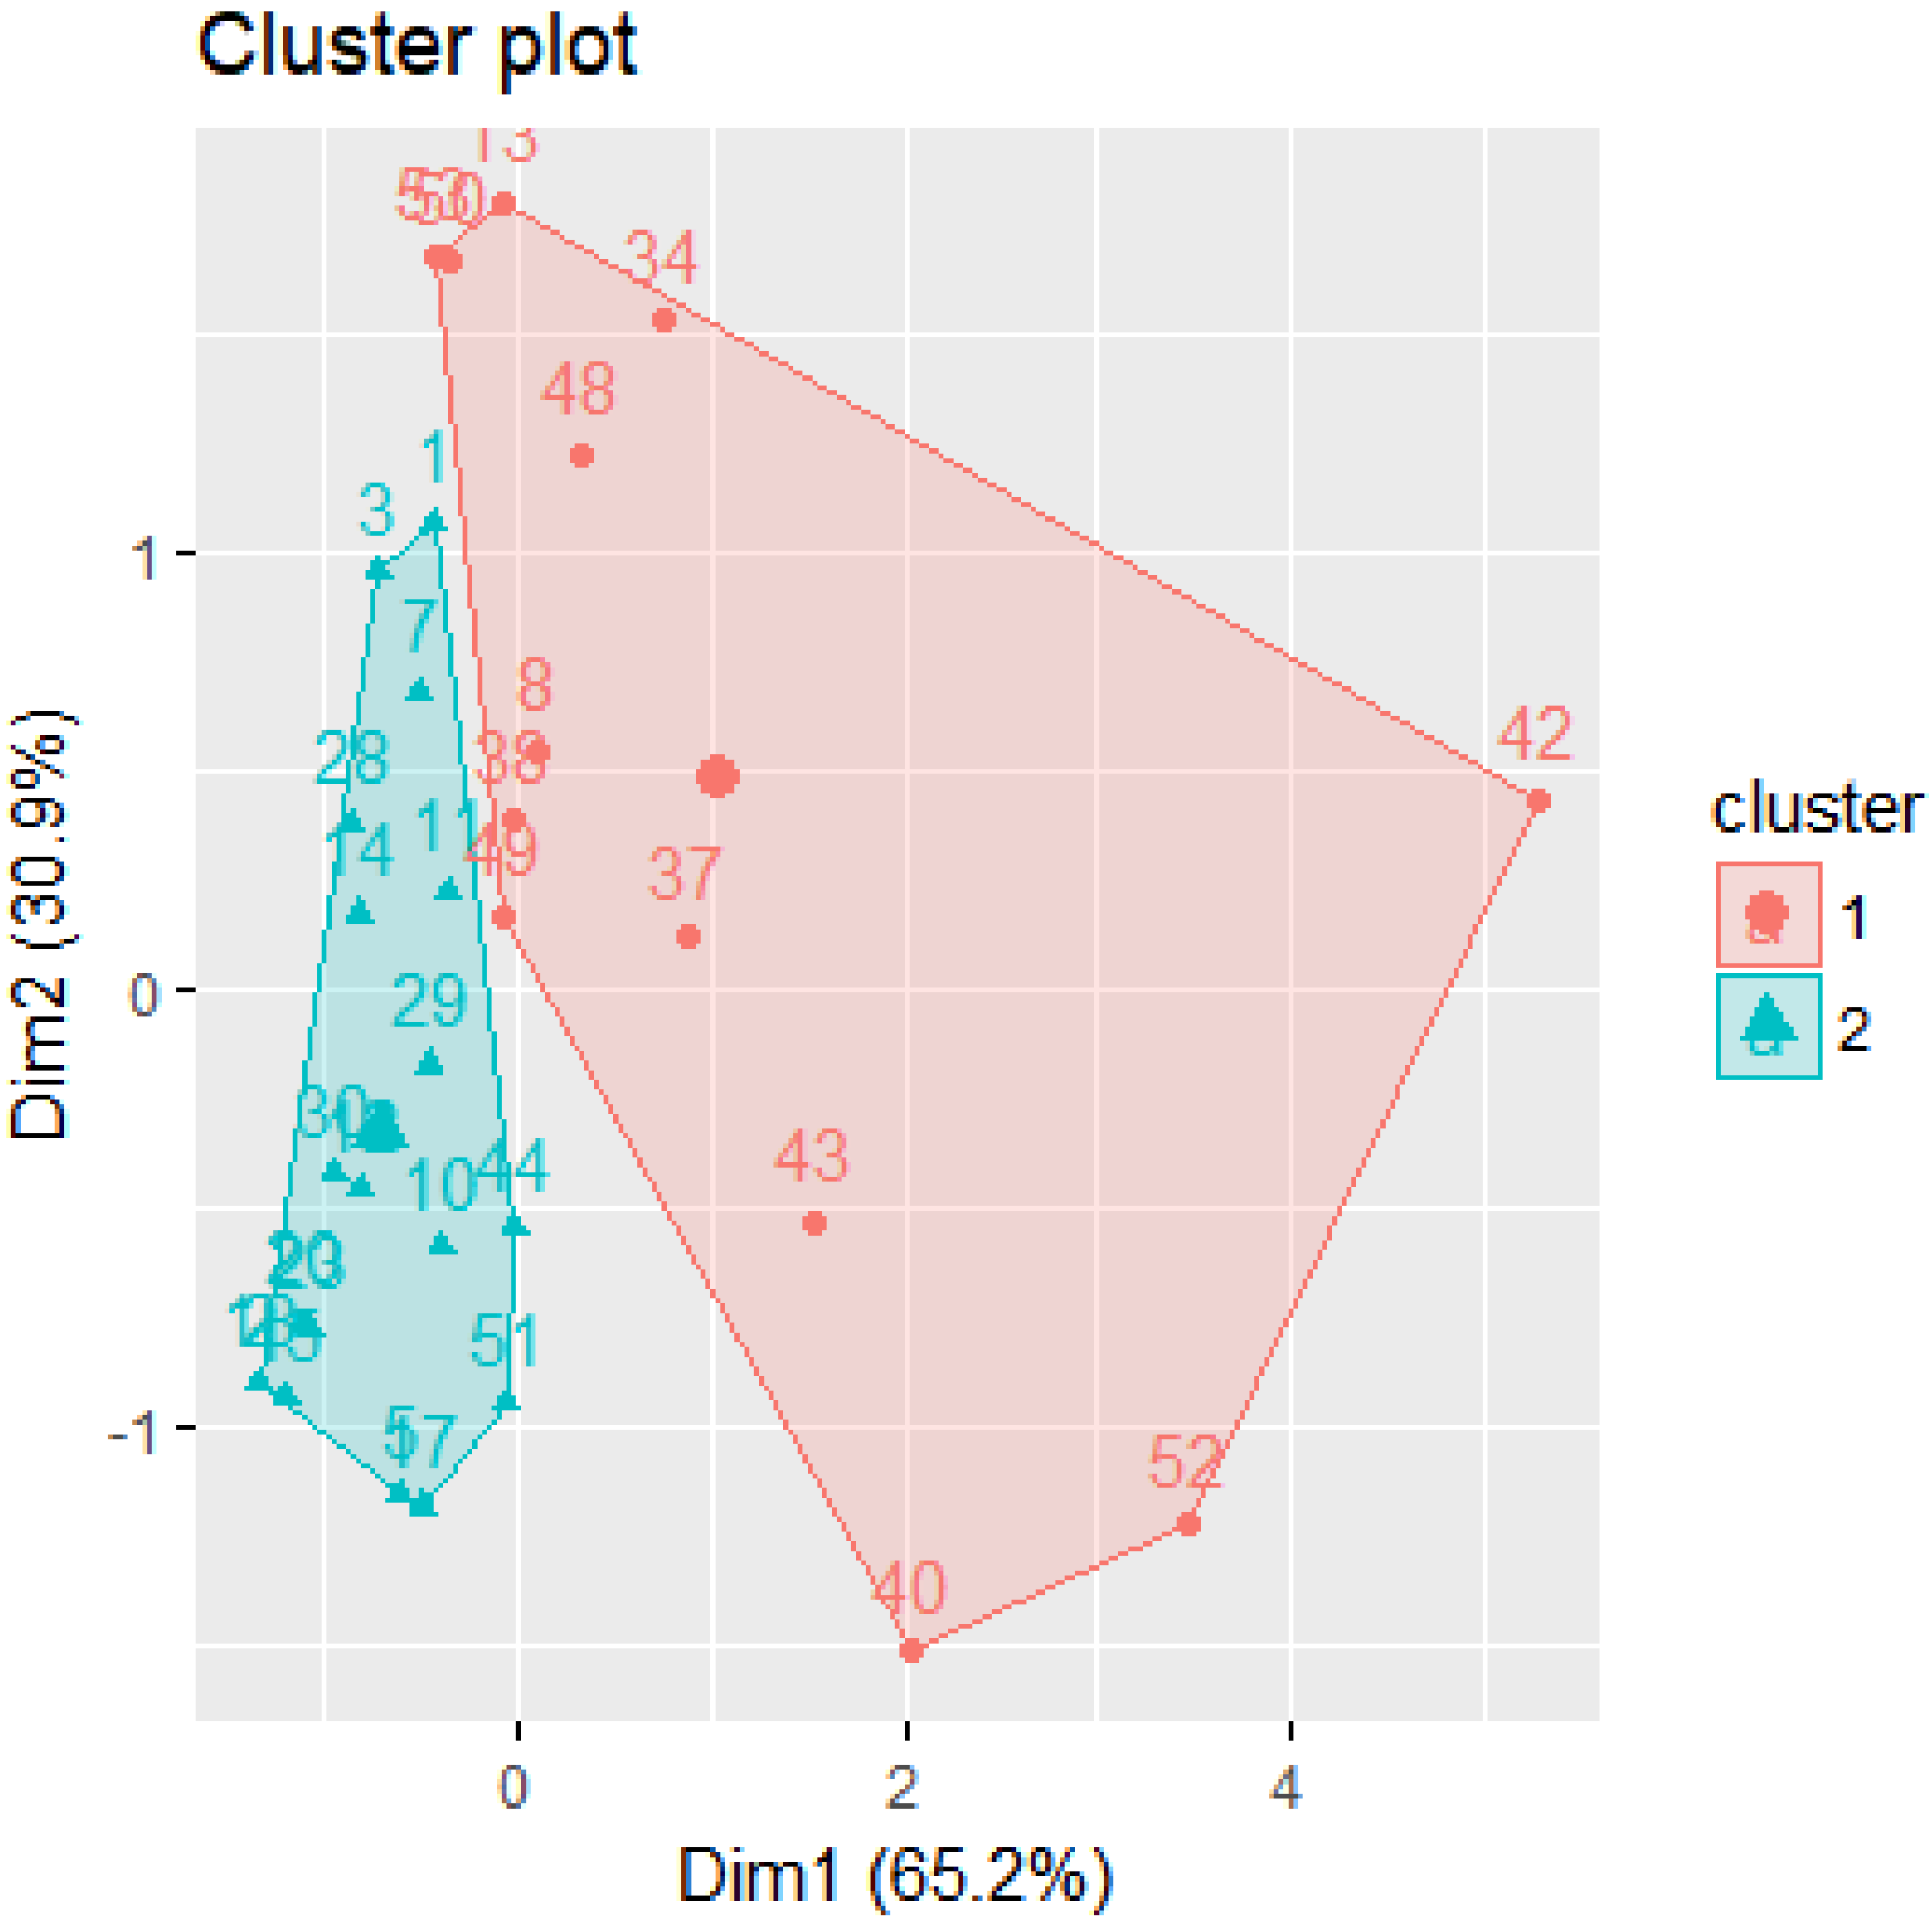
4.1. Clusters
- Cluster 1: 13 participants
- Cluster 2: 19 participants
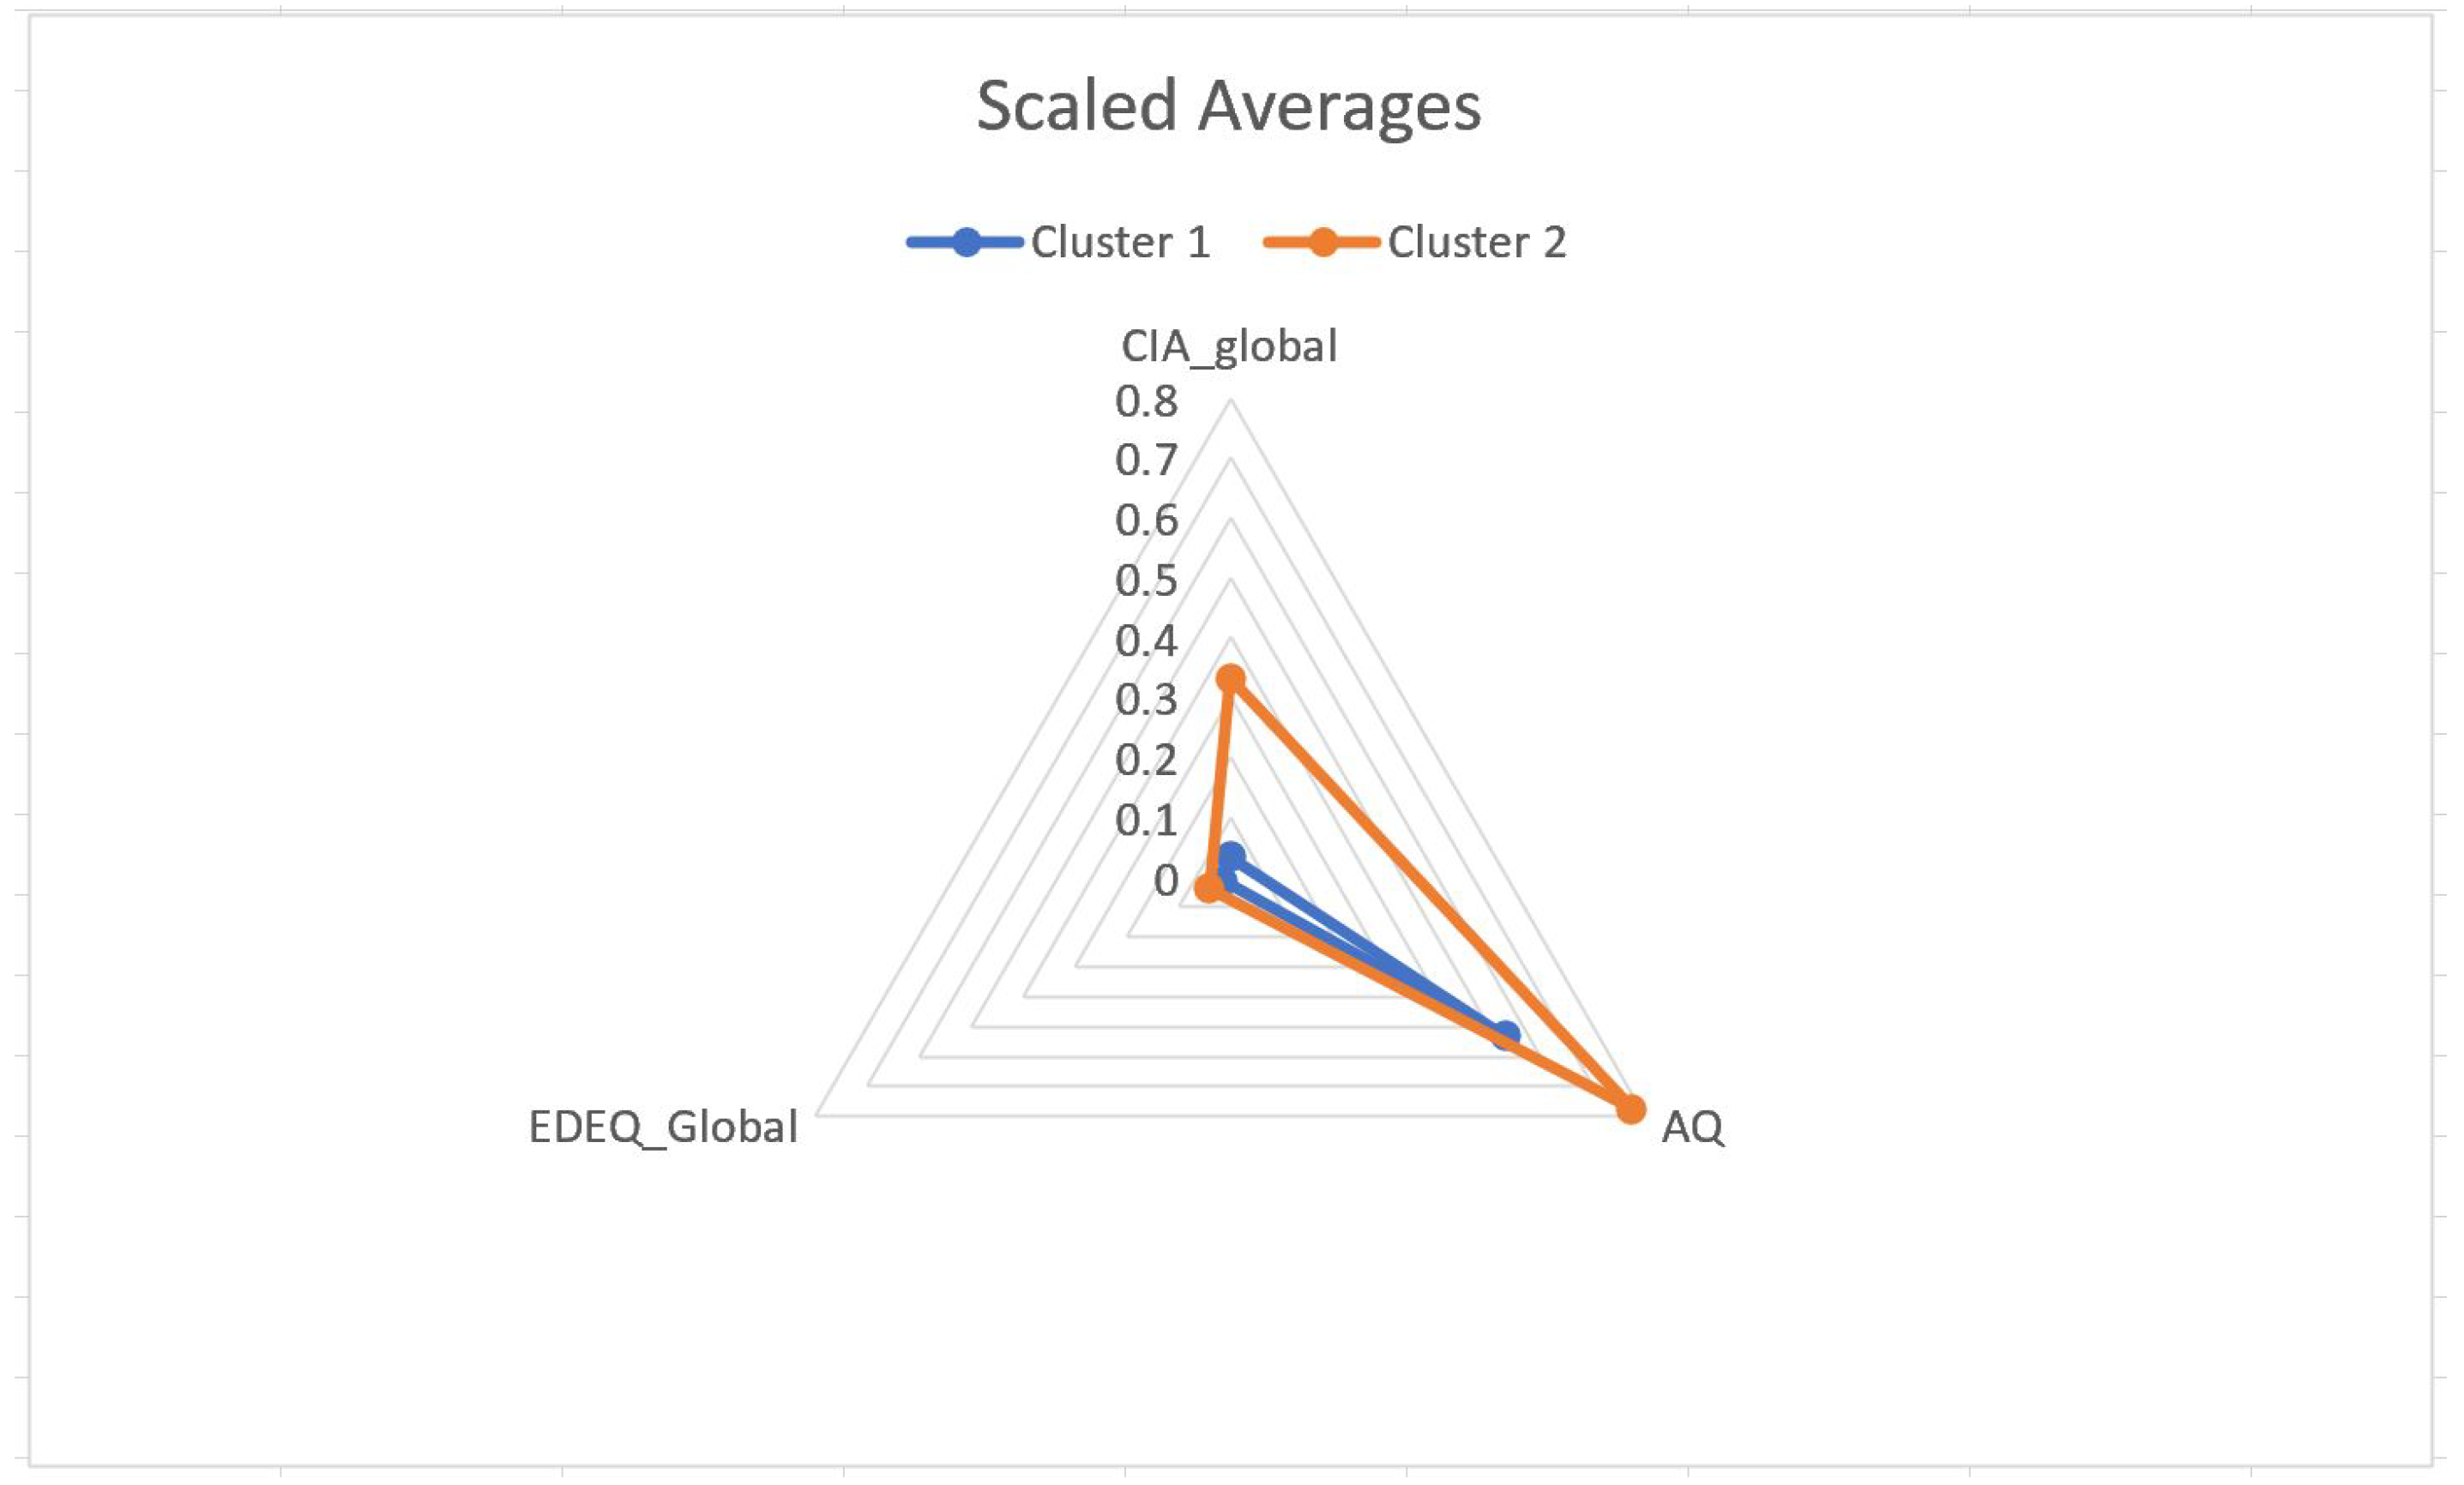
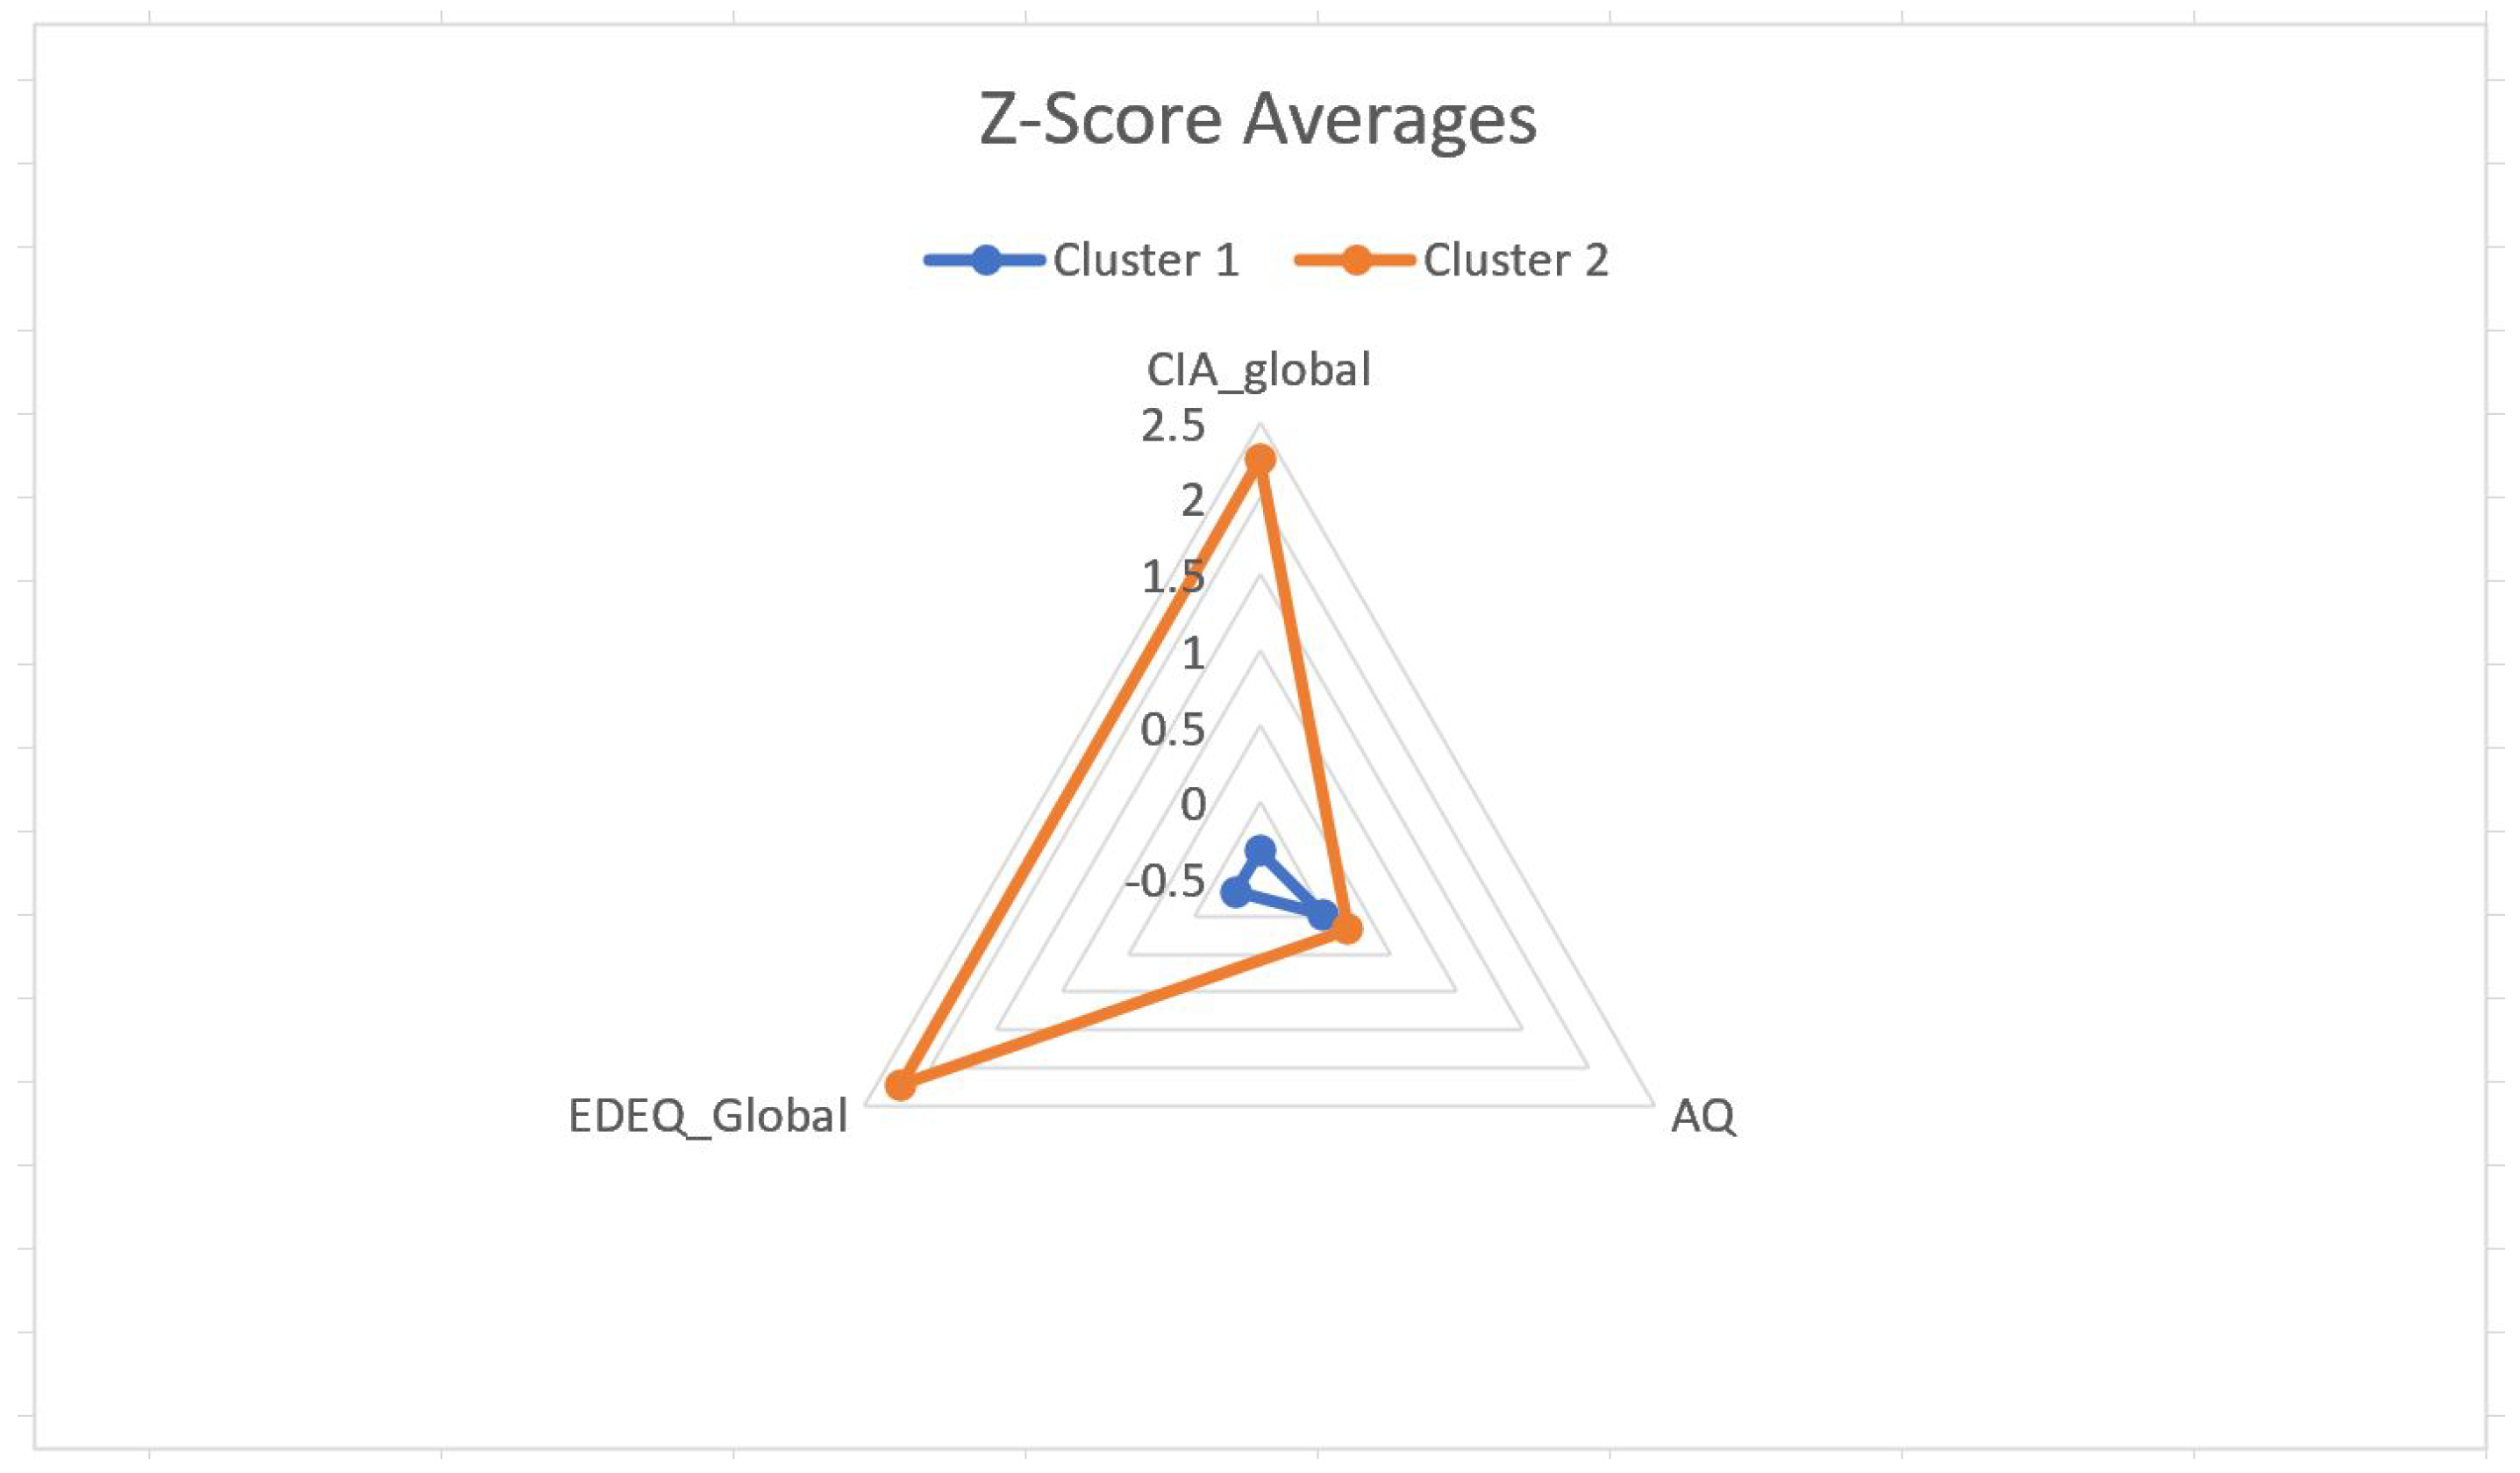
4.2. Radar Plots
5. Discussion
6. Conclusions
Author Contributions
Funding
Conflicts of Interest
Abbreviations
| AN | Anorexia Nervosa |
| AQ | Autism Quotient |
| ASD | Autism Spectrum Disorder |
| CIA | Clinical Impairment Assessment |
| DSM | Diagnostic and Statistical Manual of Mental Disorders |
| EDE-Q | Eating Disorder Examination Questionnaire |
| fMRI | functional Magnetic Resonance Imaging |
References
- American Psychiatric Association Publishing. Feeding and Eating Disorders: DSM-5® Selections; American Psychiatric Association Publishing: Washington, DC, USA, 2015. [Google Scholar]
- Sweitzer, M.M.; Watson, K.K.; Erwin, S.R.; Winecoff, A.A.; Datta, N.; Huettel, S.; Platt, M.L.; Zucker, N.L. Neurobiology of social reward valuation in adults with a history of anorexia nervosa. PLoS ONE 2018, 13, e0205085. [Google Scholar] [CrossRef] [PubMed]
- Merikangas, K.R.; He, J.P.; Burstein, M.; Swanson, S.A.; Avenevoli, S.; Cui, L.; Benjet, C.; Georgiades, K.; Swendsen, J. Lifetime prevalence of mental disorders in US adolescents: Results from the National Comorbidity Survey Replication–Adolescent Supplement (NCS-A). J. Am. Acad. Child Adolesc. Psychiatry 2010, 49, 980–989. [Google Scholar] [CrossRef] [PubMed]
- Hudson, J.I.; Hiripi, E.; Pope, H.G., Jr.; Kessler, R.C. The prevalence and correlates of eating disorders in the National Comorbidity Survey Replication. Biol. Psychiatry 2007, 61, 348–358. [Google Scholar] [CrossRef] [PubMed]
- Polivy, J.; Herman, C.P. Causes of Eating Disorders. Ann. Rev. Psychol. 2002, 53, 187–213. [Google Scholar] [CrossRef] [PubMed]
- Anderson, L.; Shaw, J.M.; McCargar, L. Physiological effects of bulimia nervosa on the gastrointestinal tract. Can. J. Gastroenterol. Hepatol. 1997, 11. [Google Scholar] [CrossRef] [PubMed]
- Nolen-Hoeksema, S. Abnormal Psychology; McGraw-Hill: New York, NY, USA, 2011. [Google Scholar]
- Crowther, J.H.; Armey, M.; Luce, K.H.; Dalton, G.R.; Leahey, T. The point prevalence of bulimic disorders from 1990 to 2004. Int. J. Eat. Disord. 2008, 41, 491–497. [Google Scholar] [CrossRef] [PubMed]
- Keel, P.K.; Heatherton, T.F.; Dorer, D.J.; Joiner, T.E.; Zalta, A.K. Point prevalence of bulimia nervosa in 1982, 1992, and 2002. Psychol. Med. 2006, 36, 119–127. [Google Scholar] [CrossRef][Green Version]
- Stevens, E.; Atchison, A.; Stevens, L.; Hong, E.; Granpeesheh, D.; Dixon, D.; Linstead, E. A cluster analysis of challenging behaviors in autism spectrum disorder. In Proceedings of the 2017 16th IEEE International Conference on Machine Learning and Applications (ICMLA), Cancun, Mexico, 18–21 December 2017; pp. 661–666. [Google Scholar]
- Stevens, E.; Dixon, D.R.; Novack, M.N.; Granpeesheh, D.; Smith, T.; Linstead, E. Identification and analysis of behavioral phenotypes in autism spectrum disorder via unsupervised machine learning. Int. J. Med Inform. 2019, 129, 29–36. [Google Scholar] [CrossRef]
- Guo, Y.; Wei, Z.; Keating, B.J.; Hakonarson, H. Machine learning derived risk prediction of anorexia nervosa. BMC Med. Genom. 2015, 9, 1–8. [Google Scholar] [CrossRef]
- Striegel-Moore, R.H.; Bulik, C.M. Risk factors for eating disorders. Am. Psychol. 2007, 62, 181. [Google Scholar] [CrossRef]
- O’Doherty, J.P. Reward representations and reward-related learning in the human brain: Insights from neuroimaging. Curr. Opin. Neurobiol. 2004, 14, 769–776. [Google Scholar] [CrossRef] [PubMed]
- Attia, E.; Walsh, B.T. Anorexia Nervosa. Am. J. Psychiatry 2007, 164, 1805–1810. [Google Scholar] [CrossRef] [PubMed]
- Brambilla, F.; Bellodi, L.; Arancio, C.; Ronchi, P.; Limonta, D. Central dopaminergic function in anorexia and bulimia nervosa: A psychoneuroendocrine approach. Psychoneuroendocrinology 2001, 26, 393–409. [Google Scholar] [CrossRef]
- Frank, G.K.; Kaye, W.H.; Weltzin, T.E.; Perel, J.; Moss, H.; McConaha, C.; Pollice, C. Altered response to meta-chlorophenylpiperazine in anorexia nervosa: Support for a persistent alteration of serotonin activity after short-term weight restoration. Int. J. Eat. Disord. 2001, 30, 57–68. [Google Scholar] [CrossRef] [PubMed]
- Frank, G.K.; Bailer, U.F.; Henry, S.E.; Drevets, W.; Meltzer, C.C.; Price, J.C.; Mathis, C.A.; Wagner, A.; Hoge, J.; Ziolko, S.; et al. Increased dopamine D2/D3 receptor binding after recovery from anorexia nervosa measured by positron emission tomography and [11c] raclopride. Biol. Psychiatry 2005, 58, 908–912. [Google Scholar] [CrossRef] [PubMed]
- Broft, A.; Slifstein, M.; Osborne, J.; Kothari, P.; Morim, S.; Shingleton, R.; Kenney, L.; Vallabhajosula, S.; Attia, E.; Martinez, D.; et al. Striatal dopamine type 2 receptor availability in anorexia nervosa. Psychiatry Res. Neuroimaging 2015, 233, 380–387. [Google Scholar] [CrossRef] [PubMed]
- Garner, D.M.; Garfinkel, P.E. Socio-cultural factors in the development of anorexia nervosa. Psychol. Med. 1980, 10, 647–656. [Google Scholar] [CrossRef]
- McCarthy, M. The thin ideal, depression and eating disorders in women. Behav. Res. Ther. 1990, 28, 205–214. [Google Scholar] [CrossRef]
- Sobal, J.; Stunkard, A.J. Socioeconomic status and obesity: A review of the literature. Psychol. Bull. 1989, 105, 260–275. [Google Scholar] [CrossRef]
- Wiseman, C.V.; Gray, J.J.; Mosimann, J.E.; Ahrens, A.H. Cultural expectations of thinness in women: An update. Int. J. Eat. Disord. 1992, 11, 85–89. [Google Scholar] [CrossRef]
- Sundgot-Borgen, J. Risk and trigger factors for the development of eating disorders in female elite athletes. Med. Sci. Sports Exerc. 1994, 26, 414–419. [Google Scholar] [CrossRef] [PubMed]
- Fairburn, C.G.; Norman, P.A.; Welch, S.L.; O’Connor, M.E.; Doll, H.A.; Peveler, R.C. A prospective study of outcome in bulimia nervosa and the long-term effects of three psychological treatments. Arch. Gen. Psychiatry 1995, 52, 304–312. [Google Scholar] [CrossRef] [PubMed]
- Stice, E. Risk and maintenance factors for eating pathology: A meta-analytic review. Psychol. Bull. 2002, 128, 825. [Google Scholar] [CrossRef]
- Clark, D.M.; Fairburn, C.G.; Jones, J.V. The Science and Practice of Cognitive Behaviour Therapy; Springer: Berlin/Heidelberg, Germany, 1997. [Google Scholar]
- Striegel-Moore, R.H.; Silberstein, L.R.; Rodin, J. The social self in bulimia nervosa: Public self-consciousness, social anxiety, and perceived fraudulence. J. Abnorm. Psychol. 1993, 102, 297. [Google Scholar] [CrossRef] [PubMed]
- Wade, T.D.; Tiggemann, M.; Bulik, C.M.; Fairburn, C.G.; Wray, N.R.; Martin, N.G. Shared temperament risk factors for anorexia nervosa: A twin study. Psychosom. Med. 2008, 70, 239–244. [Google Scholar] [CrossRef] [PubMed]
- Stice, E.; Shaw, H.E. Adverse effects of the media portrayed thin-ideal on women and linkages to bulimic symptomatology. J. Soc. Clin. Psychol. 1994, 13, 288–308. [Google Scholar] [CrossRef]
- Mazzeo, S.E.; Trace, S.E.; Mitchell, K.S.; Gow, R.W. Effects of a reality TV cosmetic surgery makeover program on eating disordered attitudes and behaviors. Eat. Behav. 2007, 8, 390–397. [Google Scholar] [CrossRef]
- Stice, E.; Maxfield, J.; Wells, T. Adverse effects of social pressure to be thin on young women: An experimental investigation of the effects of “fat talk”. Int. J. Eat. Disord. 2003, 34, 108–117. [Google Scholar] [CrossRef]
- Astorino, A.; Berti, R.; Astorino, A.; Bitonti, V.; De Marco, M.; Feraco, V.; Palumbo, A.; Porti, F.; Zannino, I. Early Detection of Eating Disorders Through Machine Learning Techniques. In Proceedings of the International Conference on Learning and Intelligent Optimization, Athens, Greece, 24–28 May 2020; Springer: Berlin/Heidelberg, Germany, 2020; pp. 33–39. [Google Scholar]
- Paul, S.; Jandhyala, S.K.; Basu, T. Early Detection of Signs of Anorexia and Depression Over Social Media using Effective Machine Learning Frameworks. In CLEF (Working Notes); Ramakrishna Mission Vivekananda Educational and Research Institute: Tamil Nadu, India, 2018. [Google Scholar]
- Ramírez-Cifuentes, D.; Mayans, M.; Freire, A. Early risk detection of anorexia on social media. In Proceedings of the International Conference on Internet Science, St. Petersburg, Russia, 24–26 October 2018; Springer: Berlin/Heidelberg, Germany, 2018; pp. 3–14. [Google Scholar]
- Túry, F.; Güleç, H.; Kohls, E. Assessment methods for eating disorders and body image disorders. J. Psychosom. Res. 2010, 69, 601–611. [Google Scholar] [CrossRef]
- Wilson, G.T. Assessment of Binge Eating; Guilford Press: New York, NY, USA, 1993. [Google Scholar]
- Luce, K.H.; Crowther, J.H. The reliability of the eating disorder examination—Self-report questionnaire version (EDE-Q). Int. J. Eat. Disord. 1999, 25, 349–351. [Google Scholar] [CrossRef]
- Vandereycken, W. Denial of illness in anorexia nervosa—A conceptual review: Part 1 diagnostic significance and assessment. Eur. Eat. Disord. Rev. Prof. J. Eat. Disord. Assoc. 2006, 14, 341–351. [Google Scholar] [CrossRef]
- Garner, D.M.; Garfinkel, P.E. The Eating Attitudes Test: An index of the symptoms of anorexia nervosa. Psychol. Med. 1979, 9, 273–279. [Google Scholar] [CrossRef] [PubMed]
- Thelen, M.H.; Farmer, J.; Wonderlich, S.; Smith, M. A revision of the Bulimia Test: The BULIT—R. Psychol. Assess. A J. Consult. Clin. Psychol. 1991, 3, 119. [Google Scholar] [CrossRef]
- Bohn, K.; Fairburn, C.G. The clinical impairment assessment questionnaire (CIA). Cogn. Behav. Ther. Eat. Disord. 2008, 315–317. [Google Scholar]
- Peterson, C.B.; Crosby, R.D.; Wonderlich, S.A.; Joiner, T.; Crow, S.J.; Mitchell, J.E.; Bardone-Cone, A.M.; Klein, M.; Le Grange, D. Psychometric properties of the eating disorder examination-questionnaire: Factor structure and internal consistency. Int. J. Eat. Disord. 2007, 40, 386–389. [Google Scholar] [CrossRef] [PubMed]
- Engel, S.G.; Wittrock, D.A.; Crosby, R.D.; Wonderlich, S.A.; Mitchell, J.E.; Kolotkin, R.L. Development and psychometric validation of an eating disorder-specific health-related quality of life instrument. Int. J. Eat. Disord. 2006, 39, 62–71. [Google Scholar] [CrossRef] [PubMed]
- Adair, C.E.; Marcoux, G.C.; Cram, B.S.; Ewashen, C.J.; Chafe, J.; Cassin, S.E.; Pinzon, J.; Gusella, J.L.; Geller, J.; Scattolon, Y.; et al. Development and multi-site validation of a new condition-specific quality of life measure for eating disorders. Health Qual. Life Outcomes 2007, 5, 23. [Google Scholar] [CrossRef]
- Fairburn, C.G.; Cooper, Z.; Doll, H.A.; Norman, P.; O’Connor, M. The natural course of bulimia nervosa and binge eating disorder in young women. Arch. Gen. Psychiatry 2000, 57, 659–665. [Google Scholar] [CrossRef]
- Keel, P.K.; Mitchell, J.E.; Miller, K.B.; Davis, T.L.; Crow, S.J. Long-term outcome of bulimia nervosa. Arch. Gen. Psychiatry 1999, 56, 63–69. [Google Scholar] [CrossRef]
- Anderluh, M.; Tchanturia, K.; Rabe-Hesketh, S.; Collier, D.; Treasure, J. Lifetime course of eating disorders: Design and validity testing of a new strategy to define the eating disorders phenotype. Psychol. Med. 2009, 39, 105–114. [Google Scholar] [CrossRef]
- Grira, N.; Crucianu, M.; Boujemaa, N. Unsupervised and semi-supervised clustering: A brief survey. Rev. Mach. Learn. Tech. Process. Multimed. Content 2004, 1, 9–16. [Google Scholar]
- Usama, M.; Qadir, J.; Raza, A.; Arif, H.; Yau, K.L.A.; Elkhatib, Y.; Hussain, A.; Al-Fuqaha, A. Unsupervised machine learning for networking: Techniques, applications and research challenges. IEEE Access 2019, 7, 65579–65615. [Google Scholar] [CrossRef]
- McGregor, A.; Hall, M.; Lorier, P.; Brunskill, J. Flow Clustering Using Machine Learning Techniques; Springer: Berlin/Heidelberg, Germany, 2004; pp. 205–214. [Google Scholar]
- Xu, R.; Wunsch, D. Survey of clustering algorithms. IEEE Trans. Neural Netw. 2005, 16, 645–678. [Google Scholar] [CrossRef] [PubMed]
- Fichter, M.M.; Elton, M.; Engel, K.; Meyer, A.E.; Mall, H.; Poustka, F. Structured Interview for Anorexia and Bulimia Nervosa (SIAB): Development of a new instrument for the assessment of eating disorders. Int. J. Eat. Disord. 1991, 10, 571–592. [Google Scholar] [CrossRef]
- Fairburn, C.G. Cognitive Behavior Therapy and Eating Disorders; Guilford Press: New York, NY, USA, 2008. [Google Scholar]
- Dahlgren, C.L.; Stedal, K.; Rø, Ø. Eating Disorder Examination Questionnaire (EDE-Q) and Clinical Impairment Assessment (CIA): Clinical norms and functional impairment in male and female adults with eating disorders. Nord. J. Psychiatry 2017, 71, 256–261. [Google Scholar] [CrossRef] [PubMed]
- Welch, E.; Birgegård, A.; Parling, T.; Ghaderi, A. Eating disorder examination questionnaire and clinical impairment assessment questionnaire: General population and clinical norms for young adult women in Sweden. Behav. Res. Ther. 2011, 49, 85–91. [Google Scholar] [CrossRef] [PubMed]
- Fairburn, C.G.; Beglin, S.J. Assessment of eating disorders: Interview or self-report questionnaire? Int. J. Eat. Disord. 1994, 16, 363–370. [Google Scholar]
- Mond, J.; Hay, P.; Rodgers, B.; Owen, C.; Beumont, P. Validity of the Eating Disorder Examination Questionnaire (EDE-Q) in screening for eating disorders in community samples. Behav. Res. Ther. 2004, 42, 551–567. [Google Scholar] [CrossRef]
- Bohn, K.; Doll, H.A.; Cooper, Z.; O’Connor, M.; Palmer, R.L.; Fairburn, C.G. The measurement of impairment due to eating disorder psychopathology. Behav. Res. Ther. 2008, 46, 1105–1110. [Google Scholar] [CrossRef]
- Baron-Cohen, S.; Wheelwright, S.; Skinner, R.; Martin, J.; Clubley, E. The autism-spectrum quotient (AQ): Evidence from asperger syndrome/high-functioning autism, malesand females, scientists and mathematicians. J. Autism Dev. Disord. 2001, 31, 5–17. [Google Scholar] [CrossRef]
- Baron-Cohen, S.; Hoekstra, R.A.; Knickmeyer, R.; Wheelwright, S. The autism-spectrum quotient (AQ)—Adolescent version. J. Autism Dev. Disord. 2006, 36, 343. [Google Scholar] [CrossRef] [PubMed]
- MacQueen, J. Some methods for classification and analysis of multivariate observations. In Proceedings of the Fifth Berkeley Symposium on Mathematical Statistics and Probability, Oakland, CA, USA, 1 January 1967; Volume 1, pp. 281–297. [Google Scholar]
- Rousseeuw, P. Silhouettes: A Graphical Aid to the Interpretation and Validation of Cluster Analysis. J. Comput. Appl. Math. 1987, 20. [Google Scholar] [CrossRef]
- Baarsch, J.; Celebi, M.E. Investigation of internal validity measures for K-means clustering. In Proceedings of the International Multiconference of Engineers and Computer Scientists, Hong Kong, China, 14–16 March 2012; Volume 1, pp. 14–16. [Google Scholar]


| No. | Group | Cluster | CIA | AQ | EDEQ |
|---|---|---|---|---|---|
| 1 | control | 1 | 0.04 | 0.81 | 0.01 |
| 2 | control | 1 | 0.00 | 0.38 | 0.00 |
| 3 | control | 1 | 0.00 | 0.77 | 0.00 |
| 5 | control | 1 | 0.04 | 0.38 | 0.03 |
| 7 | control | 1 | 0.04 | 0.73 | 0.01 |
| 8 | control | 2 | 0.23 | 0.73 | 0.01 |
| 10 | control | 1 | 0.08 | 0.50 | 0.02 |
| 11 | control | 1 | 0.08 | 0.65 | 0.02 |
| 12 | control | 1 | 0.04 | 0.50 | 0.1 |
| 13 | control | 2 | 0.12 | 0.96 | 0.01 |
| Truth | ||||
|---|---|---|---|---|
| Cluster 1 | Cluster 2 | Total | ||
| Predicted | Cluster 1 | 11 | 5 | 16 |
| Cluster 2 | 2 | 14 | 16 | |
| Total | 13 | 19 | 32 | |
© 2020 by the authors. Licensee MDPI, Basel, Switzerland. This article is an open access article distributed under the terms and conditions of the Creative Commons Attribution (CC BY) license (http://creativecommons.org/licenses/by/4.0/).
Share and Cite
Stewart Rosenfield, N.; Linstead, E. Exploring the Eating Disorder Examination Questionnaire, Clinical Impairment Assessment, and Autism Quotient to Identify Eating Disorder Vulnerability: A Cluster Analysis. Mach. Learn. Knowl. Extr. 2020, 2, 347-360. https://doi.org/10.3390/make2030019
Stewart Rosenfield N, Linstead E. Exploring the Eating Disorder Examination Questionnaire, Clinical Impairment Assessment, and Autism Quotient to Identify Eating Disorder Vulnerability: A Cluster Analysis. Machine Learning and Knowledge Extraction. 2020; 2(3):347-360. https://doi.org/10.3390/make2030019
Chicago/Turabian StyleStewart Rosenfield, Natalia, and Erik Linstead. 2020. "Exploring the Eating Disorder Examination Questionnaire, Clinical Impairment Assessment, and Autism Quotient to Identify Eating Disorder Vulnerability: A Cluster Analysis" Machine Learning and Knowledge Extraction 2, no. 3: 347-360. https://doi.org/10.3390/make2030019
APA StyleStewart Rosenfield, N., & Linstead, E. (2020). Exploring the Eating Disorder Examination Questionnaire, Clinical Impairment Assessment, and Autism Quotient to Identify Eating Disorder Vulnerability: A Cluster Analysis. Machine Learning and Knowledge Extraction, 2(3), 347-360. https://doi.org/10.3390/make2030019