1. Introduction
The Louisiana Department of Wildlife and Fisheries (LDWF, Baton Rouge, LA, USA) manages recreational and commercial fishing in the inland and coastal waters of Louisiana. One of the most important species fished in these waters is the eastern oyster,
Crassostrea virginica. From 1997 to 2012, Louisiana accounted for an average of 34% of the nation’s oyster landings, as well as 55% of all oysters landed among the Gulf Coast states in 2012 [
1]. Over 700 permits are issued each year, giving vessels access to state oyster grounds, which total 1.6 million acres. In 2012, vessels fishing in Louisiana’s public oyster grounds were required by law to have a satellite communications system—a Vessel Monitoring System (VMS)—installed to monitor vessel activity in public grounds [
2]. The monitors periodically record vessel latitude and longitude at a given timestamp. While the modules allowed the LDWF to monitor vessel locations in public waters, they do not specify which behavior (docked/anchored, poling, fishing, or traveling) the vessel is performing at the time of the ping.
Several attempts have been made to use VMS data to understand fishing vessel behavior, for example by using speed as a single criterion [
3,
4,
5]. Conversely, Gallegos [
6] predicted the behavior of a vessel by running comparisons of speed versus net speed of a vessel through if-then-else conditions or rule-based classification. Vessel instantaneous speed provides information on how quickly the vessel is moving and net speed (calculated over certain time interval) provides the average speed of the vessel at particular time. However, Gallegos’ approach could not account for every ping. About, 12% of the points from the 2012–2013 fishing season and about seven percent of points from the 2013–2014 fishing season fell into uncertain ranges, which were designated as “unknown behavior”.
The rule-based classifier suffers from the problem of not being able to classify significant amount of points in the dataset. Thus, the purpose of this project was to automate the oyster vessel behavior determination task and to produce a robust classifier that would accurately predict vessel behavior from position-at-time data transmitted from the on-board VMS modules. The advantage of developing a machine learning based model is that it suggests a most likely category for the given samples instead of not being able to classify them. Additionally, an automated system to determine fishing effort can overcome more error prone methods, such as physical logging by the captain of a fishing vessel. By having accurate measurements of fishing effort, the LDWF will be better prepared to manage oysters and their habitat. For example, knowing what reefs are most frequently fished would allow the LDWF to close the grounds to fishing vessels, or add oyster cultch (substrate) to restore oyster reef habitat.
Machine learning (ML) [
7,
8,
9] is a computing technology which recognizes the pattern in the training data and applies the knowledge it learned from the training data to effectively make prediction on test data. ML models find effective class decision boundaries from the data without being explicitly programmed where to look. In addition, ML is popularized due to its ability to devise complex models and algorithms by mining the patterns and features within the data. This is unlike the rule-based classifier; where rule-based classifiers use a deterministic approach to exhaustively map each data-point via if-then-else conditions.
In this work, we propose a machine learning based automated approach that applies SVM with RBF kernel to determine the behavior of the oyster vessel from its trajectory data (see
supplementary materials for code and data). The trajectory data is segmented into paths based on the speed at points calculated from the vessel ID, latitude, longitude and timestamp. Subsequently, net speed of each point in the path is obtained using a sliding window of ten points. Thus, each sample point is encoded with two features, speed and net speed, and used to learn the SVM classifier. The developed multi-classification model achieves a 10-fold CV accuracy of 99.99% in classifying the points into one of four different classes: fishing, traveling, poling and docked. Furthermore, the other major contribution of this work is the collection of the oyster vessel trajectory data and development of effective features that can improve the accuracy of the ML-based methods. Collection of the oyster vessel trajectory data was a collaborative effort between Louisiana Department of Wildlife and Fisheries and Canizaro/Livingston Gulf States Center for Environmental Informatics (GulfSCEI, New Orleans, LA, USA). Initially, the data was received from LDWF in an excel format which was the result of a database export. The dataset that we collected and utilized during this project is made publically available and can be accessed from the link in the supplementary material.
To establish a machine learning based oyster vessel behavior determination predictor, we aligned the outline of our paper as follows: (i) the research closely related to this article is discussed in
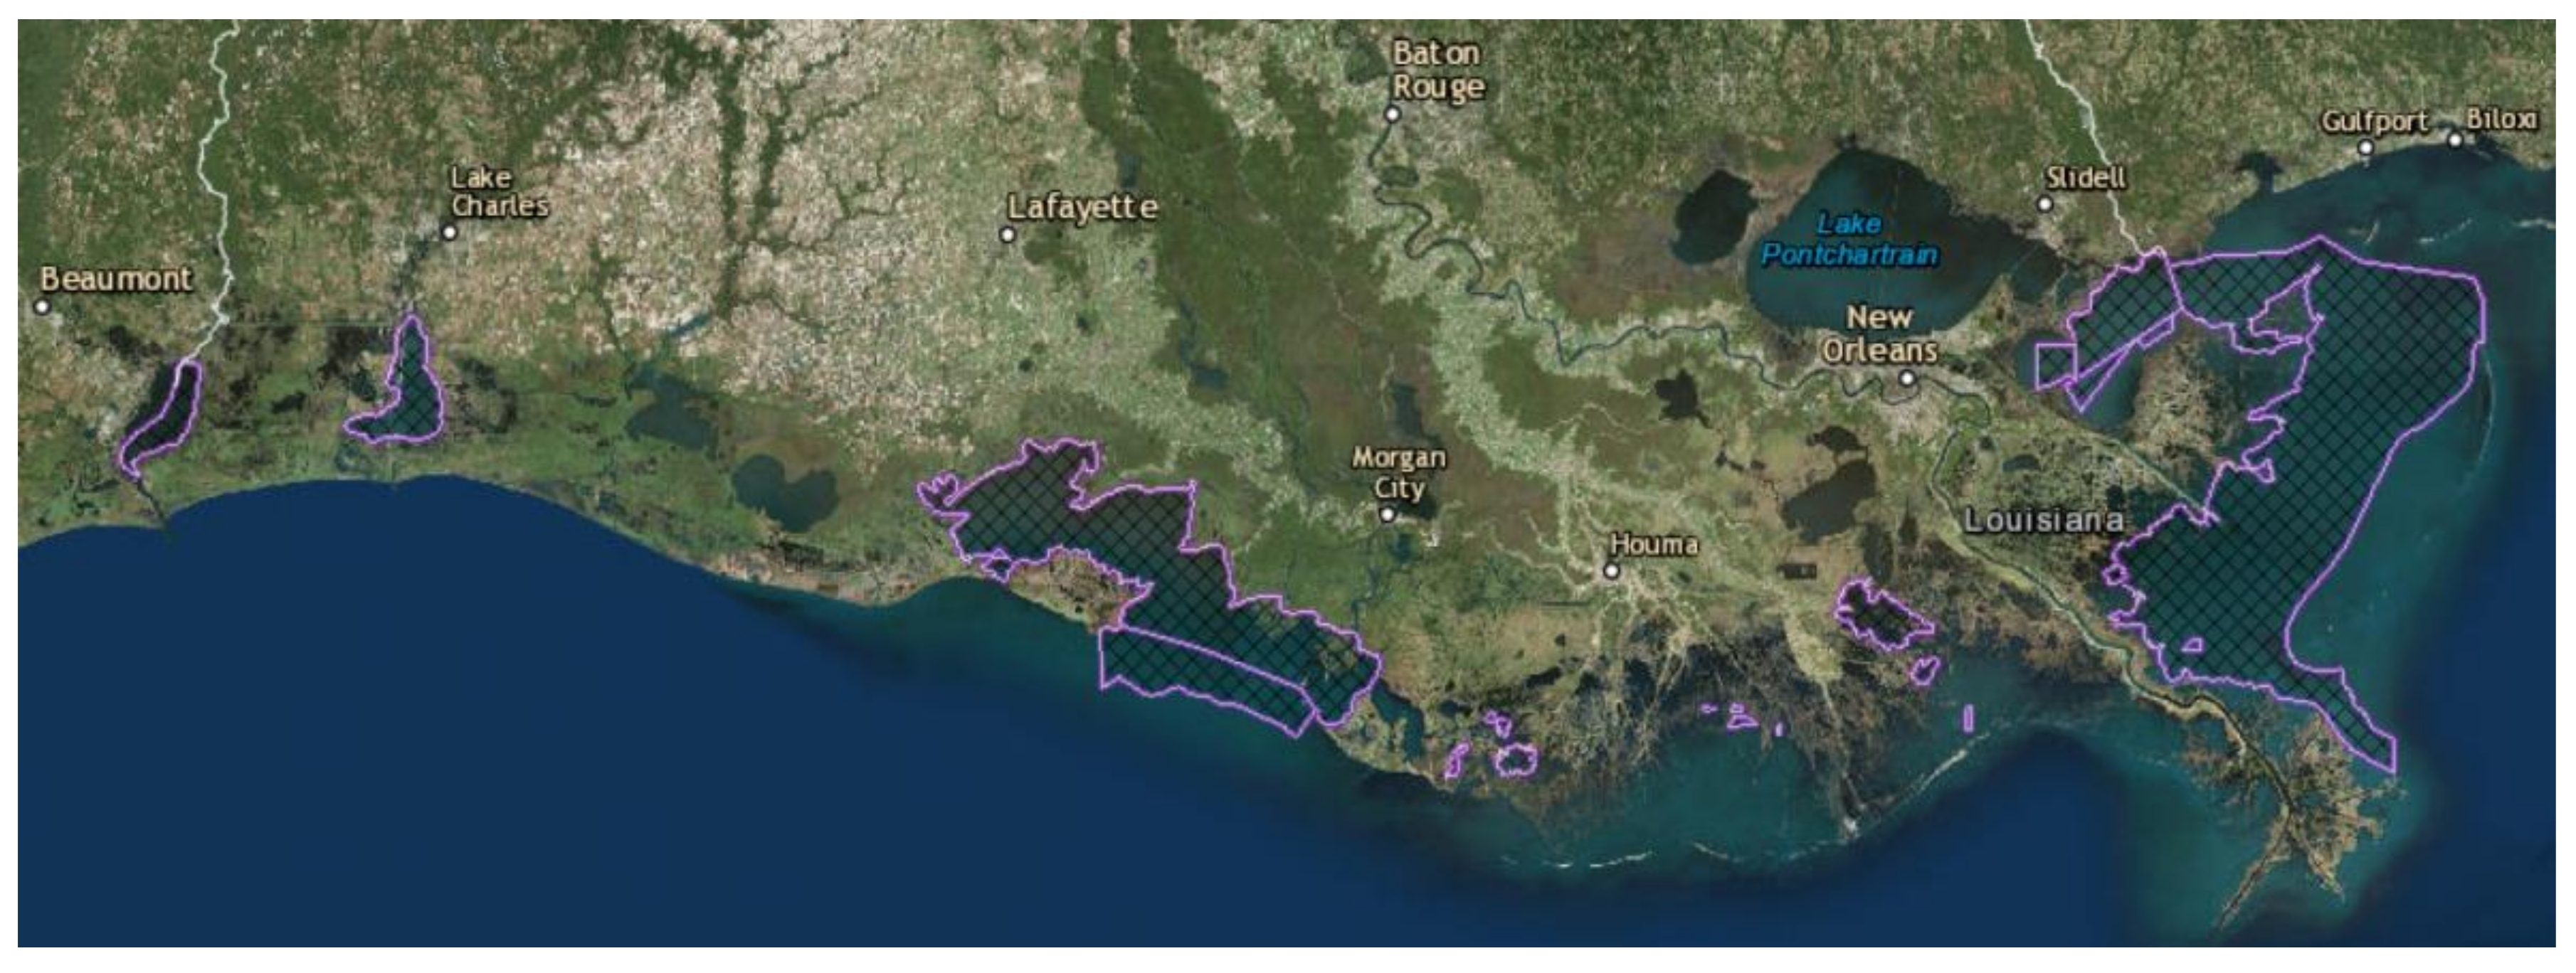
Section 2, (ii) geographical study area and the statistics of the dataset used in this article are discussed in
Section 3, (iii) the details of the steps involving data segmentation, input feature collection, dataset labelling, machine learning model design and optimization and model evaluation are present in
Section 4, (iv) the experimental results supporting the robustness of the proposed method is present in
Section 5 and (v) finally,
Section 6 discusses and concludes the proposed work.
4. Materials and Methods
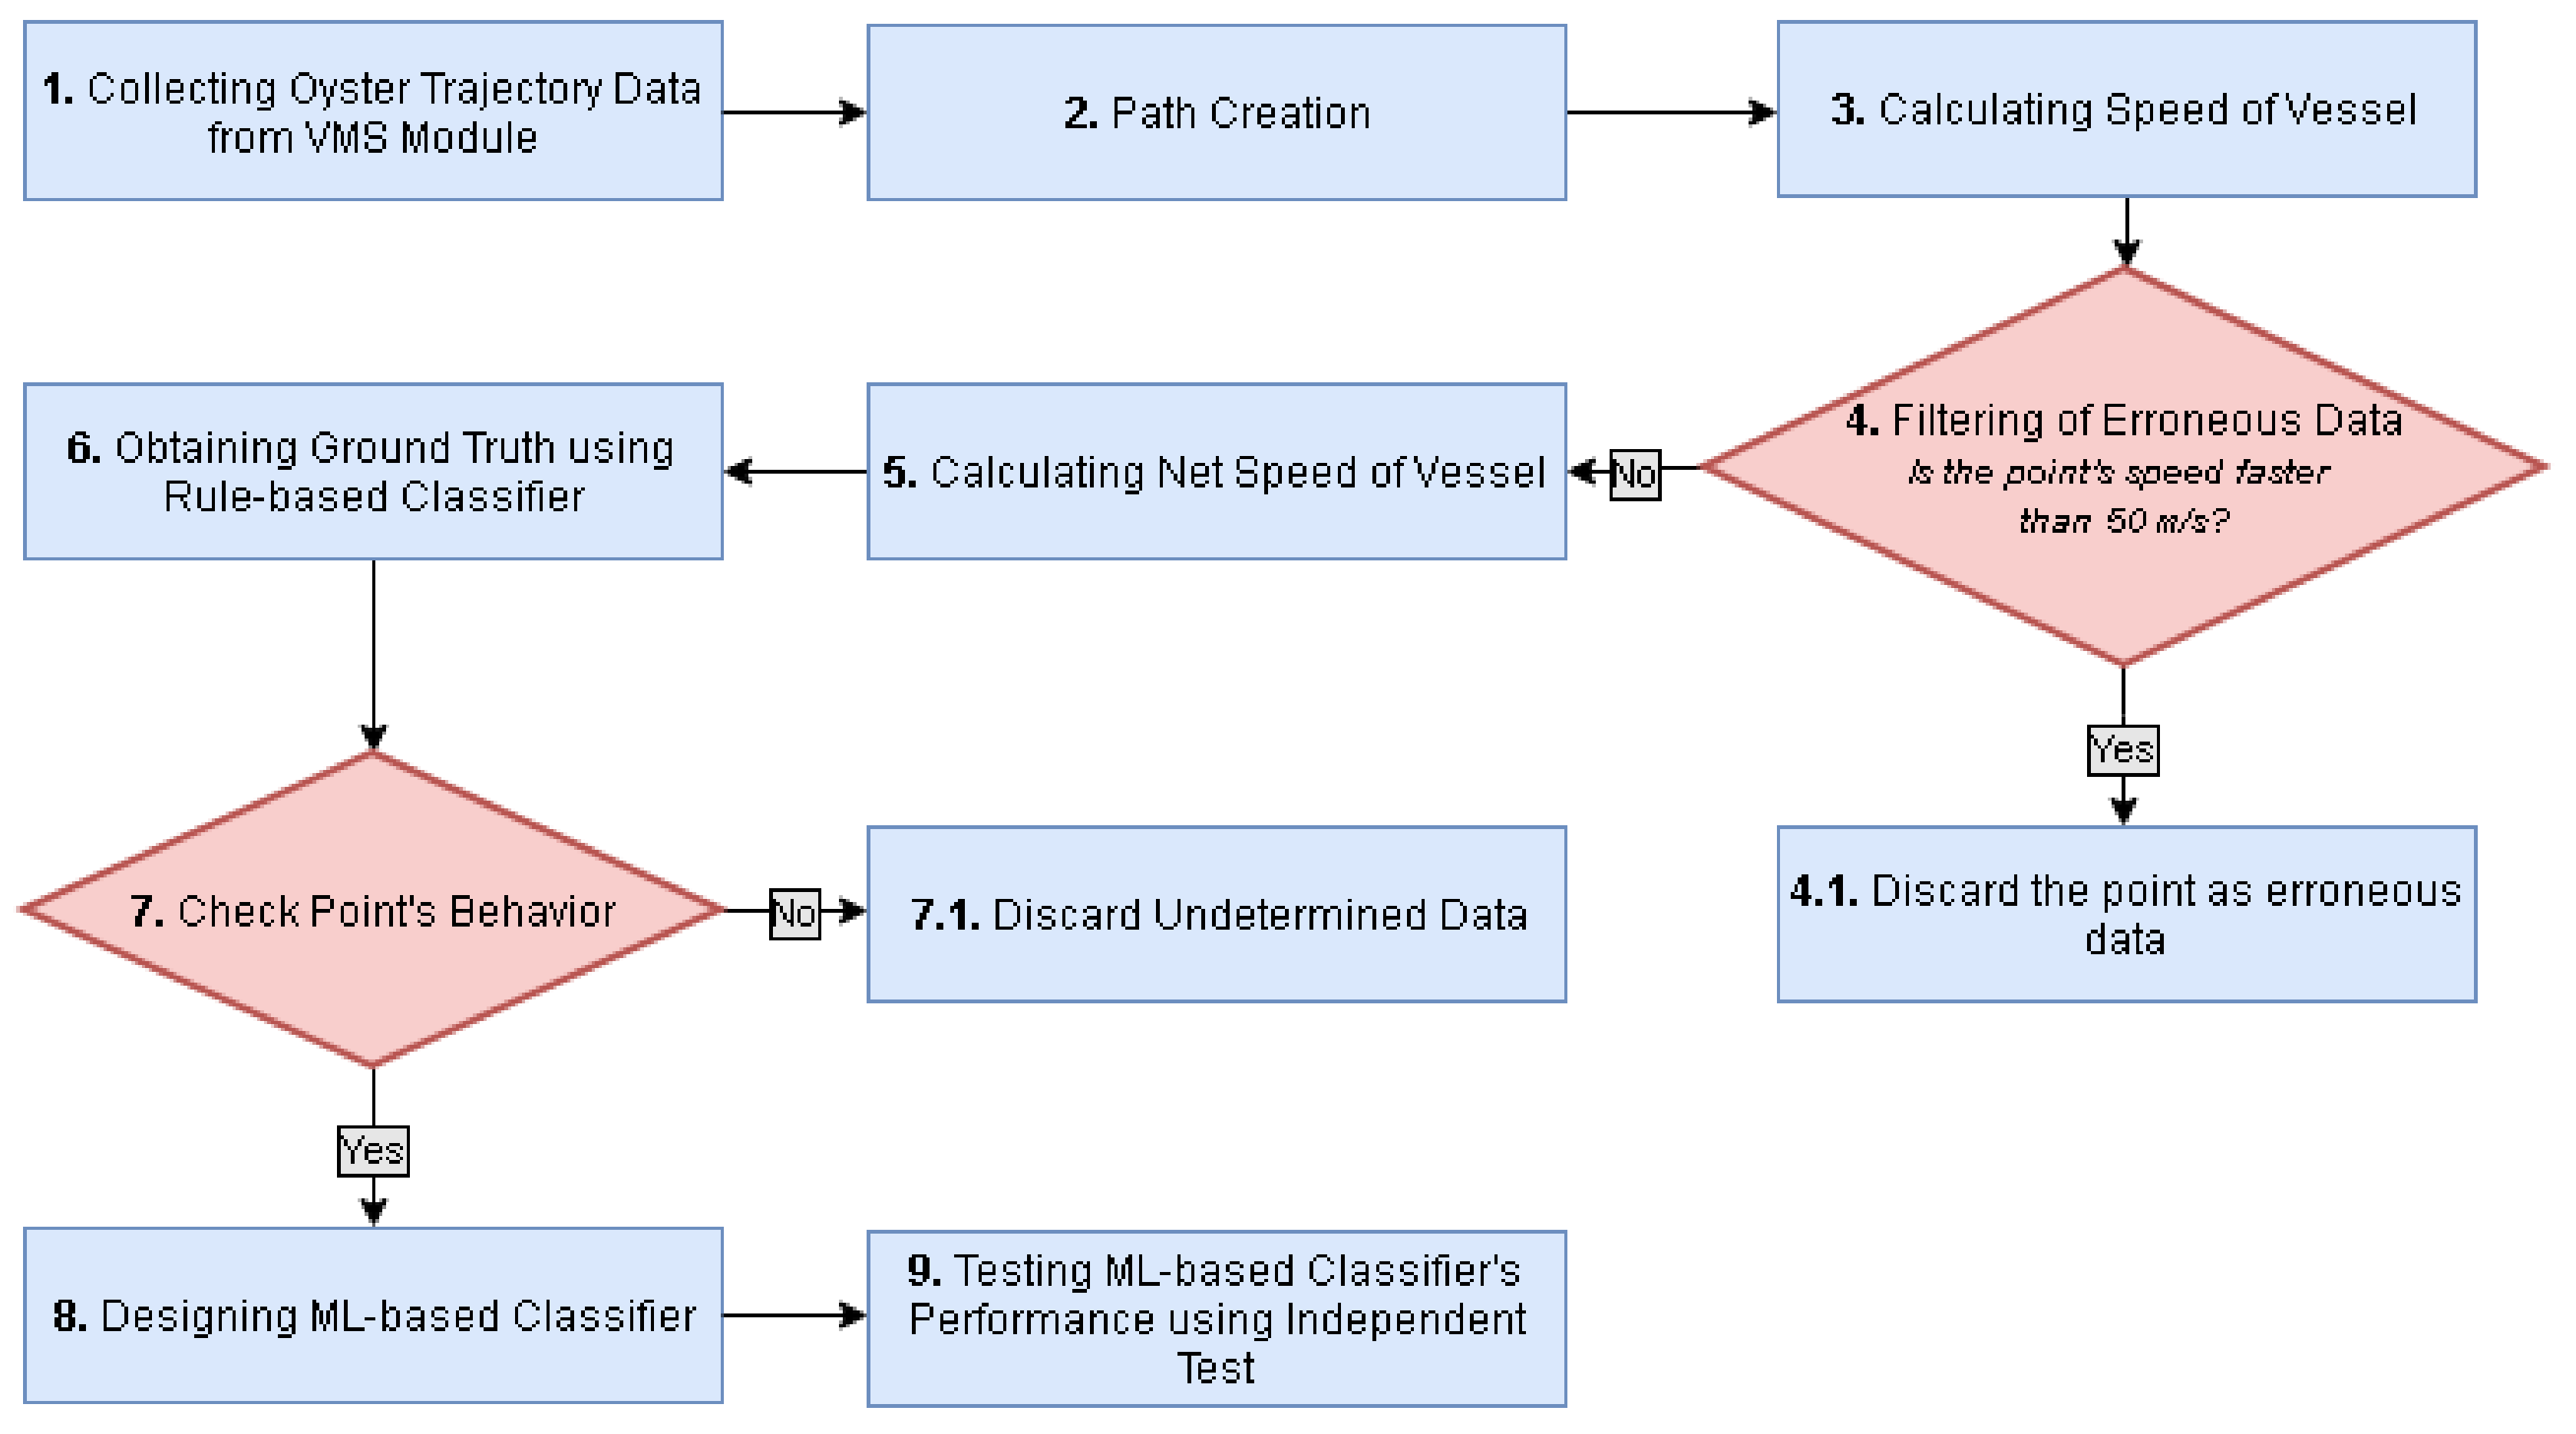
A flow-chart of our approach to develop a machine learning method to determine oyster vessel behavior is shown in
Figure 2. In the following sections, we describe the individual steps outlined in the flow-chart.
Step 1. Collecting Oyster Trajectory Data from VMS Module: We collected oyster vessel trajectory data from the VMS module installed in all the vessels fishing in Louisiana’s public oyster grounds. The VMS module allows for monitoring of vessels activities to ensure compliance with the fishing regulations. These modules were provided free-of-charge to vessels fishing in the public oyster grounds of Louisiana, with the ship’s operator only needing to provide minimal maintenance to the module [
2]. Two features were used to determine the behavior of a vessel: instantaneous speed, which is how quickly the vessel is moving and net speed, which is the average speed of the vessel at that time. The VMS module on board, an oyster vessel produces a ping approximately once a minute, giving a vessel ID, a timestamp and a set of coordinates. These data can be utilized to infer information about fishing behavior and effort.
Step 2. Path Creation: In our implementation, we designed a rule-based trajectory segmentation technique which depends on the speed of the vessel. Pings with the same vessel ID and timestamps within 20 min of each other are concatenated together into a path. Points outside of the 20-min window are not appended to any previous paths produced by that vessel. Instead, they are used to create a new path, if they contain at least 10 points captured within 20 min of each other. Vessel paths show the movement pattern of a vessel over time and can provide insight into what the vessel was doing at a given point.
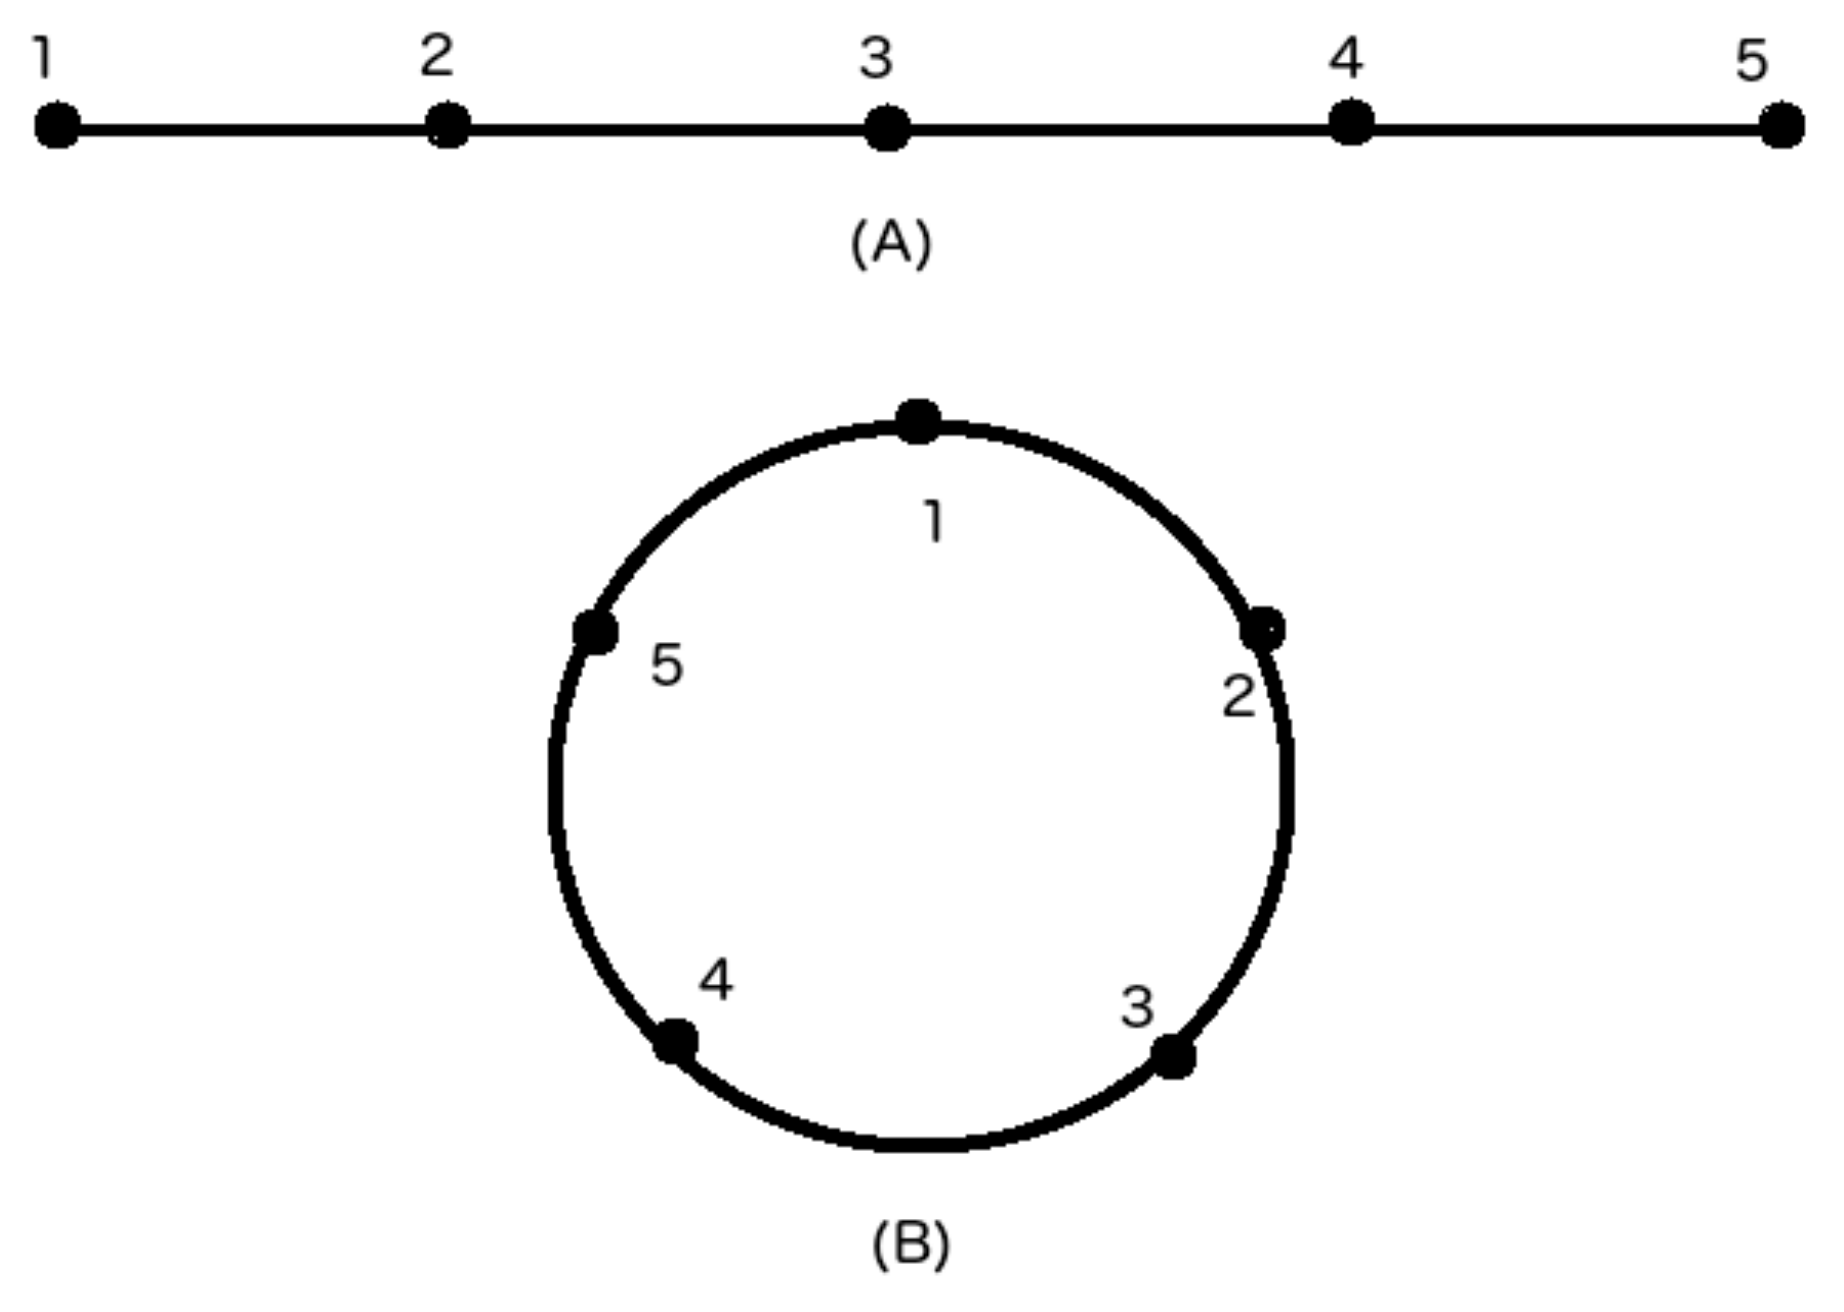
Figure 3 shows two idealized movement patterns of oyster vessels, consisting of five points each. As shown in
Figure 3A, linear movement is associated with vessels that are traveling. Circular movement is associated with vessels that are poling and docked, as shown in
Figure 3B. Fishing can occur during either movement pattern, but is more common during circular motion.
Step 3. Calculating Speed of Vessel: The speed of vessel at a point helps to determine if the vessel was performing an activity or traveling. Vessel’s speed is defined as the distance between two consecutive points in a path, over the difference in seconds between the last point’s VMS ping and the first point’s VMS ping. The distance between two consecutive points in a path can be determined by using the
haversine formula [
14] (see Equations (1) and (2)). The
haversine formula is a method to compute the distance between two points on the surface of a sphere which is given by:
where,
hav indicates
haversine function, which is defined in Equation (2):
In Equation (1), d is the distance between the two points, r is the radius of the sphere, lati indicates the latitude of the i-th point and lonj indicates the longitude of the jth point. In Equation (2), θ indicates an angle. In our application, d is the distance between two consecutive pings of a VMS module and r is the radius of the earth, which is approximately 6371 km.
Step 4 and 4.1. Filtering of Erroneous Data: Instantaneous speed is calculated using the distance between two consecutive points, it is unlikely that the point for which the speed is calculated will exceed 50 m/s. Thus, points with speeds over 50 m/s are discarded as erroneous data.
Step 5. Calculating Net Speed of Vessel: Net speed at the points in a path are calculated only if the path contains at least 10 points. The paths containing less than 10 points are not considered a valid path and therefore are removed from further consideration. For paths containing more than 10 points, net speed is calculated using a sliding window of 10 points. The distance between the last and first points of the window over the difference in seconds between those two points is a single net speed value. Each point in the window has this net speed value appended to its list of net speeds and the window slides forward by one point. Since the window starts at the first point in the path and stops when the end of the window reaches the end point of the path, the start and the end points of the path will contain a single net speed value in its list of net speeds. Thus, the average of the list of net speeds for the start and end point of the path will be the same as the single net speed value.
Step 6. Obtaining Ground Truth using Rule-Based Classifier: The rule-based classifier previously developed by Gallegos [
6] is used in this work to obtain the ground truth for each point. This rule-based classifier, deterministically groups the points into likeliest behavior using a set of rules, provided a point’s speed and net speed are known. The set of rules used to determine the behavior from point’s speed and net speed are as follows:
- (i)
If point’s speed < 0.1 m/s and net speed < 0.1 m/s then the point is labelled as docked.
- (ii)
If point’s speed < 0.5 m/s and net speed ≤ (point’s speed + 0.125 m/s) then the point is labelled as poling.
- (iii)
If point’s speed ≥ 0.5 m/s and ≤ 1.75 m/s and net speed ≤ (point’s speed − 0.125 m/s) then the point is labelled as fishing.
- (iv)
If point’s speed ≥ 0.5 m/s and net speed ≥ (point’s speed + 0.125 m/s) or point’s speed > 2 m/s and net speed ≥ (point’s speed − 2 m/s) then the point is labelled as traveling.
- (v)
If rules from (i) through (iv) do not apply then the point is labelled as unknown.
Step 7 and 7.1. Check Behavior at Each Point: From Step 6, we found that 48,645 points were labeled as “unknown” behavior. As these points could not be used for supervised machine learning, they were discarded from further consideration.
Step 8. Designing ML-Based Classifiers: The points for which one of the four behaviors (docked, poling, fishing or traveling) could be determined using Step 6, were used as the validation/training/independent set. Each point in the validation/training/independent set were encoded using two important features—speed and net speed. Then, the two features along with the corresponding behavior type of all the points in the dataset were used as an input to the ML classifier to determine a vessel’s movement pattern.
Data Conditioning: In the case of ML classifiers, normalization of input data can reduce the time needed to train the classifier. This avoids crunching big-numbers and reduces the numerical dominance of one feature over another and thus improves prediction accuracy [
15]. It is important to note that the scaling that is applied for training is the same scaling used at test time to predict the behavior of new data. In our implementation, we used scaled features to train and test our ML classifier. For the data points, net speeds ranged from 0 m/s to about 25 m/s and speeds ranged from 0 m/s to about 50 m/s. Their values were scaled between −1 and 1, with “−1” representing the slowest speed and “1” representing the greatest speed.
Support Vector Machine Classifier: We employ a radial basis function (RBF) kernel support vector machine (SVM) as our classification technique. An SVM uses maximum-margin affine hyperplanes to separate data into distinct groupings, allowing it to predict the behavior of new data based on which grouping that data falls into. It penalizes the instances on the wrong side of the decision boundary using a penalty term or, cost parameter, C. In addition to the cost parameter C, RBF kernel SVM possess an attribute, gamma, which affects the area of influence of each training instance. SVM has been found to perform better for binary classification problems. However, in cases where more than two classes are being considered, an SVM can divide a problem into a series of two-class problems. There are several approaches to this binary classification system, including one vs. all and one vs. one comparison. In our implementation, we applied one-vs-one classification technique for multi-class classification which is the default implementation for the SVC library [
16]. In one vs. one case, a classifier is made for each combination of two classes. Each classifier casts a vote as to which class the new input belongs and the class with the most votes wins [
7].
Grid Search to Find the Optimal Parameters: The RBF kernel parameter,
γ and the cost parameter, C were optimized to achieve best accuracy using a method called grid searching. In grid search, an array of parameter values is explored to determine those that produce the best accuracy on a validation dataset. There can be multiple parameters, such as when using an RBF SVM, the parameters are grouped together in every possible combination. For example, if there are values C = (
a,
b) and
γ = (
x,
y), a grid search would produce the sets (
a,
x), (
a,
y), (
b,
x) and (
b,
y). These sets would be tested with three-fold cross-validation (CV) on a subset of the available data [
16]. Because each set is independent of the others, this process is easy to run in parallel, which is especially efficient as the exhaustive searching of values is time-consuming. After testing all combinations, the algorithm returns the set that produced the greatest accuracy. The best values of the parameters found are, C = 10 K and
γ = 1000 and used as the representative parameter values for the 10-fold CV of RBF kernel SVM for the entire dataset.
Cross-Validation (CV): Estimating the prediction error of the classifier was done by using 10-fold CV, a testing method that is both simple and widely used [
7,
8,
9,
15]. CV is performed in folds, where the data is segmented into
K parts, which are each of about equal size. When a fold is set aside for validation, the other (
K−1) folds are used to train the classifier. This process repeats until each fold has been set aside once for validation and then the
K estimates of error are combined to find the average [
7].
In our data set, there are five distinct behaviors to consider: unknown, docked, poling, fishing and traveling. Points with unknown behavior are not inputted into our validator at this stage, since we do not want the validator to produce unknown points. Of the other four behaviors, we have an abundance of fishing and traveling points, a smaller number of poling points and comparably few docked points. There were concerns that due to the comparably large number of poling points in comparison to docked points, our classifier would discriminate against docked points and label them as poling, since the ranges of their behaviors were so similar. To counteract this unwanted behavior, when the folds are prepared, only paths that have at least a single docked point are gathered. Docked points are still a minority, but now they make up a larger portion of the data and are more likely to be correctly classified. However, if the folds happened to be grouped in such a way that all the docked points ended up in a single fold, it could greatly impact the classifier’s ability to correctly predict docked behavior. To circumvent this occurrence, stratified
K-folds were used to partition the data into nearly even sets. In regular
K-folds, there is no concern which data points are grouped into which fold. Therefore, it is possible that an entire class could end up within a single fold, which could skew the accuracy of the classifier if it has never encountered the segregated class. Stratified
K-folds split the data such that each fold has about an equal number of each class as every other fold. Thus, the classifier is guaranteed to have encountered every class before it predicts them. For our data set, we chose to use 10 folds, which is widely accepted as a reasonable compromise for number of folds and computationally feasible [
7].
Decision Post-Processing: If a vessel’s behavior is near the threshold of two different behaviors, there is a chance it could cross (in silico) from one into the other and back again. To handle situations like these, we turn to the method known as decision post-processing, where the classes of the previous and next points affect the class of the current point. If we have classes A and B and a series of points are predicted to the classes AABAA, then the center point is not likely to be class B. Rather, it is likely some change in values caused the classifier to misclassify the central point. To amend the situation, we post-process the middle point, by assigning it to the same class as its neighbors, in this case A. If our series was AABBB, then we would require no post-processing, as there is no “wiggling” between the classes.
The greatest amount of time separating the timestamps of two points in a path is 20 min. If a vessel is exhibiting a known behavior, it is unlikely that it would switch from one behavior to another and then back again. For instance, if the classifier “thinks” a vessel is fishing, then poling, then fishing again within a brief period, it is unlikely that it was exhibiting a different behavior for a brief period, but more likely that it was adjusting its speed without altering its behavior.
Post-processing was performed on the output after the classifier had predicted the behavior of points in the path. If this was done before hand, the classifier would be less reliable, as points would be incorrectly attributed to the wrong behavior. In the context of the classifier, the behavior of the previous and subsequent points is irrelevant, since the only attributes of concern are speed and net speed.
Specifications of the Machine Used: All experiments were performed on a 64-bit Windows 7 machine (Dell, Round Rock, TX, USA), with a 2.40 GHz AMD Athlon II X4 610e Processor and 6 GB of RAM.
Step 9. Testing ML-Based Classifier’s Performance Using an Independent Test: Predictive capacity of the classifier was tested using independent test. In independent testing, a classification model is trained on a training set and tested on an independent test set. A subset of the original dataset was held-out using a stratified train and a test splitting technique, to perform independent testing of our classifier.
5. Experimental Results
In this section, we present the experimental results obtained through validation and independent test of the proposed method. For the validation of the model, a widely used 10-fold CV technique is used. Following validation, the model is tested using an independent test dataset. The accuracy measures used to evaluate the performance of the proposed classifier are accuracy (
ACC), precision, recall,
F1-score and area under the receiver operating characteristic curve (
AUC). The following equations define the
ACC, precision, recall and
F1-score, respectively:
where,
TP,
TN,
FP and
FN are the numbers of true positive, true negative, false positive and false negative, respectively. Here, precision is a measure to identify a predictor’s exactness and recall measures a predictor’s completeness. Therefore, the harmonic mean of precision and recall, called
F1-score, measures a classifier’s overall correctness. These are the main performance measures used in the literature as they capture the two error types (
FP and
FN), the number of correctly classified instances (
TP and
TN) and the relationship between them. The objective of this work is to correctly categorize the oyster vessel trajectory data points into one of the four behavior types: fishing, traveling, poling and docked.
At first, we optimized the parameters C and γ of RBF kernel SVM using grid search. As grid search is a time consuming procedure, we collected a subset of the original dataset. The subset is created by considering paths with only over 50 points from the original dataset. These paths in a subset resulted in total of 157,088 points (3528 docked points, 14,638 fishing points, 136,295 traveling points and 2627 poling points). To perform validation and independent test of the proposed method, the subset is further divided in the validation set of 80% and the independent test set of 20%. The validation set consist of 125,670 points (2822 docked points, 11,710 fishing points, 109,036 traveling points and 2102 poling points) and the independent test set consist of 31,418 points (706 docked points, 2928 fishing points, 27,259 traveling points and 525 poling points). Initially, the validation set is utilized to perform a grid search with 3-fold CV using SVM with RBF kernel as a classifier to find the optimal value of parameters C and γ. From the grid search, we found C = 10 K and γ = 1000 to be the optimal value of C and γ parameters. Next, using optimal value of C and γ in the proposed SVM with RBF kernel based multi-class behavior classification method, we performed 10-fold CV on the validation set (consisting of 125,670 points) as well as on the original dataset (consisting of 612,700 points). We found that both the simulations yielded similar accuracy of 99.99%. The 10-fold CV accuracy is obtained by taking the average of ACC’s obtained while testing on individual folds. In addition, we computed the AUC values for each behavior category by performing 10-fold CV on the validation set using SVM with RBF kernel and optimal value of C and γ found earlier through grid search. The value of AUC close/equal to 1 indicates high test accuracy and a robust classifier, whereas the value close/equal to 0 indicates low test accuracy and a very poor performing classifier. In our implementation, the AUC values for docked, fishing, travel and poling categories are found to be 1.00, 0.999999, 1.00 and 0.999990, respectively. The larger values of AUC’s for all the behavior categories clearly indicate that the proposed method achieves high 10-fold CV accuracy and ensures the robustness of the classifier.
After performing 10-fold CV on the validation set, this set along with the optimal value of
C and
γ are used to train a SVM with RBF kernel multi-class classification model. Once the classification model is trained, it is tested on the independent test set. The independent test of the trained model yielded an ACC of 99.99%. Furthermore, in
Table 1, we show the precision, recall and F1-score for four behavior types obtained from the independent test of the proposed method. The average value of precision, recall and F1-score are all found to be equal to 1.00, which implies that the proposed classifier is able to accurately classify each of the sample points in independent test to its correct behavior type. Additionally,
Table 2 shows the confusion matrix obtained from the independent test. From the confusion matrix shown in
Table 2, we can clearly see that the classifier is able to classify almost all of the sample point to its correct behavior type except, two of the sample points belonging to poling type which are misclassified as fishing.


 ,
, 
