Abstract
Recent advancements in composite materials design have made glass fiber-reinforced polymer composites (GFRPC) a viable choice for a wide range of engineering and industrial applications. Although GFRPCs boast attractive characteristics such as low specific mass and high specific mechanical strength, identifying and characterizing damage mechanisms in these materials is challenging. Several scientific studies have examined the root causes of GFRPC failure using various methods, including non-destructive techniques and learning algorithms. Despite this, ongoing investigations aim to accurately detect mechanical defects in GFRPCs. This study explores the use of non-destructive testing (NDT) combined with unsupervised learning algorithms to identify and classify damage mechanisms in GFRPCs. The NDT method employed in this study is acoustic emission (AE), which identifies waveforms associated with various failure mechanisms during testing. These waveforms are categorized using unsupervised learning methods such as principal component analysis (PCA) and self-organizing maps. PCA selects the most appropriate AE descriptors for distinguishing between different damage mechanisms, while the self-organizing maps algorithm performs clustering analysis and classifies failure mechanisms. Scanning electron microscope images of the observed failures are provided to sup-port the findings derived from AE data.
1. Introduction
Glass fiber-reinforced polymer composite (GFRPC) structures are appealing for many industrial and technological applications because of their superior anti-corrosive performance, prolonged service life, high specific stiffness and strength, and appropriate mechanical properties. (While the abbreviation GFRP is commonly used in the literature, it is often associated with continuous-fiber architectures such as prepreg or filament-wound laminates, so in the present work, the abbreviation GFRPC is used to explicitly emphasize the general composite nature of the material). Over the past few decades, GFRPC materials have been successfully applied in several industries, including the oil, gas, and chemical sectors, which have a rising need for products suitable for elevated-temperature and high-pressure service. GFRPC structures typically excel in corrosive settings as they are less prone to chemical attack compared to conventional metallic counterparts [1]. Product performance strongly depends on the properties of the polymer materials and the reinforcement element. GFRPCs consist of two or more constituent materials, resulting in a combination of desirable properties that cannot be achieved by the fiber or matrix alone [2,3]. Ensuring the longevity of such structures under various loading and environmental conditions relies on a thorough understanding of the respective damage modes and failure mechanisms. Identifying and assessing damage and failure in GFRPCs is a complex and challenging task, especially when relying solely on destructive techniques in conjunction with mechanical testing. Under mechanical loading, four main damage mechanisms are broadly recognized in GFRPC materials [4]: matrix cracking, interfacial debonding between fibers and the matrix, fiber breakage, and delamination. These damage modes depend on the type of material, its architecture, and the direction of the applied mechanical stress.
In the damage monitoring of polymer composites, the selection of non-destructive techniques (NDTs) is typically guided by the type of damage expected and the sensitivity of the technique, rather than by the specific material. However, material properties significantly influence signal detection and interpretation. For example, it will be shown herein that GFRPC material tends to emit distinct acoustic signatures during matrix cracking and fiber–matrix debonding, making it well-suited for acoustic emission (AE) monitoring. While other polymer composites, such as those reinforced with carbon or basalt fibers, may also benefit from the methods described in this study, differences in material properties mean that further work is required to generalize the findings to other material systems. Thus, although the method remains central, understanding the material’s behavior under applied loading is essential to enhance the accuracy and reliability of damage detection. In general, NDTs offer an attractive means for in situ monitoring and assessment of specimens during experimental testing. AE [5] is frequently used in conjunction with material tests such as tensile and three-point bending. The literature concerning AE in composite materials is abundant, starting with describing and characterizing the damage mechanisms with one single AE descriptor and moving up to several AE descriptors along with several learning techniques. The AE descriptor most used in several scientific works is the emitted sound amplitude [6,7]. However, even a single damage mechanism, like matrix cracking, can produce a wide range of amplitude values [8,9]. In addition, the AE waveforms representing the different events vary between tests and studies due to factors such as the materials being researched and the sensors used. As a result, it is challenging to compare the different studies [10]. Therefore, several works started the use of multivariable AE descriptor analysis of the damage mechanisms during different mechanical loading, such as Fotouhi et al. [11], who studied two types of specimens—woven and unidirectional GFRPC materials—by clustering the fracture mechanism during delamination in quasi-static three-point bend tests. The AE descriptors utilized in this study were average frequency, amplitude, and number of counts (i.e., number of times an acoustic signal exceeds a predefined threshold over a period of time). Bohman et al. [12] compared two different testing procedures to evaluate a possible correlation between the dominant failures in GFRPC materials and their corresponding AE signals. Using the combination of two AE descriptors, i.e., peak and centroid frequency, called weighted peak frequency, three clusters for the damage mechanisms (matrix cracking, interphase failure, and fiber breakage) were determined. Ali et al. [13], using the same AE descriptors, investigated the failure of woven fabric carbon RPC materials under tensile and flexural loading. Three clusters were determined for the same previous damage mechanisms by using the weighted peak frequency and the different partial powers for the AE hits. On the other hand, Das et al. [14] developed a method for crack mode classification (tensile or shear) in steel fiber-reinforced concrete beams by using various AE descriptors and a combination of them. For the clustering, they utilized the RA value that is defined as the ratio of risetime to amplitude and the average frequency.
Discerning an AE descriptor that correlates to each damage mechanism is shown to be a challenging task. Thus, several authors have used different learning techniques to determine suitable and appropriate values of each AE descriptor needed for the analysis. Therefore, each cluster or class of AE hits must have similar data describing the pertinent damage mechanisms and well-defined boundaries. Broadly speaking, there are two learning techniques for identifying the boundaries of each cluster or class: a supervised and an unsupervised approach. In GFRPC materials, unsupervised learning is commonly used to determine clusters due to the unknown boundaries in AE data for each damage mechanism. In this context, some of the unsupervised learning algorithms utilized for the classification and identification of the classes are k-means [15,16], Kohonen’s self-organizing maps (KSOMs) [17], and principal component analysis (PCA) [18,19]. In recent works, multivariable analysis methods have also been developed for the appropriate and pertinent selection of relevant AE descriptors that describe the damage modes. For example, Zhou et al. [20] developed a method combining AE with digital image correlation to comprehensively monitor the buckling behavior with delamination in GFRPC materials. They analyzed the reported AE data by using the k-means algorithm and PCA. Based on PCA results, the selected AE descriptors for the clustering were amplitude, peak frequency, and RA value (risetime divided by amplitude). They identified the following damage modes: matrix cracking, interfacial debonding between fibers and matrix, fiber breakage, and delamination. Later, Roundi et al. [21] investigated the static and fatigue behavior of GFRPC laminate by monitoring gradual material degradation and damage evolution using AE. They detected the most critical damage mechanisms and classified them using the k-means algorithm and PCA, as in the previous scientific work. In their results, the distribution of amplitude and the time dependency of the damage modes were provided. Harizi et al. [10] presented the coupling among three multivariable analysis techniques, i.e., PCA, k-means, and KSOM, to analyze AE data for GFRPC materials and identify—in real-time—their damage mechanisms during tensile loading (monotonic and step-wise tensile tests). They used the KSOM algorithm to identify the damage mechanisms according to the applied loading in the gradual tensile tests. Recently, Almeida et al. [22] developed an approach to classify AE signals based on supervised machine learning. They characterized the components of a GFRPC material separately and obtained information about the AE descriptors correspondingly. Afterwards, the AE data was used to train a model based on the k-nearest algorithm followed by model verification using the tensile test results. In their results, the authors found that matrix cracking and fiber debonding were the most frequent damage mechanisms, representing around 40% and 20% of the measured AE hits (detected AE signal crossing a threshold), while fiber breakage was the mechanism dissipating the most AE energy.
Identifying and assessing the damage mechanisms in GFRPC materials using an AE method in conjunction with unsupervised and supervised learning algorithms remains an active area of research that requires further investigation. Building on our previous work [23], the current study focuses on gathering AE signals during mechanical loading of GFRPC materials to identify and analyze the mechanisms of damage that occur during mechanical loading. The novelty of this work lies in the separate characterization of the components of the GFRPC materials (i.e., polymer matrix and glass fibers), followed by the combination of this information to establish well-defined boundaries for each damage mechanism in the composite system. The considered failure mechanisms include matrix cracking, delamination, matrix/fiber debonding, and fiber breakage, as previously mentioned and described in other scientific works. In this study, AE signal processing parameters are prioritized over raw waveform data due to their effectiveness in characterizing damage mechanisms in composite materials. While raw waveforms contain comprehensive information, their direct analysis is often computationally intensive and sensitive to noise. Therefore, processed parameters provide quantifiable features that are more suitable for statistical analysis, pattern recognition, and integration with unsupervised learning models. This approach enhances the efficiency and interpretability of damage evaluation, making it more practical for real-time structural health monitoring applications. The AE dataset comprises a total of 11 parameters, which are used in similar works [6,7,8,10,17,19,20,23]: duration (DURATION), absolute energy (ABS-ENERGY), signal strength (SIG-STRENGHT), risetime (RISE), counts (COUNT), amplitude (AMP), energy (ENER), counts to peak (PCNTS), reverberation frequency (R-FRQ), centroid frequency (C-FRQ), and peak frequency (P-FRQ). The developed methodology integrates PCA and the KSOM algorithm to identify and ascertain the AE parameters that are most significant to the classification of failure mechanisms. Additionally, scanning electron microscopy (SEM) images were also used to corroborate the correspondence between AE data obtained from the experiments and the damage mechanisms. The acquired data from the most relevant AE features was also compared with AE data from the technical literature pertaining to the above-mentioned damage mechanisms.
2. Materials and Methods
2.1. Materials
Mechanical testing in conjunction with the acoustic emission technique was conducted on a group of polymer composite panel specimens reinforced with short fibers. Specifically, the panels were composed of a thermoset polymer matrix and short glass fibers, with an average fiber volume fraction of 30% and a standard deviation of 3.5%. (Note that in the present study, the primary focus is on characterizing the acoustic emission signal characteristics associated with damage mechanisms; assessing the effects of variations in material composition, such as differences in fiber volume fraction, remains subject to future work.) The panels were fabricated using a hand spray-up approach, resulting in random fiber orientations and a somewhat layered structure. Note that the specific resin, polymer composition, and fiber type and dimensions are proprietary information. The composite specimens used for tensile tests were cut from the panels using a water jet. In addition, specimen composed of just the polymer matrix were created for bend tests. Following the cutting process, all edges were meticulously polished using wet sandpaper with grain sizes of 180 and 320. Table 1 summarizes the type of test, number of samples per geometry, dimensions, and expected damage mechanisms. Each performed test provides specific information about the expected damage mechanisms in the GFRPC material.

Table 1.
Experiments conducted for AE data collection along with expected damage mechanisms.
2.2. Unsupervised Analysis Methods
2.2.1. Principal Component Analysis
PCA is a quantitative method to visualize multidimensional data by replacing a group of connected variables with a new variable called the principal component [24]. PCA is a method that is based on the concept of covariance, which is defined as a statistical measure to describe the direction of a linear relationship between two random observations. Therefore, the objective of the PCA is the extraction of the most important information from the experimental data defined as a matrix [X] with vectors representing m rows and n columns as follows:
where the rows are the observation numbers, and the columns are the parameter numbers describing each observation xij, in which i = 1,…, m and j = 1,…, n. This information extraction is performed by compressing the size of this dataset, keeping just this important information, simplifying the description of the data, and analyzing the structure of the variables. Thus, PCA computes the principal components to achieve the previous goal by linearly combining the input variables of matrix [X]. The first principal component is required to have the largest possible variance, and the second and further components are computed under the constraint of being orthogonal to the first component and to have the subsequent largest variance. The obtained values of these components are called factor scores and can be interpreted as the projections of the observations onto the principal components. As a result, the main components are orthogonal with no information redundancy [10].
In PCA, the components are obtained from the singular value decomposition of the matrix [X], which decomposes a rectangular matrix into three simple matrices [24]: two orthogonal matrices and one diagonal matrix. Thus, the singular value decomposition of [X] is [X] = [P][∆][Q]T, where [P] is the eigenvectors of the matrix [X][X]T, in which the columns of [P] are called the left singular vectors of [X]; [Q] is the eigenvectors of the matrix [X]T[X], in which the columns of [Q] are called the right singular vectors of [X]; and [∆] is the diagonal matrix of singular values, in which [∆] = [Λ]2 with Λ being the diagonal matrix of the eigenvalues of matrix [X][X]T and of the matrix [X]T[X]. Consequently, the matrix of factors [F] is defined as [F] = [P][∆]. In a similar manner, matrix [Q] gives the coefficients of the linear combinations to determine the factor scores, which can also be interpreted as the projections of the observations on the principal components. It is also important to notice that Λ represents the covariance matrix of [X], which is used to determine the number of principal components.
2.2.2. Kohonen’s Self-Organizing Map
KSOM is defined in [25] as an artificial neural network that provides information on the relationship between different input variables from the matrix [X]. A KSOM is a single-layer neural network that uses a two-dimensional, rectangular, or hexagonal grid to group variables with a particular interest. The group of variables is made based on measures of distances and similarities between variables. For each analysis, the input variables xij of matrix [X] have m observations and n numbers of features, while each neuron has a weight vector Wq. The training of the KSOM technique can be achieved in a sequential or batch manner. In the present work, sequential training was used to classify each observation into different clusters or classes. The steps for the sequential training are [10,25]
- Initialization of the neuron weights Wq considering the average values of the columns of matrix [X].
- Random sampling of an input vector xji from matrix [X].
- Finding the best matching unit, which means obtaining the neuron whose weight vector is closest to the input vector by measuring the Euclidean equation as follows:where xji represents each observation in matrix [X], and Wq represents each element in the weight vector.
- Adaptation of the weight of this best-matching neuron as well as those of its similar neighbors so they are close to the input vector following the rulewhere N(q) is the neighborhood of the best-matching neuron, η is the learning rate, and t represents the iteration number.
- Continuation by increasing the number of iterations t and repeating the previous steps with the random sample of an input vector xji until a stopping criterion is met, such as reaching several iterations or a stable rate of the map.
2.3. Acoustic Emission and Experimental Setup
Figure 1a–e depicts schematics and photographs of the experiments performed to explore the expected damage mechanisms of the GFRPC material and its elements. In addition, Figure 1f illustrates the approach for the unsupervised classification of AE signal waveforms. The first step of the analysis was to obtain AE data from the different experiments. To record and analyze AE signals, a Micro-SHM AE monitoring system was used along with the AEWin software Version V1.21 (both Physical Acoustics, West Windsor Township, NJ, USA), as is shown in Figure 1e. The piezoelectric sensor type used herein was the PK15I sensor, which is a medium-frequency, resonant AE sensor from Physical Acoustics. This sensor type includes an integral, ultralow noise, low-power, filtered, and 26 dB preamplifier. The threshold was set to as low as 35 dB for threshold-based AE detection as in similar works [10,13,16,26]. Post-processing of the AE data was performed using the MATLAB R2022a programming language and numeric computing environment (MathWorks, Natick, MA, USA), as shown in Figure 1f. The labels ‘Ch1’ and ‘Ch2’ indicate the two sensor channels, which were used to maximize information gathering with two different hit detection times (HDT) 50 and 100 µsec, for ‘Ch1’ and ‘Ch2’, respectively. The following timing parameters were also applied: a peak detection time (PDT) of 50 µsec and a hit lock time (HLT) of 100 µsec. The selection of timing parameters depends on the type of material to be analyzed; thus, the previous parameters were selected based on works with materials possessing similar properties as the materials used in the present work [10].
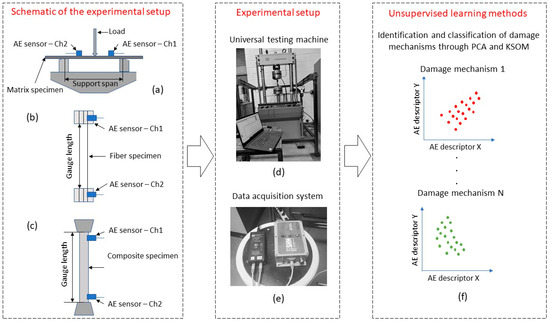
Figure 1.
Schematics of (a) three-point bent test for flexure properties of the matrix specimen, (b) test setup for fiber-breaking force measurement, (c) tensile testing of GFRPC specimen; photographs of (d) universal testing machine with a 100 kN load cell and (e) data acquisition system; and (f) schematic of unsupervised learning methods for damage identification and classification.
Regarding the experimental setup, a universal testing machine (type 810, MTS Systems, Eden Prairie, MN, USA) with a 100 kN load cell was utilized to conduct the different experiments in the present work (Figure 1d). Test data were aggregated or averaged as appropriate for use in subsequent analyses. The conditions for each experiment are explained as follows:
- Long-beam flexure of polymer matrix: In Figure 1a, a schematic for the three-point test of the matrix specimens can be observed. These tests were performed at room temperature by prescribing a stroke rate of 2.0 mm/min, based on the ASTM D7264 standard [27].
- Fiber-breaking force measurement: As depicted in Figure 1b, fiber tensile tests were conducted at room temperature with special Capstan grips made for fiber testing, adopting standards ASTM D 2256M-21 and ASTM D2343-17 [28,29]. All tests were performed with a displacement rate of 250 mm/min and a gauge length of up to approximately 250 mm. At least ten specimens were tested. A considerable drop in testing load indicated specimen failure. The maximum load from the load–displacement curve was taken as the breaking load.
- Tensile testing of GFRPC materials: Tensile tests with GFRPC specimens were conducted at room temperature as illustrated in Figure 1c over a gauge length of 150 mm by prescribing a stroke rate of 5.0 mm/min, following ASTM D3039 [30].
3. Results
3.1. Implementation of Principal Component Analysis
In the present work, AE data was expressed as a matrix [X] with dimensions of m × n, where m represents the number of hits, which varies depending on the type of tested sample and its acoustic emissivity, while n represents the number of AE descriptors, which is 11. Thus, after applying PCA, if there are n variables, the resulting matrix [X] is symmetric and m = n. Consequently, the AE data has distinct descriptors or parameters for every occurrence. As stated before, each hit was characterized by 11 descriptors, i.e., risetime (RISE), counts (COUNT), counts to peak (PCNTS), duration (DURATION), amplitude (AMP), energy (ENER), absolute energy (ABS-ENERGY), signal strength (SIG-STRENGTH), reverberation frequency (R-FRQ), centroid frequency (C-FRQ), and peak frequency (P-FRQ). Pre-processing of the AE data began by assuming that the characteristics exhibit Gaussian distributions [11]. Nevertheless, certain characteristics, such as DURATION and ENER, have exponential distributions, necessitating the conversion of their values into logarithmic values for subsequent analysis. To carry out this modification, the AE data was normalized using the normalize function available in the selected programming environment. Consequently, each AE description carries equal importance before using PCA. Thus, when utilizing PCA, the AE characteristics can be mapped onto a two-dimensional space that corresponds to the first two principal components. The primary components are determined by selecting the components with the greatest variations. Additionally, the AE descriptors with higher values in the eigenvectors are considered more important. To identify the most important AE parameters, two conditions were applied, as outlined in [10]. Firstly, removing an AE parameter should not result in a loss of information. Secondly, the vector associated with a significant AE parameter must be different (in terms of length and direction) from the vectors previously selected to represent principal components.
When PCA is utilized, the AE descriptors are projected onto the first two principal components, as illustrated in Figure 2a, which represent the components of the GFRPC material. It is important to note that the selection of the most relevant and significant AE descriptors was made based on the AE data belonging to the GFRPC material, which involves all the possible damage mechanisms. Red lines and symbols highlight the selected AE descriptors. Data from ‘Ch1’ was used to analyze and to plot the AE data of all the materials since no significant differences were found between both channels explained in the previous section. In Figure 2a, peak frequency and amplitude are the two chosen AE descriptors, according to the two previously mentioned conditions. Peak frequency (P-FRQ) is shown by the hexagram symbol and amplitude (AMP) by the cross symbol, both with a solid red line. Amplitude is the largest peak in an AE signal, giving important information about the waveform and the peak frequency, which is the frequency with the maximum Fast Fourier Transform. However, to analyze all pertinent AE data, it is required to zoom into the projection as shown in Figure 2b, where the duration (DURATION) is selected (and represented by an asterisk with a red dashed line) instead of the counts due to its importance for classifying the damage mechanisms based on the time difference between first and last threshold crossing in each AE hit. In Figure 2c, it is possible to observe two AE descriptors, energy (ENER) and signal strength (SIG-STRENGTH). In [22], energy was used to determine the impact of damage in composite materials, thus it was included in the present work to determine the significance of energy consumption during mechanical failure.
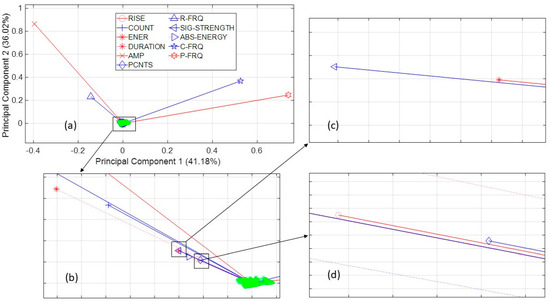
Figure 2.
(a) Acoustic emission descriptors projected onto principal components 1 and 2 through PCA for the AE data of the GFRPC specimens using data from ‘Ch1’ with corresponding principal component scores (green points), and enlarged projections for the selection of (b) duration (DURATION), (c) energy (ENER), and (d) risetime (RISE).
Finally, as shown in Figure 2d, risetime (RISE), which is the time from the start of the signal to maximum amplitude, was selected instead of counts to peak (PCNTS) because it has widely been used in multi-variable AE clustering analysis [14,20]. In addition, in [31], risetime was utilized at different stress levels at static loading in carbon fiber-reinforced polymer composite materials to differentiate among failure modes. Therefore, after applying PCA, the following five AE descriptors were selected: amplitude, peak frequency, duration, energy, and risetime. These descriptors are not correlated and are selected objectively based on the methodology presented in this work. As previously mentioned, the selection of principal components is based on each component’s variance, so Table 2 shows the variance for the principal components. In the present work, the first two principal components, corresponding to variances of 41.18% and 36.02%, are necessary to perform the clustering analysis. Three or more components are not required because their variance values do not have a significant effect on the linear combination of the AE data. In Table 2, the most influential descriptors of each principal component can also be appreciated.

Table 2.
Variance of the principal components of PCA.
The Davis and Bouldin (DB) index [32] and Silhouette (S) coefficient [33] were used to objectively determine the appropriate and suitable quantity of clusters for the k-means algorithm. The DB Index is a validation metric utilized for assessing clustering models that involves determining the average similarity measure between each cluster and the cluster that is most like it. Within this framework, similarity is characterized as the proportion of inter-cluster distances to intra-cluster distances. Consequently, this measure assigns a higher score to well-separated clusters with lower dispersion. The DB index must be the lowest value to select the appropriate number of clusters and can be calculated as follows [32]:
where K is the number of clusters, and are the intra-cluster distance within a cluster, in which , and Aij is the inter-cluster between class i and j. Another interesting technique for calculating the suitable number of clusters is the S coefficient, which is a measure that quantifies the dissimilarity between cluster separation and cohesiveness, which is then divided by the larger of the two values. The S coefficient can be obtained as follows [33]:
where b1 is cluster separation that is the average distance between an observation and all other data in the nearest clusters, and b2 is cluster cohesion that is the average distance between an observation and all other data within the same cluster. The highest values of the S coefficient are considered as an appropriate number of clusters. Considering these two factors, there are four clusters for Kohonen’s self-organizing map based on the AE data of the GFRPC specimens, as shown in Figure 3.
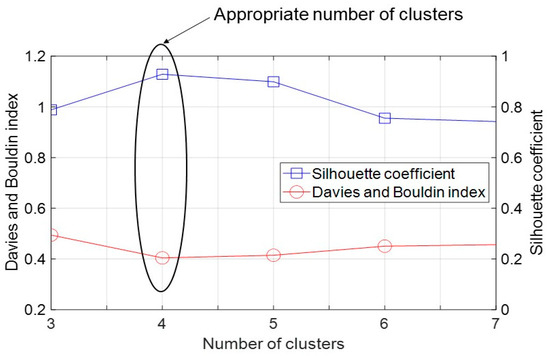
Figure 3.
Davies Bouldin index and Silhouette coefficient for the appropriate number of clusters for the AE descriptors of the GFRPC specimens.
3.2. AE Data of Each Conducted Experiment
The AE data of each material presented in Table 1 was first analyzed for amplitude and peak frequency based on the PCA results in the previous subsection. Figure 4 shows the AE data acquired for each experiment. Based on the DB index, S coefficient, and the identified damage mechanisms in the GFRPC specimens, the total number of damage modes observed during the analysis is four. Thus, in Figure 4, each damage mechanism is labeled. The labels are as follows: damage mechanism #1—matrix cracking; damage mechanism #2—fiber breakage; damage mechanism #3—fiber/matrix debonding; and damage mechanism #4—delamination. Each material has a different frequency band, as seen in Figure 4a,b, for the matrix specimens and glass fibers, respectively. The expected damage modes in these experiments are related to matrix cracking and fiber breakage. In the case of the experiment for the GFRPC specimens, the frequency bands are more complex to analyze, but using the information provided in AE data recorded for the separate experiments with matrix specimens and fibers, it is possible to define the frequency bands for the damage modes of interfacial fiber/matrix debonding and delamination of the matrix polymer.
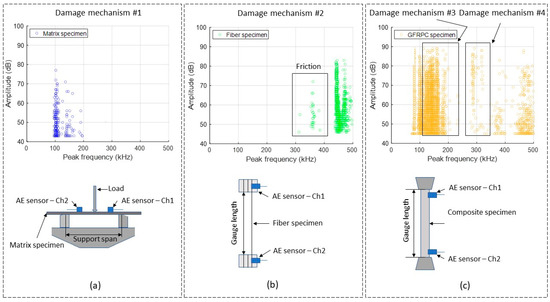
Figure 4.
AE signals gathering from the experiments in terms of amplitude vs. peak frequency for: (a) matrix bending tests, (b) fiber tensile tests, and (c) GFRPC tensile tests.
To better analyze the frequency bands, Table 3 compares the frequency bands of each material described in Table 1 with values obtained from the technical literature, where each band is associated with a specific damage mode. In the case of the AE signals related to the matrix specimens—see Figure 4a, i.e., damage mechanism #1—matrix cracking—the frequency band is in the range of 97 to 194 kHz, while the amplitude is in the range of 43 to 77 dB. This frequency band is comparable to the ones in [11,34] where the ranges are 50 to 200 kHz and 100 to 190 kHz, respectively. Low amplitude values during matrix cracking are to be expected according to the technical literature [4,21,22]. In the present work, matrix cracking includes both matrix crack initiation and propagation, considering that the applied load during the bending tests promoted shorter and longer cracks in the matrix specimen.

Table 3.
Damage mechanisms of GFRPC specimens based on AE peak frequency bands in kHz and comparison with frequency bands available in the technical literature.
In Figure 4b, the frequency band and amplitude values of the fiber specimens are illustrated (i.e., damage mechanism #2-fiber breakage). The dominant frequency band is 380 to 500 kHz, while the amplitude values range from 46 to 86 dB. Referring to the region labeled as ‘Friction’ in Figure 4b, AE hits with low amplitude and lower peak frequencies (315 to 385 kHz) but long durations were also recorded. Presumably, signals in this region were generated by interactions among broken fibers and fibers still bearing mechanical loads, as mentioned in [22]. As individual fibers begin to deteriorate, interaction between freshly broken fibers produce signals that have a high level of scattering and generally low intensity. This can be attributed to the fact that friction is contingent upon stochastic relative motion of distinct surfaces. Therefore, actual fiber breakage is related to the higher range of 380 to 500 kHz, similar to the reported frequency bands of 350 to 500 kHz in [35] and 380 to 430 kHz in [11,20].
During the tensile testing of GFRPC specimens, a wide range of frequencies was obtained. As is shown in Figure 4c, the observed frequency data appears to span a spectrum covering the four damage mechanisms considered herein (from matrix cracking to fiber breakage). Compared to the previous experiments, associating damage modes with certain frequencies is more complicated because failures of fibers, matrix, and fiber/matrix interfaces may all occur during the tensile testing of GFRPCs. Nevertheless, considering the findings from the previous experiments along with results from the technical literature, it is possible to discern the frequency bands corresponding to the different damage modes. In Figure 4c, a prominent frequency band from 119 to 234 kHz can be seen, with amplitude values between 45 and 89 dB. This band is associated with fiber/matrix debonding, as corroborated by similar observations in the technical literature, i.e., 150 to 250 kHz in [35] and 125 to 187.5 kHz in [36]. Regarding damage mechanism #4—delamination, a frequency band emerges from 250 to 340 kHz with amplitude values of 45 to 88 dB. Similar data for delamination damage, i.e., 200 to 320 kHz, was observed in [11,20].
Amplitude served as an AE descriptor in a multitude of scientific studies. However, AE waveforms representing the different damage events differ between studies for a variety of reasons, including test setups and types of tested materials. Consequently, comparing amplitude data between studies is challenging. In the present work, amplitudes span from 43 to 77 dB for matrix cracking, from 46 to 86 dB for fiber breakage, from 45 to 89 dB for matrix/fiber debonding, and from 45 to 88 dB for delamination. Clearly, tjis data overlaps, making a distinction between damage modes difficult. Therefore, peak frequencies—by themselves—are seen as insufficient for assessing damage modes in GFRPC specimens. For this reason, a multivariable AE descriptor analysis is considered necessary to fully appreciate the possible damage modes for different loading conditions. Accordingly, the following subsection describes the application of KSOM to the AE descriptors borne from PCA to determine well-defined clusters for each damage mechanism.
3.3. Clustering Based on Kohonen’s Self-Organizing Map
The present work showed PCA to be a critical process as it enables dimensionality reduction and serves to enhance clustering by reducing noise (outliers). Using KSOM with prior PCA, it was possible to limit the initial eleven descriptors to a mere five features. Without applying PCA to the AE data, there would be an abundance of unnecessary information and poorly defined clustering.
The applied KSOM method utilizes the “Neural Network Toolbox” module within the employed numeric computing environment. This methodology does not necessitate any prior estimate of the number of classes to be derived. Figure 5 displays a schematic of the KSOM-based procedure for discerning AE signals with the descriptors ‘risetime’, ‘duration’, ‘amplitude’, ‘peak frequency’, and ‘energy’, into damage mechanisms, i.e., matrix cracking, fiber/matrix debonding, delamination, and fiber breakage. As part of this process, it is essential to deeply analyze the AE data patterns based on information provided by the selected descriptors to fully associate the different clusters with the corresponding damage mechanisms.

Figure 5.
Applied KSOM method for the classification of AE data recorded during mechanical loading.
To better appreciate the significance of each cluster over the span of an experiment, it is beneficial to plot the cumulative hit counts for each class as a function of time. Figure 6a,b depict the normalized cumulative AE hits for each class along with the applied stress over time for the GFRPC specimens. Note that the highest stress of 97.27 MPa was reached at 42.2 s. The SEM image in Figure 6c shows damage features corresponding to each cluster. The clusters’ cumulative hit counts necessarily increase over time but at distinctly different rates. Notably, damage mechanisms appear in a particular order, see Figure 6b, and evolve over time, as described previously in [4,10,21,22]. The damage mechanism to emerge first in the GFRPC is matrix cracking, starting at 0.55 s, followed by matrix/fiber debonding at 1.6 s, delamination at 5.1 s, and fiber breakage at 8.2 s. In response to local stress fields, damage starts at a microscopic scale in the form of matrix microcracks, see Figure 6c. Microcracks may propagate inside the material as mechanical loading increases. The fibers reinforcing the matrix tend to arrest microcracks. In this context, several parameters affect the damage process, such as the fiber volume fraction and the reinforcement orientation—the latter being random in the GFRPC specimens used in this study. The buildup of mechanical stress in the vicinity of fibers promotes the emergence of subsequent damage features. Growing and accumulating matrix microcracks can form delamination, and fiber/matrix debonding may occur, as shown in Figure 6c. Fiber/matrix debonding will be more prevalent in materials in which the bond between the fibers and their matrix is poor. As matrix cracking, fiber/matrix debonding, and delamination propagate, the fibers experience increasing localized loading, leading to fiber breakage, which may occur either sequentially or in multiple fibers simultaneously. While loads within the material may redistribute to adjacent fibers initially, the progressive loss of fiber reinforcement ultimately leads to macro rupture. The final failure of the GFRPC material is therefore a combination and accumulation of the various damage mechanisms rather than a single dominating event.
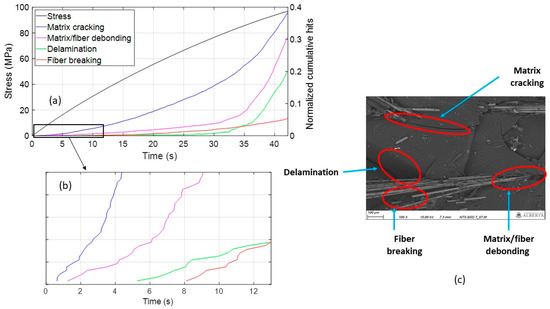
Figure 6.
(a) Stress of the GFRPC specimens and normalized cumulative hits of damage mechanisms as a function of time; (b) zoomed in plot presented in (a) in a range of time between 0 and 13 s; and (c) SEM image for association of the damage mechanisms with clusters.
Analyzing the data in Figure 6a,b in terms of the accumulation rate, a significant yet rather progressive increase in cumulative hit counts can be ascertained for matrix cracking over the test duration. The accumulation of matrix damage accelerates mildly after about 30 s (corresponding to a stress level 40 MPa of and 71% of the test duration). Conversely, only a limited amount of AE hits was recorded for fibers/matrix debonding within the first 30 s of the test. However, after this initial phase of slow damage growth, AE hits increased exponentially until final failure. A similar behavior can be observed for delamination but to a lower extent in terms of AE hits. Finally, cumulative AE hits for fiber breakage grow almost linearly from 8.0 s until final failure, which is somewhat surprising as accelerated fiber breakage was expected near specimen failure.
Closer analysis of the AE data shows that with 38.6% of the total AE hits, matrix cracking is most dominant, see Figure 7a. In comparison, fiber breakage accounts only for 6.34% of the total AE hits. So, the AE hits linked to matrix cracking are greater by a factor of 6.1 than those for fiber breakage, which shows the sensitivity and possibly fragility of the matrix phase in contrast to fiber reinforcement. Matrix/fiber debonding accounts for the second most frequent damage events, with 34.9% of total AE hits, which is a value similar to the matrix cracking events. Fiber/matrix debonding is therefore considered to play a significant role not only in the quantitative accumulation of damage but also in its severity, as it greatly affects the load-sharing mechanisms between fibers and thus contributes to subsequent fiber breakage. Finally, delamination accounts for 20.1% of the total AE hits. Although this value is three times higher than that for fiber breakage, its effect on strength degradation is considered moderate, given the dominant role that the loss of fiber reinforcement plays in reducing strength. It is important to note that these percentages should not be extrapolated to the given material system. It is expected that the relative contribution of these damage events depends on the material morphology, including the content, length, orientation. and dispersion of the fibers.

Figure 7.
(a) AE hit percentage of each damage mechanism and (b) AE energy percentage for each damage mechanism in GFRPC specimens.
3.4. Cluster Analysis Based on AE Descriptors
As discussed above, the clusters defined using the KSOM method can be associated with the stated damage mechanism. In this section, the clusters are examined in light of the different AE descriptors. Starting with AE energy, values depicted in Figure 7b provide a starkly different finding compared to the percentage share of AE hits for the various damage modes shown in Figure 7a. It becomes evident that fiber breakage is the prevailing damage mechanism, accounting for 88.1% of the total AE energy, even though only 6.34% of the total AE hits are attributed to this damage mechanism. On the other hand, matrix cracking accounts for only 1.61% of the overall AE energy, whereas total AE hits make up the large portion of 38.6%. Observations are similar for fiber/matrix debonding and delamination, where values for AE energy and AE hits are 7.99% and 34.9%, and 2.34%, and 20.1%, respectively. Notably, the ratio of AE energy associated with fiber breakage is approximately 54, 37 and 11 times greater than that of matrix cracking, delamination, and matrix/fiber debonding, correspondingly. This finding confirms the dominant role of the fibers in storing strain energy and thus reinforcing the material, whereas the contribution by the matrix is less significant [4,22].
As described in [26,32,37], an efficient measure employing ‘amplitude’ and ‘risetime’ to quantify tensile and shearing events in composites during the loading process is the RA value, which is obtained by dividing the risetime of an AE hit by its peak amplitude. The studies showed that tension-induced damage causes AE hits with a shorter risetime and greater peak amplitude. In contrast, shearing events within the material create acoustic waves with a longer risetime and lower peak amplitude. The maximum amplitude component within the RA value is frequently expressed as voltage. However, the current work employed a modified methodology, expressing the peak amplitude in decibels (dB), as performed previously in [26], by using the following formula:
in which a 26 dB preamplifier gain applied in the AE sensors is used. The RA value can be plotted as a function of the AE duration. In Figure 8, RA values with respect to time are depicted separately for each damage mode of the GFRPC specimens. Presumably, AE hits with RA values below unity are associated with tension-related damage modes, such as matrix cracking and fiber breakage, and AE hits with RA values greater than unity are associated with fiber/matrix debonding and delamination. Figure 8a shows that AE hits related to delamination are clustered toward the end of tensile loading with RA values higher than unity. A similar observation is made for the AE hits associated with matrix/debonding in Figure 8b. In these two cases, the RA values are related to a high risetime, causing RA values greater than unity. Conversely, AE hits with a low risetime yield RA values less than unity, which can be seen in Figure 8c. In this graph, matrix cracking is shown to occur already in the early stages of mechanical loading and be sustained throughout the tensile testing. In the case of fiber breakage, see Figure 8d, damage occurs through most of the specimen life with RA values clearly below unity.
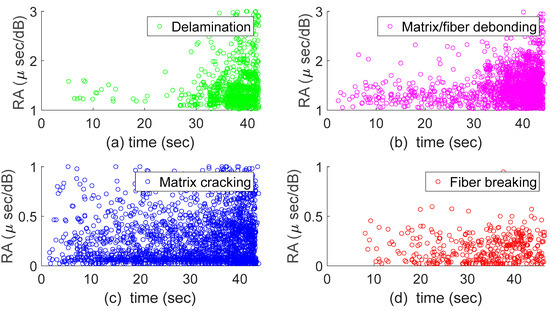
Figure 8.
RA value as a function of time for damage mechanisms of GFRPC specimens: (a) delamination, (b) matrix/fiber debonding, (c) matrix cracking and (d) fiber breakage.
Figure 9 shows RA values plotted with respect to duration for each damage mechanism of the GRFPC specimens. In the case of matrix cracking, it can be observed that the waveforms have the lowest durations [4] compared to the other damage modes, as shown in Figure 9c. In contrast, fiber breakage exhibits the highest duration [4]. In the case of matrix/fiber debonding, in Figure 9b, waveform durations are higher than matrix cracking but lower than delamination [4]. In comparison, in Figure 9a, the waveform durations for delamination are less than that of fiber breakage [4], illustrated in Figure 9d.
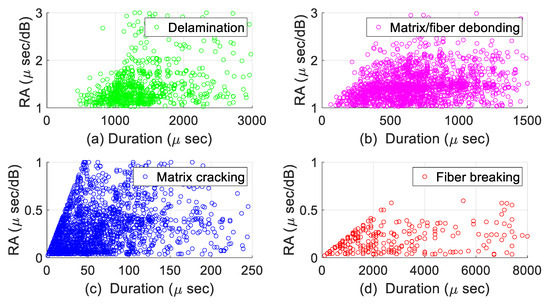
Figure 9.
RA value as a function of AE duration for damage mechanisms of GFRPC specimens: (a) delamination, (b) matrix/fiber debonding, (c) matrix cracking, and (d) fiber breakage.
To further corroborate the above findings, Figure 10 compares graphs for RA value as a function of duration for GFRPC and fiber specimens. It can be observed that the RA values exhibit similar trends for both materials. Based on these results, the RA value is proposed as an alternative option for classifying the damage mechanisms in GFRPC specimens.
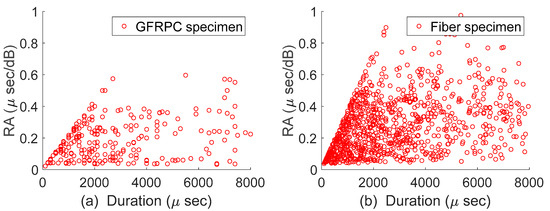
Figure 10.
Comparison of RA value for (a) the GFRPC and (b) fiber specimens.
To evaluate the consistency of the KSOM results, the Adjusted Rand Index (ARI) [38,39] is employed to assess clustering stability. The ARI is a widely used metric in unsupervised learning for quantifying the similarity between two clustering outcomes, particularly under conditions where the input AE data or algorithm parameters are perturbed by noise or variation. It ranges from −1 to 1, with higher values indicating greater similarity. A pronounced peak near ARI = 1.0 suggests strong clustering stability, implying that the clustering structure is reliably reproduced despite perturbations and likely corresponds to meaningful damage modes. Conversely, a broader distribution or lower average ARI may reflect sensitivity to input changes, potentially due to overlapping features, noise, or suboptimal KSOM configurations. Figure 11 presents a histogram of ARI values obtained from 500 simulation runs using the KSOM method, illustrating the robustness of the clustering applied to AE signal data from GFRPC specimens. In Figure 11, ARI values are shown on the abscissa, while their corresponding frequencies are displayed on the ordinate. The distribution reveals that most ARI values are concentrated between 0.95 and 1.0, indicating a high degree of clustering consistency across different subsamples. A smaller portion of the runs exhibits ARI values between 0.75 and 0.8, suggesting moderate-to-good similarity and highlighting some sensitivity in specific perturbations. Notably, the frequency of ARI values around 0.5 is negligible, confirming the absence of significant instability or randomness in the clustering process. The average ARI across all runs is 0.941 with a standard deviation of 0.0896, further demonstrating the high stability and reliability of the KSOM clustering.
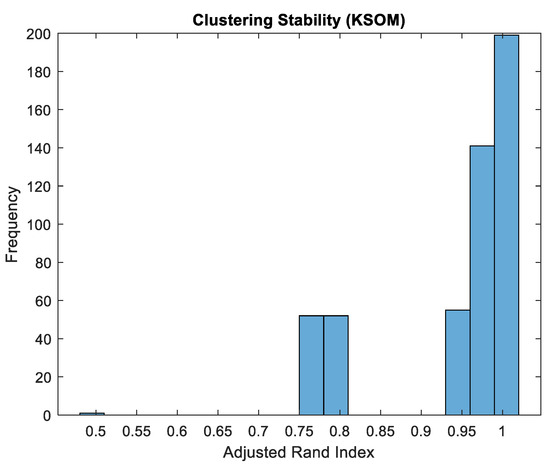
Figure 11.
ARI values for clustering stability of KSOM method.
3.5. SEM Observations and Correlation
GFRPC specimens were also inspected using SEM after tensile testing. Figure 12a shows the surface of a failed GFRPC specimen on which a SEM image (Figure 12c) was taken to observe its damage modes using a scale of 200 µm and 50× magnification. Figure 12b illustrates the direction of tensile loading that was applied to the GFRPC specimen. Recalling how damage modes emerge and accumulate to significant levels, the following order can be established (see Figure 4 and Figure 8): matrix cracking (class/cluster 1), fiber/matrix debonding (class/cluster 2), delamination (class/cluster 3), and fiber breakage (class/cluster 4). While it stands to reason that ultimate failure of the GFRPC specimens is caused by the combination and accumulation of all these degradation mechanisms, initial material degradation starts at a microscopic level with the emergence of matrix microcracks, see Figure 12c, which grow and accumulate as the mechanical loading intensifies. The random orientation of glass fiber reinforcement strongly affects the damage process due to multiple factors (i.e., local fiber dispersion, distribution, and orientation). Therefore, fibers may slow and even arrest microcracks in favorable conditions, while microcracks may also trigger fiber interfacial debonding. As the matrix deteriorates and the separation and detachment of the fibers from the matrix intensifies, the fibers experience increasing stress, eventually leading to the breakage of individual fibers or even fiber groups. Similarly, when the matrix fractures, delamination of the material layers may occur, especially affecting the compression strength and causing failure through buckling. As explained above, the AE signals are direct evidence of the damage progression in the GFRPC material; i.e., fiber breakage mainly presents a waveform with high duration, high energy, and RA values less than unity; matrix cracking has a waveform with low duration, low energy levels, and also RA values less than unity; and AE descriptors for delamination and matrix/fiber debonding are more complex, with the latter showing higher duration and higher energy than matrix cracking and RA values greater than unity, whereas for delamination, waveforms are associated with higher duration but lower energy than matrix/fiber debonding and RA values above unity.
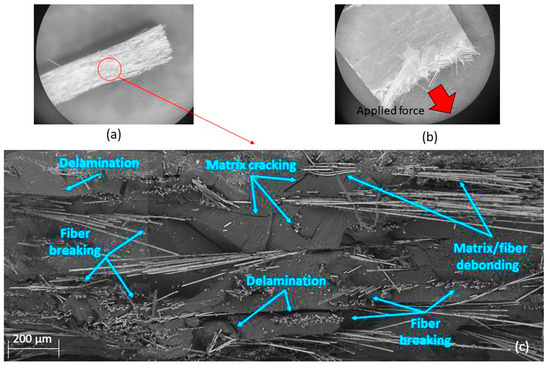
Figure 12.
SEM images showing (a) a damaged GFRPC specimen after testing, (b) tensile loading direction for a GFRPC specimen, and (c) damage mechanisms of a GFRPC specimen.
4. Conclusions
This study utilized an AE technique in conjunction with unsupervised learning methods as a non-invasive way to evaluate the structural damage modes of GFRPC materials under mechanical loading. The testing in this study was performed on GFRPC specimens, as well as their constituent materials—fibers and polymer—in separate experimental setups. Each experiment provided essential information for the different observed damage mechanisms of the composite material. In the case of the polymer material, bending tests were conducted to obtain information about the initial cracks in the matrix and how these cracks propagated during the flexural loading. Tensile tests were conducted on glass fiber material to obtain their breaking load as well as key characteristics for the AE signals emitted during the loading and breaking of fibers. In the testing of the GFRPC specimens, tensile loading was applied to record AE signals, which, in addition to fiber breakage and matrix cracking, included identifying interfacial debonding between fibers and the polymer matrix and delamination of the layers. The AE data selection comprised 11 descriptors that offered rich information during testing. For this reason, unsupervised learning algorithms, such as PCA and the KSOM method, were employed to identify the most appropriate and suitable AE descriptors for damage analysis. These AE descriptors included risetime, energy, amplitude, duration, and peak frequency. This study also aimed to identify the mode of damage based on experimental data derived from the AE data and existing data in the technical literature in the case of peak frequency. However, it was shown that further analysis of the other selected AE descriptors is required to define the clusters of each damage mode sufficiently.
The major damage mode in GFRPC materials was matrix cracking, evident in the specimen from the onset of mechanical loading, with 38.6% of AE hits. This damage mode was distinguished by a waveform exhibiting short duration, low energy levels, and RA values less than unity. On the other hand, the damage mechanism of fiber breakage was less prevalent, characterized by a waveform exhibiting prolonged length, significant energy, and RA values less than unity. Regarding AE hits, fiber breakage accounted for just 6.3% of the AE hits. Additional damage types seen in the failure of the GFRPC specimens included matrix/fiber debonding, with 34.9% of AE hits, which was the second damage mode to appear, and finally delamination, which was the third damage mode to occur with 20.1% of the AE hits.
Energy was found to be an important AE descriptor to consider, as fiber breakage accounted for approximately 88.1% of the total energy, while matrix cracking accounted only for around 1.6%. Accordingly, the energy required for fiber breakage was 54 times greater than that for matrix cracking. Clearly, the fibers serve as an effective reinforcement in polymer resin, highly augmenting the composite material’s mechanical strength.
The utilization of machine learning techniques and augmenting AE descriptors was shown to be an effective means for identifying and classifying damage modes and evaluating structural integrity in GFRPC materials. However, different damage mechanisms often produce overlapping AE signals, making precise classification challenging despite PCA and KSOM methods. The effectiveness of PCA and SOM heavily depends on the quality, quantity, and consistency of AE data causing some limitations. In addition, inconsistent sensor placement or environmental noise can adversely affect model performance. Directions for future research on GFRPC materials should investigate other AE characteristics, such as signal strength and absolute energy, which may complement the present findings regarding the various damage modes involved in mechanical failures. On the other hand, integrating KSOM method with supervised learning models (e.g., SVMs, neural networks) can improve classification accuracy and automated damage labeling. Other opportunities could be developed by applying this methodology to a wider range of composites (e.g., carbon or basalt fiber reinforced polymers) and environmental conditions to assess robustness and generalizability.
Author Contributions
Conceptualization, J.P.M. and P.M.; methodology and software, J.P.M. and H.N.; validation and formal analysis, J.P.M.; investigation, J.P.M. and H.N.; resources, H.N. and P.M.; data curation, J.P.M.; writing—original draft preparation, J.P.M.; writing—review and editing, H.N. and P.M.; visualization, J.P.M.; supervision, P.M.; project administration, P.M.; funding acquisition, P.M. All authors have read and agreed to the published version of the manuscript.
Funding
This research was funded an Alliance Grant by the Natural Sciences and Engineering Research Council of Canada, with grant number ALLRP 568487-21.
Data Availability Statement
The original contributions presented in the study are included in the article, further inquiries can be directed at the corresponding author.
Acknowledgments
The authors would like to gratefully acknowledge the support of the nanoFAB laboratory at the University of Alberta in providing the facility for conducting the SEM study.
Conflicts of Interest
Author Hadi Nazaripoor was employed by the company Flexpipe, Mattr Infrastructure Technologies. The remaining authors declare that the research was conducted in the absence of any commercial or financial relationships that could be construed as a potential conflict of interest.
References
- Rajak, D.K.; Pagar, D.D.; Menezes, P.; Linul, E. Fiber-Reinforced Polymer Composites: Manufacturing, Properties, and Applications. Polymers 2019, 11, 1667. [Google Scholar] [CrossRef] [PubMed]
- Rajak, D.K.; Wagh, P.H.; Linul, E. Manufacturing Technologies of Carbon/Glass Fiber-Reinforced Polymer Composites and Their Properties: A Review. Polymers 2021, 13, 3721. [Google Scholar] [CrossRef] [PubMed]
- Alabtah, F.A.; Mahdi, E.; Eliyan, F.F. The use of fiber reinforced polymeric composites in pipelines: A review. Compos. Struct. 2021, 276, 114595. [Google Scholar] [CrossRef]
- Rubio-González, C.; del Pilar de Urquijo-Ventura, M.; Rodríguez-González, J.A. Damage progression monitoring using self-sensing capability and acoustic emission on glass fiber/epoxy composites and damage classification through principal component analysis. Compos. B Eng. 2023, 254, 110608. [Google Scholar] [CrossRef]
- Duchene, P.; Chaki, S.; Ayadi, A.; Krawczak, P. A review of non-destructive techniques used for mechanical damage assessment in polymer composites. J. Mater. Sci. 2018, 53, 7915–7938. [Google Scholar] [CrossRef]
- Barre, S.; Benzeggagh, M.L. On the use of acoustic emission to investigate damage mechanisms in glass-fiber-reinforced-polypropylene. Compos. Sci. Technol. 1994, 52, 369–376. [Google Scholar] [CrossRef]
- Kotsikos, G.; Evans, J.T.; Gibson, A.G.; Hale, J.M. Environmentally enhanced fatigue damage in glass fibre reinforced composites characterised by acoustic emission. Compos. Part A Appl. Sci. Manuf. 2000, 31, 969–977. [Google Scholar] [CrossRef]
- Ceysson, O.; Salvia, M.; Vincent, L. Damage mechanisms characterisation of carbon fiber/epoxy composite laminates by both electrical resistance measurements and acoustic emission signals. Scr. Mater. 1996, 34, 1273–1280. [Google Scholar] [CrossRef]
- Kim, S.-T.; Lee, Y.-T. Characteristics of damage and fracture process of carbon fiber reinforced plastic under loading-unloading test by using AE method. Mater. Sci. Eng. 1997, 234–236, 322–326. [Google Scholar] [CrossRef]
- Harizi, W.; Chaki, S.; Bourse, G.; Ourak, M. Damage mechanisms assessment of Glass Fiber-Reinforced Polymer (GFRP) composites using multivariable analysis methods applied to acoustic emission data. Compos. Struct. 2022, 289, 115470. [Google Scholar] [CrossRef]
- Fotouhi, M.; Heidary, H.; Ahmadi, M.; Pashmforoush, F. Characterization of composite materials damage under quasi-static three-point bending test using wavelet and fuzzy C-means clustering. J. Compos. Mater. 2012, 46, 1795–1808. [Google Scholar] [CrossRef]
- Bohmann, T.; Schlamp, M.; Ehrlich, I. Acoustic emission of material damages in glass fibre-reinforced plastics. Compos. B Eng. 2018, 155, 444–451. [Google Scholar] [CrossRef]
- Ali, H.Q.; Tabrizi, I.E.; Khan, R.M.A.; Tufani, A.; Yildiz, M. Microscopic analysis of failure in woven carbon fabric laminates coupled with digital image correlation and acoustic emission. Compos. Struct. 2019, 230, 111515. [Google Scholar] [CrossRef]
- Das, A.K.; Suthar, D.; Leung, C.K. Machine learning based crack mode classification from unlabeled acoustic emission waveform features. Cem. Concr. Res. 2019, 121, 42–57. [Google Scholar] [CrossRef]
- Godin, N.; Huguet, S.; Gaertner, R. Integration of the Kohonen's self-organising map and k-means algorithm for the segmentation of the AE data collected during tensile tests on cross-ply composites. Ndt E Int. 2005, 38, 299–309. [Google Scholar] [CrossRef]
- Kharrat, M.; Placet, V.; Ramasso, E.; Boubakar, M.L. Influence of damage accumulation under fatigue loading on the AE-based health assessment of composite materials: Wave distortion and AE-features evolution as a function of damage level. Compos. Part A Appl. Sci. Manuf. 2018, 109, 615–627. [Google Scholar] [CrossRef]
- Godin, N.; Huguet, S.; Gaertner, R.; Salmon, L. Clustering of acoustic emission signals collected during tensile tests on unidirectional glass/polyester composite using supervised and unsupervised classifiers. Ndt E Int. 2004, 37, 253–264. [Google Scholar] [CrossRef]
- Johnson, M. Waveform based clustering and classification of AE transients in composite laminates using principal component analysis. Ndt E Int. 2002, 35, 367–376. [Google Scholar] [CrossRef]
- Marec, A.; Thomas, J.H.; El Guerjouma, R. Damage characterization of polymer-based composite materials: Multivariable analysis and wavelet transform for clustering acoustic emission data. MSSP 2008, 22, 1441–1464. [Google Scholar] [CrossRef]
- Zhou, W.; Zhao, W.-Z.; Zhang, Y.-N.; Ding, Z.-J. Cluster analysis of acoustic emission signals and deformation measurement for delaminated glass fiber epoxy composites. Compos. Struct. 2018, 195, 349–358. [Google Scholar] [CrossRef]
- Roundi, W.; El Mahi, A.; El Gharad, A.; Rebiere, J.-L. Acoustic emission monitoring of damage progression in Glass/Epoxy composites during static and fatigue tensile tests. Appl. Acoust. 2018, 132, 124–134. [Google Scholar] [CrossRef]
- Almeida, R.S.M.; Magalhães, M.D.; Karim, M.N.; Tushtev, K.; Rezwan, K. Identifying damage mechanisms of composites by acoustic emission and supervised machine learning. Mater. Des. 2023, 227, 111745. [Google Scholar] [CrossRef]
- Palacios Moreno, J.; Nazaripoor, H.; Mertiny, P. Damage Assessment and Classification of Glass Fiber-Reinforced Composite Materials During Tensile Tests Based on Acoustic Emission and Unsupervised Learning Approaches. In Proceedings of the American Society for Composites-Thirty-Eight Technical Conference, Boston, MS, USA, 17–20 September 2023. [Google Scholar]
- Abdi, H.; Williams, L.J. Principal component analysis. WIREs Comp. Stats. 2010, 2, 433–459. [Google Scholar] [CrossRef]
- Miljković, D. Brief review of self-organizing maps. In Proceedings of the 40th International Convention on Information and Communication Technology, Electronics and Microelectronics (MIPRO), Opatija, Croatia, 22–26 May 2017. [Google Scholar]
- Nazaripoor, H.; Ashrafizadeh, H.; Schultz, R.; Runka, J.; Mertiny, P. Acoustic Emission Damage Detection during Three-Point Bend Testing of Short Glass Fiber Reinforced Composite Panels: Integrity Assessment. J. Compos. Sci. 2022, 6, 48. [Google Scholar] [CrossRef]
- ASTM D7264; Standard Test Method for Flexural Properties of Polymer Matrix Composite Materials. ASTM International: West Conshohocken, PA, USA, 2007.
- ASTM D2256M-10; Standard Test Method for Tensile Properties of Yarns by the Single-Strand Method. ASTM International: West Conshohocken, PA, USA, 2015.
- ASTM D2343-17; Standard Test Method for Tensile Properties of Glass Fiber Strands, Yarns, and Rovings Used in Reinforced Plastics. ASTM International: West Conshohocken, PA, USA, 2009.
- ASTM D3039-17; Standard Test Method for Tensile Properties of Polymer Matrix Composite Materials. ASTM International: West Conshohocken, PA, USA, 2017.
- Kalteremidou, K.; Murray, B.R.; Tsangouri, E.; Aggelis, D.G.; Hemelrijck, D.V.; Pyl, L. Multiaxial damage characterization of carbon/epoxy angle-ply laminates under static tension by combining in situ microscopy with acoustic emission. Appl. Sci. 2018, 8, 2021. [Google Scholar] [CrossRef]
- Davies, D.L.; Bouldin, D.W. A Cluster Separation Measure. IEEE Trans. Pattern Anal. Mach. Intell. 2009, 2, 224–227. [Google Scholar] [CrossRef]
- Rousseeuw, P.J. Silhouettes: A graphical aid to the interpretation and validation of cluster analysis. J. Comput. Appl. Math. 1987, 20, 53–65. [Google Scholar] [CrossRef]
- Nikbakht, M.; Yousefi, J.; Hosseini-Toudeshky, H.; Minak, G. Delamination evaluation of composite laminates with different interface fiber orientations using acoustic emission features and micro visualization. Compos. B Eng. 2017, 113, 185–196. [Google Scholar] [CrossRef]
- Amenabar, I.; Mendikute, A.; López-Arraiza, A.; Lizaranzu, M.; Aurrekoetxea, J. Comparison and analysis of non-destructive testing techniques suitable for delamination inspection in wind turbine blades. Compos. B Eng. 2011, 42, 1298–1305. [Google Scholar] [CrossRef]
- Beheshtizadeh, N.; Mostafapour, A.; Davoodi, S. Three point bending test of glass/epoxy composite health monitoring by acoustic emission. Alex. Eng. J. 2019, 58, 567–578. [Google Scholar] [CrossRef]
- Aggelis, D.G.; Barkoula, N.; Matikas, T.E.; Paipetis, A.S. Acoustic structural health monitoring of composite materials: Damage identification and evaluation in cross ply laminates using acoustic emissions and ultrasonics. Compos. Technol. 2012, 72, 1127–1133. [Google Scholar] [CrossRef]
- Gates, A.J.; Ahn, Y.-Y. The Impact of Random Models on Clustering Similarity. JMLR 2017, 18, 1–28. [Google Scholar]
- Muir, C.; Tulshibagwale, N.; Furst, A.; Swaminathan, B.; Almansour, A.S.; Sevener, K.; Presby, M.; Kiser, J.D.; Pollock, T.M.; Daly, S.; et al. Quantitative Benchmarking of Acoustic Emission Machine Learning Frameworks for Damage Mechanism Identification. IMMI 2023, 12, 70–81. [Google Scholar] [CrossRef]
Disclaimer/Publisher’s Note: The statements, opinions and data contained in all publications are solely those of the individual author(s) and contributor(s) and not of MDPI and/or the editor(s). MDPI and/or the editor(s) disclaim responsibility for any injury to people or property resulting from any ideas, methods, instructions or products referred to in the content. |
© 2025 by the authors. Licensee MDPI, Basel, Switzerland. This article is an open access article distributed under the terms and conditions of the Creative Commons Attribution (CC BY) license (https://creativecommons.org/licenses/by/4.0/).