
Effects of Postcure and Degradation in Wet Layup Carbon/Epoxy Composites Using Shear-Based Metrics


Abstract

1. Introduction
2. Materials and Test Conditions
2.1. Material System Details
2.2. Specimens and Test Methods
3. Results and Discussion
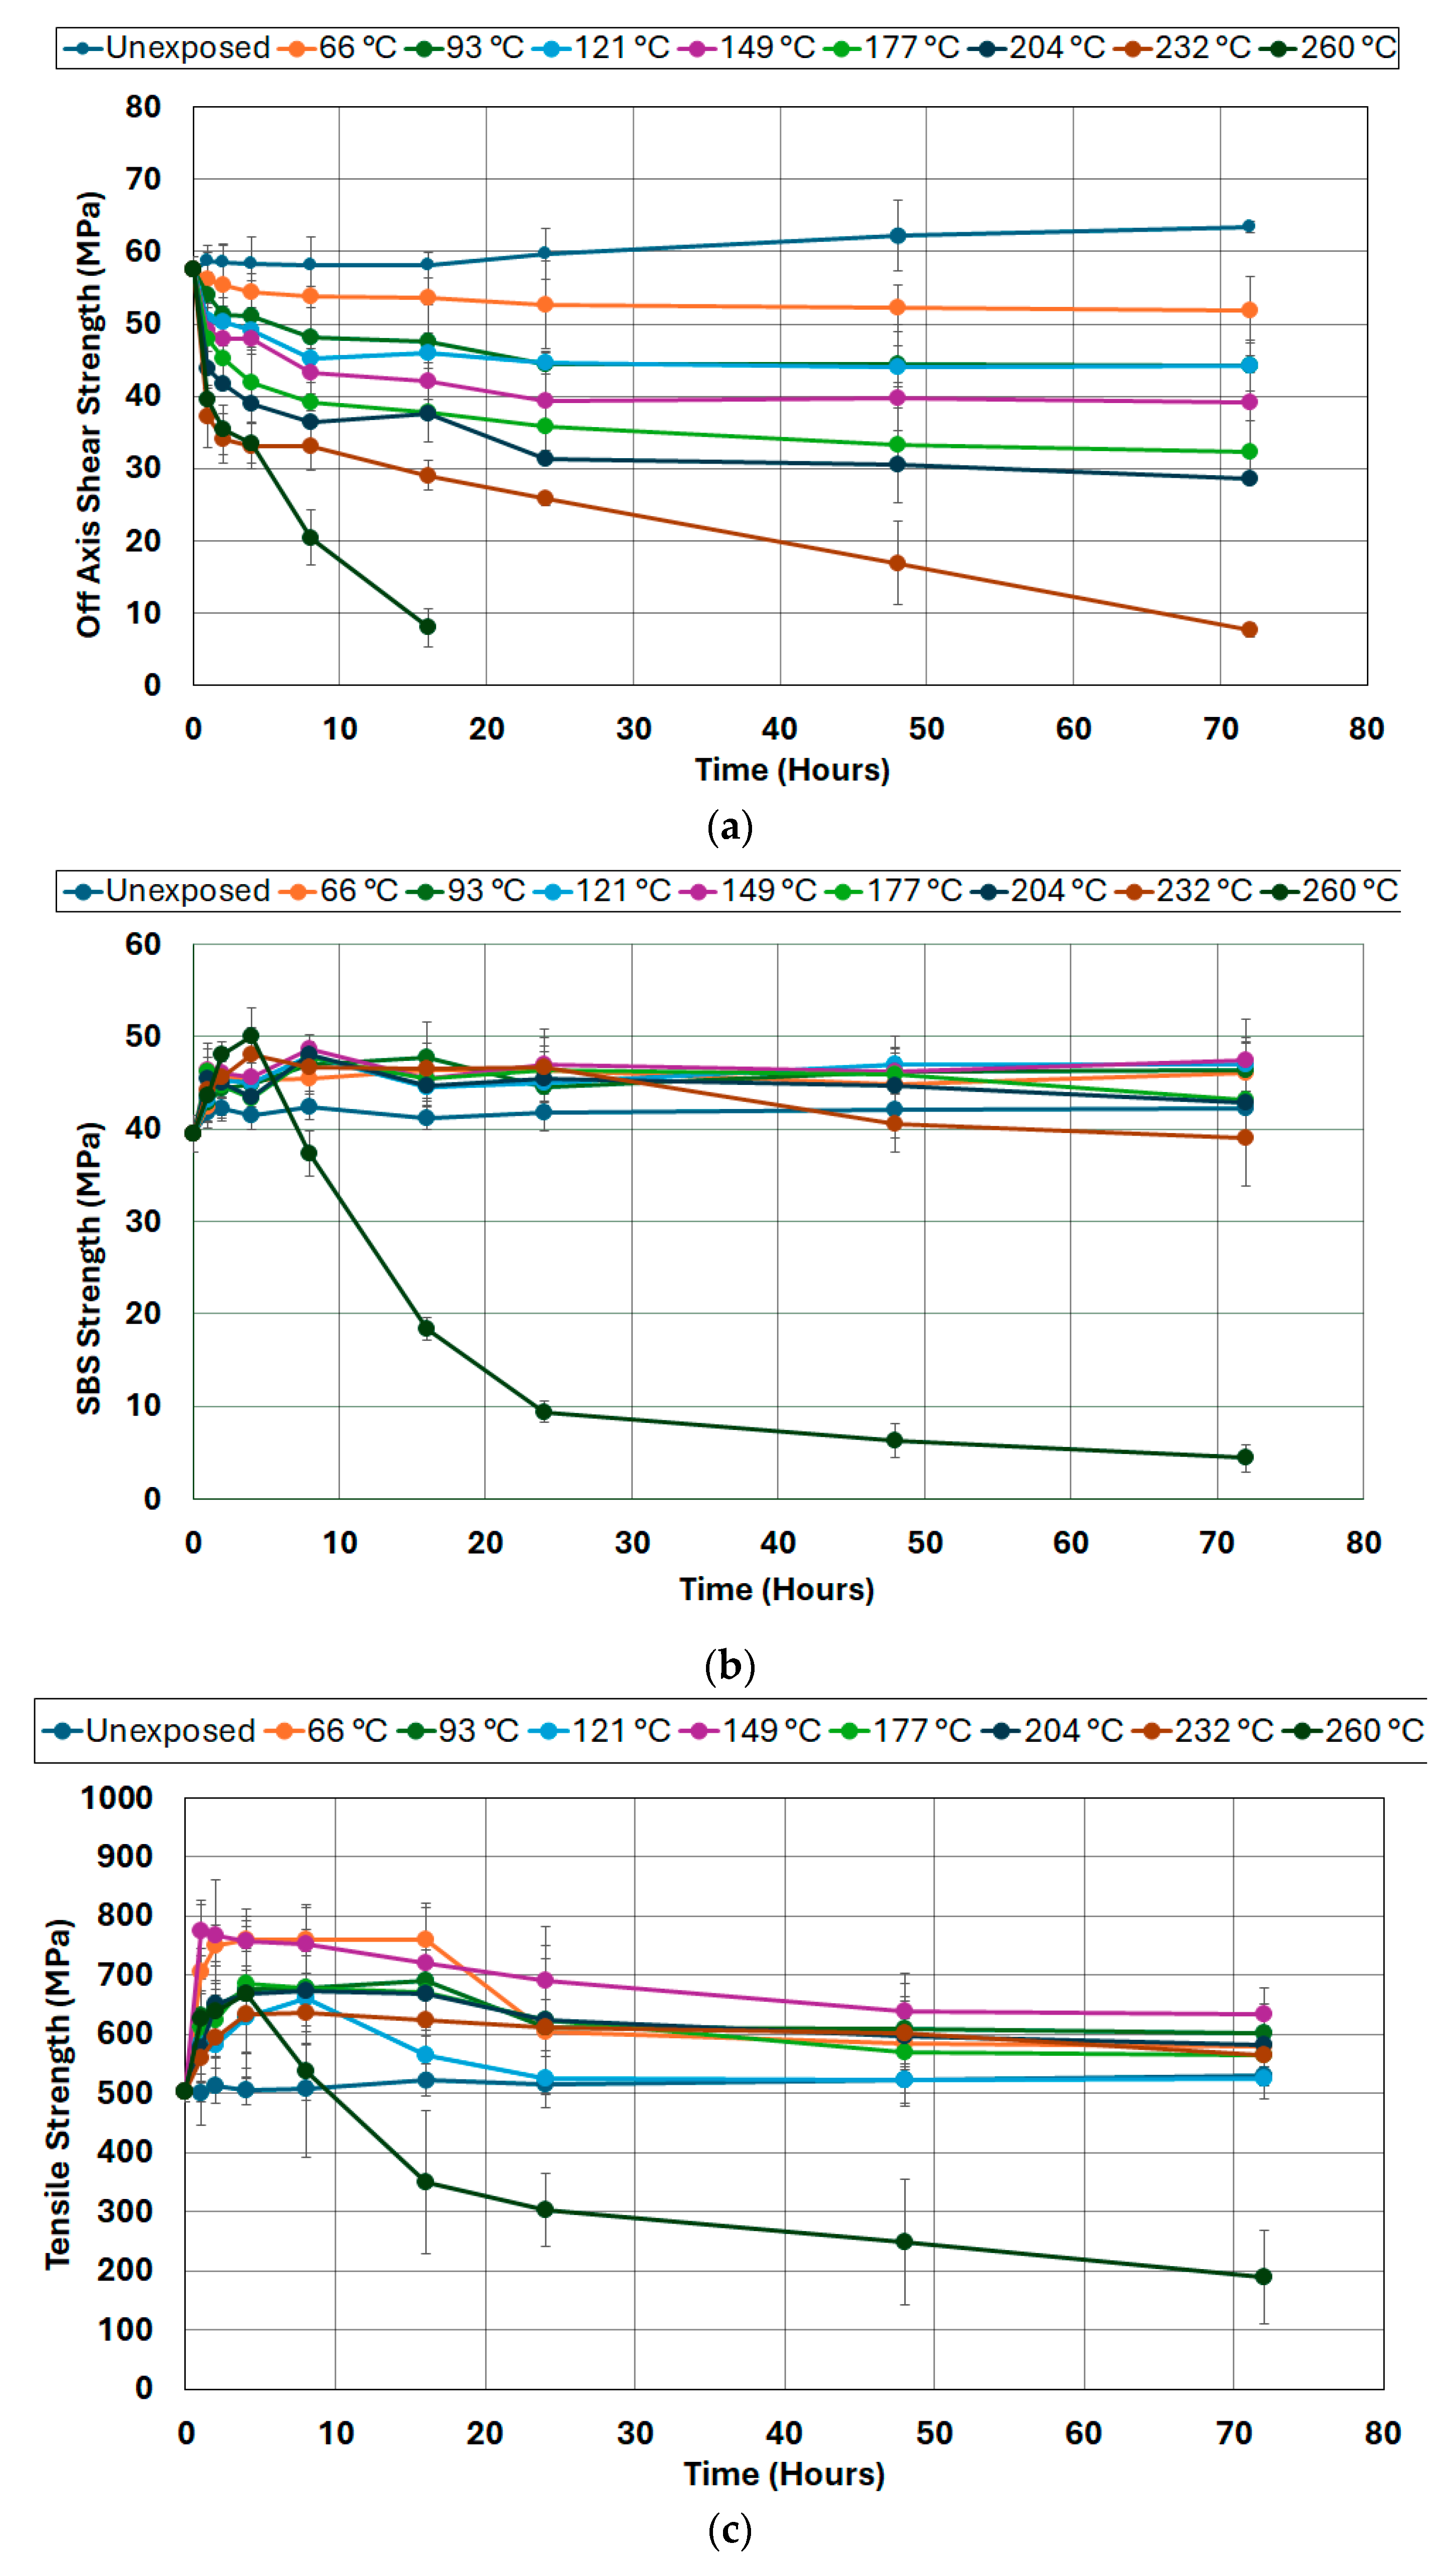
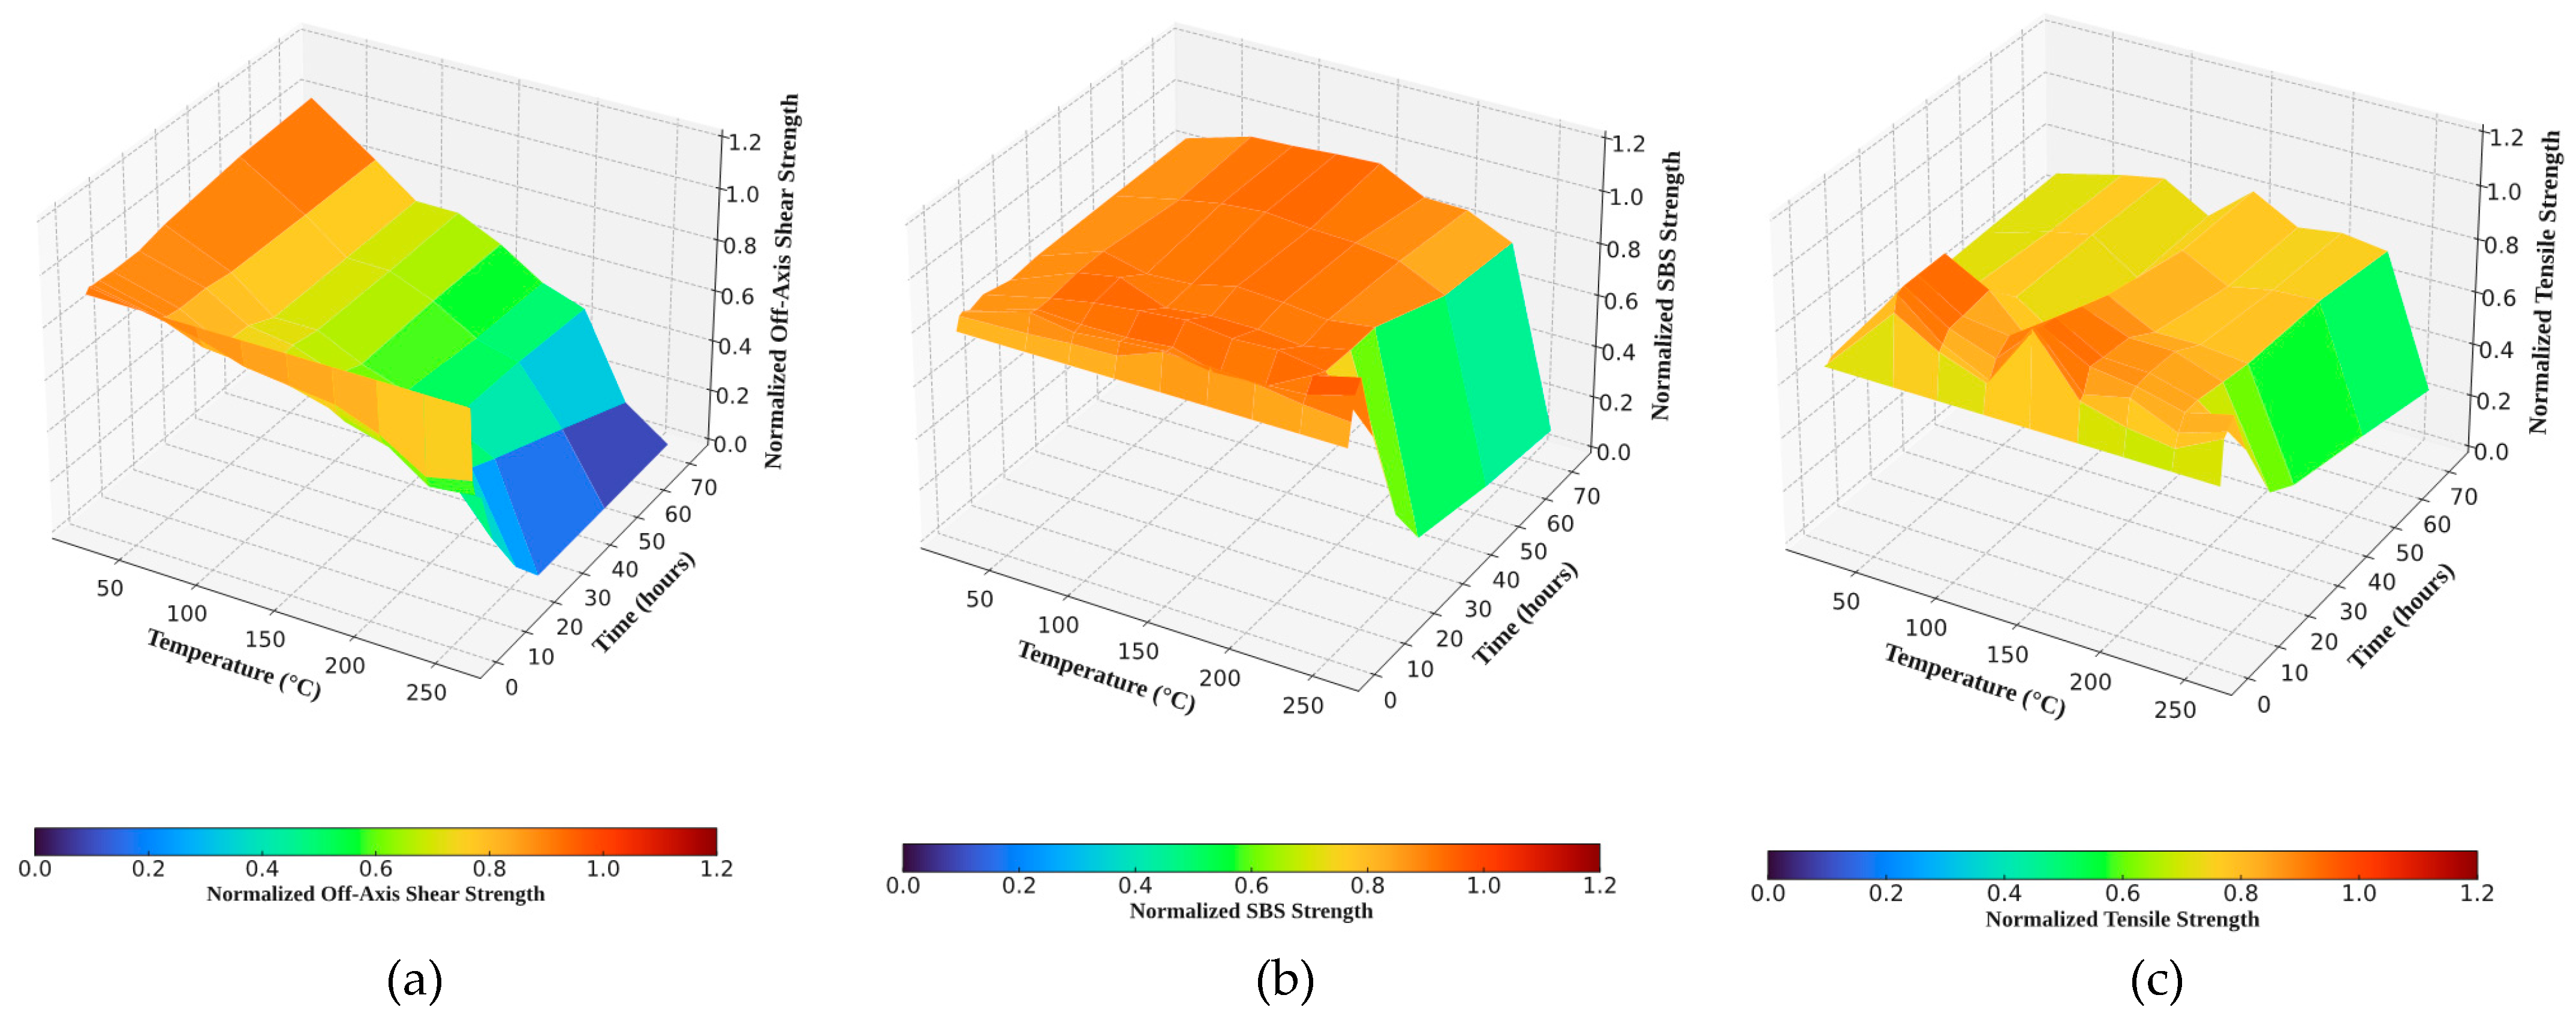
3.1. Effects of Thermal Aging
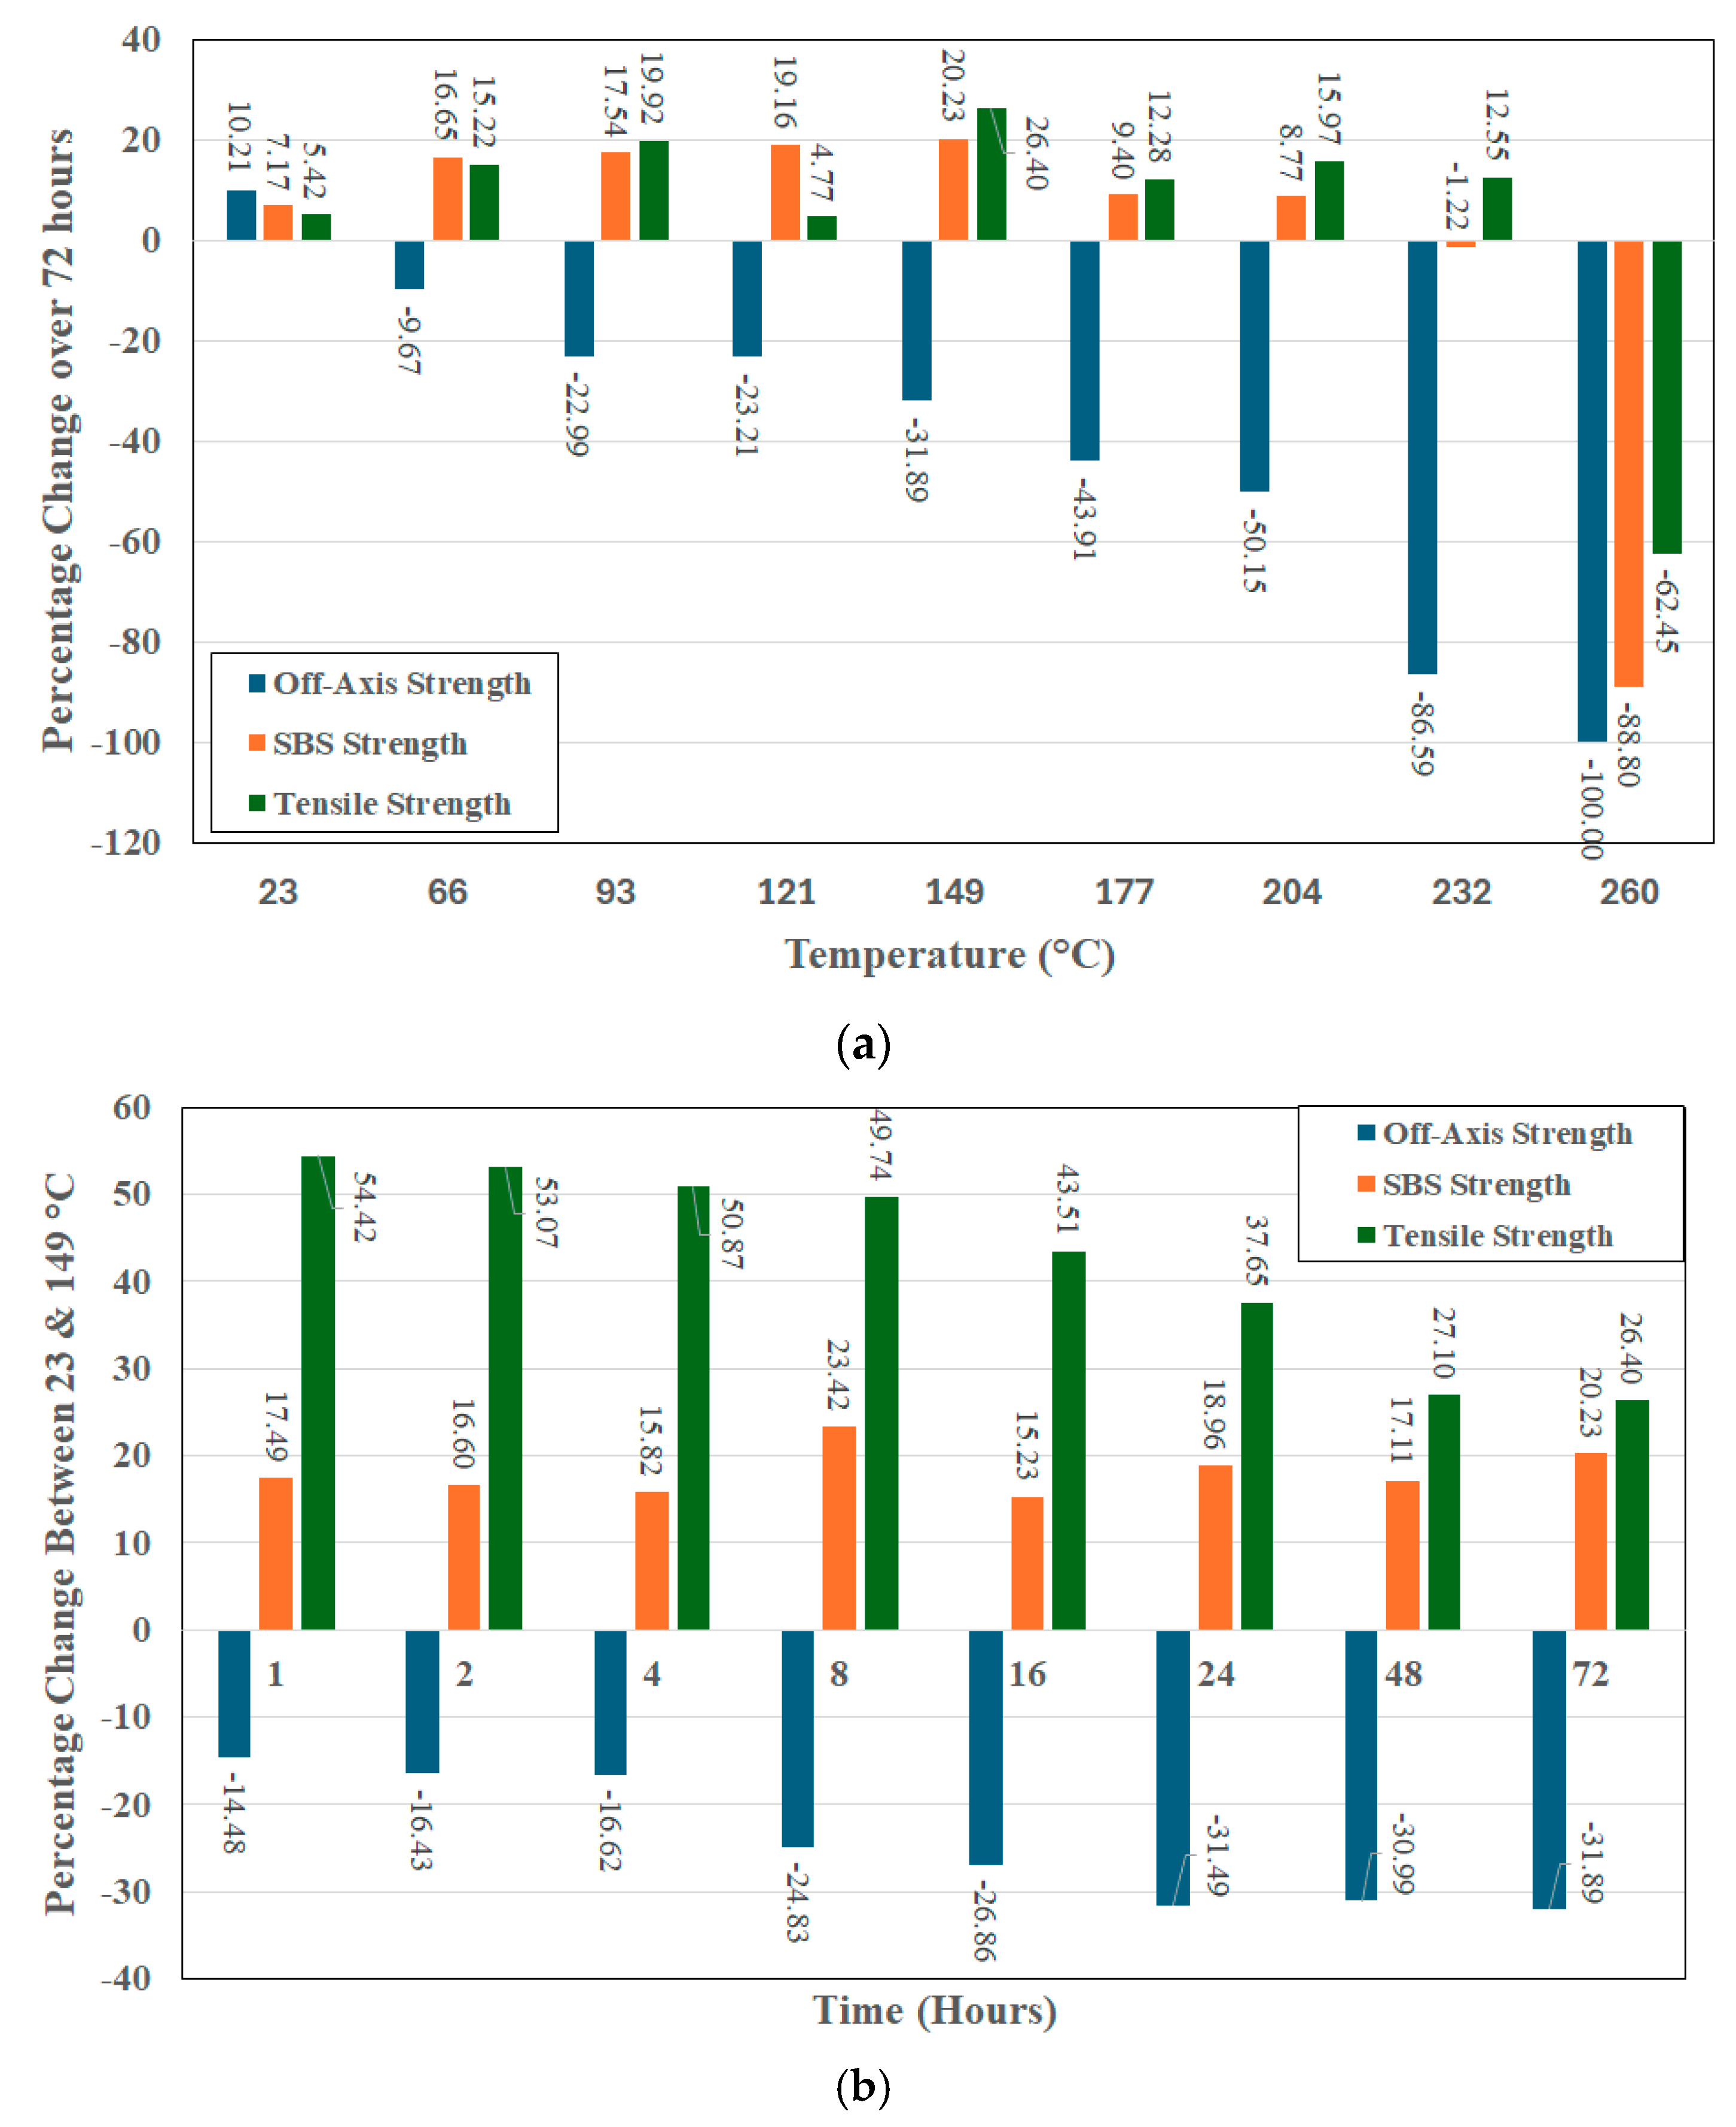
3.2. Assessment Through Strength Ratios
3.3. Modeling of SBS Response
4. Summary and Conclusions
Author Contributions
Funding
Institutional Review Board Statement
Informed Consent Statement
Data Availability Statement
Acknowledgments
Conflicts of Interest
References
- Feih, S.; Moritz, A.P. Tensile properties of carbon fibers and carbon fibre-polymer composites in fire. Compos. A 2012, 43, 765–772. [Google Scholar] [CrossRef]
- Yin, Y.; Binner, J.G.P.; Cross, T.E.; Marshall, S.J. The oxidation behavior of carbon fibers. J. Mater. Sci. 1994, 29, 2250–2254. [Google Scholar] [CrossRef]
- Moritz, A.P.; Gibson, A.G. Fire Properties of Polymer Composite Materials; Springer: Dordrecht, The Netherlands, 2006. [Google Scholar]
- Barbosa, A.P.C.; Fulco, A.P.P.; Guerra, E.S.S.; Arakaki, F.K.; Tosatto, M.; Costa, M.C.B.; Melo, J.D.D. Accelerated aging effects on carbon fiber/epoxy composites. Compos. B 2017, 110, 298–306. [Google Scholar]
- Ernault, E.; Richaud, E.; Fayolle, B. Origin of epoxies embrittlement during oxidative aging. Polym. Test. 2017, 63, 448–454. [Google Scholar] [CrossRef]
- Odegard, G.M.; Bandyopadhyay, A. Physical aging of epoxy polymers and their composites. J. Polym. Sci. B Polym. Phys. 2011, 49, 1695–1716. [Google Scholar] [CrossRef]
- Srivastava, C.; Grammatikos, S. On the degradation and lifetime prediction of filament wound composites subjected to thermal environment sub-Tg aging, Chapter 14. In A Review of Recent Advances in Additive Manufacuring with Polymer Materials; Alcock, B., Andreassen, E., Eds.; Taylor and Francis, Routledge: Abingdon, UK, 2024. [Google Scholar]
- Pang, K.P.; Gillham, J.K. Competition between cure and thermal degradation in high Tg epoxy systems: Effect of time and temperature of isothermal cure on the glass transition temperature. J. Appl. Polym. Sci. 1990, 39, 909–933. [Google Scholar] [CrossRef]
- Haque, M.H.; Updhyaya, P.; Roy, S.; Ware, T.; Voit, W.; Lu, H. The change in flexural properties and microstructures of carbon fiber bismaleimide composite after exposure to high temperature. Compos. Struct. 2014, 108, 57–64. [Google Scholar] [CrossRef]
- Bai, Y.; Vallee, T.; Keller, T. Modeling of thermal responses for FRP composites under elevated and high temperatures. Compos. Sci. Technol. 2008, 68, 47–56. [Google Scholar] [CrossRef]
- Colin, X.; Verdu, J. Strategy for studying thermal oxidation of organic matrix composites. Compos. Sci. Technol. 2005, 65, 411–419. [Google Scholar] [CrossRef]
- Garcia-Moreno, I.; Caminero, M.A.; Rodriguez, G.P.; Lopez-Cela, J.J. Effect of thermal aging on the impact and flexural damage behaviour of carbon fibre-reinforced epoxy laminates. Polymers 2019, 11, 80. [Google Scholar] [CrossRef]
- Zavatta, N.; Rondina, F.; Faluschett, M.P.; Donati, L. Effect of thermal ageing on the mechanical strength of carbon fibre reinforced epoxy composites. Polymers 2021, 13, 2006. [Google Scholar] [CrossRef] [PubMed]
- Alawar, A.; Bosze, E.J.; Nutt, S.R. A composite power conductor for low sag at high temperatures. IEEE Trans. Power Deliv. 2005, 20, 2193–2199. [Google Scholar] [CrossRef]
- Bosze, E.J.; Alawar, A.; Bertschger, O.; Tsai, Y.-I.; Nutt, S.R. High temperature strength and storage modulus in unidirectional hybrid composites. Compos. Sci. Technol. 2006, 66, 1963–1969. [Google Scholar] [CrossRef]
- Holliday, R.J.; Gibson, A.G.; Humphrey, J.; DiModica, P.; Christko, S.; Kotsikas, G. Post-fire structural integrity of composite gradings for offshore platforms. In Proceedings of the SPE Offshore Europe Oil and Gas Conference, Aberdeen, UK, 3–6 September 2013. Paper #SPE-166587-M6. [Google Scholar]
- Brkic, D.; Praks, P. Probability analysis and prevention of offshore oil and gas accidents: Fire A Cause consequence. Fire 2021, 4, 71. [Google Scholar] [CrossRef]
- Li, C.; Yin, X.; Wang, Y.; Zhang, L.; Zhang, Z.; Liu, Y.; Xian, G. Mechanical property evolution and service life prediction of pultruded carbon/glass hybrid rod exposed in harsh oil-well condition. Compos. Struct. 2020, 246, 112418. [Google Scholar] [CrossRef]
- Amaechi, C.V.; Chesterton, C.; Butler, H.D.; Gillet, N.; Wang, C.; Jae, I.A.; Reda, A.; Odijie, A.C. Review of composite marine risers for deep water applications: Design development and mechanics. J. Compos. Sci. 2022, 6, 96. [Google Scholar] [CrossRef]
- Yuan, Y.; Goodson, J.E. Advanced composite downhole applications and the HTHP environmental challenges. In Proceedings of the Corrosion 2004, New Orleans, LA, USA, 28 March–1 April 2004. Paper #NACE-04616. [Google Scholar]
- Bisby, L.A.; Green, M.F.; Kodur, V.K.R. Response to fire of concrete structures that incorporate FRP. Prog. Struct. Eng. Mater. 2005, 7, 136–149. [Google Scholar] [CrossRef]
- Firmo, J.P.; Correia, J.R.; Bisby, L.A. Fire behavior of FRP-strengthened reinforced concrete structural elements: A state-of-the-art review. Compos. B 2015, 80, 198–216. [Google Scholar] [CrossRef]
- Singh, S.P.; Sethi, A. A review of performance of fibre reinforced polymer strengthened structures under fire exposure. Proc. Indian Natl. Sci. Acad. 2017, 83, 521–532. [Google Scholar]
- Bazli, M.D.; Abolfazli, M. Mechanical properties of fibre reinforced polymers under elevated temperatures: An Overview. Polymers 2020, 12, 2600. [Google Scholar] [CrossRef]
- Moritz, A.P.; Mathys, Z. Post-fire mechanical properties of marine polymer composites. Compos. Struct. 1999, 47, 643–653. [Google Scholar] [CrossRef]
- Bai, Y.; Keller, T. High Temperature Performance of Polymer Composites; Wiley-VCH Verlag GmBH & Co.: Weinheim, Germany, 2014. [Google Scholar]
- Moritz, A.P.; Feih, S.; Kandare, E.; Mathys, Z.; Gibson, A.G.; Des Jardin, P.E.; Case, S.W.; Lattimer, B.Y. Review of fire structural modelling of polymer composites. Compos. A 2009, 40, 1800–1814. [Google Scholar] [CrossRef]
- Correia, J.R.; Gomes, M.M.; Pires, J.M.; Branco, F.A. Mechanical behavior of pultruded glass fiber reinforced polymer composites at elevated temperatures: Experimental and model assessment. Compos. Struct. 2013, 98, 303–313. [Google Scholar] [CrossRef]
- Lee, Y.; Zuo, M.; Deng, Q.; Lin, Y.; Mai, Z.; Lin, S.; Zhang, X.; Deng, Y.; Li, W. Temperature-dependent strength modelling of fiber reinforced composites considering critical properties evolution. Int. J. Mech. Sci. 2024, 272, 109168. [Google Scholar] [CrossRef]
- Zhang, X.; Li, W.; Shao, L.-H.; Li, Y.; Wang, J. Micromechanics-based modeling of temperature-dependent effective moduli of fiber reinforced polymer composites with interfacial debonding. Compos. A 2024, 180, 108049. [Google Scholar] [CrossRef]
- Li, C.; Xian, G. Mechanical property evolution and life prediction of carbon fiber and pultruded carbon fiber reinforced polymer plate exposed to elevated temperatures. Polym. Compos. 2020, 41, 5143–5155. [Google Scholar] [CrossRef]
- Hawileh, R.A.; Abu-Obeideah, A.; Abdalla, J.A.; Al-Tamimi, A. Temperature effects on the mechanical properties of carbon, glass and carbon-glass FRP laminates. Constr. Build. Mater. 2015, 75, 342–348. [Google Scholar] [CrossRef]
- Cao, S.; Wu, Z.; Wang, X. Tensile properties of CFRP and hybrid FRP composites at elevated temperatures. J. Compos. Mater. 2009, 43, 315–330. [Google Scholar] [CrossRef]
- Wang, K.; Young, B.; Smith, S.T. Mechanical properties of pultruded carbon fibre-reinforced f polymer (CFRP) plates at elevated temperature. Eng. Struct. 2011, 33, 2154–2161. [Google Scholar] [CrossRef]
- Foster, S.K.; Bisby, L.A. High temperature residual properties of externally bonded FRP system. In Proceedings of the 7th International Symposium of Fiber-Reinforced (FRP) Polymer Reinforcement for Concrete Structures (FRPRCS-7), New Orleans, LA, USA, 6–9 November 2005. [Google Scholar]
- Liu, H.; Gu, Y.; Li, M.; Li, Y.; Zhang, Z. Correlation of temperature dependencies of macro- and micro-interfacial properties in carbon fiber/epoxy resin composite. J. Reinf. Plast. Compos. 2013, 32, 371–379. [Google Scholar] [CrossRef]
- Lundahl, C.E.; Kriner, J.H. Effective composite properties on interlaminar shear strength. In Proceedings of the 31st International SAMPE Symposium, Anaheim, CA, USA; 1986. [Google Scholar]
- Nema, A.; Mallineni, C.N.; Penumakala, P.K.; Adusumalli, R.; Tejasvi, K.; Buragohain, M.K. Effect of temperature and flexural and interlaminar shear strength properties of carbon-epoxy composites: Experiment and modeling. Polym. Compos. 2024, 45, 9139–9155. [Google Scholar] [CrossRef]
- Kodur, V.K.R.; Bisby, L.A.; Foo, S.H. Thermal behavior of fire-exposed concrete slabs reinforced with fiber-reinforced polymer bars. ACI Struct. J. 2005, 102, 799. [Google Scholar]
- Bazli, M.; Ashrafi, H.; Jafari, A.; Zhao, X.-L.; Gholipour, H.; Oskouei, A.V. Effect of thickness and reinforcement configuration on flexural and impact behavior of GFRP laminates after exposure to elevated temperatures. Compos. B 2019, 157, 76–99. [Google Scholar] [CrossRef]
- Karbhari, V.M.; Hong, S.K. Effect of sequential thermal aging and water immersion on moisture kinetics and SBS strength of wet layup carbon/epoxy composites. J. Compos. Sci. 2022, 6, 306. [Google Scholar] [CrossRef]
- ASTM D3171-22; Standard Test Methods for Constituent Content of Composite Materials. ASTM International: West Conshocken, PA, USA, 2022.
- ASTM D3039/D3039M-17; Standard Test Method for Tensile Properties of Polymer Matrix Composite Materials. ASTM International: West Conshocken, PA, USA, 2017.
- ASTMD3518/3518M-18; Standard Test Method for In-Plane Shear Response of Polymer Matrix Composite Materials by Tensile Test of a ± 45° Laminate. ASTM International: West Conshocken, PA, USA, 2018.
- Pindera, M.J.; Herakovich, C.T. Shear characterization of unidirectional composites with the off-axis tension test. Exp. Mech. 1986, 26, 103–112. [Google Scholar] [CrossRef]
- ASTMD2344/D2344M; Standard Test Method for Short-Beam-Shear Strength of Polymer Matrix Composite Materials and Their Laminates. ASTM International: West Conshocken, PA, USA, 2022.
- Hong, S.K.; Karbhari, V.M. Effect of thermal exposure on residual properties of wet layup carbon fiber reinforced epoxy composites. Polymers 2022, 14, 2957. [Google Scholar] [CrossRef]
- ACI-440.2R-17; Guide for the Design and Construction of Externally Bonded FRP Systems for Strengthening Concrete Structures. American Concrete Institute: Farmington Hills, MI, USA, 2017.
- Ascione, L.; Caron, J.-F.; Godonou, P.; van IJselmuijden, K.; Knippers, J.; Mottram, T.; Oppe, M.; Sorensen, M.G.; Taby, J.; Tromp, L. Prospect for New Guidance in the Design of, FRP; Ascione, L., Gutierrez, E., Dimova, S., Pinto, A., Denton, S., Eds.; Report EUR 27666 EN; Joint Research Centre: Ispra, Italy, 2016. [Google Scholar]
- CEN/TS 19101:2022; Design of Fibre-Polymer Composite Structures. European Committee for Standardization, CEN/TC 250: Brussels, Belgium, 2022.
- fib Bulletin. Externally Applied FRP Reinforcement for Concrete Structures; Technical Report, Task Group 5.1, fiB; Joint Research Centre: Ispra, Italy, 2019. [Google Scholar]
- JSCE. Recommendation for Design and Construction of Concrete Structures Using Continuous Fiber Reinforcing Material; Concrete Engineering Series 23; Machida, A., Ed.; Japan Society of Civil Engineers: Tokyo, Japan, 1997. [Google Scholar]
- Tan, W.; Jiang, Y.; Wang, G.; Na, J.; Jin, Q. The influence of thermal aging on the interlaminar mechanical properties and failure mechanisms of CFRP under complex stress states. Mech. Adv. Mater. Struct. 2025, 1–18. [Google Scholar] [CrossRef]
- Akay, M.; Spratt, G.; Meenan, B. The effects of long-term exposure to high temperature on the ILSS and impact performance of carbon fibre reinforced bismaleimide. Compos. Sci. Technol. 2003, 63, 1053–1059. [Google Scholar] [CrossRef]
- Birger, S.; Moshonov, A.; Kenig, S. The effects of thermal and hygrothermal aging on the failure modes of graphite-fabric epoxy composite subject to flexural loading. Composites 1989, 20, 341–348. [Google Scholar] [CrossRef]
- Hong, B.; Xian, G.; Wang, Z. Durability study of pultruded carbon fiber reinforced polymer plates subjected to water immersion. Adv. Struct. Eng. 2018, 20, 571–579. [Google Scholar] [CrossRef]
- Abanilla, M.A.; Karbhari, V.M.; Li, Y. Interlaminar and intralaminar durability characterization of wet layup carbon/epoxy used in external strengthening. Compos. B 2006, 37, 650–661. [Google Scholar] [CrossRef]
- Rothenhausler, F.; Ruckdaeschel, H. Interplay of curing and thermal degradation in epoxy resins cured with amino acids: Influence of the maximum curing temperature on the network structure crystal morphology and mechanical properties. J. Appl. Polym. Sci. 2023, 140, e54653. [Google Scholar] [CrossRef]
- Ningyan, W.; Evans, J.T. Collapse of continuous fibre composite beams at elevated temperatures. Composites 1995, 26, 56–61. [Google Scholar] [CrossRef]
- Loos, A.C.; Springer, G.S. Effects of thermal spiking on graphite-epoxy composites. J. Compos. Mater. 1979, 13, 17–34. [Google Scholar] [CrossRef]
- Liever, A.; Lin, Y.; Vemuganti, S. Effect of immediate curing at elevated temperatures on the tensile and interfacial properties of carbon fiber-epoxy composites. Funct. Compos. Struct. 2024, 6, 035001. [Google Scholar] [CrossRef]
- Pricop, P.M.; Oncica, V.; Scurtu, I.C. Factor of safety in offshore structures design according to environmental loads. Nav. Acad. Sci. Bull. 2013, XVI, 152–157. [Google Scholar]
- Stacey, A.; Sharp, J.V. Safety factor requirements for the offshore industry. Eng. Fail. Anal. 2007, 14, 442–458. [Google Scholar] [CrossRef]
- Copello, S.; Magliano, M.; Manera, A. Minimum requirements for decision making and maintenance of existing fixed offshore structures. In Proceedings of the Offshore Mediterranean Conference and Exhibition, Ravena, Italy, 2017; p. OMC-2017-558. [Google Scholar]


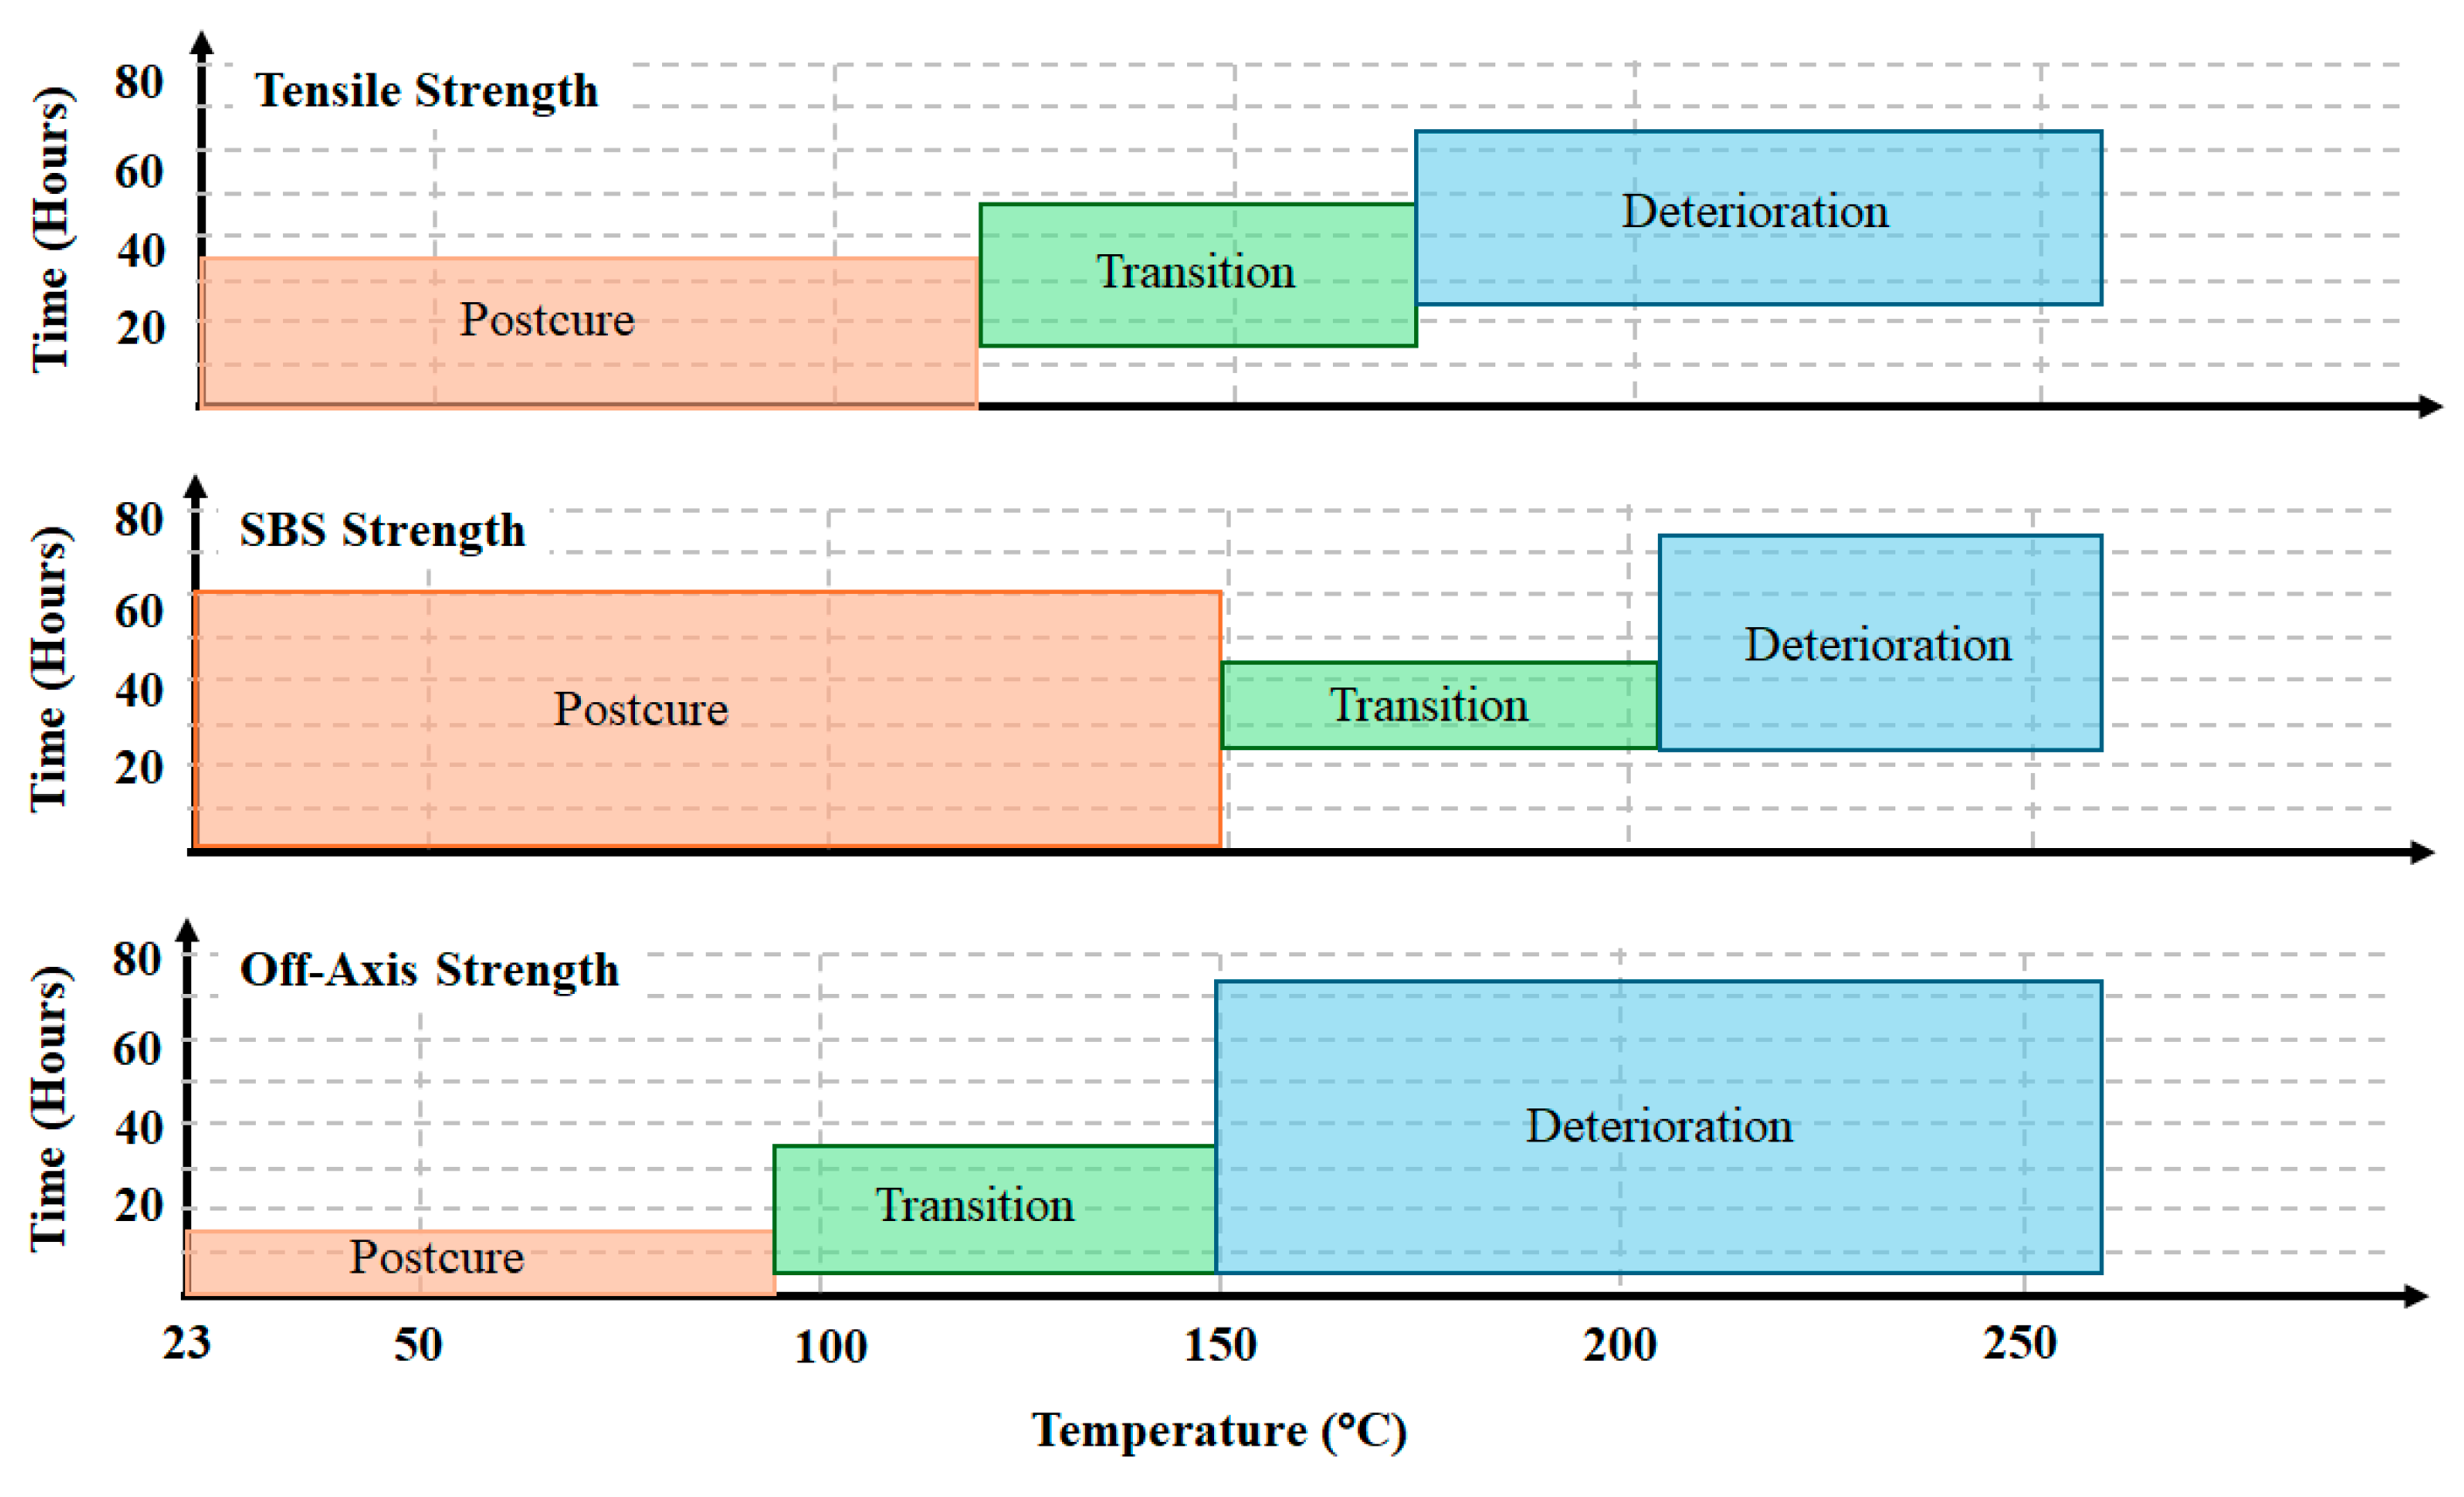
| Characteristic | Zone I (Postcure Dominant) | Zone II (Transition) | Zone III (Deterioration Dominant) |
|---|---|---|---|
| Off-axis Strength | ≤93 °C, ≤18 h | 93–149 °C, 6–36 h | ≥149 °C, ≥12 h |
| SBS Strength | ≤149 °C, ≤60 h | 149–204 °C, 24–48 h | ≥204 °C, ≥24 h |
| Tensile Strength | ≤121 °C, ≤36 h | 121–177 °C, 12–48 h | ≥177 °C, ≥24 h |
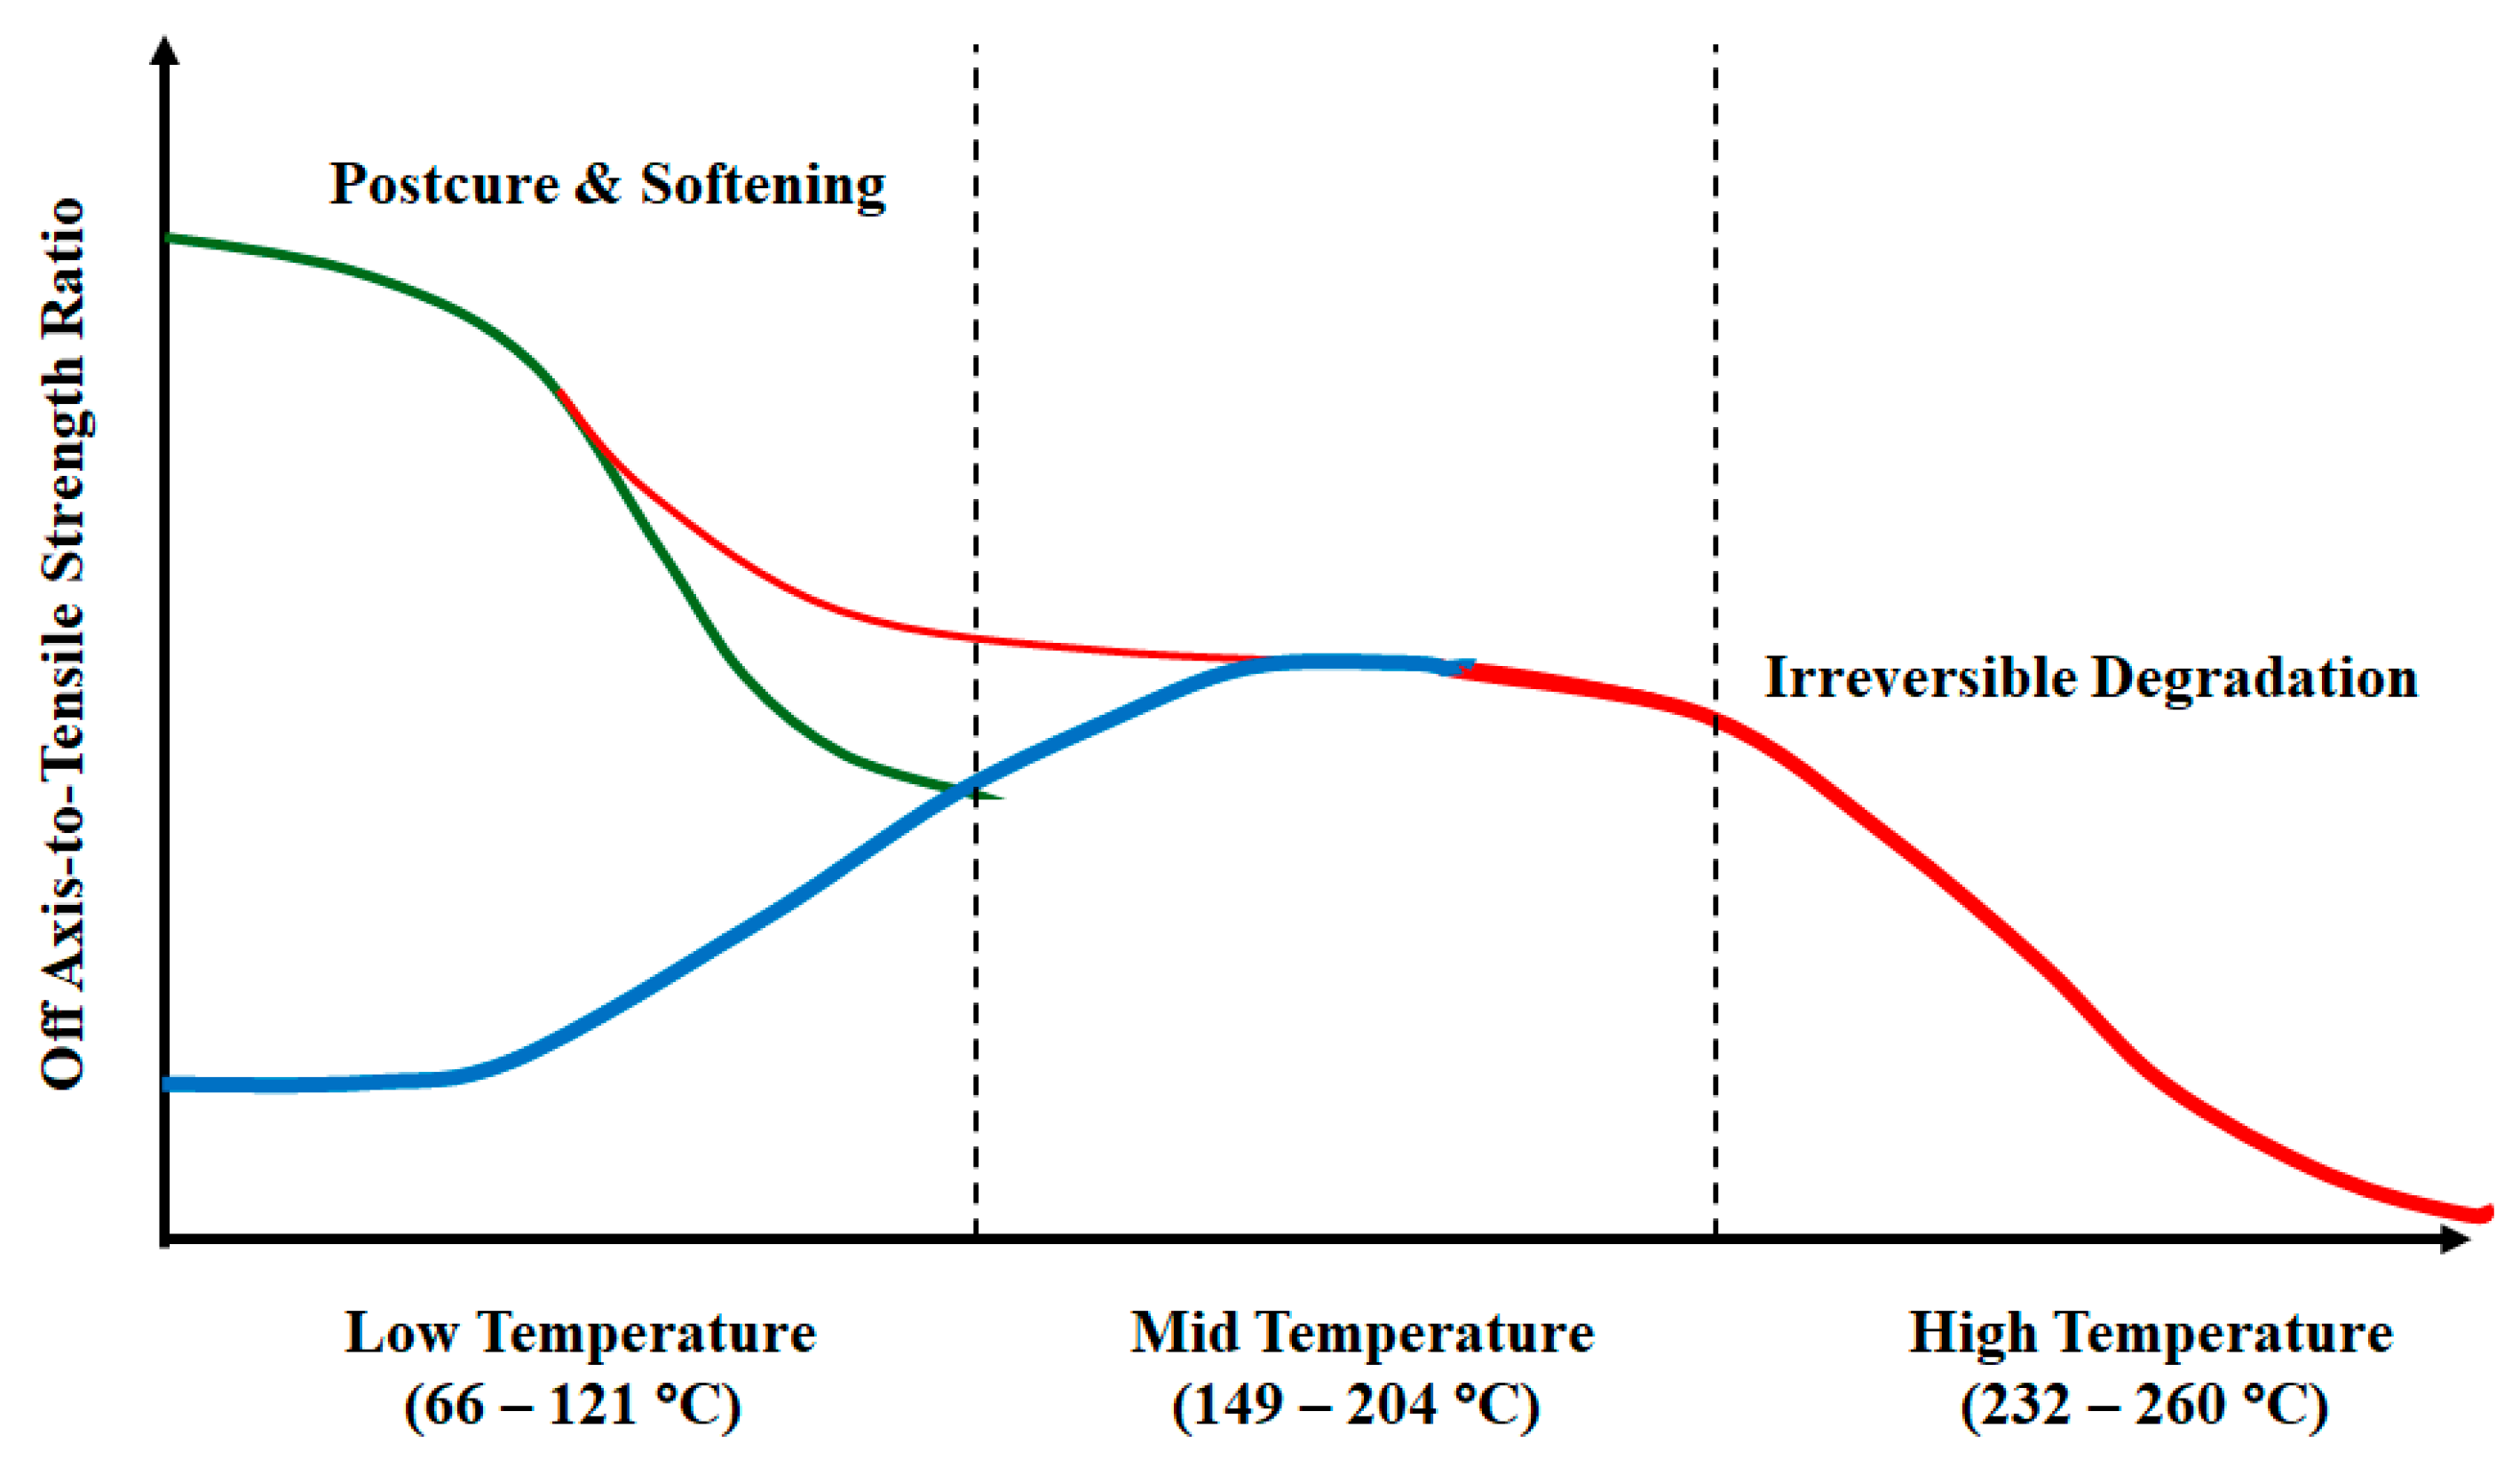
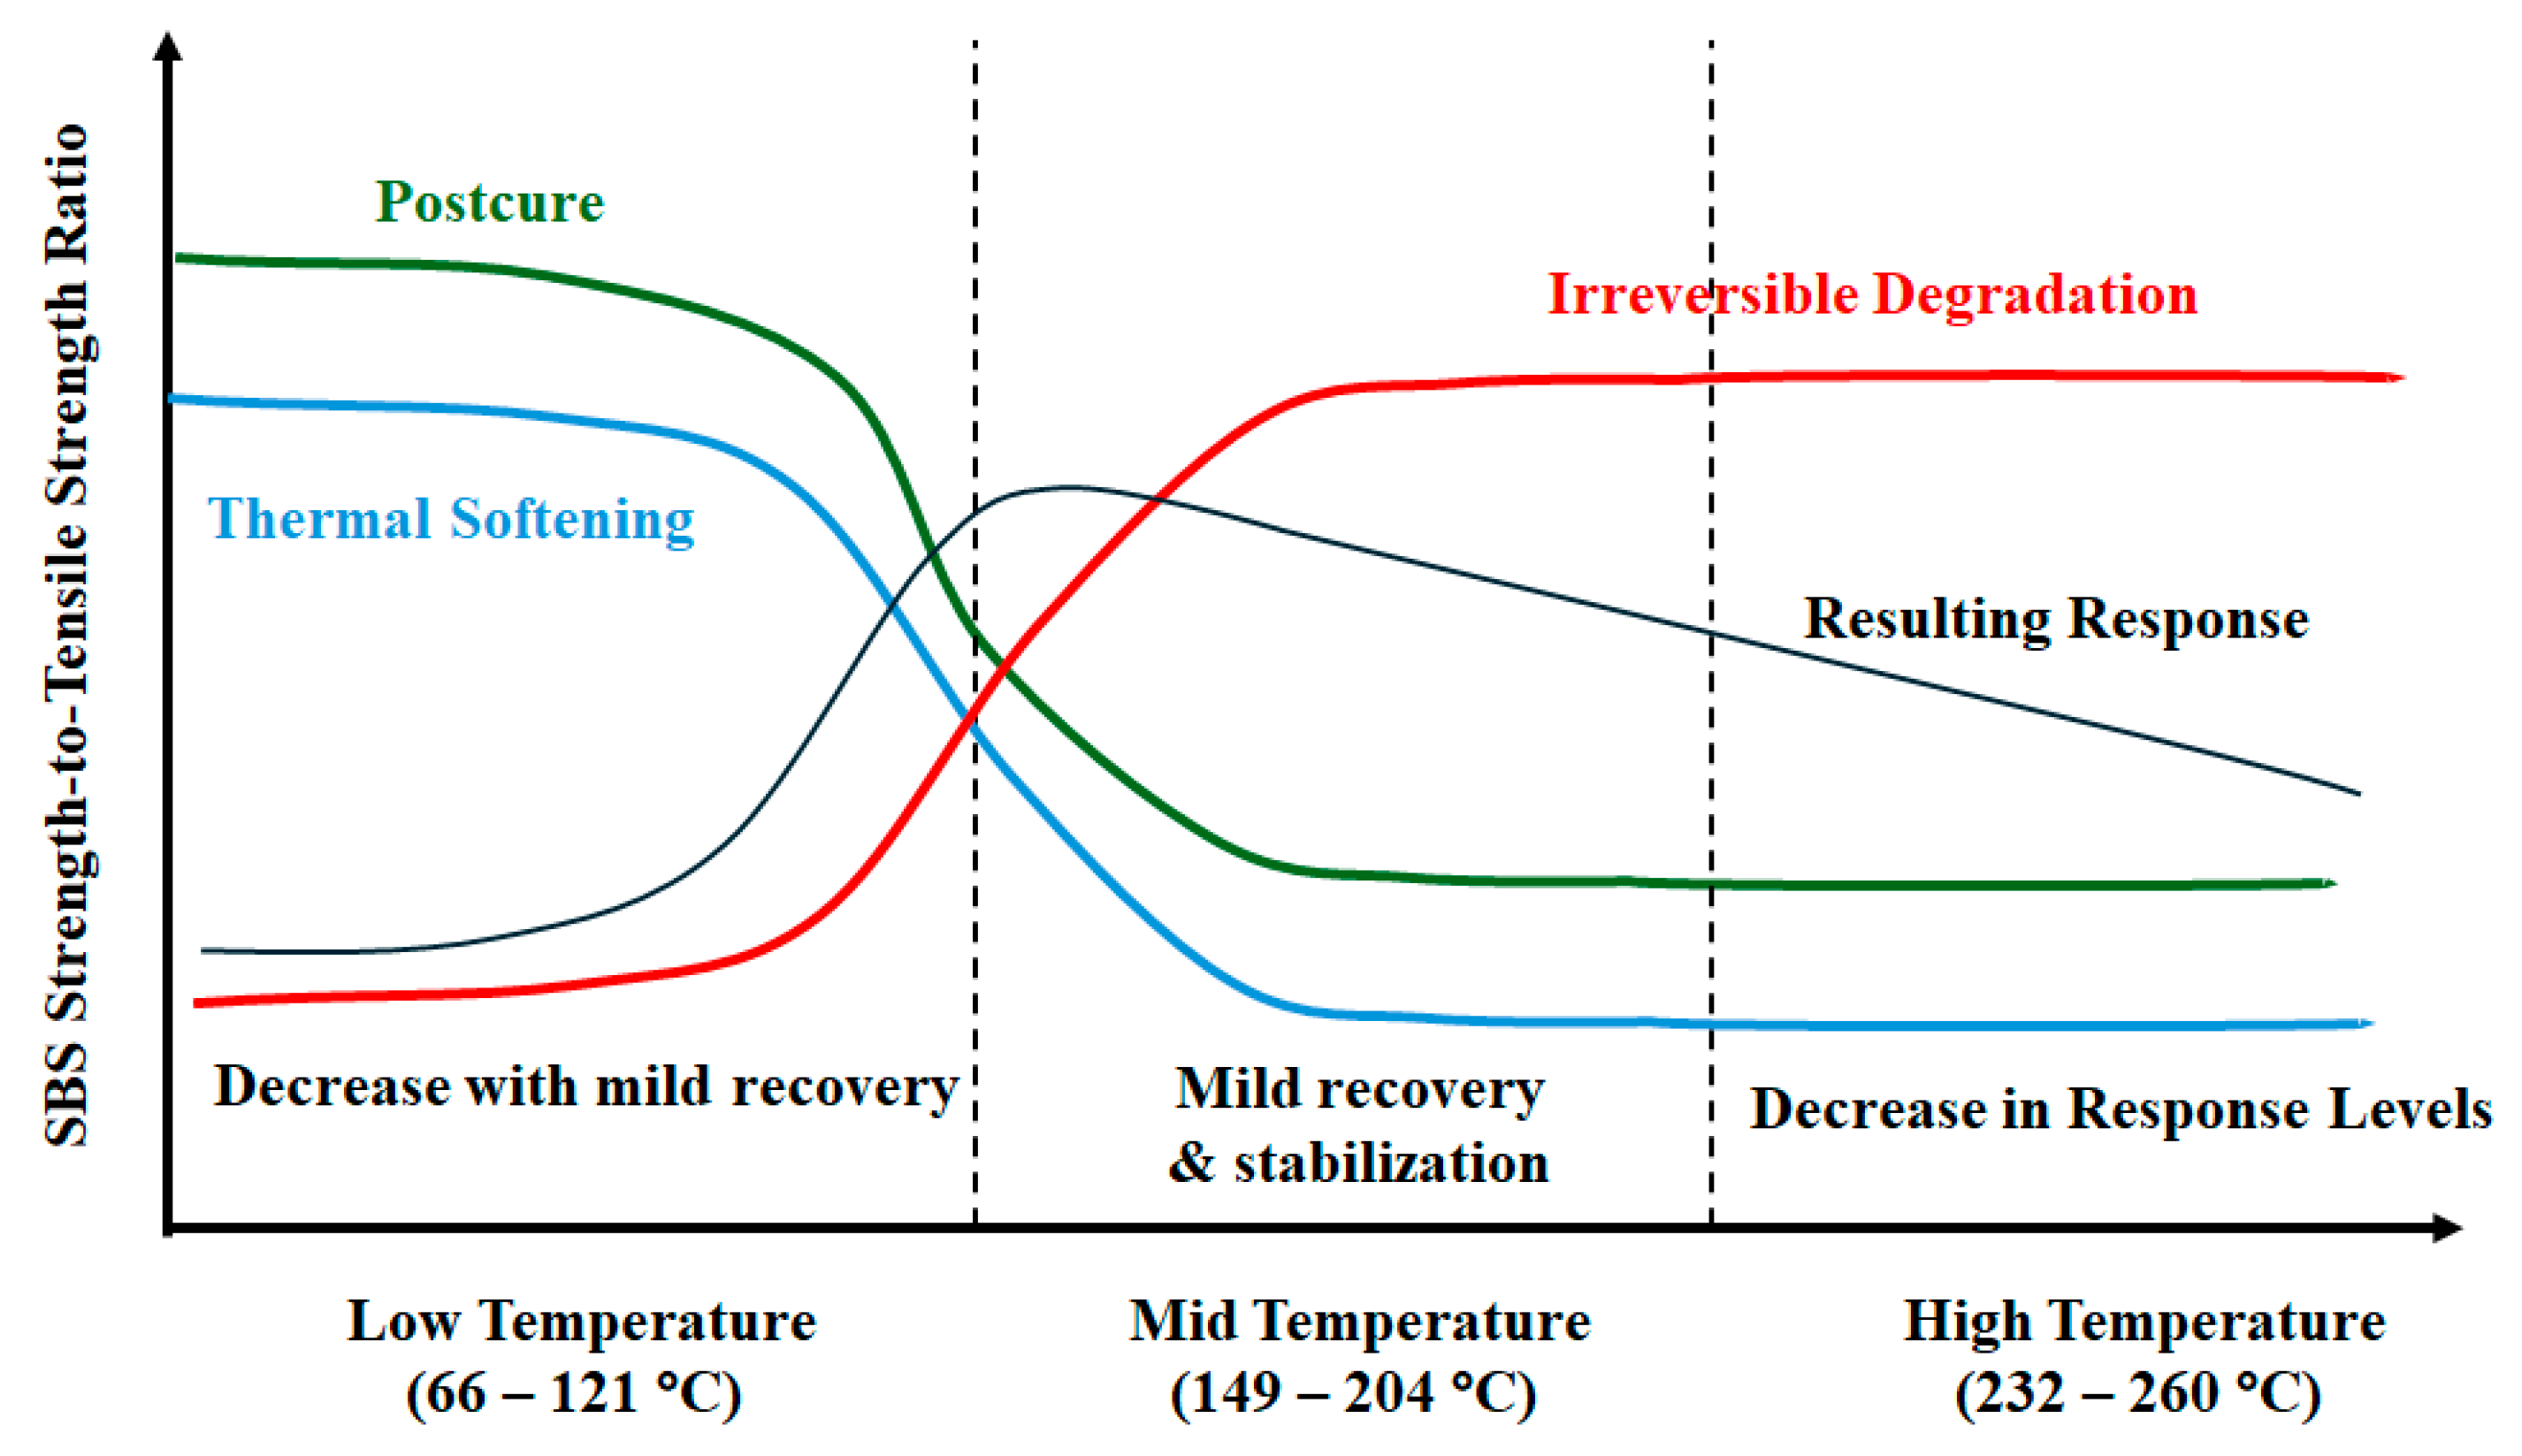
| Regime | Temperature Range | Trend | Description |
|---|---|---|---|
| 1 | Low (66–121 °C) | Ratio decreases initially, then increases and stabilizes | Competing mechanisms of initial softening followed by postcure and interfacial strengthening |
| 2 | Mid (149–204 °C) | Ratio decreases then stabilizes | Initiation of deterioration dominance with later stabilization in a semi-equilibrium state |
| 3 | High (232–260 °C) | Ratio decreases continuously | Dominance of irreversible degradation through resin decomposition, fiber-matrix debonding, and matrix microcracking, with char formation at longer periods of exposure |
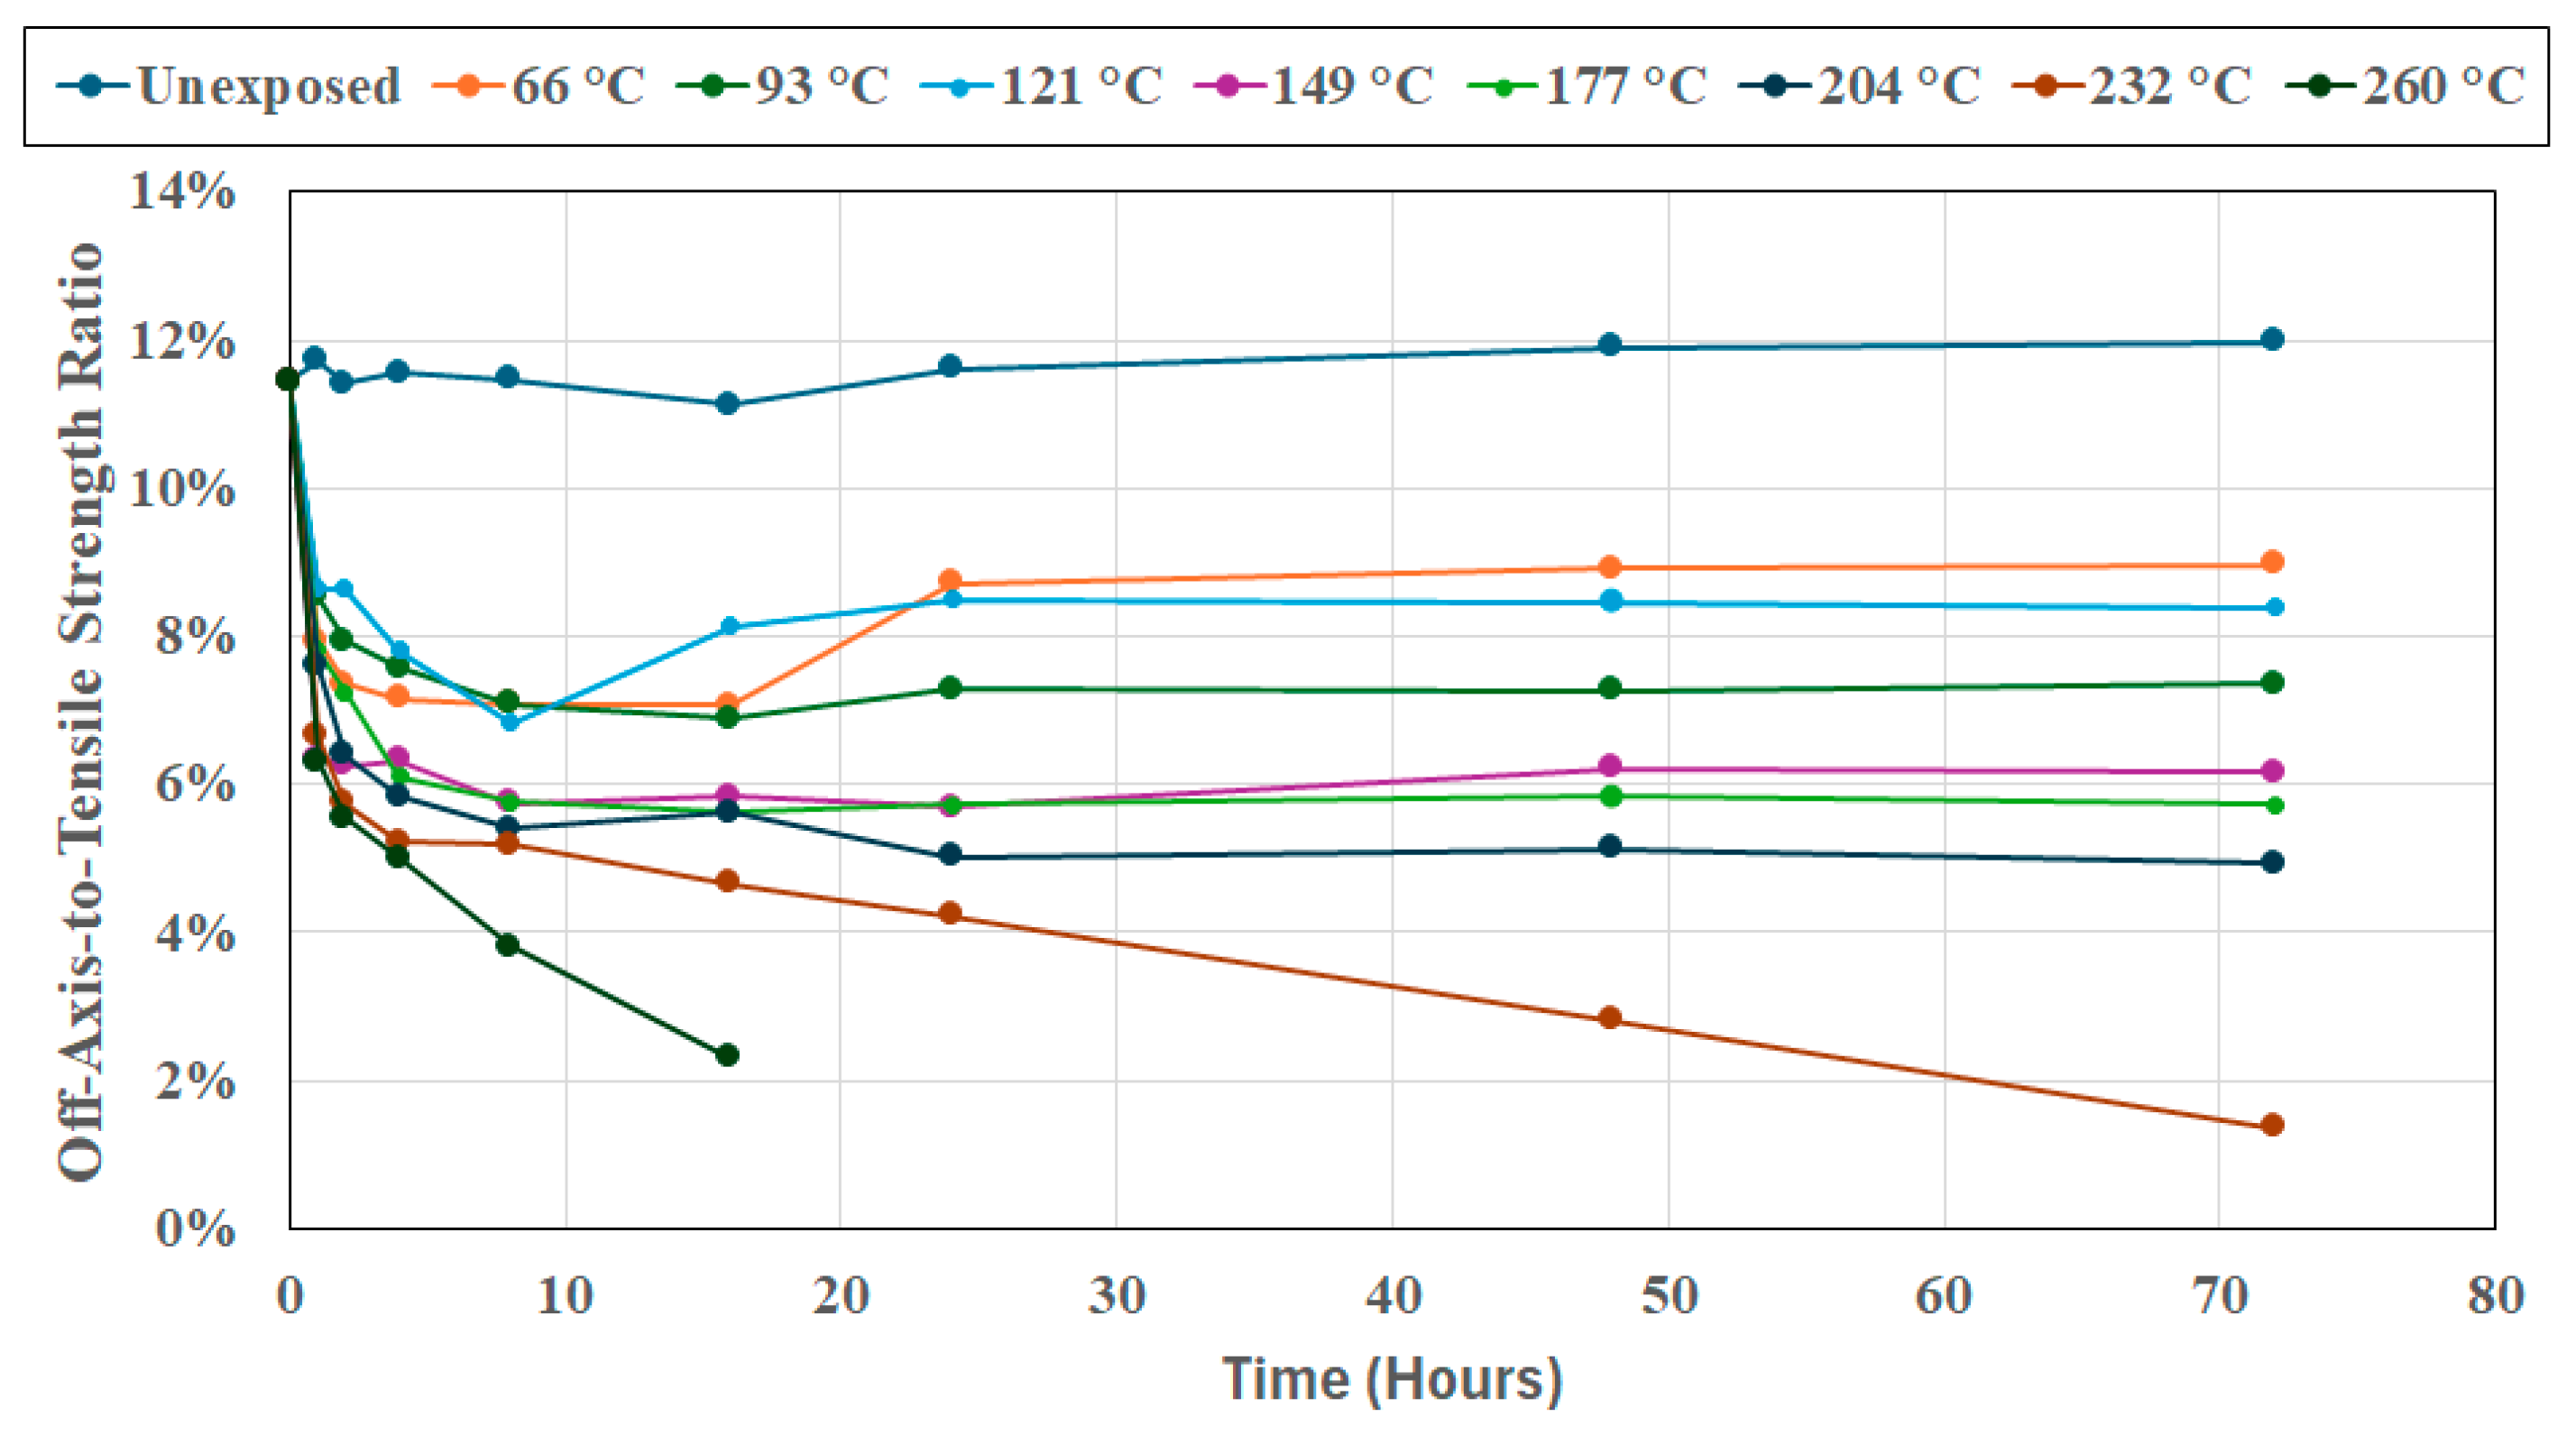
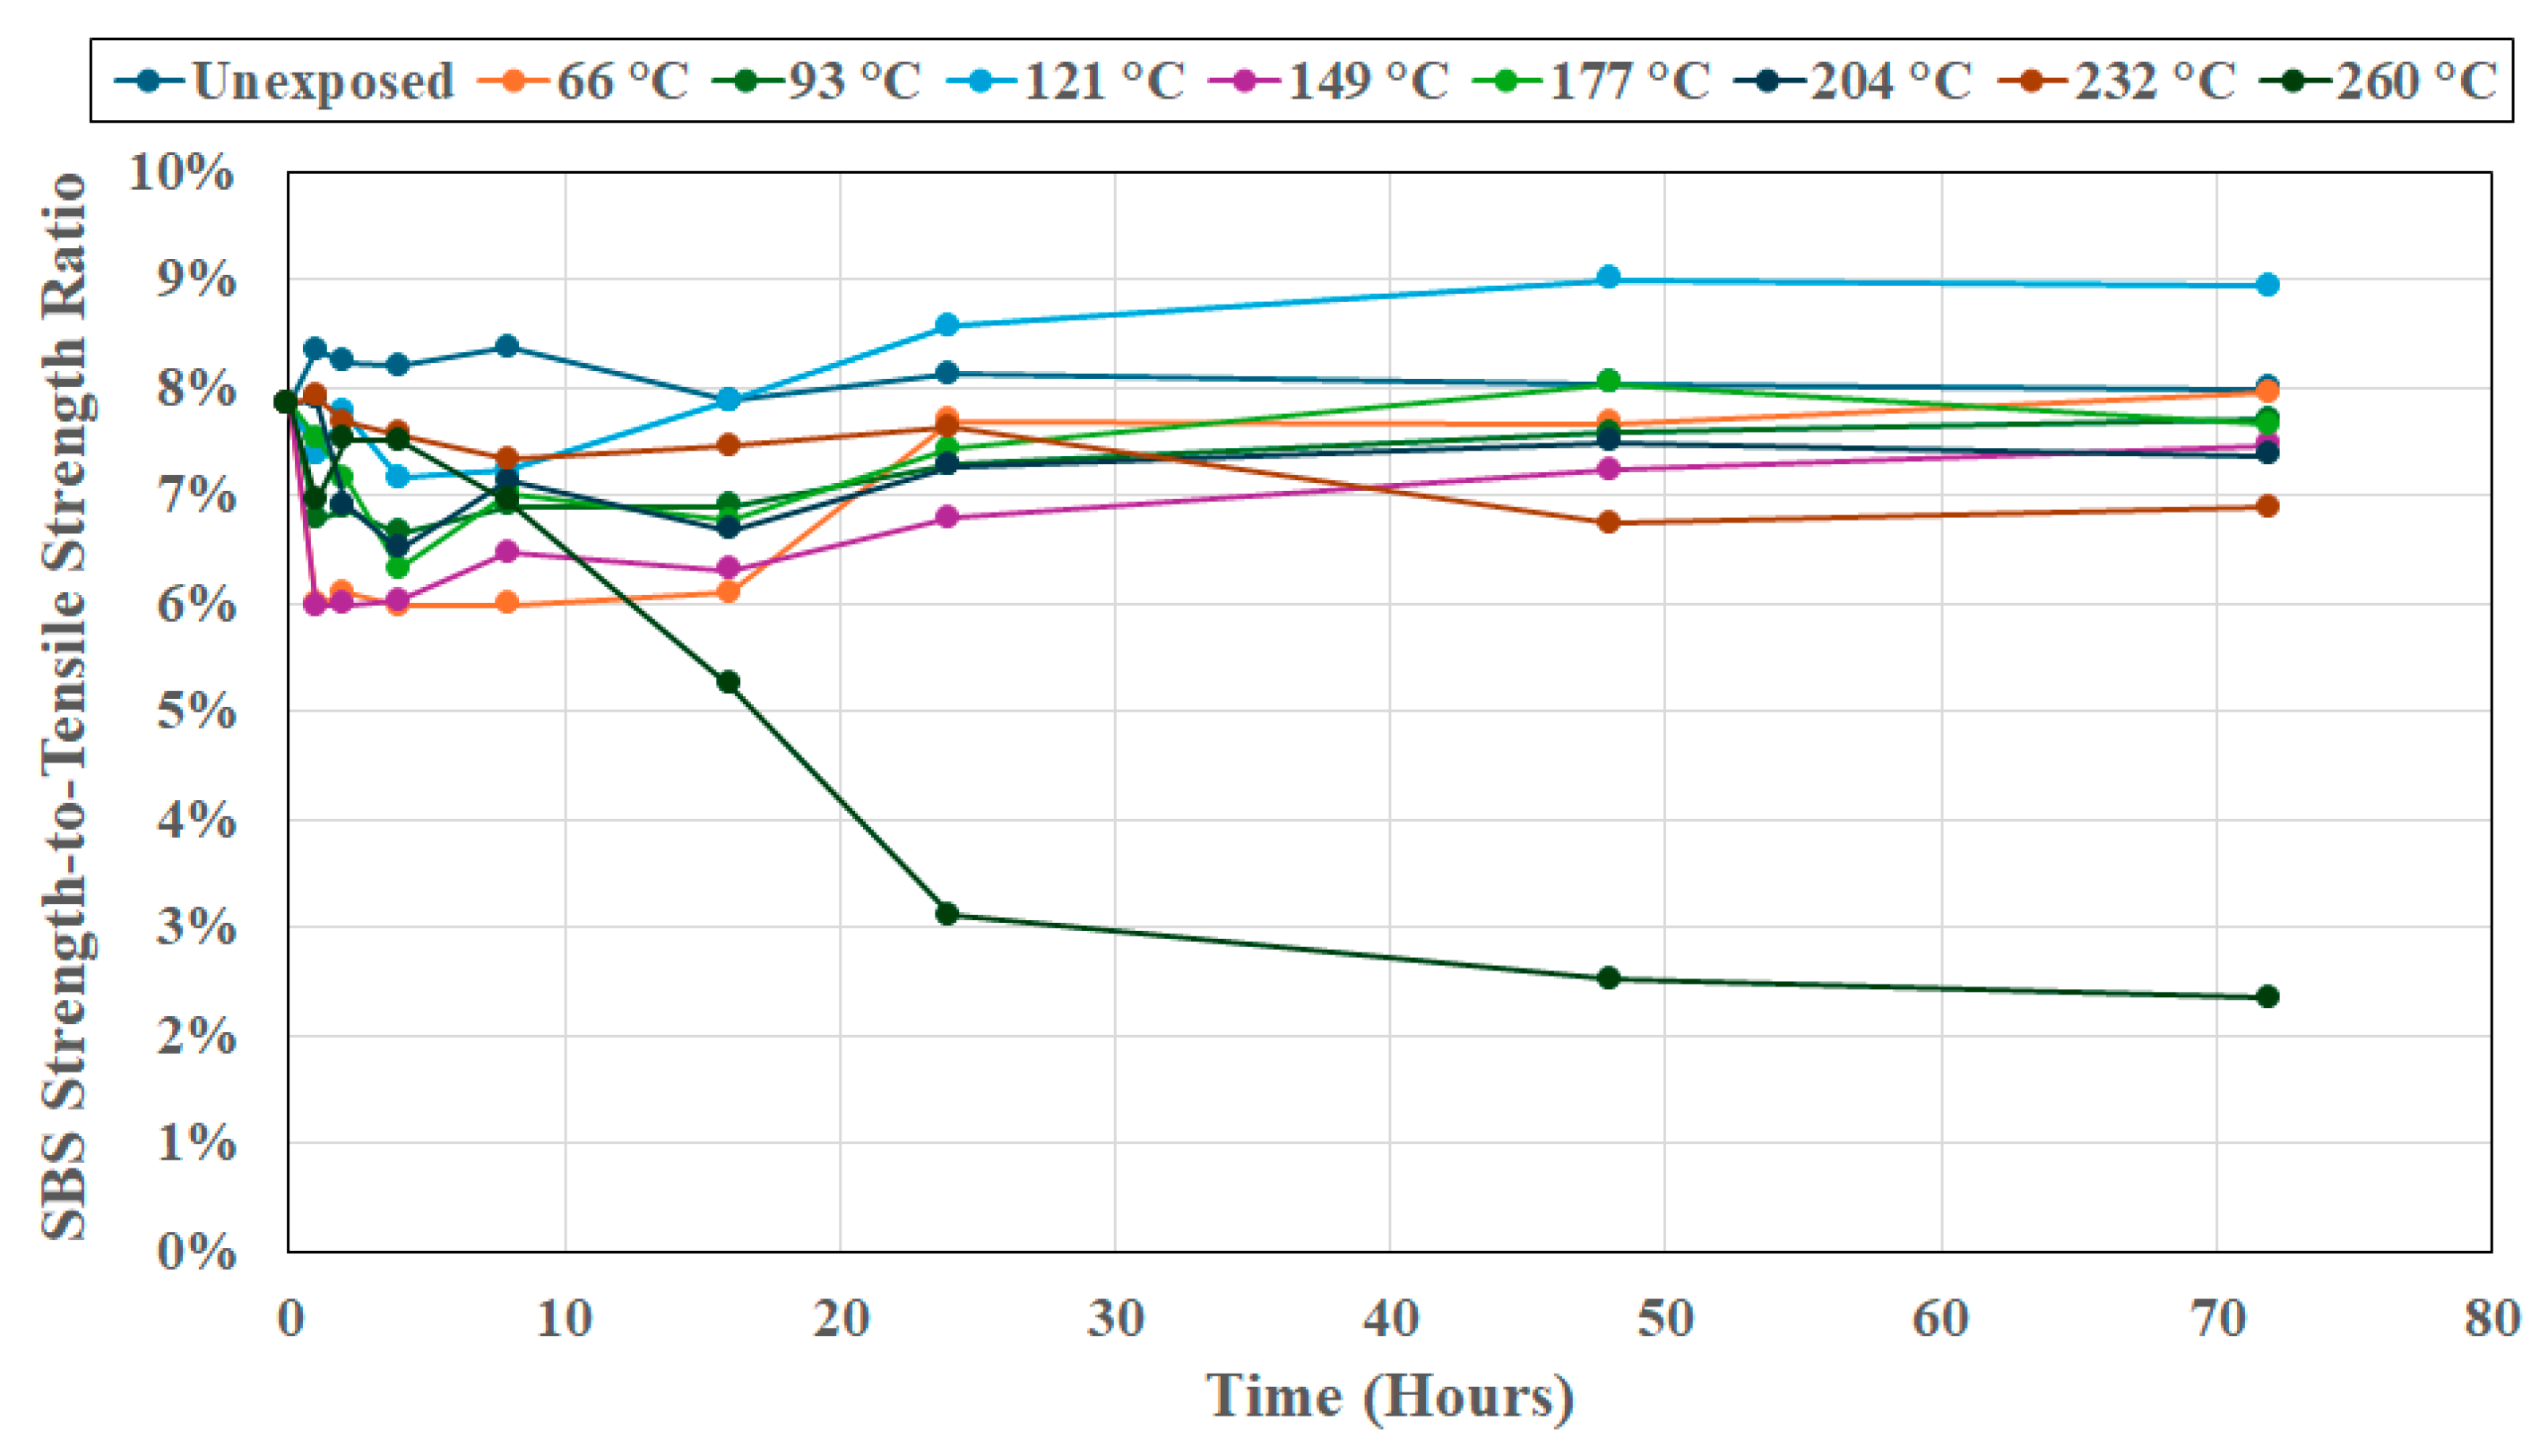
| Region | Temperature Regime | Off-Axis-to-Tensile Strength Ratio | SBS-to-Tensile Strength Ratio | Key Aspects |
|---|---|---|---|---|
| 1 | 66–121 °C | Sharp dip followed by a strong recovery | Milder dip, followed by stabilization, and recovery | Postcure improves performance at the matrix and interface levels enhancing off-axis and tensile performance to a greater extent than SBS strength, i.e., in-plane properties are improved more than interlaminar properties. SBS performance is more sensitive to resin softening and local deterioration |
| 2 | 149–204 °C | Moderate decrease with the level of deterioration increasing with temperature followed by an asymptotic region | Milder dip with level of drop decreasing with temperature followed by a slow recovery | Interface and matrix level deterioration dominates degradation in in-plane directions. SBS retention is due to multi-axial stress redistribution |
| 3 | 232–260 °C | Continuous decline with failure prior to the full period of exposure at the highest temperature | Delayed decline with a level of stability, or slower decline, after 24–48 h following an initial more rapid period | Dominance of irreversible mechanisms of resin degradation and delamination/layer separation with off-axis mechanisms showing greater sensitivity to temperature, and time, of exposure |
| Temperature of Exposure (°C) | a | k1 | b | k2 |
|---|---|---|---|---|
| 23 | 4.8298 | 1.7164 | 2.3093 | 0.9999 |
| 66 | 6.6072 | 0.8078 | 0.5405 | 0.0200 |
| 93 | 8.2506 | 0.4674 | 1.6558 | 0.0947 |
| 121 | 6.7081 | 0.8290 | 0.0000 | 0.0000 |
| 149 | 7.1895 | 3.0200 | 0.0359 | 0.0000 |
| 177 | 6.3215 | 9.9999 | 99.9999 | 0.0002 |
| 204 | 6.2393 | 3.7743 | 99.9999 | 0.0003 |
| 232 | 9.4483 | 0.6735 | 53.3874 | 0.0030 |
| 260 | 65.3800 | 0.3174 | 99.9999 | 0.1214 |
| Temperature of Exposure (°C) | g | h |
|---|---|---|
| 66 | 3.25 | 0.27 |
| 93 | 3.62 | 0.32 |
| 121 | 3.62 | 0.38 |
| 149 | 4.05 | 0.38 |
| 177 | 4.06 | 0.38 |
| 204 | 4.34 | 0.38 |
| 232 | 4.4 | 0.49 |
| 260 | 4.4 | 0.74 |
| Group | ||
|---|---|---|
| 1: 66–177 °C | ||
| 2: 177–232 °C | ||
| 3: 232–260 °C |
Disclaimer/Publisher’s Note: The statements, opinions and data contained in all publications are solely those of the individual author(s) and contributor(s) and not of MDPI and/or the editor(s). MDPI and/or the editor(s) disclaim responsibility for any injury to people or property resulting from any ideas, methods, instructions or products referred to in the content. |
© 2025 by the authors. Licensee MDPI, Basel, Switzerland. This article is an open access article distributed under the terms and conditions of the Creative Commons Attribution (CC BY) license (https://creativecommons.org/licenses/by/4.0/).
Share and Cite
Acharya, R.; Karbhari, V.M. Effects of Postcure and Degradation in Wet Layup Carbon/Epoxy Composites Using Shear-Based Metrics. J. Compos. Sci. 2025, 9, 411. https://doi.org/10.3390/jcs9080411
Acharya R, Karbhari VM. Effects of Postcure and Degradation in Wet Layup Carbon/Epoxy Composites Using Shear-Based Metrics. Journal of Composites Science. 2025; 9(8):411. https://doi.org/10.3390/jcs9080411
Chicago/Turabian StyleAcharya, Rabina, and Vistasp M. Karbhari. 2025. "Effects of Postcure and Degradation in Wet Layup Carbon/Epoxy Composites Using Shear-Based Metrics" Journal of Composites Science 9, no. 8: 411. https://doi.org/10.3390/jcs9080411
APA StyleAcharya, R., & Karbhari, V. M. (2025). Effects of Postcure and Degradation in Wet Layup Carbon/Epoxy Composites Using Shear-Based Metrics. Journal of Composites Science, 9(8), 411. https://doi.org/10.3390/jcs9080411