
Study of Mechanical and Wear Properties of Fabricated Tri-Axial Glass Composites

 , , ,
, , ,
Abstract
1. Introduction
2. Materials and Methods
3. Results
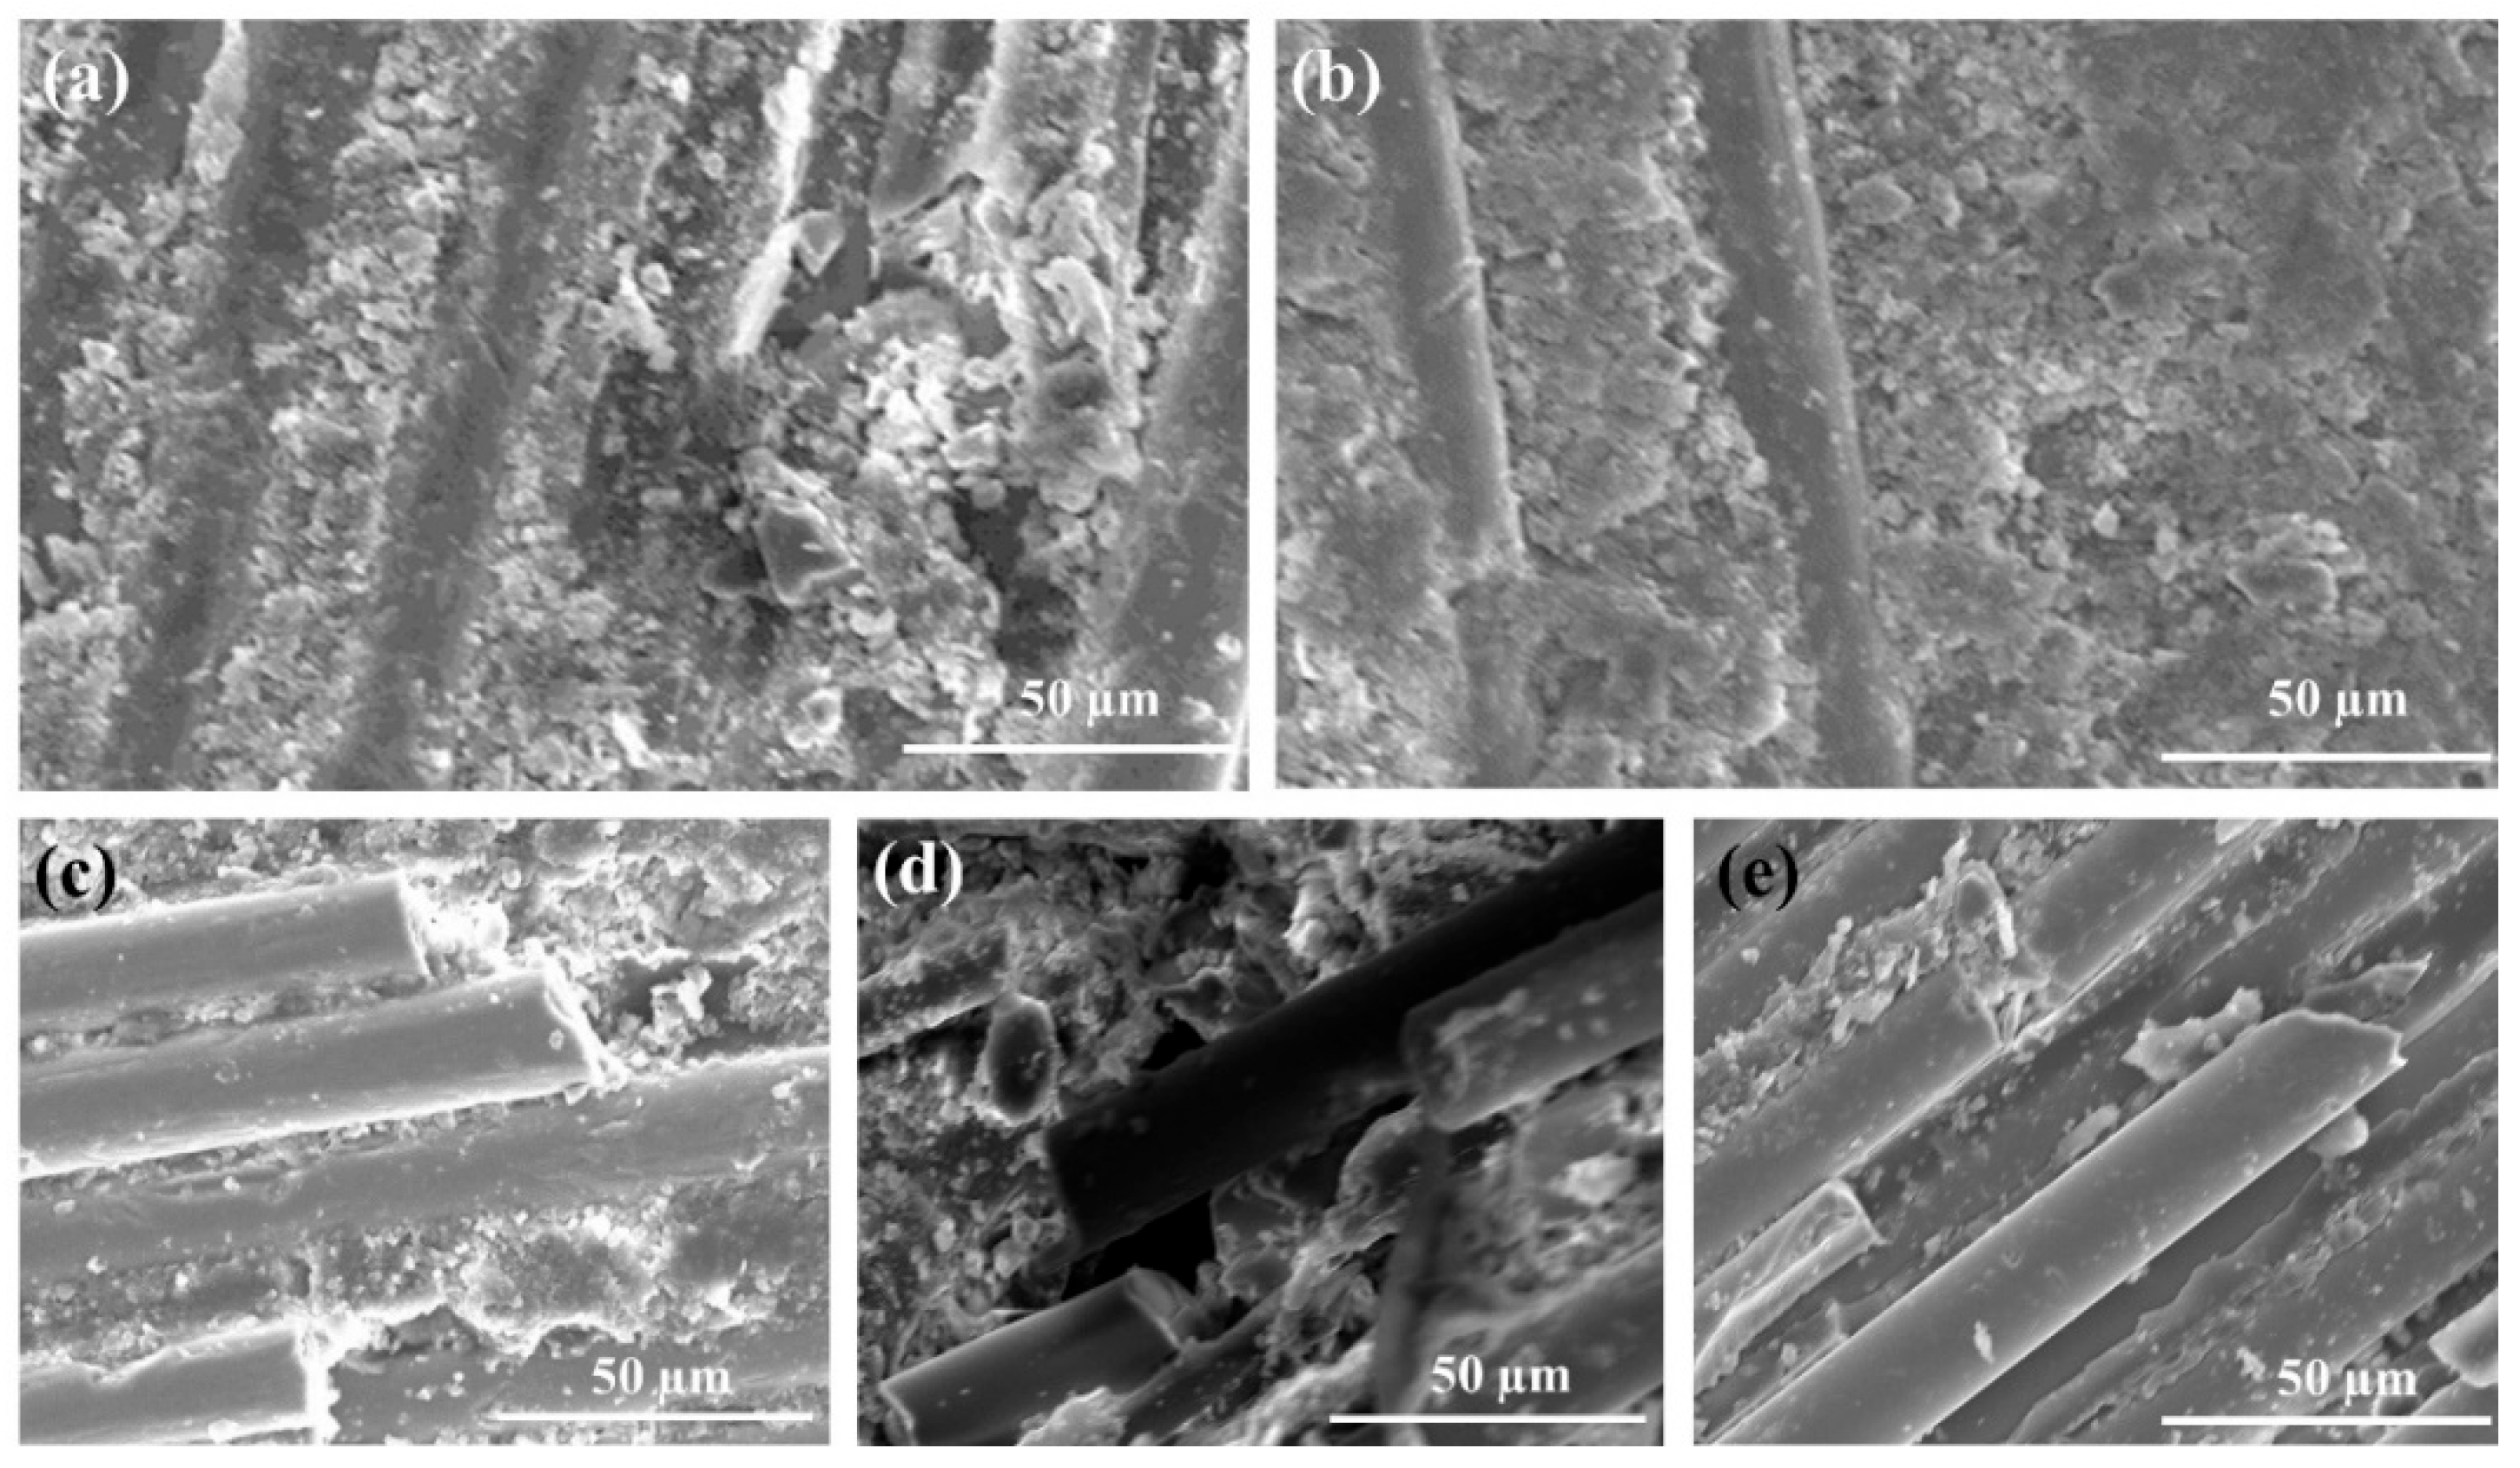
3.1. Surface Morphology
3.2. Density and Void Fraction of Composite
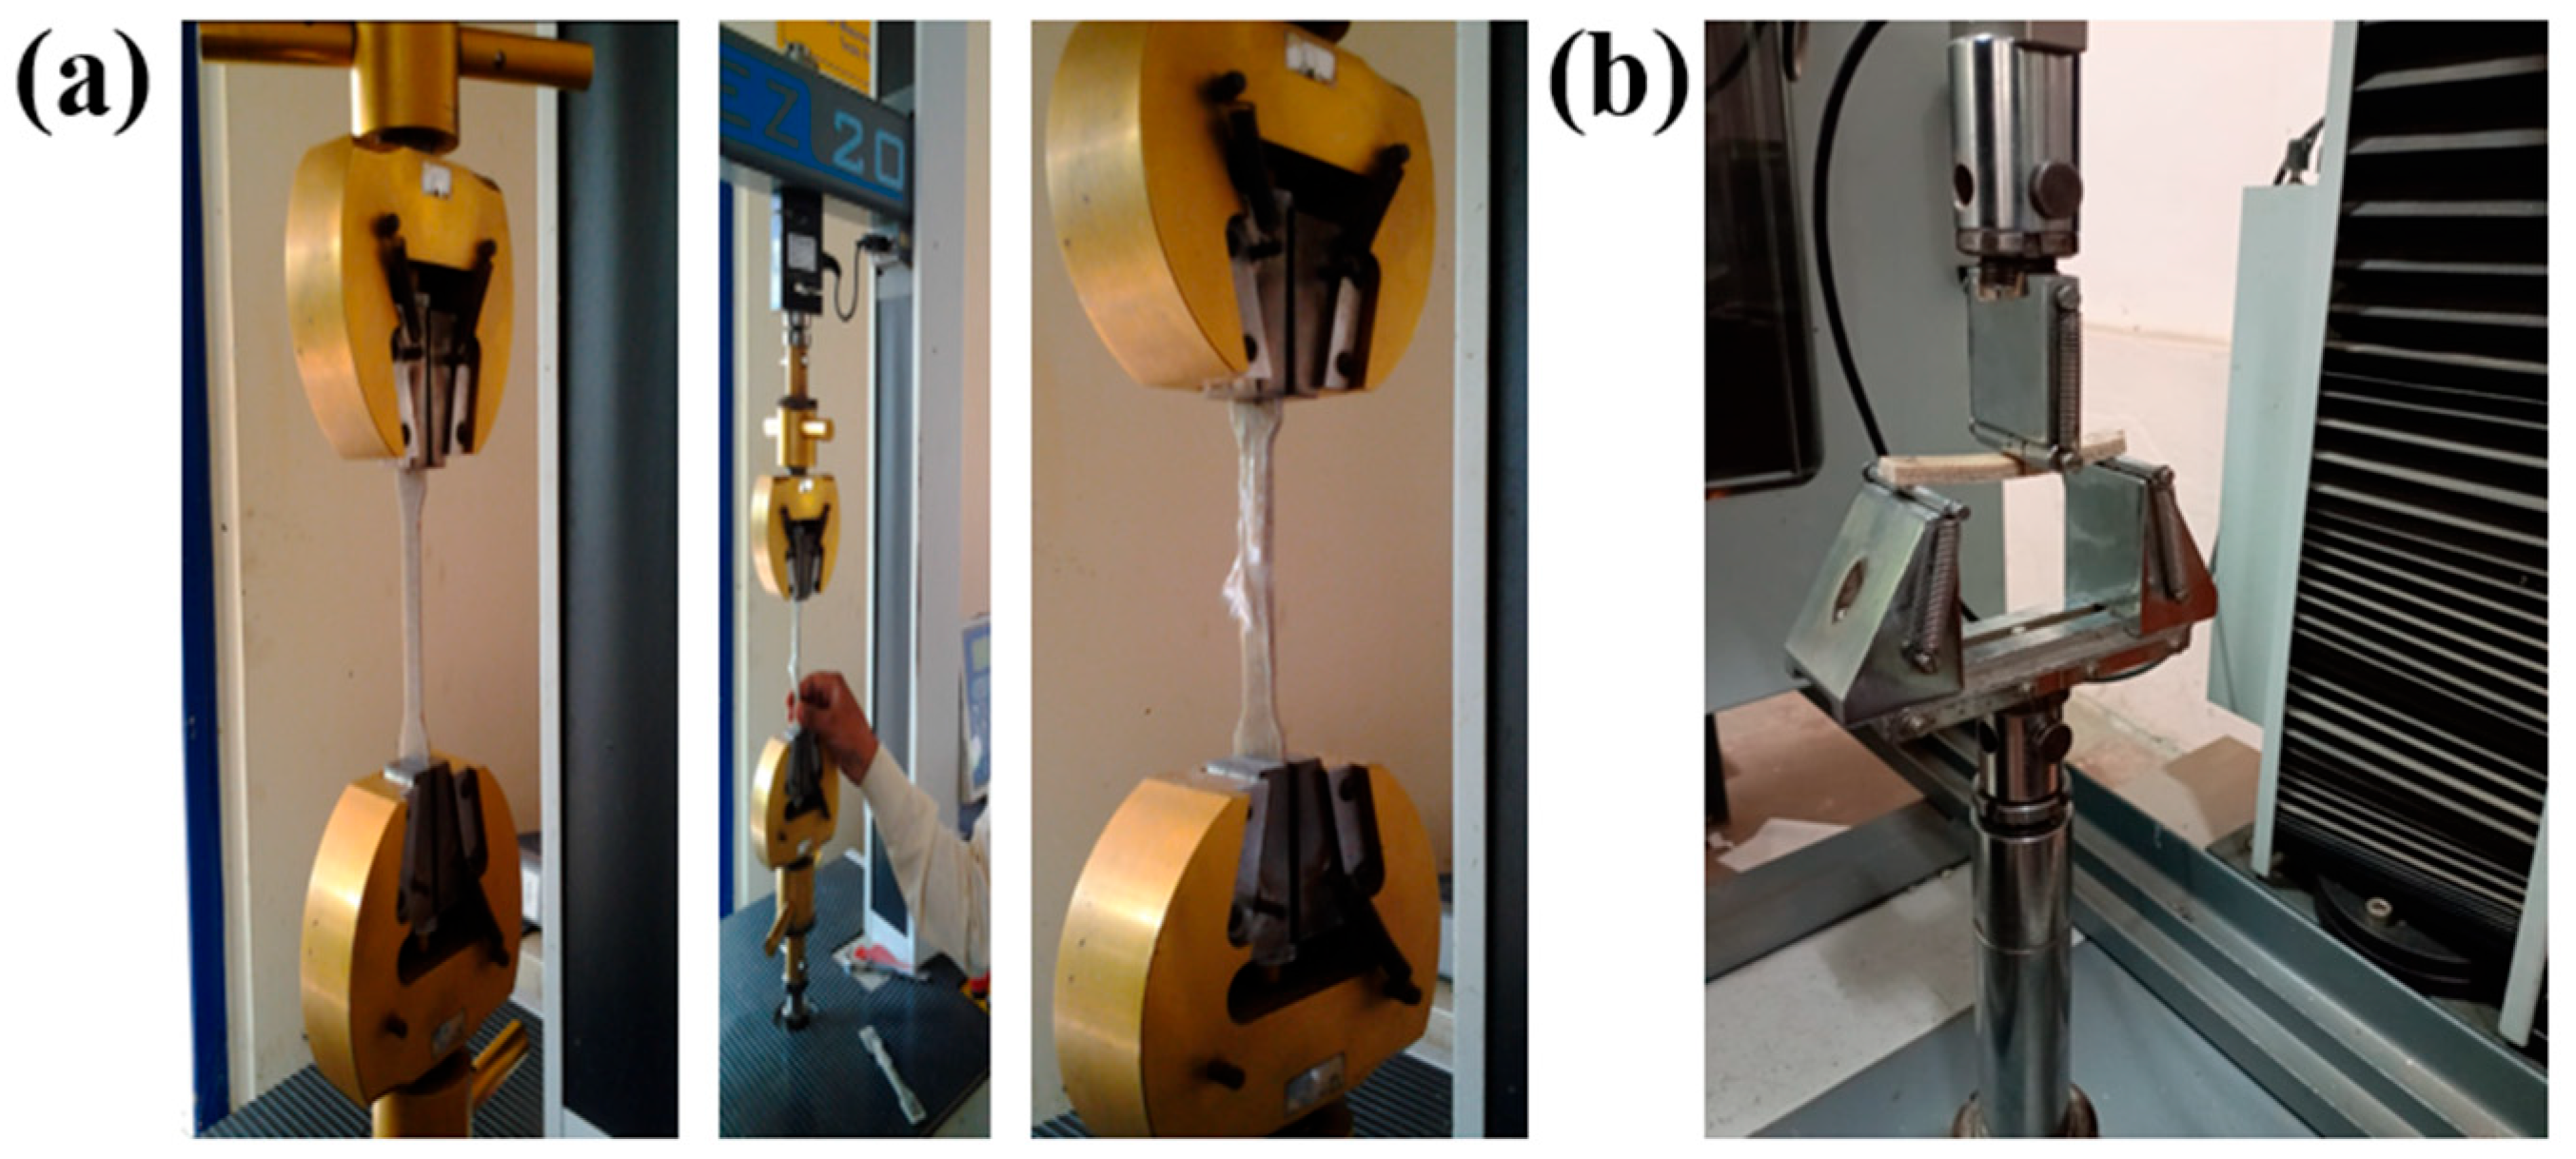
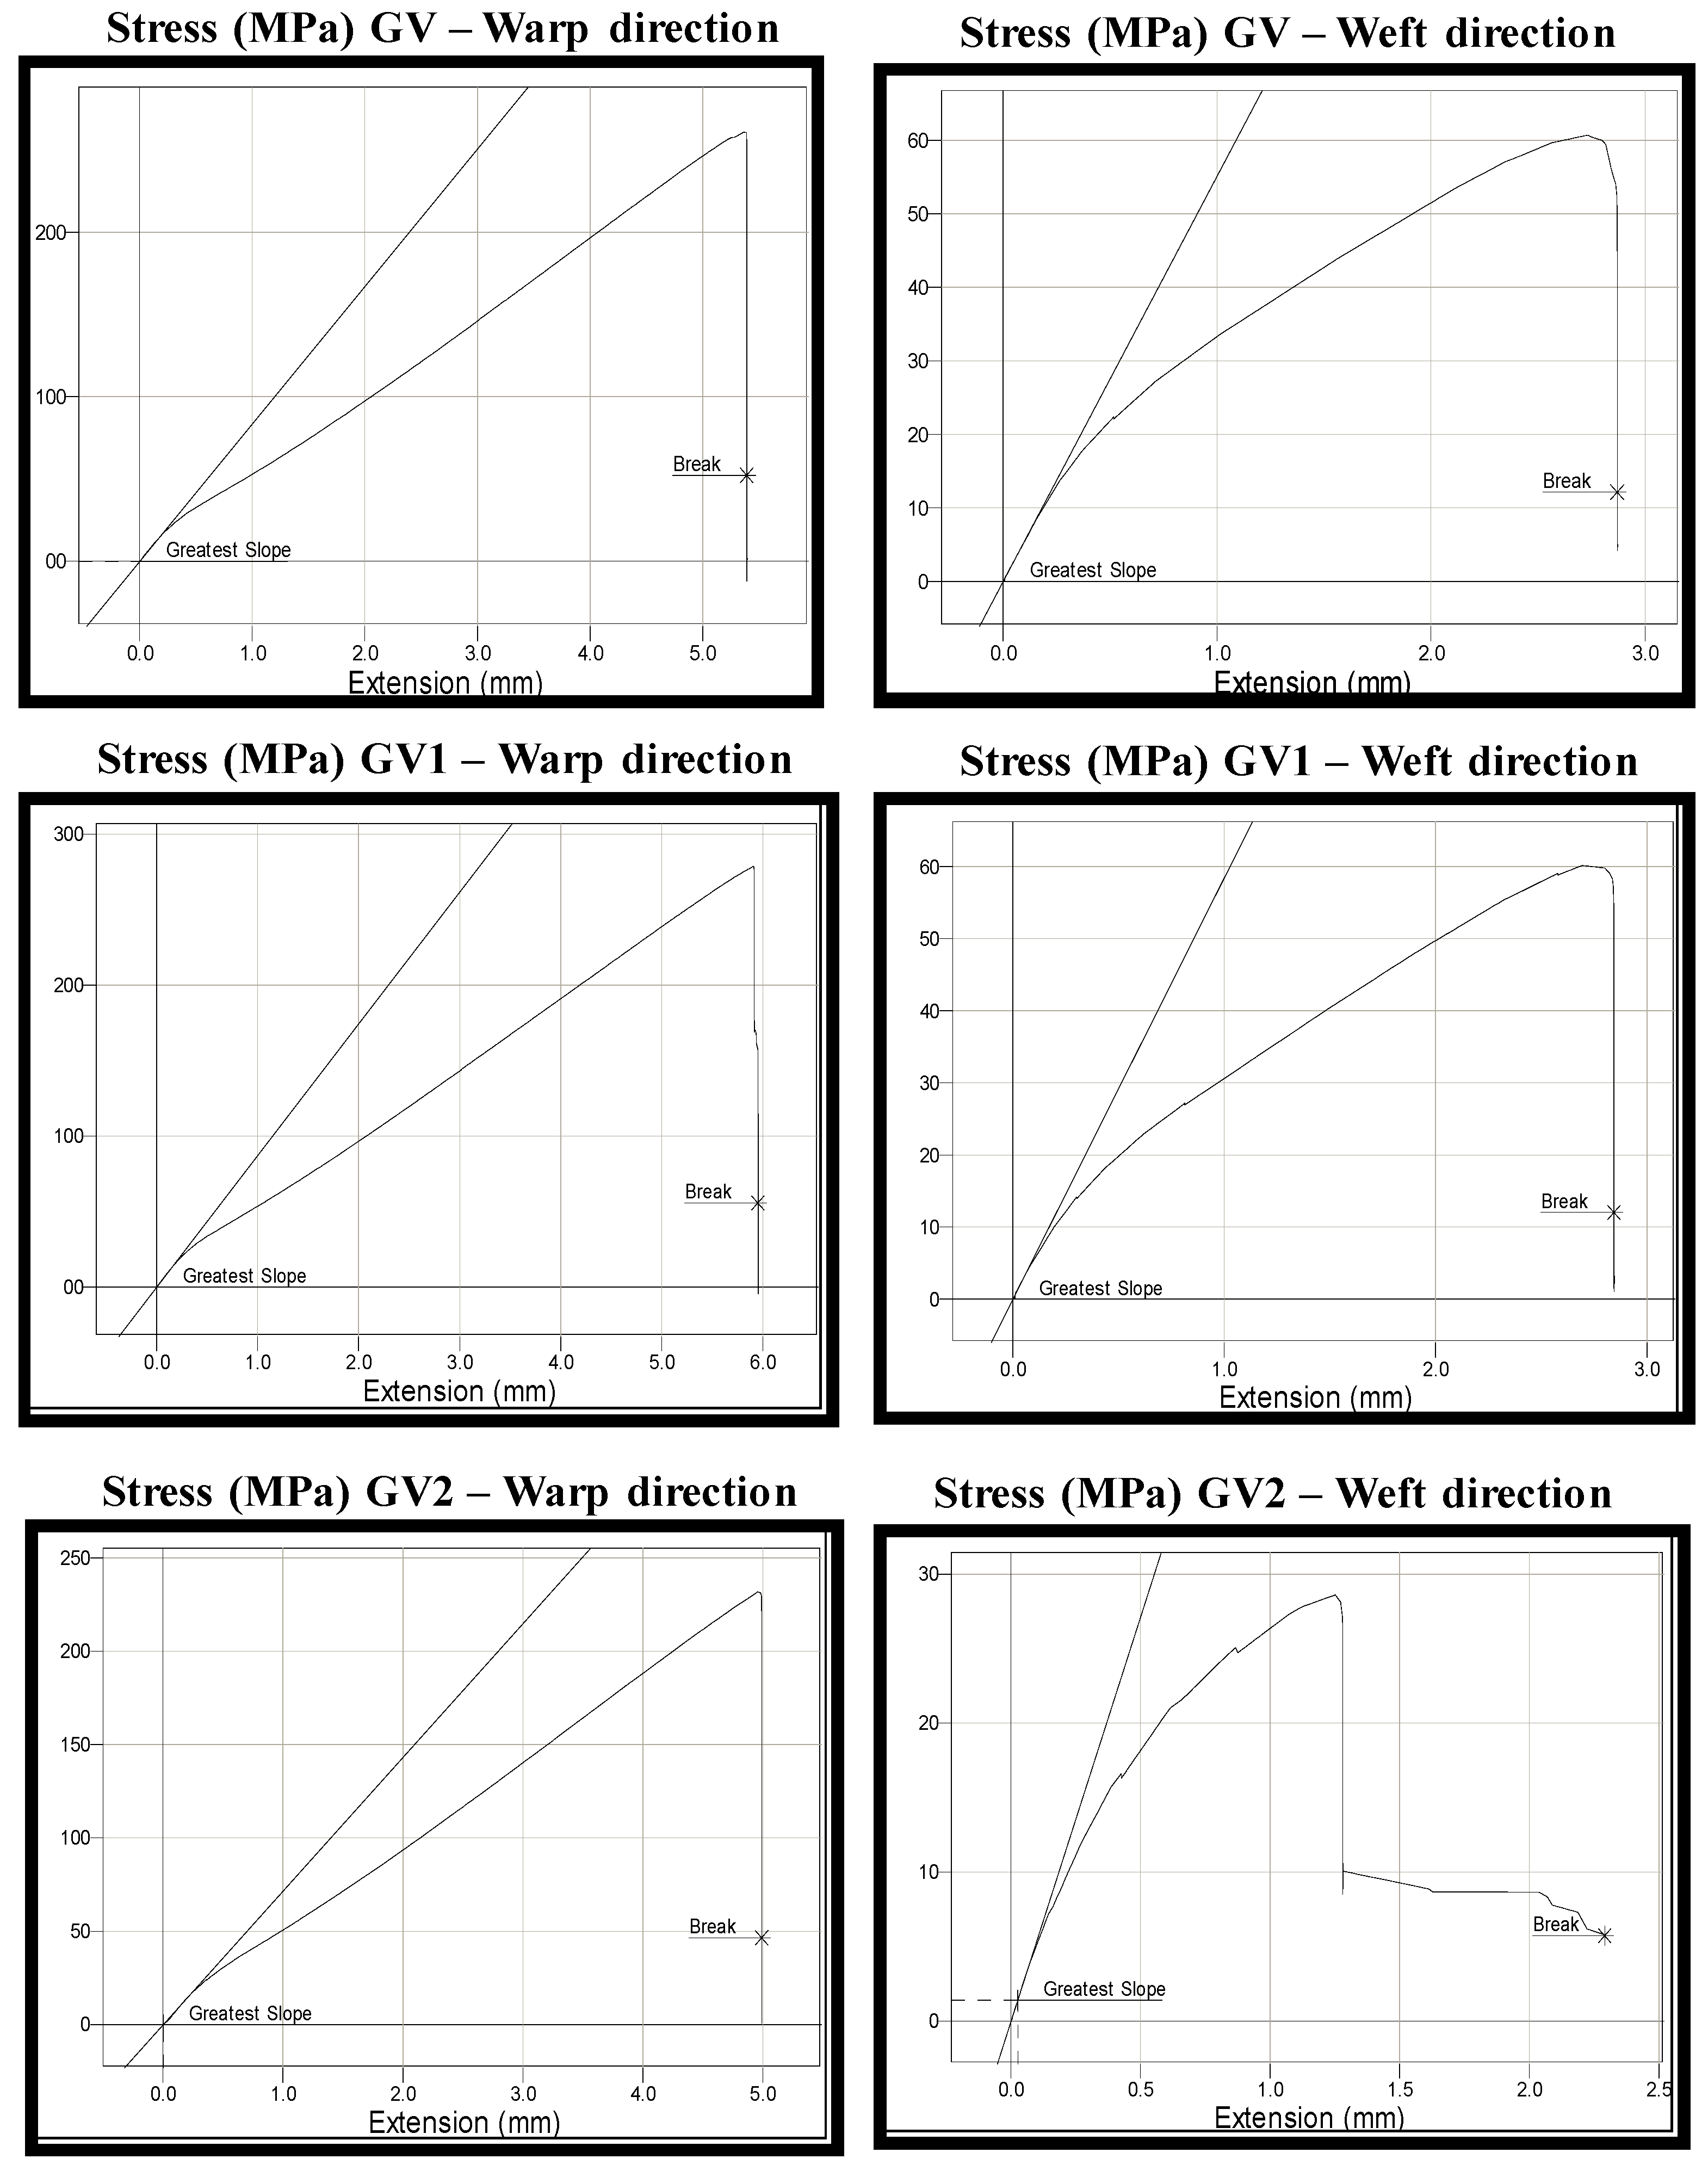
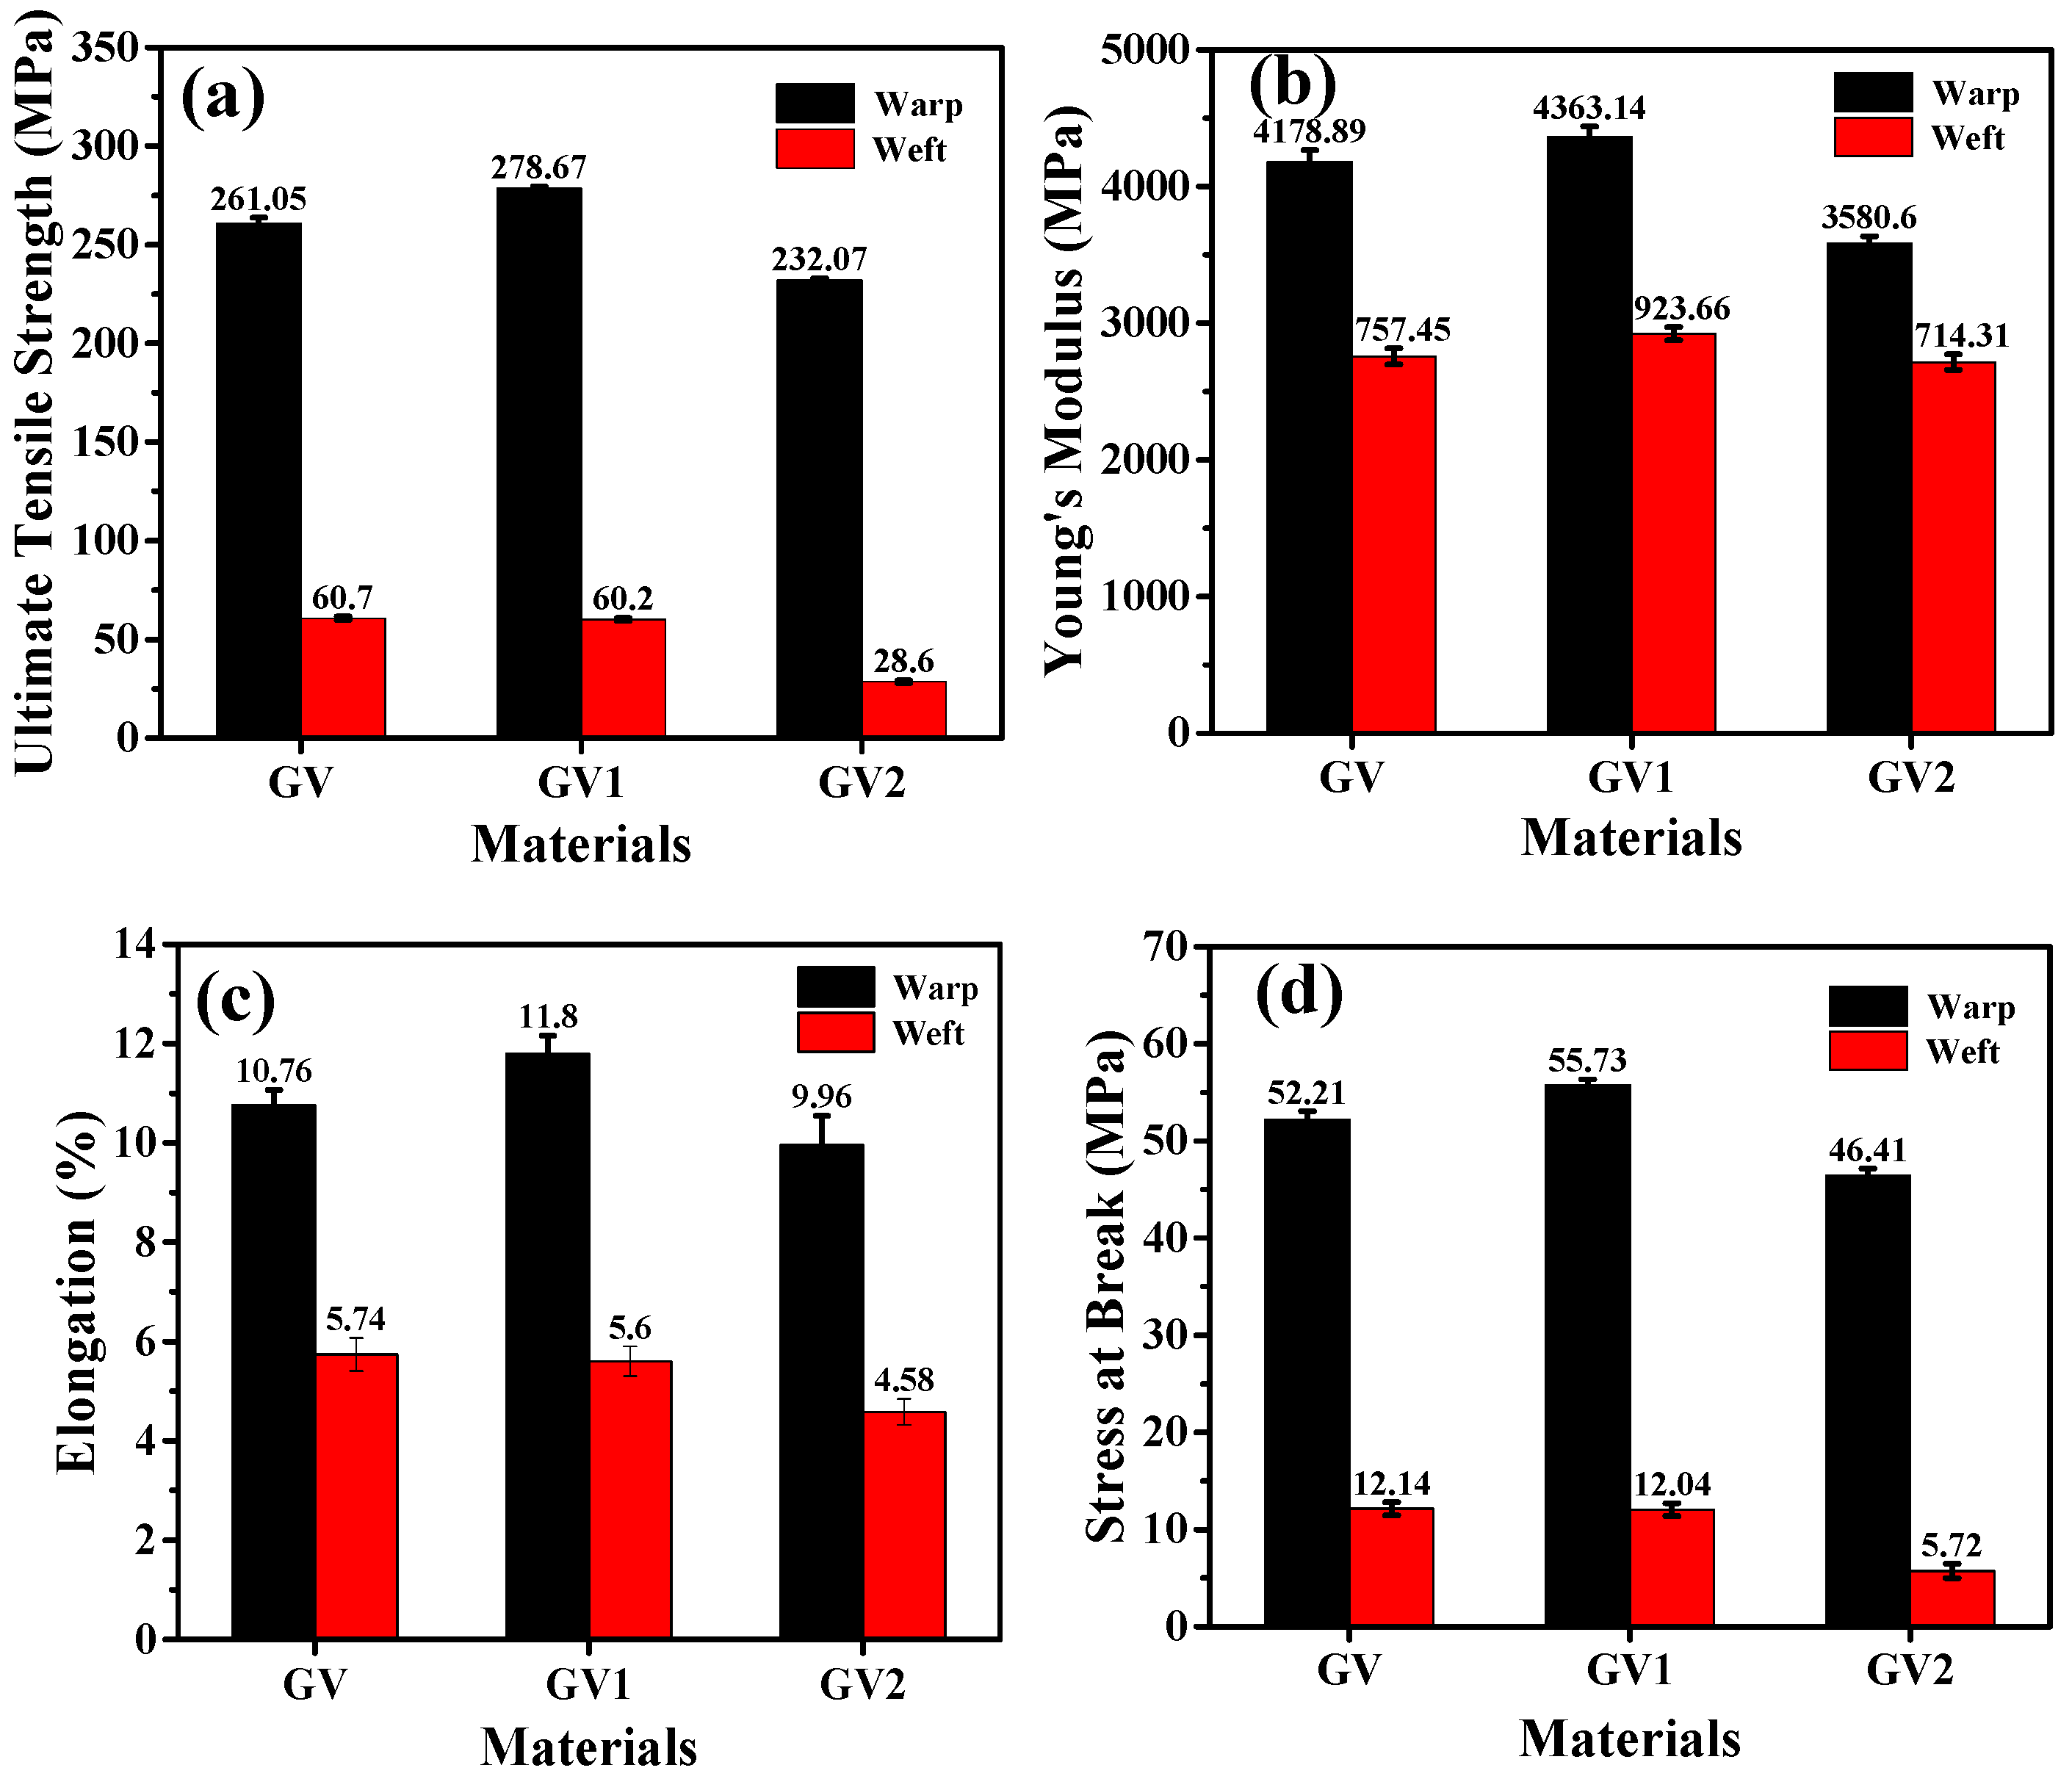
3.3. Tensile Test
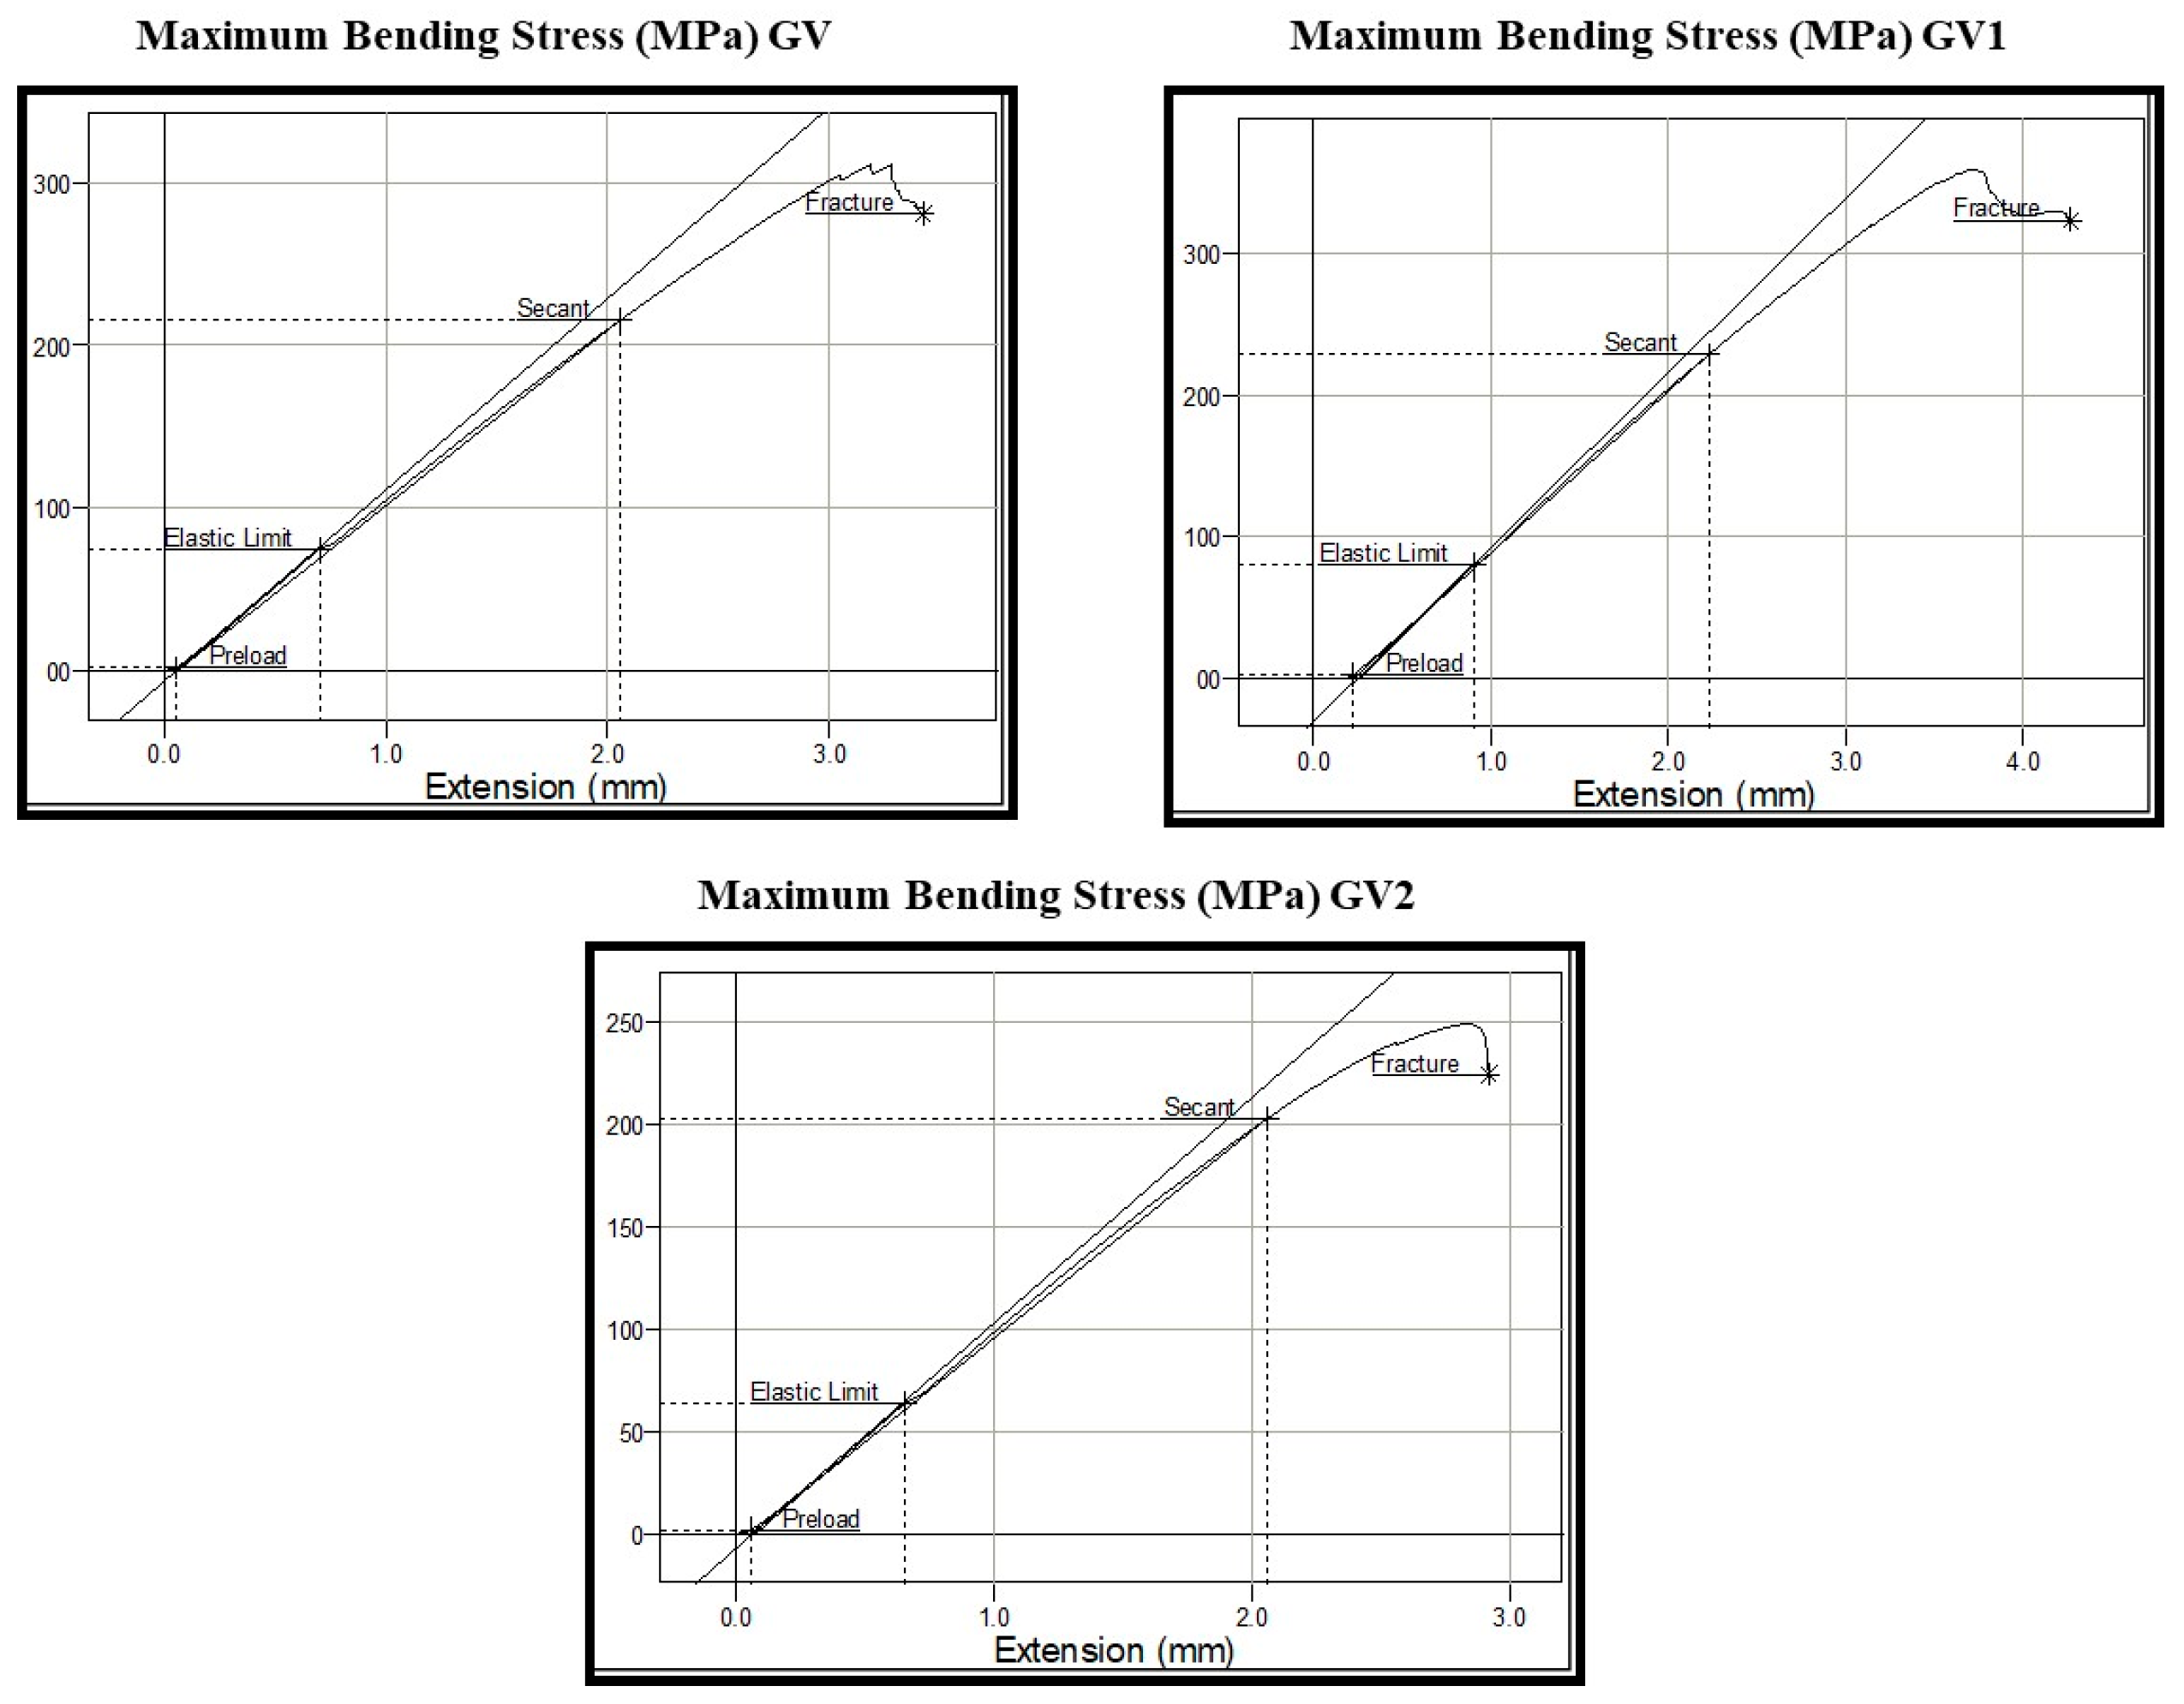
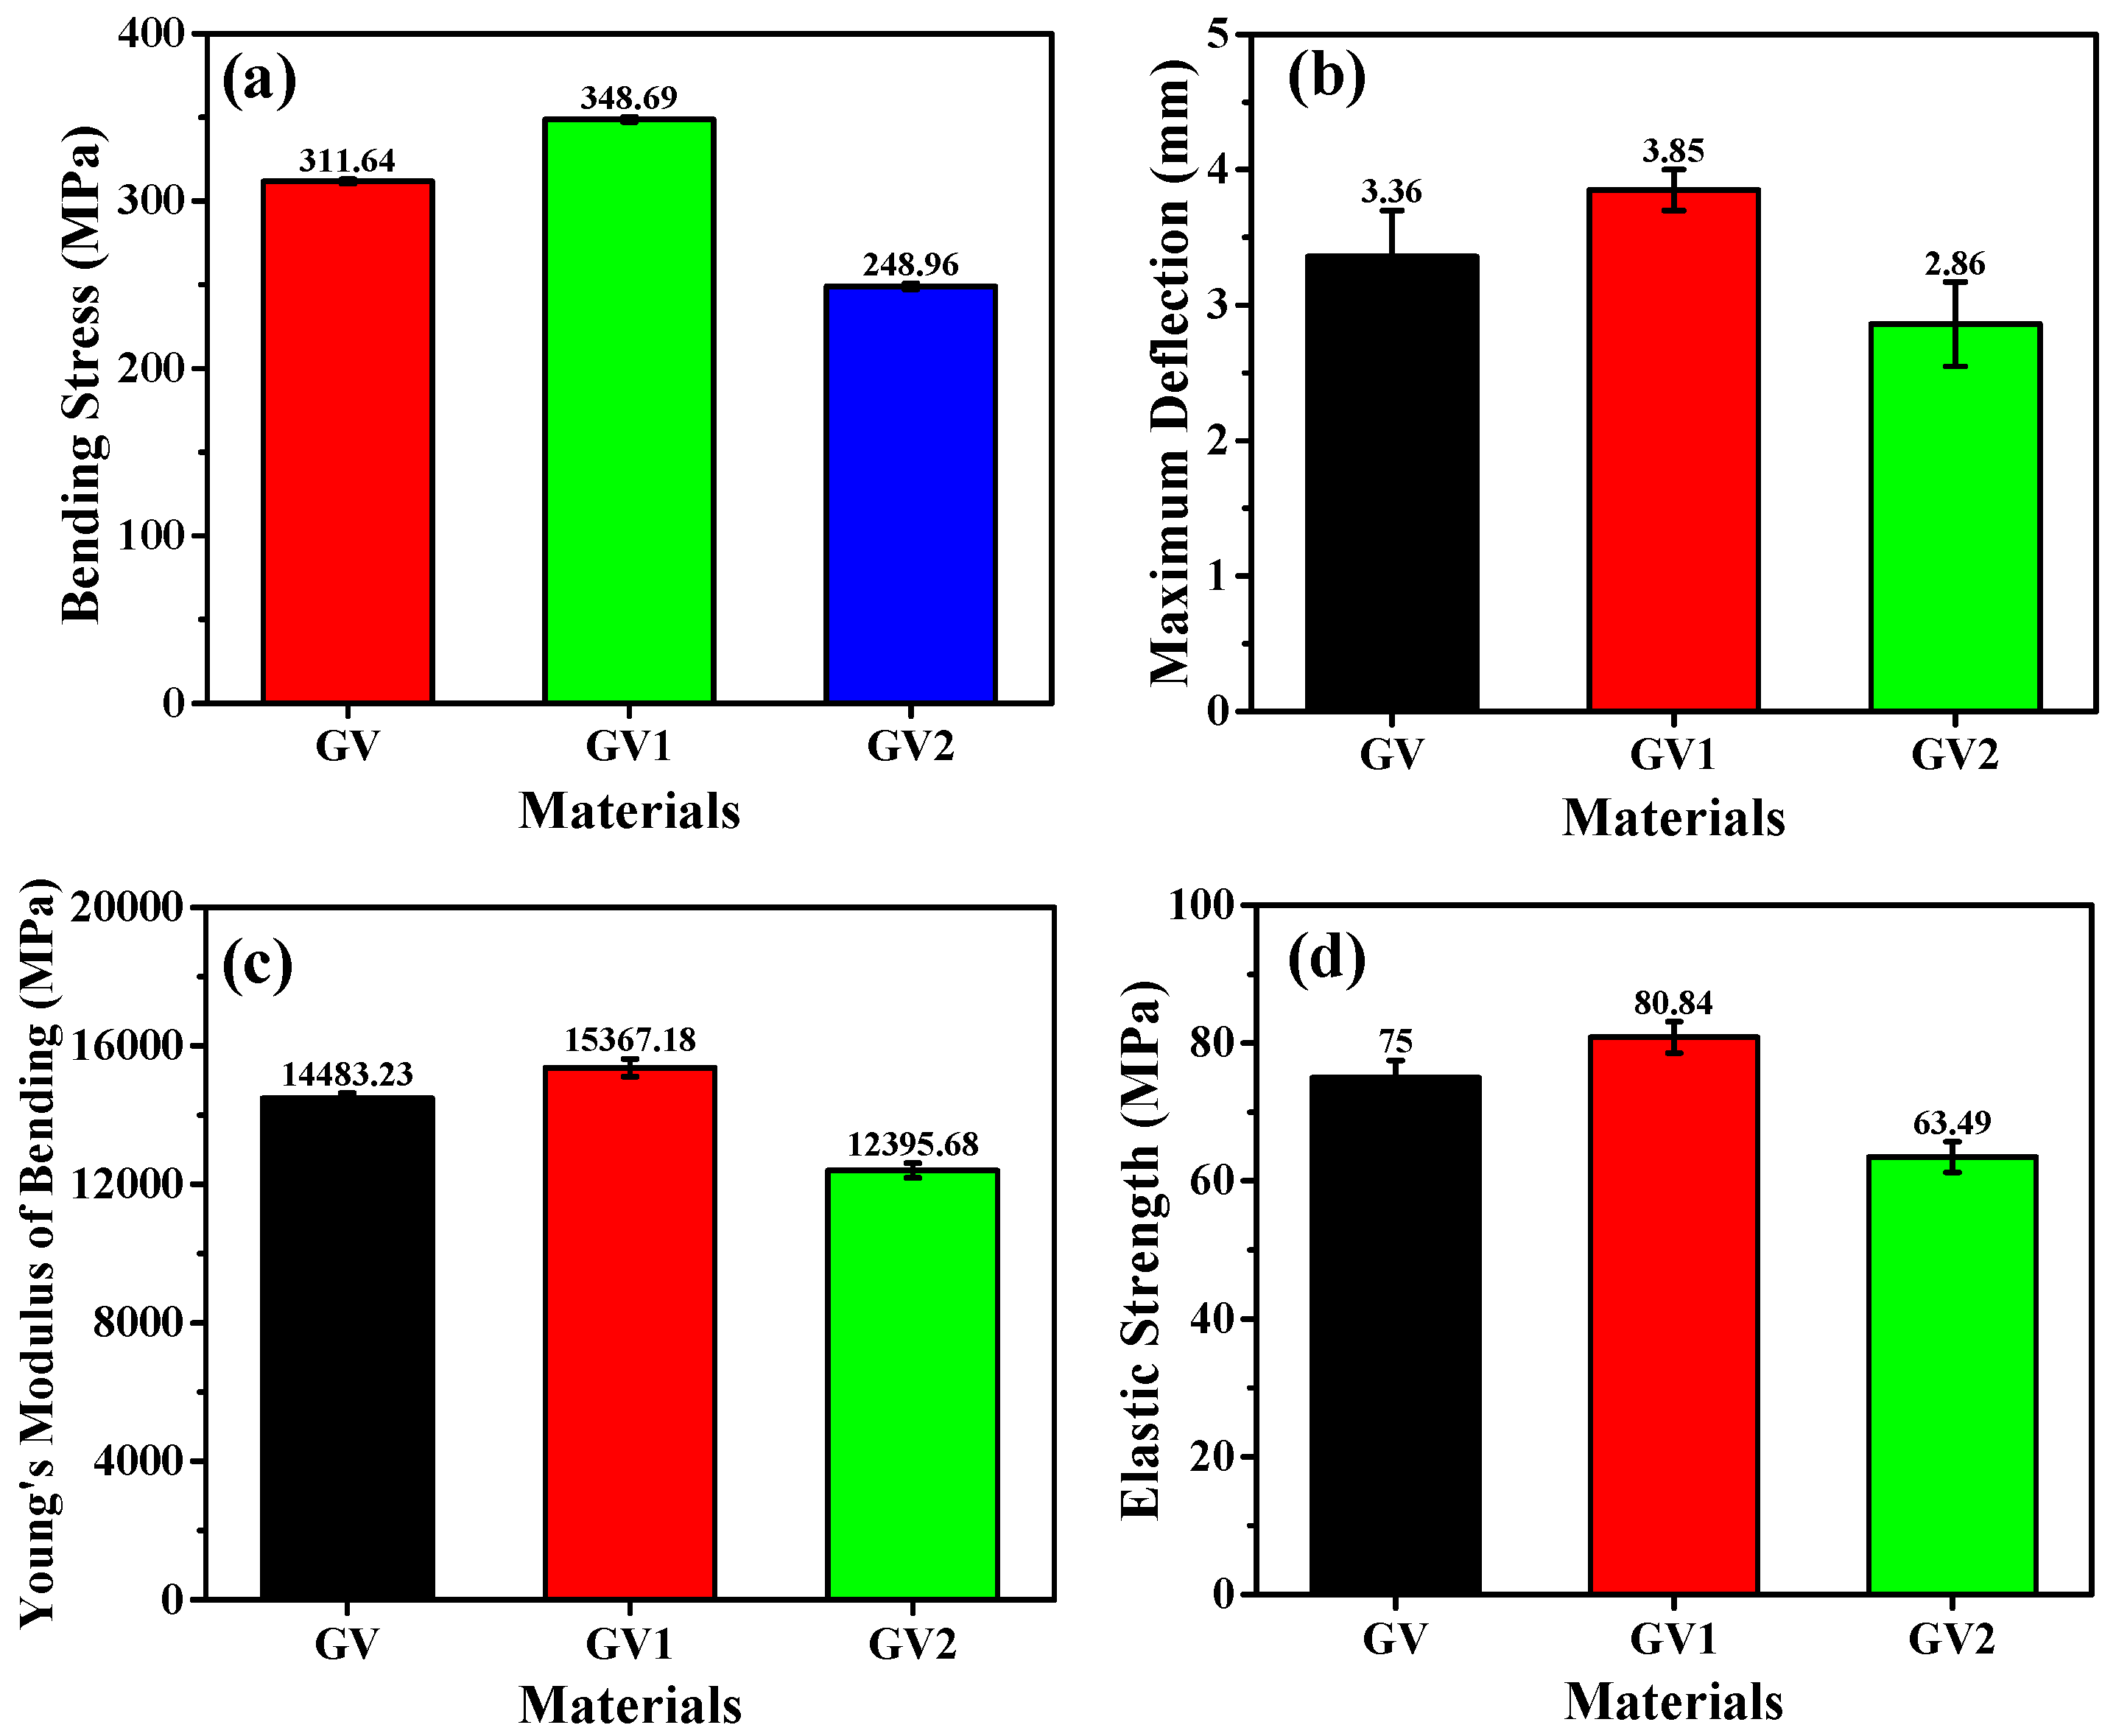
3.4. Flexural Test
3.5. Shore–D Hardness Test
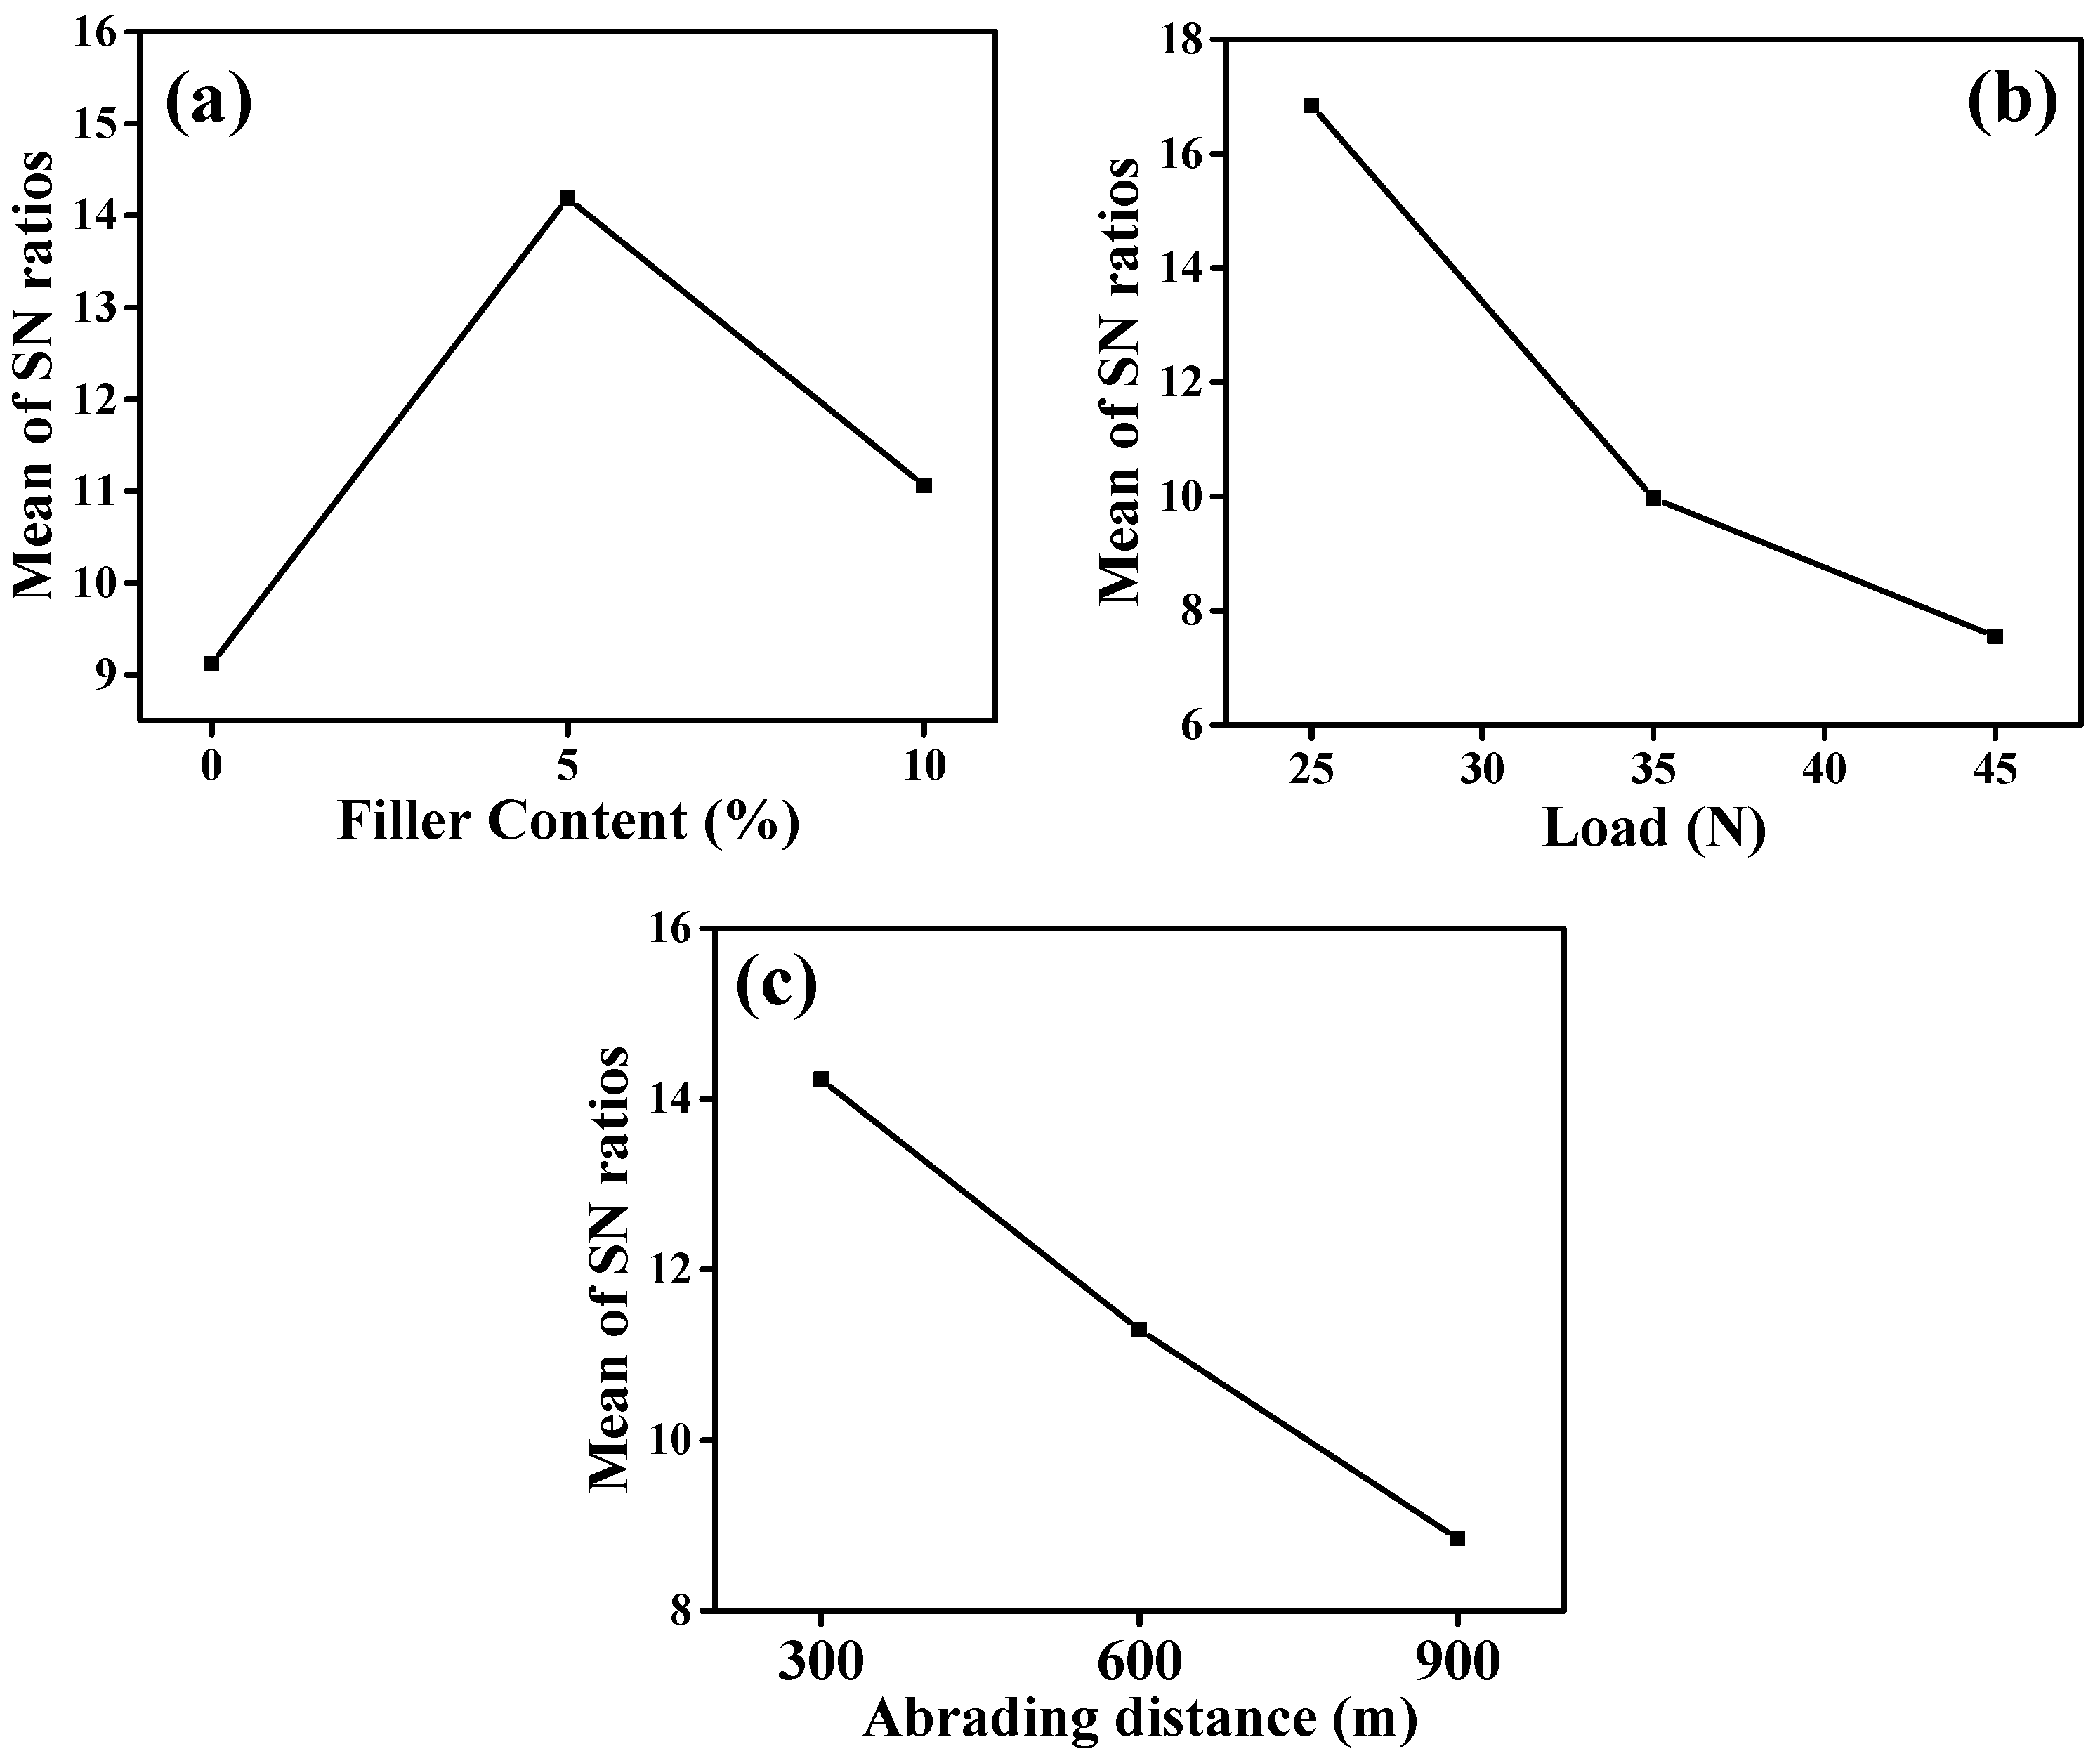
3.6. Analysis of Experimental Results by Taguchi Experimental Design
3.7. ANOVA and the Effect of Factors
4. Conclusions
- The introduction of SiO2 filler reduced the void fraction to some extent, thereby enhancing the composite’s strength. Void fractions ranging from 1.63% to 5.31% with a minimum at 0 wt. % SiO2 filler content and a maximum at 10 wt. % SiO2 filler content.
- Tensile test results on unfilled and silicon dioxide-filled E-glass–vinyl ester composites revealed that GV1 (5 wt% SiO2) exhibited higher tensile strength, Young’s modulus, and elongation in the warp direction, indicating improved fiber–matrix interaction.
- Conversely, GV2 (10 wt% SiO2) displayed lower tensile strength and elongation, suggesting increased brittleness and weaker bonding.
- Flexure test results demonstrated that GV1 had superior performance, with a higher Young’s modulus of bending, elastic strength, flexural strength, and maximum deflection, indicating improved load-bearing capacity. In contrast, GV2 exhibited reduced flexural strength and deflection, indicative of increased brittleness due to poor fiber–matrix bonding at higher filler content.
- Shore D hardness test results showed that GV1 (5 wt% SiO2) exhibits higher hardness than other specimens.
- SEM analysis of composites further highlighted wear behavior. At 25 N load and 300 m distance, only partial matrix removal and minimal fiber damage were observed, with GV1 showing the least wear loss due to improved fiber–matrix–filler interaction. At higher loads (45 N) and distances (900 m), significant matrix detachment, fiber damage, and increased wear volume were evident, attributed to abrasive particle ploughing and cutting.
- Further, studies are essential to evaluate the suitability of prepared composites for structural applications.
Supplementary Materials
Author Contributions
Funding
Data Availability Statement
Acknowledgments
Conflicts of Interest
References
- Rasin, N.; Kueh, A.B.; Mahat, M.N.; Mohd Yassin, A.Y. Stability of triaxially woven fabric composites employing geometrically nonlinear plate model with volume segmentation ABD constitution. J. Compos. Mater. 2016, 50, 2719–2735. [Google Scholar] [CrossRef]
- Shen, Y.; Branscomb, D.J. A general approach to fast prototype the topology of braided structures. Int. J. Eng. Sci. 2018, 131, 40–60. [Google Scholar] [CrossRef]
- Hou, J.; Wu, X.; Li, Z.; Li, X.; Liao, Y.; Li, L.; Luo, S.; Wu, Y.; Qing, Y. Aligned bamboo fiber-induced crystallinity mitigation of lightweight polymer composite enables ultrahigh strength and unprecedented toughness. Adv. Funct. Mater. 2024, 34, 2314559. [Google Scholar] [CrossRef]
- Chen, X.-w.; Fu, K.-k.; Li, Y. A theoretical modelling of strengthening mechanism in graphene-metal nanolayered composites. Int. J. Eng. Sci. 2024, 195, 103988. [Google Scholar] [CrossRef]
- Choi, J.-S.; Lee, H.-J.; Shin, H.-O.; Lee, J.-H.; Yoon, Y.-S. Horizontal shear behavior of self-compacting lightweight concrete composite beams with dry joints and unbonded reinforcements. Cem. Concr. Compos. 2024, 152, 105687. [Google Scholar] [CrossRef]
- Karaboğa, F.; Göleç, F.; Yunus, D.E.; Toros, S.; Öz, Y. Mechanical response of carbon fiber reinforced epoxy composite parts joined with varying bonding techniques for aerospace applications. Compos. Struct. 2024, 331, 117920. [Google Scholar] [CrossRef]
- Orlik, J.; Neusius, D.; Chakrabortty, A.; Backes, S.; Gries, T.; Steiner, K. Modelling of flat pre-strain driven structures, folding to desired surface and application to 3D-printing on textiles. Int. J. Eng. Sci. 2025, 208, 104201. [Google Scholar] [CrossRef]
- Leong, K.H.; Ramakrishna, S.; Huang, Z.; Bibo, G. The potential of knitting for engineering composites—A review. Compos.—A Appl. Sci. Manuf. 2000, 31, 197–220. [Google Scholar] [CrossRef]
- Islam, S.; Seyed Bolouri, S.E.; Kim, C.-I. Mechanics of hyperelastic composites reinforced with nonlinear elastic fibrous materials in finite plane elastostatics. Int. J. Eng. Sci. 2021, 165, 103491. [Google Scholar] [CrossRef]
- Yang, T.-B.; Zong, J.-Y.; Jia, D.-Z.; Xu, L.; Wang, Y.-Y.; Jia, L.-C.; Yan, D.-X.; Lei, J.; Li, Z.-M. Superhydrophobic stretchable conductive composite textile with weft-knitted structure for excellent electromagnetic interference shielding and Joule heating performance. Chem. Eng. J. 2024, 489, 151360. [Google Scholar] [CrossRef]
- Du, W.; Ren, H.; Xu, W.; Liu, Y. Reversible shape memory behavior of knitting-fabric reinforced polymer matrix composites. Compos. Commun. 2024, 48, 101962. [Google Scholar] [CrossRef]
- Zhou, M.; Jiang, G. Analysis of loading modes and rates on the mechanical responses of glass fiber weft-knitted biaxial tubular fabric reinforced composites. J. Ind. Text. 2024, 54, 15280837241294068. [Google Scholar] [CrossRef]
- Raji, A.; Hasani, H.; Hassanzadeh, S. Multi-cellular 3D flat-knitted composite panels strengthened by PU-foam: Manufacturing, testing and simulating. Appl. Compos. Mater. 2024, 31, 1109–1130. [Google Scholar] [CrossRef]
- Izadi, R.; Das, R.; Fantuzzi, N.; Trovalusci, P. Fracture properties of green nano fibrous network with random and aligned fiber distribution: A hierarchical molecular dynamics and peridynamics approach. Int. J. Eng. Sci. 2024, 204, 104136. [Google Scholar] [CrossRef]
- Karaoglu, İ.; Alpyildiz, T. Impact performances of monoaxial knitted fabric composites. J. Compos. Mater. 2021, 55, 2275–2287. [Google Scholar] [CrossRef]
- Zeidi, M.; Islam, S.; Park, C.B.; Kim, C.I. A pseudoelastic response of hyperelastic composites reinforced with nonlinear elastic fibrous materials: Continuum modeling and analysis. Int. J. Eng. Sci. 2024, 201, 104092. [Google Scholar] [CrossRef]
- Leong, K.; Falzon, P.; Bannister, M.; Herszberg, I. An investigation of the mechanical performance of weft-knit milano-rib glass/epoxy composites. Compos. Sci. Technol. 1998, 58, 239–251. [Google Scholar] [CrossRef]
- Ramakrishna, S. Energy absorption characteristics of knitted fabric reinforced epoxy composite tubes. J. Reinf. Plast. Compos. 1995, 14, 1121–1141. [Google Scholar] [CrossRef]
- Zhu, C.; Shi, J.; Hayashi, K.; Morikawa, H.; Sakaguchi, A.; Ni, Q. Effect of design parameters on the cushioning property of cellular fabric composites. Tex. Res. J. 2019, 89, 3692–3699. [Google Scholar] [CrossRef]
- Ramakrishna, S.; Hull, D. Energy absorption capability of epoxy composite tubes with knitted carbon fibre fabric reinforcement. Compos. Sci. Technol. 1993, 49, 349–356. [Google Scholar] [CrossRef]
- Ramakrishna, S.; Hamada, H.; Rydin, R.W.; Chou, T. Impact damage resistance of knitted glass fiber fabric reinforced polypropylene composites. Sci. Eng. Compos. Mater. 1995, 4, 61–72. [Google Scholar] [CrossRef]
- Fujita, A.; Hamada, H.; Maekawa, Z. Tensile properties of carbon fiber triaxial woven fabric composites. J. Compos. Mater. 1993, 27, 1428–1442. [Google Scholar] [CrossRef]
- Bilisik, K. Multiaxis three-dimensional weaving for composites: A review. Text. Res. J. 2012, 82, 725–743. [Google Scholar] [CrossRef]
- Ghazimoradi, M.; Carvelli, V.; Marchesi, M.C.; Frassine, R. Mechanical characterization of tetraxial textiles. J. Ind. Text. 2018, 48, 3–24. [Google Scholar] [CrossRef]
- Hu, J.; Chen, W.; Li, Y.; Gao, C.; Shi, T.; Yang, D. A triaxial tensile machine for three-dimensional membrane components: Experimental investigations and numerical simulations. Poly. Test. 2018, 65, 206–216. [Google Scholar] [CrossRef]
- Gao, Z.; Jiang, G.; Ma, P.; Zhang, Q.; Wan, A. Tear properties and meso-scale mechanism of multi-axial warp-knitted fabric from various architectures: Studied by photography. Fibers Polym. 2013, 14, 1953–1963. [Google Scholar] [CrossRef]
- Zhu, B.; Yu, T.; Tao, X. Large deformation and slippage mechanism of plain woven composite in bias extension. Compos. Part A Appl. Sci. Manuf. 2007, 38, 1821–1828. [Google Scholar] [CrossRef]
- Aiman, D.; Yahya, M.; Salleh, J. Impact properties of 2D and 3D Woven Composites: A Review. In Proceedings of the AIP Conference, Brisbane, Australia, 19–21 September 2016; AIP Publishing: Melville, NY, USA; Volume 1774. [Google Scholar]
- Zhou, X.; Ma, X.; Fan, Y.; Li, H. Tensile and bending behavior of thin-walled triaxial weave fabric composites. J. Eng. Fibers Fabr. 2019, 14, 1558925019893566. [Google Scholar] [CrossRef]
- Wu, Z.; Wang, K.; Shi, L.; Cheng, X.; Yuan, Y. Low-velocity impact response and damage tolerance of hybrid biaxial/triaxial braided composite laminates. Poly. Compos. 2023, 44, 3068–3083. [Google Scholar] [CrossRef]
- Cao, J.; Akkerman, R.; Boisse, P.; Chen, J.; Cheng, H.; de Graaf, E.; Gorczyca, J.; Harrison, P.; Hivet, G.; Launay, J.; et al. Characterization of mechanical behavior of woven fabrics: Experimental methods and benchmark results. Compos.—A Appl. Sci. Manuf. 2008, 39, 1037–1053. [Google Scholar] [CrossRef]
- Samal, S.; Thanh, N.P.; Petríková, I.; Marvalová, B.; Vallons, K.A.; Lomov, S.V. Correlation of microstructure and mechanical properties of various fabric reinforced geo-polymer composites after exposure to elevated temperature. Ceram. Int. 2015, 41, 12115–12129. [Google Scholar] [CrossRef]
- Zhang, H.; Zhou, Y.; Li, W. Behaviors of triaxial woven fabric composites reinforced concrete cylinders under eccentric compression. Text. Res. J. 2024, 94, 1959–1970. [Google Scholar] [CrossRef]
- Li, Z.; Li, W. Effect of triaxial woven fabric on bending properties of unidirectional composites. Poly. Compos. 2023, 44, 5346–5356. [Google Scholar] [CrossRef]
- Wei, Q.; Chen, J.; Liu, Y.; Zhang, H. Numerical analysis of ballistic performance in hybrid structures of triaxial and plain fabrics. J. Mater. Sci. 2024, 59, 21069–21086. [Google Scholar] [CrossRef]
- Frontczak-Wasiak, I.; Snycerski, M. Assessment of transversal deformations of multi-axial woven fabrics stretched one-directionally. Fibres Text. East. Eur. 2006, 14, 29. [Google Scholar]
- Balcerzak, M. Influence of the construction of a four-axial fabric on its properties. Fibres Text. East. Eur. 2011, 19, 88. [Google Scholar]
- Kashani, M.H.; Rashidi, A.; Crawford, B.; Milani, A. Analysis of a two-way tension-shear coupling in woven fabrics under combined loading tests: Global to local transformation of non-orthogonal normalized forces and displacements. Compos. A Appl. Sci. Manuf. 2016, 88, 272–285. [Google Scholar] [CrossRef]
- Al-Gaadi, B.; Halász, M. Deformation analysis of composite reinforcing fabrics through yarn pull-out, drape and shear tests. Fibers Polym. 2013, 14, 804–814. [Google Scholar] [CrossRef]
- El Mourid, A. Mechanical Behavior of a Triaxially Braided Textile Composite at High Temperature; Ecole Polytechnique de Montreal: Montreal, QC, Canada, 2014. [Google Scholar]
- Aruchamy, K.; Mylsamy, B.; Palaniappan, S.K.; Subramani, S.P.; Velayutham, T.; Rangappa, S.M.; Siengchin, S. Influence of weave arrangements on mechanical characteristics of cotton and bamboo woven fabric reinforced composite laminates. J. Reinf. Plast. Comp. 2023, 42, 776–789. [Google Scholar] [CrossRef]
- Islam, M.A. 3D woven structures and methods of manufacture. In Woven Textiles; Woodhead Publishing: Amsterdam, The Netherland, 2012; pp. 264–313. [Google Scholar]
- Risteska, S.; Srebrenkoska, V.; Zhezhova, S.; Srebrenkoska, S.; Risteski, S.; Jordeva, S.; Golomeova Longurova, S. The effect of textile structure reinforcement on polymer composite material mechanical behavior. Polymers 2024, 16, 3478. [Google Scholar] [CrossRef]
- Banerjee, P.K.; Mishra, S.; Ramkumar, T. Effect of sett and construction on uniaxial tensile properties of woven fabrics. J. Eng. Fibers Fabr. 2010, 5, 155892501000500202. [Google Scholar] [CrossRef]
- Behera, B.; Dash, B. An experimental investigation into structure and properties of 3D-woven aramid and PBO fabrics. J. Text. Inst. 2013, 104, 1337–1344. [Google Scholar] [CrossRef]
- Vanleeuw, B.; Carvelli, V.; Barburski, M.; Lomov, S.; van Vuure, A.W. Quasi-unidirectional flax composite reinforcement: Deformability and complex shape forming. Compos. Sci. Technol. 2015, 110, 76–86. [Google Scholar] [CrossRef]
- Aisyah, H.A.; Paridah, M.T.; Sapuan, S.M.; Ilyas, R.A.; Khalina, A.; Nurazzi, N.M.; Lee, S.H.; Lee, C.H. A Comprehensive review on advanced sustainable woven natural fibre polymer composites. Polymers 2021, 13, 471. [Google Scholar] [CrossRef] [PubMed]
- Bilisik, K.; Mohamed, M.H. Multiaxis three-dimensional flat woven preform (tube rapier weaving) and circular woven preform (radial crossing weaving). Text. Res. J. 2009, 79, 1067–1084. [Google Scholar] [CrossRef]
- Kumaran, P.; Mohanamurugan, S.; Madhu, S.; Vijay, R.; Lenin Singaravelu, D.; Vinod, A.; Sanjay, M.; Siengchin, S. Investigation on thermo-mechanical characteristics of treated/untreated portunus sanguinolentus shell powder-based jute fabrics reinforced epoxy composites. J. Ind. Text. 2020, 50, 427–459. [Google Scholar] [CrossRef]
- Praveenkumara, J.; Madhu, P.; Yashas Gowda, T.G.; Sanjay, M.R.; Siengchin, S. A comprehensive review on the effect of synthetic filler materials on fiber-reinforced hybrid polymer composites. J. Text. Inst. 2022, 113, 1231–1239. [Google Scholar] [CrossRef]
- Prabhu, L.; Krishnaraj, V.; Gokulkumar, S.; Sathish, S.; Sanjay, M.; Siengchin, S. Mechanical, chemical and sound absorption properties of glass/kenaf/waste tea leaf fiber-reinforced hybrid epoxy composites. J. Ind. Text. 2022, 51, 1674–1700. [Google Scholar] [CrossRef]
- Xie, J.; Guo, Z.; Shao, M.; Zhu, W.; Jiao, W.; Yang, Z.; Chen, L. Mechanics of textiles used as composite preforms: A review. Compos. Struct. 2023, 304, 116401. [Google Scholar] [CrossRef]
- Aravind, D.; Senthilkumar, K.; Rajini, N.; Siengchin, S.; Yorseng, K.; Kumar, T.S.M.; Chandrasekar, M.; Mohammad, F.; Al-Lohedan, H.A. Flexural, impact, and dynamic mechanical analysis of glass fiber/ABS and glass fiber/carbon fiber/ABS composites. J. Appl. Poly. Sci. 2023, 140, e54007. [Google Scholar] [CrossRef]
- Reddy, P.C.G.M.S.; Rajendrachari, S.; Mahale, R.S.; Mahesh, V.; Pandith, A. The behavior of banyan (B)/banana (Ba) fibers reinforced hybrid composites influenced by chemical treatment on tensile, bending and water absorption behavior: An experimental and FEA investigation. J. Comp. Sci. 2024, 8, 31. [Google Scholar] [CrossRef]
- Bilisik, K.; Karaduman, N.S.; Bilisik, N.E. Fiber Architectures for Composite Applications, Fibrous and Textile Materials for Composite Applications; Springer: Berlin/Heidelberg, Germany, 2016; pp. 75–134. [Google Scholar] [CrossRef]
- Zhao, Z.; Li, B.; Ma, P. Advances in mechanical properties of flexible textile composites. Compos. Struct. 2023, 303, 116350. [Google Scholar] [CrossRef]
- Chowdhury, I.R.; Summerscales, J. Woven fabrics for composite reinforcement: A review. J. Compos. Sci. 2024, 8, 280. [Google Scholar] [CrossRef]
- El-Messiry, M.; Youssef, S. Analysis of stress–strain of architect woven fabric strength under biaxial extensions. Alex. Eng. J. 2011, 50, 297–303. [Google Scholar] [CrossRef]
- Fallahi, H.; Taheri-Behrooz, F.; Asadi, A. Nonlinear mechanical response of polymer matrix composites: A review. Poly. Rev. 2019, 60, 42–85. [Google Scholar] [CrossRef]
- Liu, Y.; Straumit, I.; Vasiukov, D.; Lomov, S.V.; Panier, S. Prediction of linear and non-linear behavior of 3D woven composite using mesoscopic voxel models reconstructed from X-ray micro-tomography. Compos. Struct. 2017, 179, 568–579. [Google Scholar] [CrossRef]
- Mulenga, T.K.; Ude, A.U.; Vivekanandhan, C. Techniques for modelling and optimizing the mechanical properties of natural fiber composites: A review. Fibers 2021, 9, 6. [Google Scholar] [CrossRef]
- Barburski, M.; Masajtis, J. Modelling of the change in structure of woven fabric under mechanical loading. Fibres Text. East. Eur. 2009, 17, 72. [Google Scholar]
- Hahn, L.; Zierold, K.; Golla, A.; Friese, D.; Rittner, S. 3D Textiles Based on Warp Knitted Fabrics: A Review. Materials 2023, 16, 3680. [Google Scholar] [CrossRef] [PubMed]
- Thomason, J.; Vlug, M.; Schipper, G.; Krikor, H. Influence of fibre length and concentration on the properties of glass fibre-reinforced polypropylene: Part 3. Strength and strain at failure. Compos.—A Appl. Sci. Manuf. 1996, 27, 1075–1084. [Google Scholar] [CrossRef]
- Lee, N.-J.; Jang, J. The effect of fibre content on the mechanical properties of glass fibre mat/polypropylene composites. Compos.—A Appl. Sci. Manuf. 1999, 30, 815–822. [Google Scholar] [CrossRef]
- Agarwal, B.; Broutman, L. Analysis and Performance of Fiber Composites, 2nd ed.; John Wiley & Sons: Hoboken, NJ, USA, 1990. [Google Scholar]


| Sample Code | Vinyl Ester Resin (wt. %) | E-Glass Fiber (wt. %) | SiO2 Filler (wt. %) |
|---|---|---|---|
| GV | 40 | 60 | 0 |
| GV1 | 35 | 60 | 5 |
| GV2 | 30 | 30 | 10 |
| Materials | Measured Density (g/cm3) | Theoretical Density (g/cm3) | Void Fraction (%) |
|---|---|---|---|
| GV | 1.6070 | 1.6337 | 1.63 |
| GV1 | 1.6334 | 1.7106 | 4.51 |
| GV2 | 1.6812 | 1.7755 | 5.31 |
| Material | Tensile Strength (MPa) | Young’s Modulus (MPa) | Elongation (%) | Stress at Break (MPa) | ||||||||||||
|---|---|---|---|---|---|---|---|---|---|---|---|---|---|---|---|---|
| Warp | *SD | Weft | *SD | Warp | *SD | Weft | *SD | Warp | *SD | Weft | *SD | Warp | *SD | Weft | *SD | |
| GV | 261.05 | 2.77 | 60.70 | 0.92 | 4178.89 | 86.67 | 2757.45 | 58.81 | 10.76 | 0.31 | 5.74 | 0.34 | 52.21 | 0.85 | 12.14 | 0.69 |
| GV1 | 278.67 | 0.90 | 60.20 | 0.82 | 4363.14 | 73.54 | 2923.66 | 47.66 | 11.8 | 0.36 | 5.6 | 0.3 | 55.73 | 0.61 | 12.04 | 0.67 |
| GV2 | 232.07 | 1.04 | 28.60 | 0.72 | 3580.6 | 55.33 | 2714.31 | 57.42 | 9.96 | 0.58 | 4.58 | 0.26 | 46.41 | 0.73 | 5.72 | 0.73 |
| Materials | Maximum Deflection (mm) | *SD | Maximum Bending Stress at Maximum Load (MPa) | *SD | Young’s Modulus of Bending (MPa) | *SD | Elastic Strength (MPa) | *SD |
|---|---|---|---|---|---|---|---|---|
| GV | 3.36 | 0.24 | 311.64 | 1.3 | 14,483.23 | 149.69 | 75.00 | 2.52 |
| GV1 | 3.85 | 0.15 | 348.69 | 1.5 | 15,367.18 | 258.91 | 80.84 | 2.26 |
| GV2 | 2.86 | 0.21 | 248.96 | 1.8 | 12,395.68 | 209.32 | 63.49 | 2.21 |
| Materials. | Shore–D Hardness | Standard Deviation |
|---|---|---|
| GV | 71 | 3.511 |
| GV1 | 74 | 4.042 |
| GV2 | 72 | 2.517 |
| Si no | Material | Load (N) | Abrading Distance (m) | Initial Weight (W1) (g) | Final Weight (W2) (g) | Wear Loss (g) | Wear Volume | S/N Ratio (dB) |
|---|---|---|---|---|---|---|---|---|
| 1 | GV | 25 | 300 | 11.4513 | 11.1820 | 0.2693 | 0.1674 | 15.7184 |
| 2 | GV | 25 | 600 | 11.8515 | 11.5106 | 0.3409 | 0.2119 | 13.5087 |
| 3 | GV | 25 | 900 | 11.2437 | 10.7945 | 0.4492 | 0.2792 | 10.8569 |
| 4 | GV | 35 | 300 | 11.2984 | 10.8035 | 0.4949 | 0.3076 | 10.3014 |
| 5 | GV | 35 | 600 | 10.9484 | 10.2770 | 0.6714 | 0.4173 | 7.3677 |
| 6 | GV | 35 | 900 | 11.0594 | 10.2343 | 0.8251 | 0.5128 | 5.9632 |
| 7 | GV | 45 | 300 | 11.4377 | 10.8686 | 0.5691 | 0.3537 | 8.7726 |
| 8 | GV | 45 | 600 | 11.2712 | 10.4054 | 0.8658 | 0.5381 | 5.5748 |
| 9 | GV | 45 | 900 | 11.3407 | 10.3170 | 1.0237 | 0.6362 | 3.9907 |
| 10 | GV1 | 25 | 300 | 11.1930 | 11.0848 | 0.1082 | 0.0655 | 24.182 |
| 11 | GV1 | 25 | 600 | 11.7398 | 11.6037 | 0.1361 | 0.0824 | 21.348 |
| 12 | GV1 | 25 | 900 | 11.4604 | 11.2565 | 0.2039 | 0.1234 | 18.0003 |
| 13 | GV1 | 35 | 300 | 11.4288 | 11.1681 | 0.2607 | 0.1578 | 15.5598 |
| 14 | GV1 | 35 | 600 | 11.2622 | 10.8246 | 0.4376 | 0.2648 | 12.0018 |
| 15 | GV1 | 35 | 900 | 11.2519 | 10.7223 | 0.5296 | 0.3205 | 9.9013 |
| 16 | GV1 | 45 | 300 | 10.1221 | 9.7181 | 0.4040 | 0.2445 | 12.2056 |
| 17 | GV1 | 45 | 600 | 11.3755 | 10.7552 | 0.6203 | 0.3754 | 8.3835 |
| 18 | GV1 | 45 | 900 | 11.3849 | 10.5517 | 0.8332 | 0.5042 | 6.1034 |
| 19 | GV2 | 25 | 300 | 10.5592 | 10.3819 | 0.1773 | 0.1086 | 18.583 |
| 20 | GV2 | 25 | 600 | 11.1458 | 10.8938 | 0.2520 | 0.1543 | 16.5349 |
| 21 | GV2 | 25 | 900 | 11.0836 | 10.6956 | 0.3880 | 0.2376 | 12.8813 |
| 22 | GV2 | 35 | 300 | 10.9850 | 10.5646 | 0.4204 | 0.2574 | 12.2047 |
| 23 | GV2 | 35 | 600 | 10.7500 | 10.2135 | 0.5365 | 0.3285 | 9.4325 |
| 24 | GV2 | 35 | 900 | 10.9740 | 10.2616 | 0.7124 | 0.4362 | 7.0262 |
| 25 | GV2 | 45 | 300 | 10.9536 | 10.4509 | 0.5027 | 0.3078 | 10.5182 |
| 26 | GV2 | 45 | 600 | 10.8563 | 10.1713 | 0.6850 | 0.4194 | 7.482 |
| 27 | GV2 | 45 | 900 | 10.8890 | 9.9825 | 0.9065 | 0.5550 | 4.896 |
| Level | Filler (%) A | Load(N) B | Abrading Distance (m) C |
|---|---|---|---|
| 1 | 9.117 | 16.846 | 14.227 |
| 2 | 14.187 | 9.973 | 11.293 |
| 3 | 11.062 | 7.547 | 8.847 |
| DELTA | 5.070 | 9.299 | 5.381 |
| RANK | 3 | 1 | 2 |
| Source | DF * | Seq SS ** | Adj SS # | Adj MS @ | F | P | P(%) | Rank |
|---|---|---|---|---|---|---|---|---|
| Filler | 2 | 0.091875 | 0.091875 | 0.045938 | 203.14 | 0.000 | 14.7 | 3 |
| Load | 2 | 0.355948 | 0.355948 | 0.177974 | 787.02 | 0.000 | 57.1 | 1 |
| Abrading distance | 2 | 0.148478 | 0.148478 | 0.074239 | 328.29 | 0.000 | 23.8 | 2 |
| Filler × Load | 4 | 0.002005 | 0.002005 | 0.000501 | 2.22 | 0.157 | 0.32 | 6 |
| Filler × Abrading distance | 4 | 0.002127 | 0.002127 | 0.000532 | 2.35 | 0.141 | 0.34 | 5 |
| Load × Abrading distance | 4 | 0.020738 | 0.020738 | 0.005185 | 22.93 | 0.000 | 3.32 | 4 |
| Error | 8 | 0.001809 | 0.001809 | 0.000226 | 0.29 | |||
| Total | 26 | 0.622980 | 100 |
Disclaimer/Publisher’s Note: The statements, opinions and data contained in all publications are solely those of the individual author(s) and contributor(s) and not of MDPI and/or the editor(s). MDPI and/or the editor(s) disclaim responsibility for any injury to people or property resulting from any ideas, methods, instructions or products referred to in the content. |
© 2025 by the authors. Licensee MDPI, Basel, Switzerland. This article is an open access article distributed under the terms and conditions of the Creative Commons Attribution (CC BY) license (https://creativecommons.org/licenses/by/4.0/).
Share and Cite
Somanna, R.; Madegowda, R.B.; Mahesh Bilwa, R.; Vishveshwaraiah, P.M.; Siddegowda, P.N.; Bagrae, S.; Sangameshwara, M.B.; Nagaraju, G.H.; Puttaswamy, M. Study of Mechanical and Wear Properties of Fabricated Tri-Axial Glass Composites. J. Compos. Sci. 2025, 9, 409. https://doi.org/10.3390/jcs9080409
Somanna R, Madegowda RB, Mahesh Bilwa R, Vishveshwaraiah PM, Siddegowda PN, Bagrae S, Sangameshwara MB, Nagaraju GH, Puttaswamy M. Study of Mechanical and Wear Properties of Fabricated Tri-Axial Glass Composites. Journal of Composites Science. 2025; 9(8):409. https://doi.org/10.3390/jcs9080409
Chicago/Turabian StyleSomanna, Raghu, Rudresh Bekkalale Madegowda, Rakesh Mahesh Bilwa, Prashanth Malligere Vishveshwaraiah, Prema Nisana Siddegowda, Sandeep Bagrae, Madhukar Beejaganahalli Sangameshwara, Girish Hunaganahalli Nagaraju, and Madhusudan Puttaswamy. 2025. "Study of Mechanical and Wear Properties of Fabricated Tri-Axial Glass Composites" Journal of Composites Science 9, no. 8: 409. https://doi.org/10.3390/jcs9080409
APA StyleSomanna, R., Madegowda, R. B., Mahesh Bilwa, R., Vishveshwaraiah, P. M., Siddegowda, P. N., Bagrae, S., Sangameshwara, M. B., Nagaraju, G. H., & Puttaswamy, M. (2025). Study of Mechanical and Wear Properties of Fabricated Tri-Axial Glass Composites. Journal of Composites Science, 9(8), 409. https://doi.org/10.3390/jcs9080409