Article

Doping Carbon Coating on Glass Fiber to Enhance Its Reinforcing Potential in a Polymer Matrix

1
Institute of Materials Research and Engineering, Agency for Science, Technology and Research (A*STAR), 2 Fusionopolis Way, Innovis, #08-03, Singapore 138634, Singapore
2
Department of Chemical and Biomolecular Engineering, National University of Singapore, 10 Kent Ridge Crescent, Singapore 117585, Singapore
*
Author to whom correspondence should be addressed.
J. Compos. Sci. 2025, 9(7), 348; https://doi.org/10.3390/jcs9070348
Submission received: 19 May 2025 / Revised: 3 July 2025 / Accepted: 3 July 2025 / Published: 6 July 2025
(This article belongs to the Special Issue Polymer Composites and Fibers, 3rd Edition)

Abstract

This research investigates a novel hybrid E-glass fiber coated with a thin amorphous carbon (coke) layer, referred to as GF@C, designed to enhance the affinity of fiber with a polymer matrix. Acrylonitrile butadiene styrene (ABS), an engineering thermoplastic, was selected as the matrix to form the composite. The carbon coating was produced by pyrolyzing a lubricant oil (Lo) layer applied to the glass fiber strands. To promote the formation of graphite crystallites during carbonization, a small amount (x wt.% of Lo) of coronene (Cor) was added to Lo as a dopant. The resulting doped fibers, denoted GF@CLo-Cor(x%), were embedded in ABS at 70 wt.%, leading to significant improvements in mechanical properties. At the optimal doping level (x = 5), the composite achieved a Young’s modulus of 1.02 GPa and a tensile strength of 6.96 MPa, substantially higher than the 0.4 GPa and 3.81 MPa observed for the composite with the pristine GF. This enhancement is attributed to a distribution of graphite crystallites and their graphitization extent in the carbon coating, which improves interfacial bonding and increases chain entanglement. Additionally, GF@CLo-Cor(x%)–ABS composites (x = 0 and 5) exhibit significantly higher dielectric constant–temperature profiles than GF–ABS, attributed to the formation of diverse chain adsorption states on the C-coating.

1. Introduction

Fiber-reinforced polymer (FRP) composites, composed of various fibers and polymer matrixes, have been broadly adopted in various industry sectors such as transportation (automotive and aerospace), construction, marine engineering, corrosion-resistant equipment, etc., all of which greatly value strong yet lightweight materials [1]. With ongoing advancements in this field [2], the evolution is primarily driven by the demand for materials with high specific strength, typically possessing tensile strengths ranging approximately from 100 to 1000 MPa and densities around 1.1 g/cm3 [3] or specific modulus thresholds, e.g., 25 GPa/g/cm3 [4], both of which match or exceed those of metallic materials. These strength-to-weight ratios vary depending on the fiber type. In addition to specific strength, other properties such as fatigue strength, toughness, wear resistance at elevated temperatures [5], electrical conductivity, and environmental durability are also concerns [6,7].
There are two primary categories of FRP composites commonly prepared through compression molding: (1) unidirectional FRPs, in which continuous, aligned fibers are embedded parallel to the loading direction, providing superior tensile strength in that direction [8]; and (2) composites with randomly oriented short fibers distributed within the polymer matrix [9,10]. Hybrid designs that integrate both configurations have also been explored [11]. For FRPs with short fibers, two major processing requirements must be met: random and uniform fiber dispersion within the polymer matrix, and strong interfacial bonding between fiber and matrix. Fiber content is another decisive factor influencing mechanical performance [12]. Techniques such as extrusion molding, injection molding, and compression molding are commonly employed to fabricate these composites [13,14,15].
The mechanical properties of short fiber-reinforced composites largely depend on factors such as fiber volume fraction, critical fiber length, individual fiber strength, and the quality of the fiber–matrix interface at the microscopic level [16,17,18]. It has been shown that optimal reinforcement is achieved when the mean fiber length approaches the critical length, while excessive length yields diminishing returns [19]. Since load transfer from matrix to fiber is central to reinforcement, the molecular design of the fiber–matrix interface is essential. Fibers commonly used include glass fiber (GF), carbon fiber (CF), aramid fiber, basalt fiber, and natural fibers, which present different surface chemical properties because of both different surface electronic states and surface morphologies [20].
Although increasing fiber content generally enhances strength [21,22], current research increasingly focuses on optimizing the interface to not only improve bond strength, but also address challenges such as thermal expansion mismatch between fiber and matrix [23,24] and improve fracture toughness [18,25]. Interestingly, composites combining short GF and CF have demonstrated enhanced crack arresting capability owing to their distinct interfacial structures, stemming from the differing surface compositions, i.e., alumino-borosilicate for GF and graphene-like sheets for CF [26], which result in diverse fiber–polymer interfaces consisting of a variety of nanoscale environments. This highlights the importance of tailored interface design to balance strength and toughness.
There have been several approaches developed to date to enhance the fiber–matrix interface. These include physical and chemical means aiming to promote physicochemical adsorption and mechanical interlocking. Physical strategies involve increasing specific surface area and surface roughness at microlevel [27], using hybrid fibers [28], or applying polymer-compatible coating on fibers [29]. Chemical modifications include introducing oxygen-containing functional groups through oxidation, grafting polymers or nanoparticles, and employing chemical vapor deposition to anchor functional groups or nanoscale features to the fiber surface [30].
To date, E-glass fiber (GF) is the most commonly modified type of glass material due to its low cost and relatively high tensile strength (~3400 MPa), despite having a lower modulus (~77 GPa) and higher density (~2.54 g/cm3) compared to carbon fiber (~240 GPa modulus) [31]. While other types of GF, such as S2-GF and R-GF, offer better mechanical performance, they are more expensive [32]. Thus, for cost-sensitive applications, E-GF remains the preferred option, often used with surface modification treatments.
Recent developments in GF surface modification include the following:
  • Affixing 2D nanomaterials such as MXene, graphene oxide (GO), or carbon nanotubes (CNTs) to GF through techniques like electrophoretic deposition, covalent grafting, or electrothermal shock, respectively. These methods introduce nanoscale hierarchies and functional groups, strengthening interactions with epoxy matrices and enhancing interfacial adhesion [33,34,35].
  • Growing silane coupling sites with the general structure GF(-O-)3Si-R, in which R groups can be tailored for chemical and physical bonding with a specific polymer matrix [36,37]. R groups can also be extended into vinyl oligomers like poly(vinyl acetate), leading to entangled interfaces that improve toughness [38].
Among these surface modification tactics, coating GF with a thin polymer layer remains a cost-effective and practical method to enhance fiber–matrix adhesion. The present study investigates a novel and scalable method to coat short GF strands with an amorphous carbon layer via pyrolysis of an oil-based coating. This approach produces carbon-sheathed GF filaments (GF@C), where graphite crystallites are developed in the carbon shell during carbonization. Previous attempts at carbonizing GF via hydrothermal carbonization (HTC) yielded sparse carbon domains and joint formation between filaments due to poor wettability of glucose-derived HTC species, leading to suboptimal carbon nucleation and limited relevance for FRP applications [39]. Additionally, nano-hierarchical coatings using two-dimensional metal organic frameworks (2D-MOFs), GO, and CNTs have been explored but require complex processing steps.
In contrast, the pyrolysis-based coating method (on the GF strands) presented here offers a facile, potentially scalable approach. It involves applying an oil layer on cleaned GF strands, solvent evaporation, curing, and pyrolysis, all conducted in a single crucible. Electron microscopy confirms the formation of a well-defined GF core with a carbon sheath. The oil composition, especially the presence and concentration of a polycyclic aromatic hydrocarbon (PAH) compound, significantly affects the formation of graphite crystallites and their size distribution in the carbon layer. It has been verified that the resulting carbon coating enhances mechanical and dielectric properties of FRP composites prepared via compression molding. Furthermore, this study proposes fundamental understanding of the property changes caused by replacing CF with GF@C in polymer composites.

2. Materials and Methods

2.1. Material and Chemicals

Chopped strands of E-Glass Fibers (average length 3.6 mm, diameter ~13 μm, Alfa Chemistry, Holbrook, NY, USA), Hydrogen peroxide H2O2 (30% w/w, 100 mL, Sigma-Aldrich, St. Louis, MO, USA), Hydrochloric Acid (HCl, 37% aq., ACS reagent, Sigma-Aldrich, St. Louis, MO, USA), Hydrofluoric Acid (HF, 48% aq., ACS reagent, Sigma-Aldrich, St. Louis, MO, USA), Coronene (97%, 0.5 g, Sigma-Aldrich, St. Louis, MO, USA), Pyrene (98%, 1 g, Sigma-Aldrich, St. Louis, MO, USA), Acrylonitrile butadiene styrene (ABS) powders (300 mesh, >99%, Alfa Chemistry, Holbrook, NY, USA), polyethylene glycol (PEG-600, 1-L, Sigma Aldrich, St. Louis, MO, USA), Lubricant Oil (Mobil Jet Oil II, d = 1.0035 g/mL, with bulk oil stability at temperatures up to 204 °C), 2-Propanol (≥99.5%, ACS reagent Sigma Aldrich, St. Louis, MO, USA), Methyl ethyl ketone (≥99.0%, ACS reagent, Sigma-Aldrich, St. Louis, MO, USA), tert-Butanol (≥99.5%, anhydrous, Sigma Aldrich, St. Louis, MO, USA), and WD-40 (a lubricant and rust preventive, Alk Chin Hin store, Singapore). Table 1 presents the typical physical properties of E-Glass Fiber, ABS resin, and aviation lubricant oil.

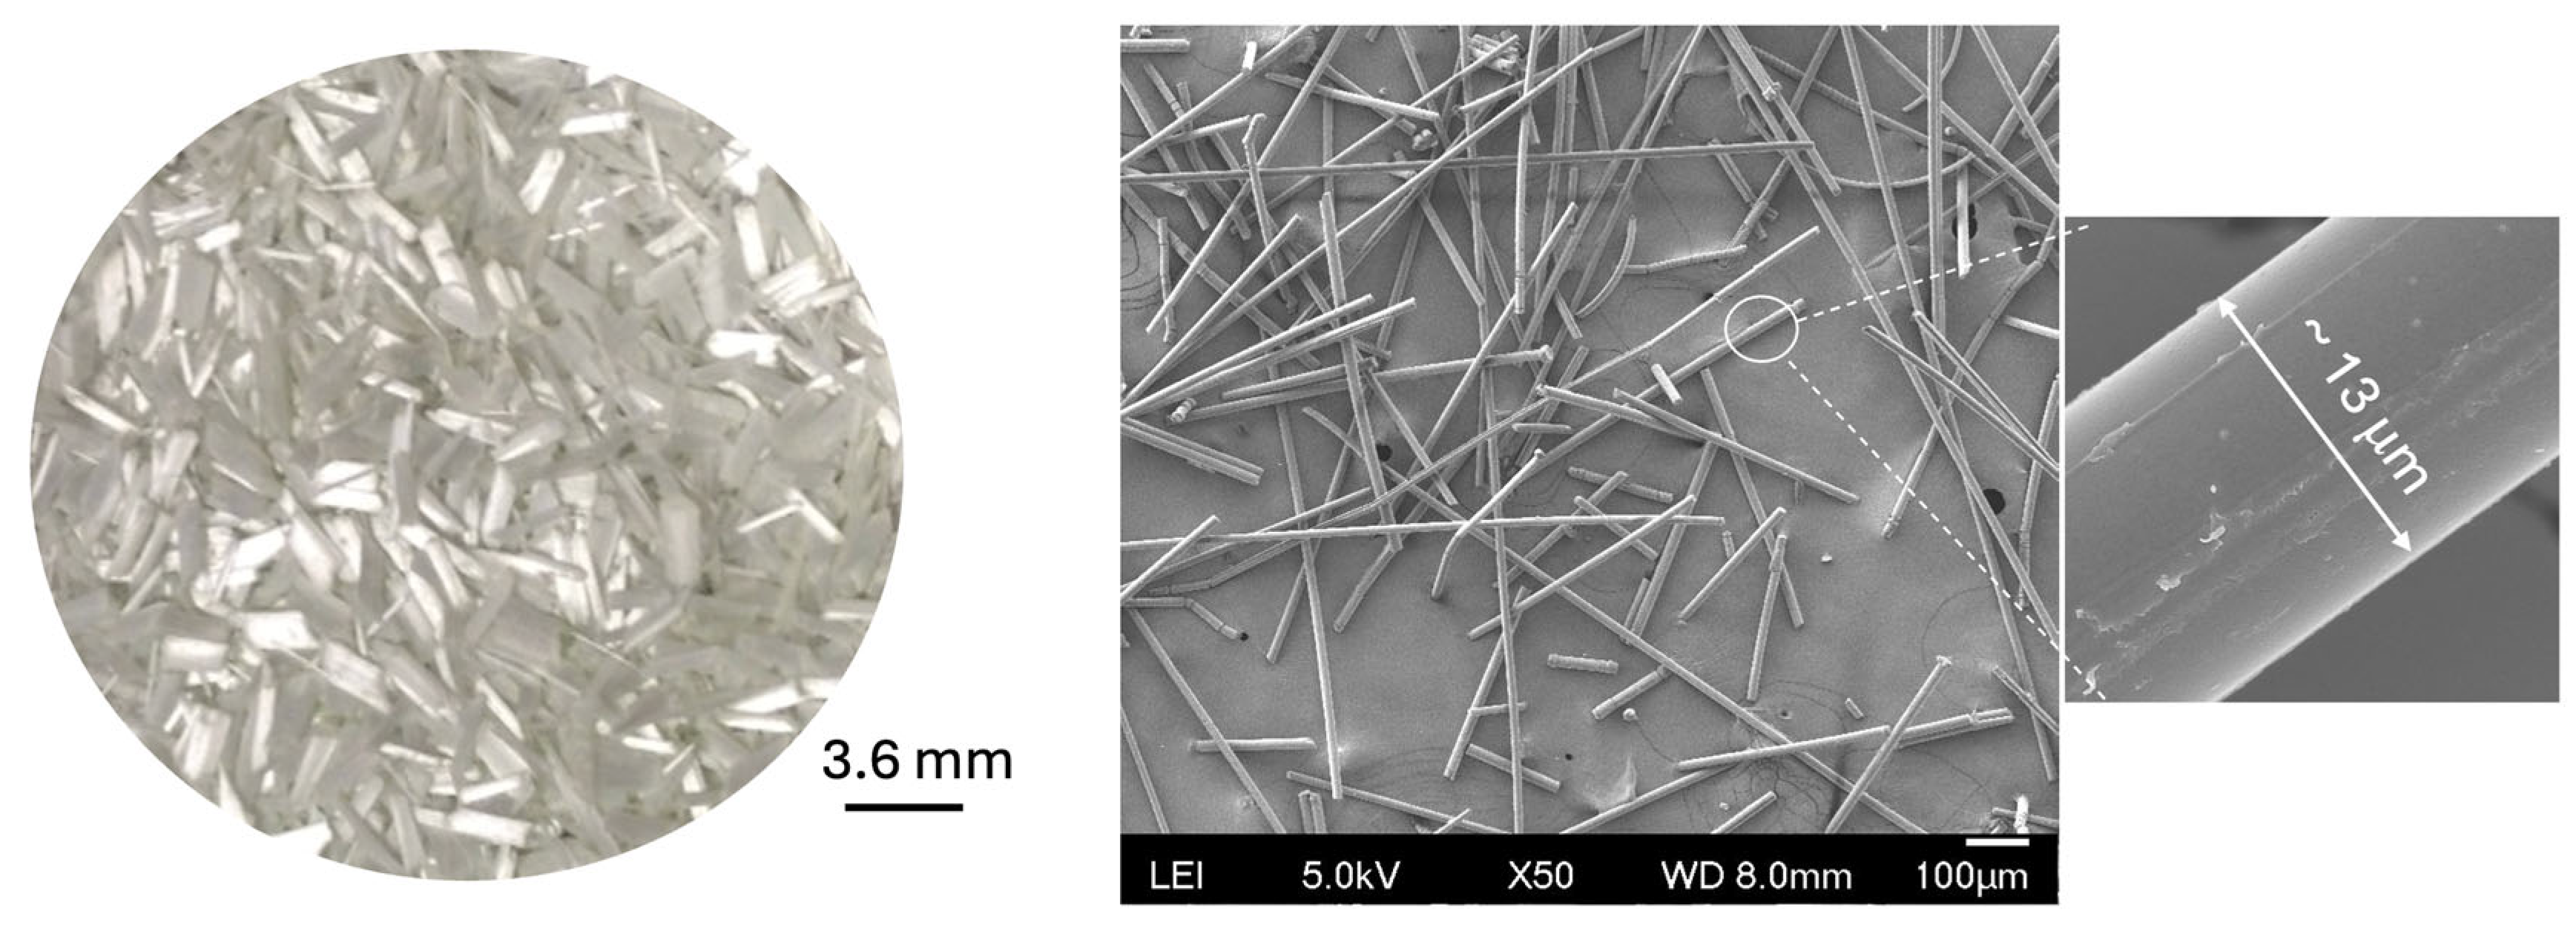
2.2. Cleaning and Activating Short E-Glass Fiber

The glass fiber was obtained in the form of chopped strands that were densely clumped together (Figure 1, left). To ensure effective exposure of each individual fiber to the formulated coating ink (described below), a pretreatment process was carried out comprising the following steps: (a) The fibers were ground using a mortar and pestle (approx. 80 mL, Cole & Mason, Holly Springs, NC, USA) with a coarse surface. (b) Two grams of ground GF strands were cleaned in 10 mL of hydrogen peroxide (H2O2) in a 20 mL centrifuge tube, which was placed in a laboratory ultrasonic bath (XPD360-6L, SharperTek, Pontiac MI, USA). The sonication was performed for 1 h at approximately 20,000 Hz to effectively remove particulate, organic, and metallic impurities adhering to the GF strands [40]. (c) The GF strands were separated from the peroxide solution via centrifugation, followed by three rinse-and-drain cycles using deionized (DI) water. (d) The fiber surfaces were activated [41] by ultrasonication in concentrated hydrochloric acid (37%) in a 50 mL beaker under the same sonication conditions. The treated strands were subsequently washed three times with DI water, each wash involving stirring and careful removal of the surface meniscus. Finally, the GF strands were dried in an oven at 80 °C overnight and then shown to have various lengths (Figure 1, right).

2.3. Wrapping the Prepared GF Strands with a Carbon Thin Layer

Lubricant oil (0.2 g) was used as the precursor for the carbon (C) coating. Alternatively, other hydrocarbon compounds suitable for carbonization may serve as the precursor. The precursor, along with a polyaromatic hydrocarbon (PAH) such as coronene (3 to 7 wt% of the precursor), and t-butanol (99%, 20 mL) as a diluent, were combined in a 30 mL crucible. The mixture was subjected to ultrasonication for 2 min at room temperature to form a homogeneous liquid mixture, hereafter referred to as the “coating ink.” Coronene acts as a graphitization seed to facilitate graphite crystallite formation during carbonization. Next, 0.8 g of the pretreated GF strands was added to the coating ink and sonicated for several minutes to ensure uniform dispersion of fibers within the mixture, resulting in a stable suspension. The crucible was then transferred to a box furnace (Carbolite 1200) for heat treatment with a ramp rate of 2.5 °C/min up to 260 °C. The temperature was held for 20 min to evaporate t-butanol and thermally cure the oil-based precursor in air. This process resulted in GF strands coated with a cured oil layer comprising approximately 20 wt%.

2.4. Formation of a Carbon Coating on GF Filaments

The oil-coated GF filaments were transferred into a porcelain combustion boat and placed in a ceramic tube furnace (Nabertherm 1300). The furnace was purged with argon gas (500 mL/min) for 30 min prior to heating. The temperature was then raised from ambient (~25 °C) to 800 °C at a rate of 5 °C/min and held at 800 °C for 2 h to carbonize the precursor coating. Argon purging (100 mL/min) was maintained throughout the carbonization and cooling stages. The resulting GF@C filaments were collected for subsequent composite fabrication. Multiple GF@C variants were produced using different coating ink compositions, as listed in Table 2.

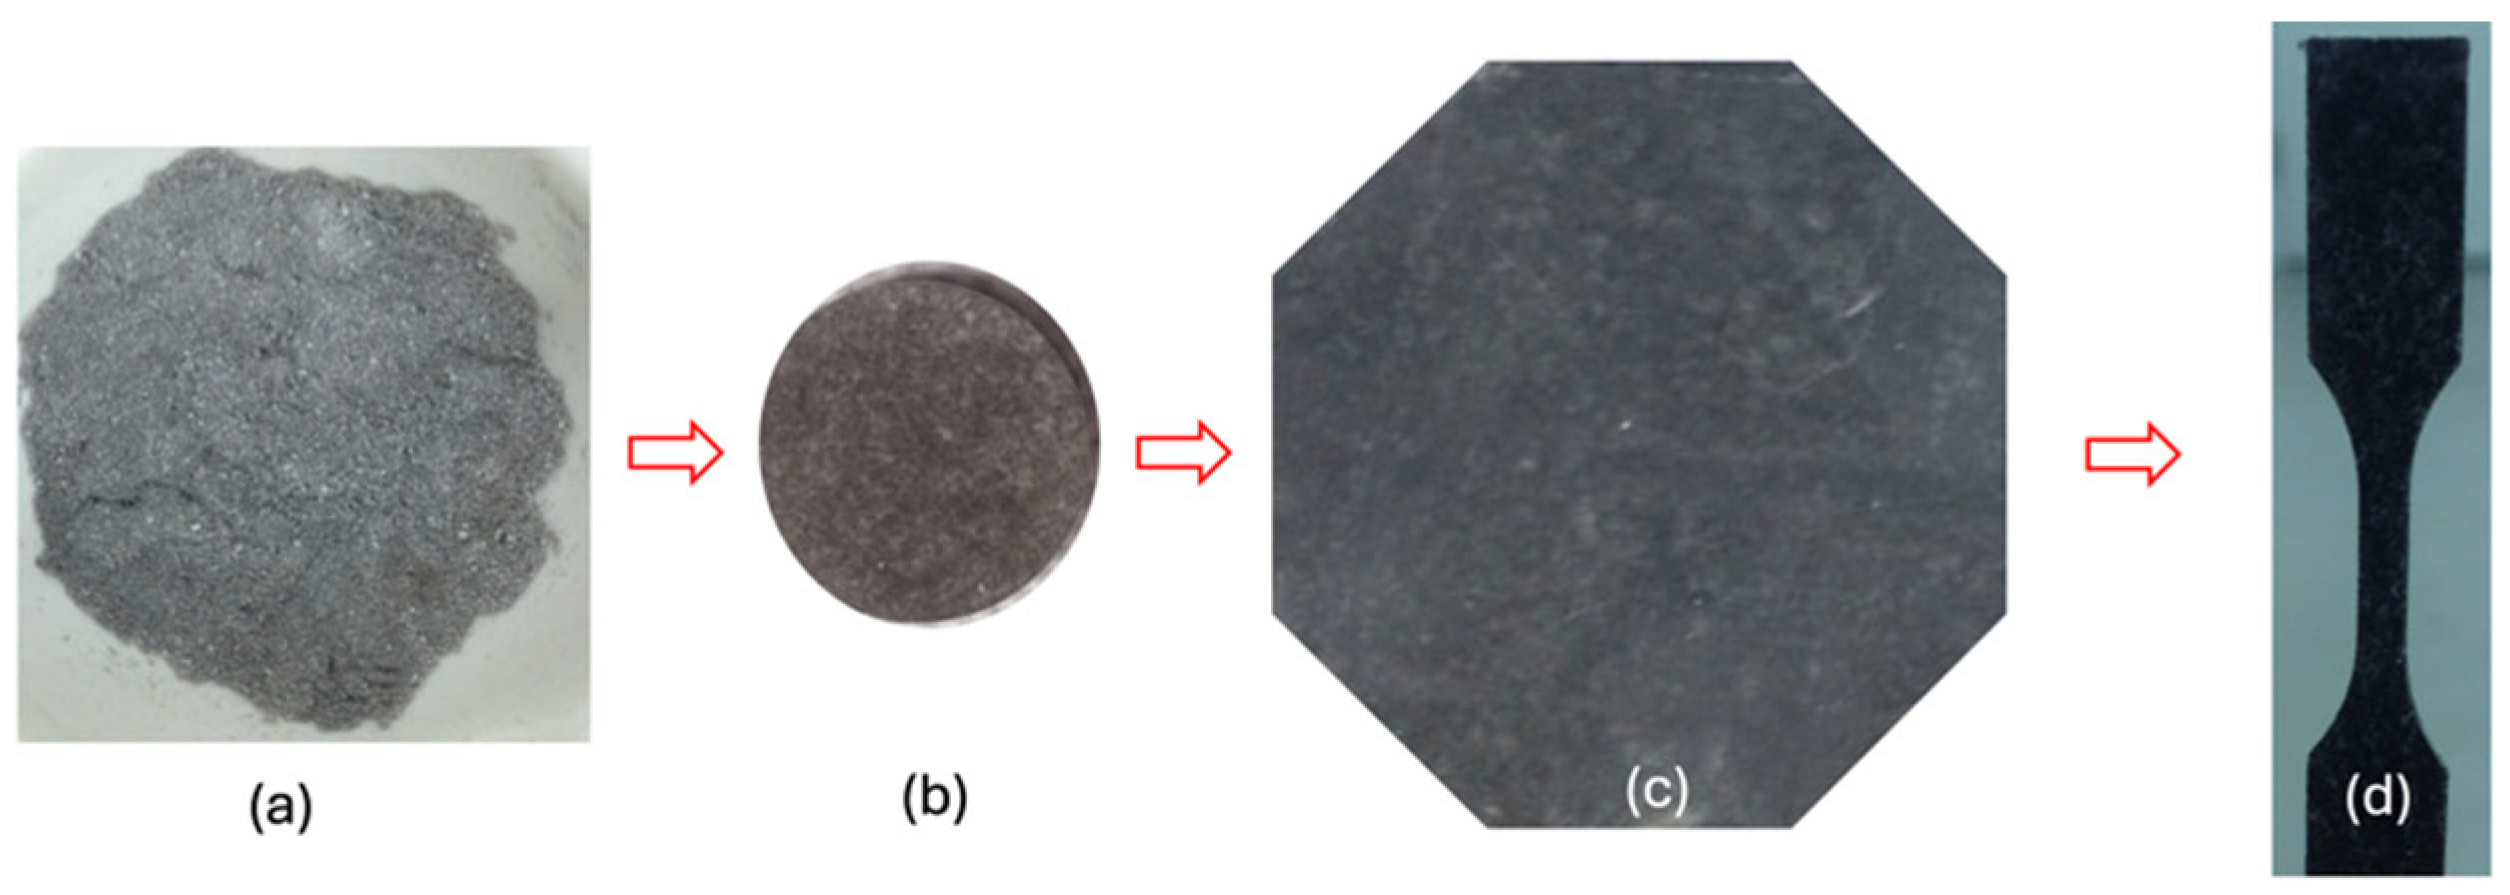
2.5. Incorporation of GF@C Filaments into ABS Matrix

Samples of GF@C strands (0.5 g) and ABS resin powder (1 g) with a mean particle size of about 48 microns were gently ground together in a mortar to maximize the surface contact between the fiber strands and the ABS powder. The blend was then transferred in a cylindrical vacuum-dry-pressing die set (d ≈ 3.2 cm), and the mold was placed in a manual hydraulic press (Caver model 12 ton, Carver Press, Lakewood, WA, USA). Pressure (~55 MPa) was applied onto the mold and held for 10 min to obtain a tablet about 1.2 mm thick.

2.6. Preparation of Composite Sheets for the Assessment of the GF@C Reinforced ABS Sheets

A composite sheet was fabricated by placing a tablet of GF@C material between two aluminum foil sheets (12 cm × 12 cm), which were positioned between the dual heating plates of a hot-press (Lab Tech LPS series, Lezo, Spain). Care was taken to ensure the tablet was centered and properly aligned to avoid uneven pressure distribution. Initially, low pressure was applied while heating to 160 °C. Upon reaching the target temperature, the pressure was gradually increased to 3.0 MPa and maintained for 10 min. After cooling to room temperature, the system was depressurized, and the resulting composite sheet was carefully removed from the aluminum foil assembly. The final sheet’s dimension was approximately 3.0 to 3.4 times larger than that of the original tablet. This compression temperature falls in the rubbery plateau between glass transition and melt formation slopes in the Young’s modulus-temperature curve for ABS thermoplastic. Operating in this range allows ABS to maintain a higher viscosity than its melt state, enabling it to move the GF filaments together at a low flow rate during the compression. It should be noted that this hot-pressing method does not achieve the same matrix–fiber compositing extent as extrusion molding. Nevertheless, all the composite sheets were produced under the identical hot-pressing condition, ensuring a consistent processing history for evaluating differences in reinforcing effects due to surface modifications of the fibers.

2.7. Instrumental Characterization of the Prepared GF@C-ABS Composite Sheets

2.7.1. Field-Emission Scanning Electron Microscopic and EDX Characterizations

For field-emission scanning electron microscopy (FESEM), a few milligrams of the sample were dry-dispersed and adhered to graphite tape on the sample holder. The sample was coated with a thin platinum layer via sputtering for 60 s before being transferred to the vacuum chamber of the FESEM system (JEOL JSM 6700F, Tokyo, Japan). Imaging was conducted at an accelerating voltage of 5 kV under varying magnifications. Simultaneously, an energy-dispersive X-ray (EDX) detector (built into the FESEM system) collected backscattered electrons to generate surface composition maps.
To determine the thickness of the carbon coating, approximately 0.5 g of GF@CLo strands was immersed in 2 to 3 mL of hydrofluoric acid (HF) in a plastic beaker, which was sealed and left in a fume hood for 48 h. The resulting black suspension was filtered, and the carbon residues were rinsed with DI water until the filtrate reached neutral pH. The collected carbon fragments were stored in a desiccator containing silica gel for subsequent microscopy analysis.

2.7.2. Raman Spectroscopic Characterization

For Raman spectroscopy, a silicon chip (5 mm × 5 mm) was used as a substrate to develop carbon films following the same protocol as described in Section 2.4. The coated chip was analyzed under a Raman microscope (Renishaw inVia, Gloucestershire, UK) using a 532 nm laser at 50 mW power for 10 s. Notably, GF@CLo-Cor(x%) strands were not used for Raman analysis due to the presence of interstitial gaps between strands. Since the carbon films on the silicon chip underwent identical thermal treatment, the Raman data accurately represent the carbon coatings on GF strands.

2.7.3. Thermogravimetric Analysis (TGA)

TGA was conducted to assess the thermal stability of the C-coatings on GFs (from Section 2.4) using a Q500 TGA unit (TA Instruments, New Castle, DE, USA). The temperature program consisted of a ramp from ambient to 300 °C at 20 °C/min, followed by a ramp to 900 °C at 10 °C/min under air flow (10 mL/min). To ensure consistent heat transfer process, each analysis used a sample amount in the range of 10 ± 0.5 mg.

2.7.4. Measurement of Dielectric Property of the GF@C Reinforced ABS Matrix

Dielectric properties of the composite sheets (from Section 2.6) were characterized using a dielectric spectrometer (DS6000, Lacerta Technology, Leicestershire, UK). A circular sample (~1 cm diameter) was cut, and its thickness was measured using a micro screw gauge. The sample was placed between parallel electrodes, and measurements were taken at a fixed frequency of 1 kHz over a temperature range of 25–130 °C. The applied voltage was adjusted based on sample thickness (1 V per 0.1 μm). The resulting temperature-dependent permittivity profile provided insight into the electrical conductivity imparted by the GF@C network within the ABS matrix.

2.7.5. Analysis of Mechanical Properties of the Composite Sheets

Mechanical properties of the GF@C-reinforced ABS sheets (from Section 2.6) were evaluated using a universal testing machine (Instron 5569, Norwood, MA, USA). Sheets were cut into standardized tensile specimens using an ASTM D638 [42] specimen cutter die, and their thickness was recorded using a digital gauge. Specimens were mounted in grips and tested at an extension rate of 0.5 mm/min. The resulting data included Young’s modulus, tensile strength, and strain at breakage. Each measurement used three samples to establish the precision degree.

2.7.6. Dynamic Mechanical Analysis (DMA)

When performing DMA, rectangular specimens (~2 cm × 0.5 cm) were cut and mounted on a DMA instrument (Q800 DMA system, Fort Wayne, IN, USA). The samples were clamped in a dual-cantilever configuration and subjected to a 10 mm amplitude strain. A temperature scan from 3 °C to 150 °C was applied at a rate of 5 °C/min under a constant frequency of 1 Hz.

3. Results and Discussion

3.1. Wrapping GF Strands with a Thin Carbon Sheath

This process comprises two key steps: formulation of the coating ink and, subsequently, a heat treatment course. While the latter, covering solvent vaporization, oil curing, and carbonization, was fixed in the present study, focus was placed on investigating leverage of the coating ink formation on the carbon-coating formed and therefore on the composite reinforcement. The ink was composed of a nonvolatile organic component, specifically lubricant oil, and a volatile solvent as a diluent. A uniform lubricant oil film wrapping individual GF strands was attained after the diluent was vaporized during the heat treatment course, as stated in Section 2.3. The lubricant consists of paraffins, naphthene, and aromatics (primarily C9 to C16 hydrocarbons); this composition is desired to serve as a precursor for the evolution of a thin carbon sheath because paraffin molecules undergo faster thermal cracking, producing free radical fragments that connect aromatic hydrocarbon species generated from the other two components, resulting in an even carbon coating.
The diluent affects the formation of a uniform lubricant oil film through its solvating power [43]. Different diluents bring about variation in the morphology of the resulting carbon coating layer (Figure 2), with t-butanol more effective than IPA, and then MEK in delivering a smooth carbon coating. The outcome originates from the uniformity of the lubricant oil layer deposited on GF strands due to the stronger solvating power of t-butanol, derived from its high London dispersion forces, i.e., hydrophobic affinity, and the steric occlusion, i.e., low density, as indicated by its greatest dispersion component (δD) of the Hansen solubility parameter [44] listed in Table 3. On the other hand, although the solubility parameter (δt) of the lubricant oils used in this study is unavailable, the general values fall in the range of 10–20 MPa1/2. These attributes match the hydrophobic nature of the lubricant oil, enabling uniform oil film formation. Consequently, the lubricant oil undergoes even pyrolysis, resulting in well-mixed hydrocarbon components that engage in combinatorial condensation reactions, forming highly mixed PAH species [45] and ultimately a continuous coke structure during carbonization. Inadequate solvation, as seen with MEK, leads to uneven oil distribution on GF, causing rough carbon coatings due to discrete condensation reactions.
Both t-butanol and IPA with stronger hydrogen bonding component (δH) would form an adsorbed solvent layer on the GF surface (Figure 2 inset), assisting in the wetting of the hydrophilic GF surface by hydrocarbon molecules. In an alternative approach, replacing the lubricant oil with PEG-600 (Figure 2c) resulted in a rough and porous carbon coating (sample GF@CPeg, Table 2). This morphology stems from free radical polymerization of vinyl species generated during PEG pyrolysis [46], followed by heterogeneous aromatization at various locations and extents. In principle, uniform and defect-free carbon coatings are preferred for emulating carbon fiber (CF) surfaces and ensuring consistent fiber–matrix interfaces. Nevertheless, one could argue that a porous carbon coating may enhance matrix–fiber bonding by providing a larger specific surface area and, consequently, a greater number of binding sites. This perspective warrants further investigation to establish a correlation between specific surface area and the mechanical properties of the composite.
Following the study of the coating ink formulation, the coating ink was optimized using lubricant oil dissolved in t-butanol. To validate carbon coating formation, the blank sample, GF@CLo (without PAH inclusion), was etched with HF to isolate the carbon shell, as detailed in Section 2.7.1. The SEM image reveals concave carbon shells of submicron thickness (Figure 3). Therefore, the following formula (Equation (1)) was developed to estimate the approximate carbon content (C%):
C % = A C ρ C A G F ρ G F + A C ρ C
where AC is the cross-sectional area of carbon layer, π d l + l 2 , and AGF is the cross-sectional area of the GF strand, π d 2 / 4 . The GF strand’s diameter and density are d = 12.4 μ m and ρ G F = 2.54 g / c m 3 , respectively, whereas the carbon coating’s thickness and density are l = 0.4   μ m (Figure 3b) and ρ C 1.56   g / c m 3 . Hence, C   % = 7.6 . Therefore, the carbon coating was estimated to be ~ 7.6 wt.% in GF@CLo, indicating that ~38% of the lubricant oil was converted into carbon shell through pyrolysis and carbonization in Ar. Additionally, it is rational that inclusion of Cor into the coating ink caused just slight variations in the carbon content, presumably within ~10 wt.%. In general, further increasing the thickness of the carbon coating layer is unnecessary, as only the outermost surface interacts with ABS chains, providing adhesion sites and influencing chain packing states. Moreover, a thicker coating can reduce adhesion to the glass fiber (GF) and make the layer more prone to cracking, which is an issue well documented in coating technology. It should also be noted that the current thickness (0.4 μm) may not represent the optimal value, and additional studies are required to determine the optimal thickness.
To improve interfacial adhesion sustained by intermolecular forces between fibers and matrix, PAHs were introduced as seeding agents to promote graphite crystallite formation [47]. Coronene (Cor) and pyrene (Pyr) were each added to t-BuOH-lubricant oil solutions (Section 2.3). Raman spectroscopy (Section 2.7.2) assessed their seeding effects, as shown in Figure 4. All carbon films exhibited characteristic D (~1345 cm−1) and G (~1593 cm−1) bands, corresponding to edge sp3 and in-plane sp2 carbons, respectively. The intensity ratio (ID/IG) and FWHM (full width at half maximum) of the G band reflect graphite crystallite size [48]. Smaller ID/IG and narrower FWHM suggest larger crystallites and narrower crystallite size distribution.
Optimal crystallite growth was observed at 5 wt.% Cor (Table 4). Higher Cor content (7 wt.%) led to excessive nucleation sites and smaller, more irregular crystallites. Accordingly, various surface morphologies were observed (Figure 5): GF@CLo-Cor(5%) has the smoothest coating, while 3% and 7% Cor samples show increasing roughness due to uneven crystallite distribution. Pyr, with lower molecular weight, leads to an even stronger seeding effect. At 3 wt.%, GF@CLo-Pyr(3%) presented a rougher surface than its Cor counterpart. At 5 wt.% of Pyr, excessive nucleation rendered the coating amorphous carbon skeletons, accompanying near disappearance of Raman bands (Figure 3).
Based on the surface morphology of the C-coated GF strands and the development of graphite crystallites during the carbonization treatment within the carbon coating, we further investigated the thermal degradation behaviors of two selected fiber samples, GF@CLo-Cor(5%) and GF@CLo, using thermogravimetric (TG) analysis in an air atmosphere (Figure 6). In this thermal scan, both samples remained stable up to approximately 450 °C. Degradation began near 500 °C in both cases. Although up to 900 °C the total mass-retention percentage dropped from 100% to approximately 97%, the primary degradation, marked by a noticeable mass-loss ramp, was observed between roughly 500 °C and 600 °C. Specifically, the GF@CLo sample began degrading at 495 °C and completed this phase at 596 °C, with a mass loss of 1.3%. In contrast, GF@CLo-Cor(5%) started degrading at approximately 513 °C and concluded at 607 °C, with a mass loss of 2.4%. Furthermore, a virtual linear response of mass retained (%) to the rise of temperature appeared after the mass-loss ramp, as labeled in each graph of Figure 6. Sample GF@CLo shows a stronger thermal degradation rate than GF@CLo-Cor(5%).
It is therefore postulated that the CLo-Cor(5%) coating, which contains a higher proportion of interfacial boundaries between amorphous regions and crystallites compared to the CLo coating, facilitates greater air access and thus promotes more carbon removal in the first degradation ramp, as described above. However, the highly dispersed graphite crystallite grains in the CLo-Cor(5%) coating may enhance the thermal stability of their surrounding amorphous regions [49], which explains the higher onset temperature of the mass-loss slope shown in Figure 6b. This structural influence also extends into the higher temperature range, as illustrated by the discernible thermal degradation slopes inserted in Figure 6. As previously noted, all the C-coated GF samples listed in Table 2 contain approximately 10 wt.% carbon. These two selected carbon coatings, which are representative, only lost less than 3% mass in this thermal scan, demonstrating sufficient resistance to strong oxidative environments.

3.2. Assessment of the GF@C-ABS Composites

To evaluate how the C-coated strands enhance the reinforcing effect in ABS matrix, composite samples were prepared using grinding, mixing, powder compaction, hot compression molding, and sampling, as illustrated in Figure 7. All specimens in this study contained the same fiber mass fraction (30%). ABS typically softens at around 105 °C and melts at approximately 190 °C. When the tablet (b) was subjected to hot compression between two plates at 3 MPa and 160 °C, the blend in a semi-molten state underwent extrusion along the radial direction. This movement promoted matrix compaction and interfacial contact between the fiber and ABS compared to what the tablet had produced.
Three reference composites, reinforced with GF, GF@CLo, and CF, respectively, within ABS matrix were first examined for their tensile strength and Young’s modulus (Figure 8). The average tensile strengths follow the order CF-ABS > GF@CLo-ABS > GF-ABS, confirming the beneficial role of the CLo coating. SEM images provide clear evidence supporting the trend in the last two, showing improved interfacial bonding between the fibers and ABS in GF@CLo-ABS compared to in GF-ABS. On the other hand, while CF-ABS presents a higher average tensile strength, its larger standard deviation suggests greater sensitivity to the anisotropic orientation of the C-fiber strands [50]. In contrast, GF@CLo-ABS displays a relatively smaller standard deviation, which can be attributed to the rougher surface of the CLo coating (see Figure 8 inset), making the resistance against plastic deformation is less dependent on fiber orientation.
On the contrary, GF@CLo-ABS reveals greater variability in the Young’s modulus measurement than CF-ABS. This is likely due to the random distribution of graphite crystallites with small sizes within the CLo coating, which affects the elastic behavior prior to plastic deformation. The molecular interactions between ABS chains and the dispersed graphite particles contribute to the stiffness of the composite. The randomness of the graphite nodes in size, crystallinity, and distribution reduces the measurement precision for samples of the same type. In contrast, CF lacks such randomly distributed graphite crystallites, resulting in more consistent elastic deformation behavior and a very small standard deviation in Young’s modulus. It can be inferred that compared to the carbon fiber surface, the carbon coating surface possesses the morphology effect in additional to the pure π-effect dominant in the former. It is important to note that these analysis results are specific to the sample preparation conditions detailed in Figure 7.
In addition to assessing the responses to tensile stress of the three composites, we examined their dynamic mechanical behaviors, as shown in Figure 9. It shows clearly that CF-ABS displays significantly greater storage modulus (E′) than both GF@CLo-ABS and CF-ABS, particularly below 100 °C. This is owing to the strong interactions between CF and ABS, forming a network capable of efficiently storing elastic energy, which is similar to the mechanism underlying Young’s modulus. GF@CLo-ABS also shows a slightly higher E′ profile than GF-ABS across the temperature range. Both GF@CLo-ABS and GF-ABS display a gentler decline in E′ with increasing temperature compared to CF-ABS. This phenomenon implies that the adhesion of ABS to CF is more susceptible to the rise in temperature. Interestingly, GF@CLo-ABS exhibits a shallow upward bump between approximately 90 and 115 °C, suggesting viscoelastic flow that slightly enhances fiber–matrix interactions within this temperature range.
The tan δ (= E″/E′) peaks for all three composites appear near 125 °C, which is higher than the glass transition temperature of ABS (Tg ≅ 100 to 105 °C), indicating associative interactions between the fibers and matrix (Figure 9b). The decrease in storage modulus (E″) signifies stress relaxation and viscous flow of ABS chains, which is obviously affected by bonding points on the fiber surface, resulting in conversion of mechanical energy into heat. This energy dissipation is believed to occur within an interfacial physically crosslinked network, as illustrated in the inset of Figure 9b. In this network, ABS chains adsorb onto fiber surfaces via molecular interactions (e.g., π-effects), promoting E′ beyond the chain–chain interactions present in the pristine ABS. Among the fibers, GF@CLo is likely to promote more intricate chain entanglements at the interfacial region because of its heterogeneous surface morphology, which encourages multi-adsorption states, as suggested by EDX carbon mapping (Figure 9c). Rationally, the resulting ABS adhesion layer consists of more twisted chains and segments, leading to greater chain conformational variability. This interpretation is supported by the rapid increase in its E″ component once the kinetically entrapped conformations are released, which starts at approximately 70 °C.
Furthermore, the intensity of tan δ curves below 70 °C follows the order CF-ABS > GF-ABS > GF@CLo-ABS, reflecting a decreasing dominance of the viscous component relative to the elastic component. This trend supports the notion of mounted entanglement extent in GF@CLo-ABS, which restricts polymer chain and segment mobility adjacent to the interface, resulting in the lowest extent of mechanical energy dissipation among the three samples. However, the three tan δ maxima at 125 °C reverses, with GF@CLo-ABS exhibiting the highest peak. This reversal is attributed to greater chain conformations entrapped in the low temperature range; it thus allows a higher degree of chain relaxation and viscous flow at 125 °C. Despite the subtle differences among the three tan δ profiles, the interfacial impact on polymer chain packing and therefore on E″ merits an insight.
On the basis of this analysis of the reference composites, the influence of Cor content in the coating ink on the mechanical properties of the composites GF@CLo-Cor(x%) was investigated. As shown in Figure 10a, the composites with x = 0, 3, and 7 exhibit comparable tensile strength values, all of which are lower than that of the composite with x = 5. This trend aligns with the distribution of graphite grains in the corresponding C-coatings, signifying an optimal balance between the crystallization extent of graphite grains and their size distribution at x = 5. Regarding Young’s modulus variation with Cor content, presented in Figure 10b, there is a rising trend from x = 0 to x = 5, followed by a decrease at x = 7. This behavior is plausible with the Raman data (ID/IG and G-band width) of x = 0 and 7, as both samples exhibit similar characteristics (Table 4).
Except for the tensile stress-strain analysis, DMA of these three composites further shows the influence of the graphite crystallites and morphology on the viscoelastic properties (Figure 11). The GF@CLo-Cor(5%)-ABS composite exhibits a significantly higher E′ profile than GF@CLo-ABS, which in turn outperforms the uncoated GF-ABS below 100 °C. This trend reflects different molecular interactions between the fiber and ABS chains, with the CLo-Cor(5%) coating being more effective than the CLo coating. This observation supports the conclusions drawn from Figure 10. Concerning the three tan δ profiles in the temperature range below 60 °C, the order is GF-ABS > GF@CLo-Cor(5%)-ABS > GF@CLo-ABS, although the discrepancies are small. GF@CLo-Cor(5%) appears to induce less extensive entanglement compared to GF@CLo, resulting better polymer segments and chain mobility [51]. This phenomenon can be attributed to compositionally and morphologically a more uniform GF@CLo-Cor(5%) fiber surface. In contrast, the pristine GF exerts minimal influence on chain packing state in the ABS bulk.
In addition, the critical fiber length lc for the enhancement of a polymer composite using short fibers is determined by the following equation [16], which incorporates the tensile strength of fiber (σf), the fiber diameter (df), and the fiber–matrix bond strength (τc). The
l c = σ f d f 2 τ c
The tensile strength (σf) of GF is ~200 MPa (Table 1), which should in principle remain unchanged after GF is coated with a carbon layer, and df is ~13 μm (Figure 3), while the bond strength τc depends on the fiber surface and the specific condition under which the composite is prepared. To evaluate the effect of a carbon coating on the critical fiber length, GF-ABS is used as the reference sample. The bond strength τc in a GF@CLo-Cor(x%)-ABS composite can be obtained by subtracting the average tensile strength of GF-ABS (3.9 MPa) from that of the GF@CLo-Cor(x%)-ABS, indicating the contribution of the carbon coating to the interfacial shear strength. The calculated lc values are 0.81 mm for GF@CLo and 0.41 mm for GF@CLo-Cor(5%). These positive values indicate a reduction in lc compared to that of GF-ABS. This suggests that applying a carbon coating to GF strands effectively reduces the critical fiber length due to the increase in interfacial shear strength τc. Furthermore, the Cor-doping within the carbon coating enhances the interfacial bond strength. Regarding the GF-ABS composite, the calculation of lc can use a calculated τc of 1.4 MPa, as proposed by a recent study on the properties of fiber-matrix adhesion [52]. Based on this value, the obtained lc is 0.93 mm, which is shorter than the average GF length used (3.6 mm, Section 2.1).
We then examined the response of the relative electric permittivity (dielectric constant, ε′) of the selected composites to increasing temperature under an electric field with a fixed frequency, as described in Section 2.7.4 (Figure 12). The reference composite, GF-ABS, exhibits a smooth ε′ profile that is slightly higher than that of pristine ABS. The ε′ of pristine ABS varies with temperature within a known range (Table 5). Similarly, the CF-ABS sheet displays a marginally higher ε′ profile than GF-ABS. This indicates that incorporating either GF or CF strands at a 30 wt.% loading does not significantly enhance the electric polarization of the composites compared to the polymer matrix. This observation suggests that the fiber–matrix interfaces in both composites have minimal influence on the packing of polymer chains, which remains similar to the pristine ABS. This is important because chain packing in amorphous polymers affects polarization, especially when polymer chains contain polar side chain groups. In addition to the temperature effect on ε′, the frequency dependence of ε′ in response of an applied electric field is well understood. As frequency increases, dipoles in organic functional groups gradually lack sufficient time to align with the electric field, preventing them from storing electric energy or achieving polarization. The frequency used in the present study (1 kHz) lies at the lower end of the commonly used frequency range, enabling us to better discern different ε′-T profiles of the samples.
Appealingly, the ε′ of the pristine ABS sheet begins to increase slightly around 85 °C. Although increasing temperature generally reduces electric polarization, this reverse trend is attributed to thermally driven polymer chain mobility, which in turn facilitates the alignment of permanent, induced, and instantaneous dipoles with the applied electric field [57]. The CF-ABS sheet displays a similar ε′-T trend, whereas the ε′ profile of the GF-ABS sheet remains relatively stable as temperature rises. According to their respective tan δ profiles (Figure 9b), both CF-ABS and GF-ABS exhibit steadily increasing values with temperature, indicating increased chain mobility, i.e., an enhanced viscous component, which promotes dipole switching. This switching results in ether alignment or cancelation of the dipoles. In CF-ABS, alignment appears to dominate during heating, whereas in GF-ABS, alignment and cancellation seem to counterbalance each other. It is plausible that interactions between GF and ABS create a more chaotic polymer chains arrangement near the interface than in the pristine ABS.
In contrast, the GF@CLo-ABS sheet exhibits a markedly different ε′ profile, characterized by both higher overall values and distinct peaks. It is well established that the dielectric constant and loss in FRP composites are influenced by various structural factors, including matrix composition, fiber type, content, sizes, distribution, and orientation, as well as interfacial characteristics. The interfacial effects seem to be decisive, because interfacial polarization is strongly affected by spatial transitions of composition from fiber to matrix, fiber micromorphology, and charge distribution over the contacts between fiber and polymer [58]. In this case, the dielectric behavior at the ABS-CLo interface is affected by the size and crystallinity of graphite crystallites within the CLo coating, which shape the composition and morphology of the interfacial layer, permitting spatially ready alignments of the various dipoles.
The heterogeneous microstructures of the coated surface create multiple adsorption states due to random anchoring of the ABS functional groups (–C≡N, –CH=CH–, and –Ph). The anchorage is realized via π–π interactions with graphene planes of graphite crystallites and dispersion forces with amorphous carbon skeleton, as illustrated in the inset of Figure 12. The varied adsorption states allow numerous pendant functional groups to readily polarize in response to the electric field. In contrast, the bulk ABS matrix contributes similarly to the dielectric constant across all composites. Compared to CF-ABS, the less heterogeneous surface of CF leads to more uniform and stronger polymer adsorption on CF, which hinders dipole switching and thus limits polarization enhancement.
The emergence of two ε′ peaks between 80 to 100 °C is likely due to instantaneous alignment of strong polar –C≡N dipoles of the adsorbed ABS chains under the applied electric field. This induction is dependent on chain softening near the glass transition temperature (Tg). The observed ε′ spikes appear to be stochastic in nature, resulting from the synergistic effects of dynamic changes in adsorption states and increased polymer chain and segment mobility. The former is linked to the crystalline heterogeneity and surface morphology of the carbon coating. At temperatures beyond the Tg region, ε′ decreases due to extensive dipole cancellation caused by excessive chain and segment motions.
Compared to GF@CLo-ABS, the GF@CLo-Cor(5%)-ABS composite shows an even higher and more fluctuating ε′ profile. The elevated and more variable ε′ values suggest greater diversity in the adsorption states of ABS functional groups on the Cor-doped carbon coating. Raman spectroscopy of this coating indicates increased graphite crystallinity, which introduces boundaries between crystallite grains and their amorphous adjacent regions. As aforementioned, the increase in diversity of the adsorption states favors the alignments of various dipoles. The enhancement is also driven by the synergistic but stochastic effects, such as the appearance of an ε′ plateau between approximately 95 and 115 °C. The significantly enhanced dielectric constants of GF@CLo-Cor(5%)-ABS relative to CF-ABS highlights its potential for applications in electromagnetic interference (EMI) shielding [59], which may be further optimized through continued material innovations.
Finally, we address the concern regarding the scalability of fabricating GF@CLo-Cor(x%). An approximate cost estimate for producing 1 kg of the C-coated GF is provided based on the processing steps outlined in Table 6 since it is considered as a laboratory-scale pilot test. Compared to pristine GF, which costs approximately 15 USD/kg, the final GF@CLo-Cor(5%) product is about six times more expensive. However, there is significant potential to reduce costs by optimizing the coating process, as discussed in Section 2. For example, the cost-intensive wet pretreatment step could be replaced with a dry process such as particle abrasion [60], and the carbon coating layer could be formed through soaking and filtration instead of solvent vaporization-driven precursor coating. Additionally, adjusting the chemical composition by including a trace amount of transition or rare earth metals to form a metal-doped carbon coating could substantially enhance the dielectric properties [61], thereby improving the overall cost–performance ratio. To minimize the disparity in mechanical reinforcement performance between CF and the C-coated GF, we propose using graphene nanoparticles instead of coronene as the dopant in the coating ink. This substitution offers advantages in both effectiveness and cost. Lastly, the entire preparation process, comprising soaking, filtration, drying, and furnace heat treatment, are inherently scalable.

4. Conclusions

This study presents a scalable technique for coating short E-glass fiber (GF) with a thin layer of coke to enhance the mechanical and electric properties of a polymer composite, using an acrylonitrile butadiene styrene (ABS) matrix as a case study. The reinforcing potential of the C-coated fibers is influenced by the graphite crystallite content and size distribution, as well as the surface morphology of the carbon coating. The main findings are summarized below:
  • The formation of a carbon coating on GF is governed by the preparation of the coating ink, which involves the selection of the solvent, the type of carbon precursor, and, critically, the molecular structure of the polyaromatic hydrocarbon (PAH) compound used as a graphitization seeding agent (dopant). These factors affect both the surface morphology and the distribution of graphite crystallites within the resulting carbon sheath.
  • A doping concentration of 5 wt.% coronene in the lubricant oil produces the most effective carbon coating, characterized by a larger graphite crystallite size and a higher abundance of crystallites. This is supported by Raman spectroscopy, specifically the ID/IG ratio and the width of the G peak.
  • Mechanical testing reveals that the carbon coating (CLo) on glass fiber improves the fiber–ABS interfacial resistance under tensile stress. Further enhancement is observed with coronene-doped carbon coating (CLo-Cor(5%)). However, when compared to carbon fiber (CF), both C-coated GF fibers (GF@CLo and GF@CLo-Cor(5%)) exhibit lower tensile strength (σ) and Young’s modulus (E), which is attributed to the dominant graphene structure of CF that strengthens interactions with ABS.
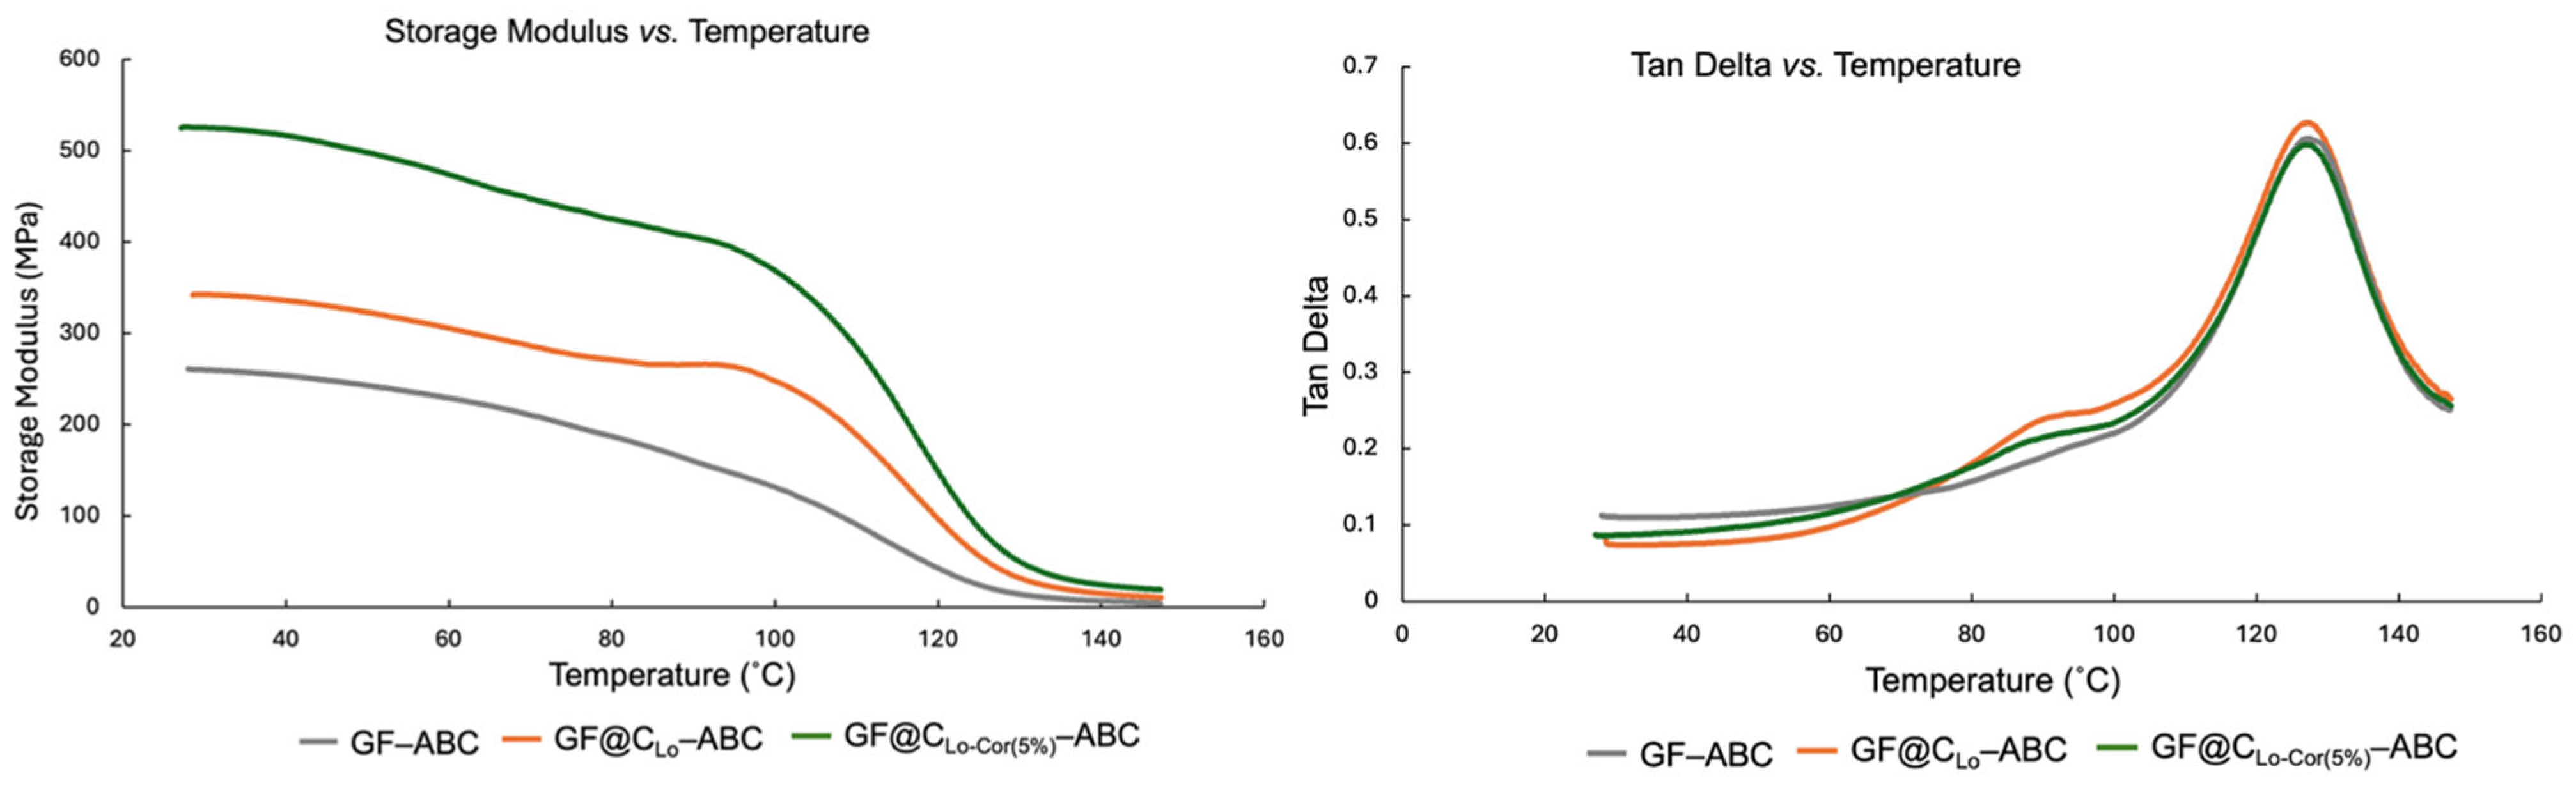
  • The storage moduli obtained from dynamic mechanical analysis (DMA) follow the same trend as the Young’s moduli of the composites. However, the loss modulus data indicate that the surface heterogeneity of the C-coated fibers leads to increased chain entanglement, which influences the viscous deformation behavior of the polymer matrix.
  • The carbon-coated fibers significantly enhance the dielectric constant of the composites compared to those reinforced with pristine GF or CF. This improvement is attributed to the varied adsorption states of ABS chains, primarily due to anchoring of the polar side-chain groups on the fiber surfaces.

Author Contributions

Conceptualization, L.H. and S.W.T.; methodology, S.W.T. and I.L.; validation, S.W.T., I.L. and L.H.; formal analysis, I.L. and S.W.T.; investigation, I.L. and S.W.T.; resources, S.W.T. and L.H.; data curation, I.L. and L.H.; writing—original draft preparation, I.L.; writing—review and editing, S.W.T.; visualization, L.H.; supervision, S.W.T. and L.H.; project administration, L.H.; funding acquisition, N/A. All authors have read and agreed to the published version of the manuscript.

Funding

This research received no external funding.

Data Availability Statement

This manuscript was drafted using the FYP report of the second author, which was not deposited in the e-library of NUS but kept by the corresponding author.

Acknowledgments

We acknowledge A-Star Institute of Materials Research and Engineering (IMRE) of Singapore for providing materials, laboratory, and equipment, and the Department of Chemical and Biomolecular Engineering at National University of Singapore (NUS) for creating this Final Year Project (FYP) of research to allow this laboratory-based research project to be completed during the period from August to December 2014.

Conflicts of Interest

The authors declare no conflicts of interest.

Abbreviations

The following abbreviations are used in this manuscript:
GFE-glass fiber
CFCarbon fiber
GF@CGlass fiber wrapped by a carbon coating
ABSAcrylonitrile butadiene styrene resin
LoLubricant oil
CorCoronene
PyrPyrene
IPAIso-propanol
MEKMethyl ethyl ketone
PEGPolyethylene glycol
GOGrapene oxide
CNTsCarbon nanotubes
FRPFiber-reinforced polymer
HTCHydrothermal carbonization
2D-MOFs2-Dimensional metal organic frameworks
PAHPolyaromatic hydrocarbons
TGAThermogravimetric analysis
DMADynamic mechanical analysis
E′Storage modulus
E″Loss modulus
EDXEnergy dispersive X-ray
FWHMFull width at half maximum
ε′Dielectric constant

References

  1. Mallick, P.K. Fiber-Reinforced Composites: Materials, Manufacturing, and Design, 3rd ed.; CRC Press: Boca Raton, FL, USA, 2007. [Google Scholar] [CrossRef]
  2. Saeedi, A.; Motavalli, M.; Shahverdi, M. Recent advancements in the applications of fiber-reinforced polymer structures in railway industry—A review. Polym Compos. 2024, 45, 77–97. [Google Scholar] [CrossRef]
  3. Charterer 6. “Innovating Clean Energy Technology in Advanced Manufacturing” in Quadrennial Technology Review. 2015. Available online: https://www.energy.gov/quadrennial-technology-review-2015 (accessed on 1 September 2015).
  4. Gao, H.; Sun, Y.; Jian, J.; Dong, Y.; Liu, H. Study on mechanical properties and application in communication pole line engineering of glass fiber reinforced polyurethane composites (GFRP). CSCM 2023, 18, e01942. [Google Scholar] [CrossRef]
  5. Abbood, I.S.; Odaa, S.A.; Hasan, K.F.; Jasim, M.A. Properties evaluation of fiber reinforced polymers and their constituent materials used in structures—A review. Mater. Today Proc. 2021, 43, 1003–1008. [Google Scholar] [CrossRef]
  6. Das, S.; Yokozeki, T. A brief review of modified conductive carbon/glass fibre reinforced composites for structural applications: Lightning strike protection, electromagnetic shielding, and strain sensing. JCOMC 2021, 5, 100162. [Google Scholar] [CrossRef]
  7. Zaman, A.; Gutub, S.A.; Wafa, M.A. A review on FRP composites applications and durability concerns in the construction sector. J. Reinf. Plast. Compos. 2013, 32, 1966–1988. [Google Scholar] [CrossRef]
  8. Hui, C.-Y.; Liu, Z.; Phoenix, S.L.; King, D.R.; Cui, W.; Huang, Y.; Gong, J.P. Mechanical behavior of unidirectional fiber reinforced soft composites. Extreme Mech. Lett. 2020, 35, 100642. [Google Scholar] [CrossRef]
  9. Wang, Y.; Wang, Z.; Zhu, L. A Short Review of Recent Progress in Improving the Fracture Toughness of FRP Composites Using Short Fibers. Sustainability 2022, 14, 6215. [Google Scholar] [CrossRef]
  10. Yang, B.J.; Ha, S.K.; Pyo, S.H.; Lee, H.K. Mechanical characteristics and strengthening effectiveness of random-chopped FRP composites containing air voids. Compos. B Eng. 2014, 62, 159–166. [Google Scholar] [CrossRef]
  11. Pheysey, J.; Cola, F.D.; Martinez-Hergueta, F. Short fibre/unidirectional hybrid thermoplastic composites: Experimental characterization and digital analysis. Compos. A Appl. Sci. Manuf. 2024, 181, 108121. [Google Scholar] [CrossRef]
  12. Fu, S.-Y.; Lauke, B.; Mäder, E.; Yue, C.-Y.; Hu, X. Tensile properties of short-glass-fiber- and short-carbon-fiber-reinforced polypropylene composites. Compos. Part A-Appl. Sci. Manu. 2000, 31, 1117–1125. [Google Scholar] [CrossRef]
  13. Hmeidat, N.S.; Elkins, D.S.; Peter, H.R.; Kumar, V.; Compton, B.G. Processing and mechanical characterization of short carbon fiber-reinforced epoxy composites for material extrusion additive manufacturing. Compos. B. Eng. 2021, 223, 109122. [Google Scholar] [CrossRef]
  14. Ogura, S. Research on strength prediction technology for fiber-reinforced plastic injection-molded products. KYB Technol. Rev. 2023, 67, 20–26. [Google Scholar]
  15. Rajabi, M.; Ali, A.; McConnell, M.; Cabral, J. Keratinous materials: Structures and functions in biomedical applications. Mater. Sci. Eng. C 2020, 110, 110612. [Google Scholar] [CrossRef] [PubMed]
  16. Callister, W.D., Jr.; Rethwisch, D.G. Materials Science and Engineering: An Introduction, 10th ed.; Wiley: Hoboken, NJ, USA, 2018; Chapter 16; ISBN 9781119405436. [Google Scholar]
  17. Waghmare, S.; Shelare, S.; Aglawe, K.; Khope, P. A mini review on fibre reinforced polymer composites. Mater. Today Proc. 2022, 54, 682–689. [Google Scholar] [CrossRef]
  18. Zhang, W.-B.; Yu, X.; Wang, C.-L.; Sun, H.-J.; Hsieh, I.-F.; Li, Y.; Dong, X.-H.; Yue, K.; Horn, R.V.; Cheng, S.Z.D. Molecular nanoparticles are unique elements for macromolecular science: From “nanoatoms” to giant molecules. Macromolecules 2014, 47, 1221–1239. [Google Scholar] [CrossRef]
  19. Fu, S.-Y.; Lauke, B. Effects of fiber length and fiber orientation distributions on the tensile strength of short-fiber-reinforced polymers. Compos. Sci. Technol. 1996, 56, 1179–1190. [Google Scholar] [CrossRef]
  20. Edwards, K.L. An overview of the technology of fibre-reinforced plastics for design purposes. Mater. Des. 1998, 19, 1–10. [Google Scholar] [CrossRef]
  21. Bernasconi, A.; Cosmi, F. Analysis of the dependence of the tensile behavior of a short fiber reinforced polyamide upon fiber volume fraction, length and orientation. Pro. Eng. 2011, 10, 2129–2134. [Google Scholar] [CrossRef]
  22. Zhang, R.; Shi, Z. Bi-interfacial debonding of coated fiber reinforced composites under fatigue load. Int. J. Fatigue 2008, 30, 1074–1079. [Google Scholar] [CrossRef]
  23. Vaidya, R.U.; Fernando, J.; Chawla, K.K.; Ferber, M.K. Effect of fiber coating on the mechanical properties of a Nextel-480-fiber-reinforced glass matrix composite. Mater. Sci. Eng. A 1992, 150, 2. [Google Scholar] [CrossRef]
  24. Anagnostopoulos, G.; Parthenios, J.; Galiotis, C. Thermal stress development in fibrous composites. Mater. Lett. 2008, 62, 341–345. [Google Scholar] [CrossRef]
  25. Chen, Y.; Prasad, V.; Yasar, M.; Murphy, N.; Ivankovic, A. Enhancing interfacial performance and fracture toughness of carbon fibre reinforced thermoplastic composites. Compos. Part A Appl. Sci. Manuf. 2024, 187, 108434. [Google Scholar] [CrossRef]
  26. Fu, S.Y.; Lauke, B.; Mäder, E.; Yue, C.-Y.; Hu, X.; Mai, Y.-W. Hybrid effects on tensile properties of hybrid short-glass-fiber-and short-carbon-fiber-reinforced polypropylene composites. J. Mater. Sci. 2001, 36, 1243–1251. [Google Scholar] [CrossRef]
  27. Ravichandran, B.; Balasubramanian, M. Joining methods for fiber reinforced polymer (FRP) composites—A critical review. Compos. A Appl. Sci. 2024, 186, 108394. [Google Scholar] [CrossRef]
  28. Ishtiaq, S.; Saleem, M.Q.; Naveed, R.; Harris, M.; Khan, S.A. Glass–Carbon–Kevlar fiber reinforced hybrid polymer composite (HPC): Part (A) mechanical and thermal characterization for high GSM laminates. JCOMC 2024, 14, 100468. [Google Scholar] [CrossRef]
  29. Yu, Y.; Yu, L.; Wang, C.; Cui, Z. Effect of polyurethane treatment on the interfacial and mechanical properties of basalt fiber-reinforced polymer composite. Fibers Polym. 2024, 25, 607–617. [Google Scholar] [CrossRef]
  30. De, B.; Bera, M.; Bhattacharjee, D.; Ray, B.C.; Mukherjee, S. A comprehensive review on fiber-reinforced polymer composites: Raw materials to applications, recycling, and waste management. Prog. Mater. Sci. 2024, 146, 101326. [Google Scholar] [CrossRef]
  31. Ari, A.; Bayram, A.; Karahan, M.; Karag, S. Comparison of the mechanical properties of chopped glass, carbon, and aramid fiber reinforced polypropylene. Polym. Polym Compos. 2022, 30, 1–13. [Google Scholar] [CrossRef]
  32. Morampudi, P.; Namala, K.K.; Gajjela, Y.K.; Barath, M.; Prudhvi, G. Review on glass fiber reinforced polymer composites. Mater Today Proc. 2021, 43, 314–319. [Google Scholar] [CrossRef]
  33. Chen, X.; Hui, Y.; Zhang, J.; Wang, Y.; Zhang, J.; Wang, X.; Cheng, S.; Wen, K.; Li, Z.; Yi, C.; et al. Single multifunctional MXene-coated glass fiber for interfacial strengthening, damage self-monitoring, and self-recovery in fiber-reinforced composites. Compos. B Eng. 2023, 259, 110713. [Google Scholar] [CrossRef]
  34. Chen, J.; Zhao, D.; Jin, X.; Wang, C.; Wang, D.; Ge, H. Modifying glass fibers with graphene oxide: Towards high-performance polymer composites. Compos. Sci. Technol. 2014, 97, 41–45. [Google Scholar] [CrossRef]
  35. Shang, Y.; Shi, B.; Doshi, S.M.; Chu, T.; Qiu, G.; Du, A.; Zhao, Y.; Xu, F.; Thostenson, E.T.; Fu, K.K. Rapid nanowelding of carbon coatings onto glass fibers by electrothermal shock. ACS Appl. Mater. Interfaces 2020, 12, 37722–37731. [Google Scholar] [CrossRef] [PubMed]
  36. Liu, Z.; Zhang, L.; Yu, E.; Ying, Z.; Zhang, Y.; Liu, X.; Eli, W. Modification of glass fiber surface and glass fiber reinforced polymer composites challenges and opportunities: From organic chemistry perspective. Curr. Org. Chem. 2015, 19, 991–1010. [Google Scholar] [CrossRef]
  37. Wu, Y.; Song, Y.; Wu, D.; Mao, X.; Yang, X.; Jiang, S.; Zhang, C.; Guo, R. Recent progress in modifications, properties, and practical applications of glass fiber. Molecules 2023, 28, 2466. [Google Scholar] [CrossRef]
  38. Naguib, H.M. Evaluation of filler activation for sustainable FRP composite by studying properties, mechanism, and stability. Sci. Rep. 2024, 14, 18256. [Google Scholar] [CrossRef]
  39. Gan, Y.X.; Yusuf, M.; Ibrahim, H. Hydrothermal carbonization coating on recycled quartz glass fiber. Mater. Lett. 2025, 382, 137877. [Google Scholar] [CrossRef]
  40. Abejon, R.; Garea, A.; Irabien, A. Ultrapurification of hydrogen peroxide solution from ionic metals impurities to semiconductor grade by reverse osmosis. Sep. Purif. Technol. 2010, 76, 44–51. [Google Scholar] [CrossRef]
  41. Jang, H.K.; Chung, Y.D.; Whangbo, S.W.; Lyo, I.W.; Whang, C.N.; Lee, S.J.; Lee, S. Effects of chemical etching with hydrochloric acid on a glass surface. J. Vac. Sci. Technol. A 2000, 18, 2563–2567. [Google Scholar] [CrossRef]
  42. ASTM D638-22; Standard Test Method for Tensile Properties of Plastics. ASTM: West Conshohocken, PA, USA, 2022; Volume 08.01: Plastics. [CrossRef]
  43. Bajdik, J.; Regdon, G.; Marek, T.; Erős, I.; Süvegh, K.; Pintye-Hódi, K. The effect of the solvent on the film-forming parameters of hydroxypropyl-cellulose. Int. J. Pharm. 2005, 301, 192–198. [Google Scholar] [CrossRef]
  44. Lara, J.; Zimmermann, F.; Drolet, D.; Hansen, C.M.; Chollot, A.; Monta, N. The use of the Hansen solubility parameters in the selection of protective polymeric materials resistant to chemicals. Int. J. Curr. Res. 2017, 9, 47860–47867. [Google Scholar]
  45. Mishra, A.; Siddiqi, H.; Kumari, U.; Behera, I.D.; Mukherjee, S.; Meikap, B.C. Pyrolysis of waste lubricating oil/waste motor oil to generate high-grade fuel oil: A comprehensive review. Renew Sustain. Energy Rev. 2021, 150, 111446. [Google Scholar] [CrossRef]
  46. Voorhees, K.J.; Baugh, S.F.; Stevenson, D.N. An investigation of the thermal degradation of poly(ethylene glycol). J. Anal. Appl. Pyrol. 1994, 30, 47–57. [Google Scholar] [CrossRef]
  47. Uematsu, H.; Yoshida, K.; Yamaguchi, A.; Fukushima, A.; Sugihara, S.; Yamane, M.; Ozaki, Y.; Tanoue, S. Enhancement of interfacial shear strength due to cooperative π-π interaction between polyphenylene sulfide and carbon fiber and molecular orientation of polyphenylene sulfide via the π-π interaction. Compos. Part A Appl. Sci. Manuf. 2023, 165, 107355. [Google Scholar] [CrossRef]
  48. Schwan, J.; Ulrich, S.; Batori, V.; Ehrhardt, H.; Siva, S.R.P. Raman spectroscopy on amorphous carbon films. J. Appl. Phys. 1996, 80, 440–447. [Google Scholar] [CrossRef]
  49. Yang, F.; Hu, G.; He, H.; Yi, M.; Ge, Y.; Ran, L.; Peng, K. Effect of amorphous carbon on the tensile behavior of polyacrylonitrile (PAN)-based carbon fibers. J. Mater. Sci. 2019, 54, 8800–8813. [Google Scholar] [CrossRef]
  50. Mortazavian, S.; Fatemi, A. Effects of fiber orientation and anisotropy on tensile strength and elastic modulus of short fiber reinforced polymer composites. Compos. B Eng. 2015, 72, 116–129. [Google Scholar] [CrossRef]
  51. Ornaghi, H.L.; Almeida, J.H.S.; Monticeli, F.M.; Neves, R.M. Stress relaxation, creep, and recovery of carbon fiber non-crimp fabric composites. JCOMC 2020, 3, 100051. [Google Scholar] [CrossRef]
  52. Tótch, C.; Lukács, N.L.; Kovács, N.K. The role of the fiber–matrix interface in the tensile properties of short fiber–reinforced 3D-printed polylactic acid composites. Polym. Compos. 2024, 45, 13589–13602. [Google Scholar] [CrossRef]
  53. Chao, H.-W.; Hsu, H.-C.; Chen, Y.-R.; Chang, T.-H. Characterizing the dielectric properties of carbon fiber at different processing stages. Sci. Rep. 2021, 11, 17475. [Google Scholar] [CrossRef]
  54. Naka, J.; Yamamoto, S.; Komori, K.; Yamakawa, S.; Kokubo, T. Development of glass fiber with high dielectric constant. J. Non-Cryst. Solids. 1994, 177, 420–426. [Google Scholar] [CrossRef]
  55. Kuzmanić, I.; Vujović, I.; Petković, M.; Šoda, J. Influence of 3D printing properties on relative dielectric constant in PLA and ABS materials. Prog. Addit. Manuf. 2023, 8, 703–710. [Google Scholar] [CrossRef] [PubMed]
  56. Wang, H.; Du, Z.; Cheng, Z.; Cao, Z.; Ye, Y.; Wang, Z.; Wei, J.; Wei, S.; Meng, X.; Song, L.; et al. Ultralow-dielectric-constant atomic layers of amorphous carbon nitride topologically derived from mxene. Adv. Mater. 2023, 35, e2301399. [Google Scholar] [CrossRef] [PubMed]
  57. Mekha, K.B.; Yusof, N.A.T.; Sudhakar, K.; Zainol, N.; Hasan, N.; Karim, M.S.A. Development of sustainable polymer-based dielectric composites from agricultural waste: A review. Heliyon 2024, 10, e39118. [Google Scholar] [CrossRef]
  58. Quader, R.; Narayanan, L.K.; Caldona, E.B. Dielectric characterization of fiber- and nanofiller-reinforced polymeric materials. J. Appl. Polym. Sci. 2024, 141, e55362. [Google Scholar] [CrossRef]
  59. Shakir, M.F.; Khan, A.N.; Khan, R.; Javed, S.; Tariq, A.; Azeem, M.; Riaz, A.; Shafqat, A.; Cheema, H.M.; Akram, M.A.; et al. EMI shielding properties of polymer blends with inclusion of graphene nano platelets. Results Phys. 2019, 14, 102365. [Google Scholar] [CrossRef]
  60. Maroulakos, G.; Wanserski, M.W.; Wanserski, M.M.; Schuler, E.J.; Egan, C.P.; Thompson, G.A. Effect of airborne-particle abrasion on 3-dimensional surface roughness and characteristic failure load of fiber-reinforced posts. J. Prosthet. Dent. 2019, 121, 461–469. [Google Scholar] [CrossRef]
  61. Vovchenko, L.L.; Matzui, L.Y.; Yakovenko, O.S.; Lozitsky, O.V.; Len, T.A.; Oliynyk, V.V.; Galaburda, M.V.; Borovoy, M.O.; Syvolozhskyi, O.A. Electrical and shielding properties of epoxy composites with Ni–C and Co–C core-shell nanoparticles. Phys. E Low Dimens. Syst. Nanostruct. 2022, 144, 115463. [Google Scholar] [CrossRef]
Figure 1. Photo image of chopped strands of GF as received (left) and the microscopic image of the treated GF strands and the diameter of a filament (right).
Jcs 09 00348 g001
Figure 2. Microscopic images showing the C-coated GF strands prepared from the three coating inks formulated by using three diluents: (a) t-butanol, (b) 2-propanol, and (c) methyl ethyl ketone (MEK). Inset: ROH represents t-Butanol or isopropanol molecules forming a solvent-adsorption layer on the GF strand. Image (d) is the carbon coating derived from the coating ink made of PEG-600 and t-butanol.
Jcs 09 00348 g002
Figure 3. (a) FE-SEM image of the carbon coating obtained from etching out the GF core of GF@CLo, and (b) the cross-sectional view of a GF@CLo strand including a glass core and a perimetric carbon layer with a thickness of l.
Jcs 09 00348 g003
Figure 4. Raman spectra of the carbon samples obtained from the carbon coating developed on a silicon chip to facilitate the analysis (Section 2.7.2).
Jcs 09 00348 g004
Figure 5. FESEM images of the C-coated GF strands: (a) GF@CLo, (b) GF@CLo-Cor(3%), (c) GF@CLo-Cor(5%), (d) GF@CLo-Cor(7%), and (e) GF@CLo-Pyr(5%). Inset: the molecular structures of the two PAH compounds used to induce seeding effect.
Jcs 09 00348 g005
Figure 6. TGA profiles of the two selected C-coated fiber samples, (a) GF@CLo and (b) GF@CLo-Cor(5%), are shown. The onset and offset temperatures of the primary mass-loss ramps are labeled, and the mean thermal degradation slope in the subsequent temperature range (~600 to 900 °C) is labeled for each TGA profile.
Jcs 09 00348 g006
Figure 7. The four steps to prepare the GF@CLo-Cor(x%)-ABS composite sheets for mechanical property evaluation: (a) ground mixture of GF@CLo-Cor(x%) and ABS powder; (b) tablet obtained from powder compaction of the ground mixture; (c) sheet obtained from hot compressing the tablet; (d) cut-out sample from the hot-pressed sheet.
Jcs 09 00348 g007
Figure 8. Comparison of the tensile strengths and Young’s moduli of the three reference composites. The two microscopic images exhibit the interface between fiber and matrix in the composites underneath, respectively. The amplified SEM image exhibits a granular structure existing in the CLo coating.
Jcs 09 00348 g008
Figure 9. The DMA of the three illustrative fiber-ABS composites: (a) temperature-dependent storage modulus profiles; (b) temperature-dependent tan δ profiles; (c) EDX mapping of carbon (shown by a spread of bright blue dots, and the arrow shows a spot of the dots) on a GF@CLo strand exposed at the fractured surface of a sample.
Jcs 09 00348 g009
Figure 10. The impact of the Cor content (x %) of the coating ink on the mechanical properties of the resulting GF@CLo-Cor(x%)-ABS composites: (a) tensile strength and (b) elastic modulus.
Jcs 09 00348 g010
Figure 11. The DMA diagrams reflect the influences of the carbon coating and its structure on the temperature-dependent mechanical properties: (left) the storage modulus profiles; (right) the tan δ profiles.
Jcs 09 00348 g011
Figure 12. Variation in the relative permittivity readings from various ABS-composite sheets containing different kinds of fiber strands, including GF, CF, GF@CLo and GF@CLo-Cor(5%), with temperature, in which the pristine ABS sheet was tested for comparison purpose. The inset illustrates π-interactions of the functional groups of ABS with the graphite crystallites on the C-coating surface, which is illustrated by grey color.
Jcs 09 00348 g012
Table 1. Material information for the three basic substances used in this study.
Main components of Alfa E-Glass Fiber (wt%)SiO2 52.0–55.0; CaO 21.2–22.2; Al2O4 14.0–15.0; B2O3 7.8–8.2
Density (g/cm3)2.55–2.60
Tensile strength (MPa)1950–2050
Young’s modulus (GPa)72–85
Approximate composition of Alfa ABS resin (wt%)Butadiene 5–30; Styrene 40–60; Acrylonitrile 15–35
Density (g/cm3)/Melt and glass transition temperature (°C) 1.01–1.07/
Tm: 190–240; Tg: 88–128
Tensile strength (MPa)27.6–55.2
Young’s modulus (GPa)1.1–2.9
Typical composition of aviation lubricant *Main components: C5–C10 Fatty acid esters; Poly(1-olefins); Mineral oil mixtures consisting of paraffinic, naphthenic, and aromatic hydrocarbons C ≥ 15. Additives: Phosphates (RxO)3P=O as anti-wear and dispersion agent; Phenol derivatives as oxidation inhibitor; Polyisobutylene as viscosity improver; Alkyl naphthalenes as pour-point depressant; Zinc dialkyl dithiophosphate as anti-fouling and anti-corrosion compound.
Solubility parameter: 15–20 MPa
* This row describes the essential components of aviation lubricant oil for the proprietary Mobil Jet Oil II.
Table 2. The names and the specifications of the C-coated GF strands.
SampleCoating InkHeat Treatment
LiquidPAH (wt.% of Lo)Vaporization and Curing/Carbonization
GF@CLo a.Lubricant oil (Lo)-260 °C/800 °C
GF@CLo-Cor(x%)Lubricant oilCoronene (Cor, x = 3, 5, and 7)As above
GF@CLo-Pyr(x%)Lubricant oilPyrene (Pyr, x = 3 and 5)As above
GF@CPeg PEG-600-As above
a This sample has three forms prepared using three diluents: t-butanol, 2-propanol, and MEK. The other samples in the first column were prepared using only t-butanol as diluent.
Table 3. The solubility parameters (δ) of the three diluents used, respectively, to dissolve the lubricant oil.
SolventDensity (g/cm3) at 20 °C δt—Solubility Parameter (MPa1/2) *
δDδPδH
t-Butanol0.77521.9
18.15.810.9
2-Propanol0.78623.5
15.86.216.4
Methyl Ethyl ketone0.80518.6
15.59.05.1
* δt is the total solubility parameter.
Table 4. Raman D-band to G-band intensity ratios of the pure carbon coating.
Carbon CoatingID/IGFWHM of G-Band (cm−1)
CLo0.93125
CLo-Cor(3%)0.9198
CLo-Cor(5%)0.8480
CLo-Cor(7%)0.97107
CLo-Pyr(3%)0.79148
Table 5. Dielectric constant values of the elemental components constituting the composites.
Pure Materialsε′Reference
CF2.82~6.5, could also be much larger [53]
E-GF6.5 to 6.8[54]
ABS plastic2.0 to 3.5[55]
Amorphous C2.2[56]
Table 6. Cost estimation for fabricating the short glass fiber with a doped carbon sheath, illustrating the feasibility of the proposed laboratory-scale pilot preparation.
Processing Step/SubstanceApprox. Cost (USD) *Notes
Pretreatment/E-GF~45 Including GF (1 kg), H2O2 (30%, Tech. grade 1.0 L), and HCl (37%, ACS grade, 1.0 L)
Coating-ink formulation~12Including t-Butanol (Tech. grade 10 L), Lubricant (0.25 L), and Coronene (Tech. grade 12.5 g)
Generation of C-coating and the above steps ~15Electricity consumption ~100 KWH
Miscellaneous ~10Filtration paper and DI water
Outcome ~82Approx. per 1 kg C-coated GF
* These cost estimates are from websites of various suppliers.
Disclaimer/Publisher’s Note: The statements, opinions and data contained in all publications are solely those of the individual author(s) and contributor(s) and not of MDPI and/or the editor(s). MDPI and/or the editor(s) disclaim responsibility for any injury to people or property resulting from any ideas, methods, instructions or products referred to in the content.

