1. Introduction
Electromagnetic interference (EMI) has become a serious problem due to the rapid development and use of electronics, telecommunications equipment, and computers. It can disrupt the normal operation of sensitive circuits or even lead to their complete failure. Therefore, there is a growing need to develop effective shielding mechanisms to protect devices from the harmful effects of electromagnetic (EM) noise.
Composite polymer materials reinforced with carbon nanotubes (CNTs) have attracted particular interest in this area compared to metals, due to their low weight, corrosion resistance, and advantages related to their formability. In the past, high CNT loading was used to achieve high EMI shielding effectiveness. However, previous reports have shown that effective reinforcement with CNTs can only be achieved at low loading levels (<1%), as at higher concentrations their reinforcing effect begins to decrease significantly due to issues such as dispersion, alignment, and interfacial interaction with the polymer matrix. Another method to achieve high EMI shielding effectiveness is to produce samples with an increased thickness, even with a low reinforcement content, but this is practically unfeasible in commercial applications.
Singh et al. [
1], observing that the use of CNTs alone as a reinforcing agent often failed to significantly enhance the mechanical properties of composites, adopted a different approach. They impregnated an epoxy matrix with a preform composed of strongly grafted multi-walled carbon nanotubes (MWCNTs) onto carbon fibers (CFs). The incorporation of MWCNTs into the carbon fibers resulted in a significant improvement in the electromagnetic interference (EMI) shielding effectiveness, from 29.4 dB for the CF/epoxy composite to 51.1 dB for a multiscale CF-MWCNT/epoxy composite with a thickness of 2 mm.
Yim Yoon-Ji et al. [
2] investigated the effects of incorporating 2 to 13 phr of MWCNTs into samples of biodegradable epoxy composite materials reinforced with nanotubes, focusing on the EMI shielding effectiveness (EMI-SE) and mechanical properties (fracture strength). The experimental results indicated that the electrical conductivity and EMI-SE of the MWCNT/biodegradable epoxy composites improved with an increasing MWCNT content due to the formation of enhanced electrical networks. The EMI-SE of the composite with 13 phr reinforcement and a thickness of 2 mm was found to be approximately 16 dB at a frequency of 1.4 GHz, similar to that of the composite with 8 phr, indicating that a further increase in the MWCNT concentration was not necessary.
The EMI shielding performance was studied by Huang et al. [
3] for epoxy resin composite materials with single-walled carbon nanotube (SWCNT) inclusions. These materials were found to exhibit excellent EMI shielding effectiveness (EMI-SE) in a frequency range from 10 MHz to 1.5 GHz. At these frequencies, the EMI-SE for a composite with 15 wt% SWCNTs was measured at 49 dB at 10 MHz and 15–20 dB in the range of 500 MHz to 1.5 GHz. A correlation between the EMI-SE and DC conductivity was also established, with reflection identified as the dominant shielding mechanism. However, for 2 mm thick samples with the same 15 wt% SWCNT concentration in the X-band frequency range, the EMI-SE was found to be 20–30 dB, indicating that these composites can be used as effective lightweight EMI shielding materials.
Ahmad et al. [
4] examined the dielectric and mechanical properties of epoxy resin composites reinforced with chemically reduced graphene oxide (rGO). The dielectric properties were measured in the frequency range of 8 to 12 GHz for samples with a constant thickness of 6 mm and reinforcement levels ranging from 0 to 5 wt% rGO. The maximum shielding effectiveness recorded was 25.75 dB at 12 GHz for the composite containing 5 wt% rGO. A remarkable enhancement in the electrical conductivity of epoxy resin composites reinforced with graphite and graphene nanoplatelets was reported by Vesco et al. [
5], with graphite exhibiting a plateau at higher concentrations (78.4 kΩ·mm resistivity).
Graphene/epoxy resin composites produced using a three-roll mill with a gap setting ranging from 40 to 25 μm at 200 rpm exhibited good dispersion [
6]. The percolation threshold was found to be 1 wt%, the electrical conductivity of epoxy increased by around eight log cycles, and the thermal conductivity increased by around 90% in comparison with that of a pure epoxy matrix.
Combinations of graphene and MWCNTs were also examined as a hybrid reinforcement for epoxy resins [
7]. A three-roll mill method was used by Oztürkmen et al. [
8] for the dispersion of carbonaceous fillers, such as GNPs and MWCNTs, in aerospace-grade epoxy composites. Their results showed that the electrical conductivity can be tailored to meet specific requirements using these fillers, which enhance the electrical conductivity without adversely affecting other physical and mechanical properties.
The use of epoxy resin composites doped with different concentrations of graphene nanoplatelets and carbon nanotubes (CNTs) was studied by Campo et al. [
9], and they mentioned that the addition of graphitic nanofillers enhanced the hydrophobicity of the surfaces and the stiffness and water resistance of the composites. In addition, they enhanced the adhesive strength of the doped coatings compared to glass epoxy composites using a mechanical nano-anchoring mechanism of adhesion.
The electrical properties of epoxy hybrids filled with graphene nanosheets and MWCNTs were investigated by Raimondo et al. [
10] using Tunneling Atomic Force Microscopy (TUNA). Hybrid composites with a low concentration of nanoparticles (0.1 wt%) exhibited a synergistic effect on the electrical conductivity, showing an increase of several orders of magnitude and a reduction in the electrical percolation threshold (EPT).
Ramos-Galicia et al. [
11] mentioned that carbon nanotubes (CNTs) acted as exfoliation material in contact with graphite under ultrasound irradiation. Epoxy nanocomposites incorporating 0.3 wt% graphene nanoplatelets and CNTs displayed the highest enhancement in the storage modulus, glass transition temperature, and impact resistance response.
Dyachkova et al. [
12] focused their research on hybrid epoxy nanocomposites, using filler mixtures of carbon nanotubes (CNTs) and graphene forms (graphene oxide, GO, and graphene nanoplatelets, GPNs) in different ratios. The composite materials, containing 0.15–1.00 wt% CNTs/GO or CNTs/GPNs, underwent thermogravimetric analysis (TGA) and mechanical property characterization. During TGA, all the epoxy composites demonstrated thermal stability up to 300 °C. A trend of reduced resistance to thermal degradation was observed with an increasing hybrid filler content. This was explained by the fact that the carbon nanostructures, when interacting with the epoxy resin, reduced the degree of polymerization during curing, leading to lower thermal stability. SEM micrographs showed that in CNT/GO composites, the nanotubes were located between the GO sheets, whereas in CNT/GPN composites, the nanotubes were observable on the surface of the GPNs. This provided an indication that graphene aids in the dispersion of nanotubes, and according to Dyachkova et al., increasing the graphene concentration contributes to the stabilization of CNT dispersion in both water and epoxy resin.
In this work, epoxy resin was reinforced with commercial MWCNTs and GP using solution mixing/casting techniques. The prepared nanocomposites were characterized using XRD, SEM, RAMAN, FTIR-ATR, and DSC methods. In addition, the thermal stability, electrical conductivity, and EMI shielding effectiveness were evaluated to assess the suitability of these materials for use as protective coating materials. Based on these results, an attempt was made to correlate the electrical conductivity with the EMI shielding properties of graphene- and MWCNT-reinforced epoxy matrix composites and to elucidate the mechanism responsible for the improved thermal stability of the MWCNT/epoxy matrix composites.
3. Results
3.1. XRD
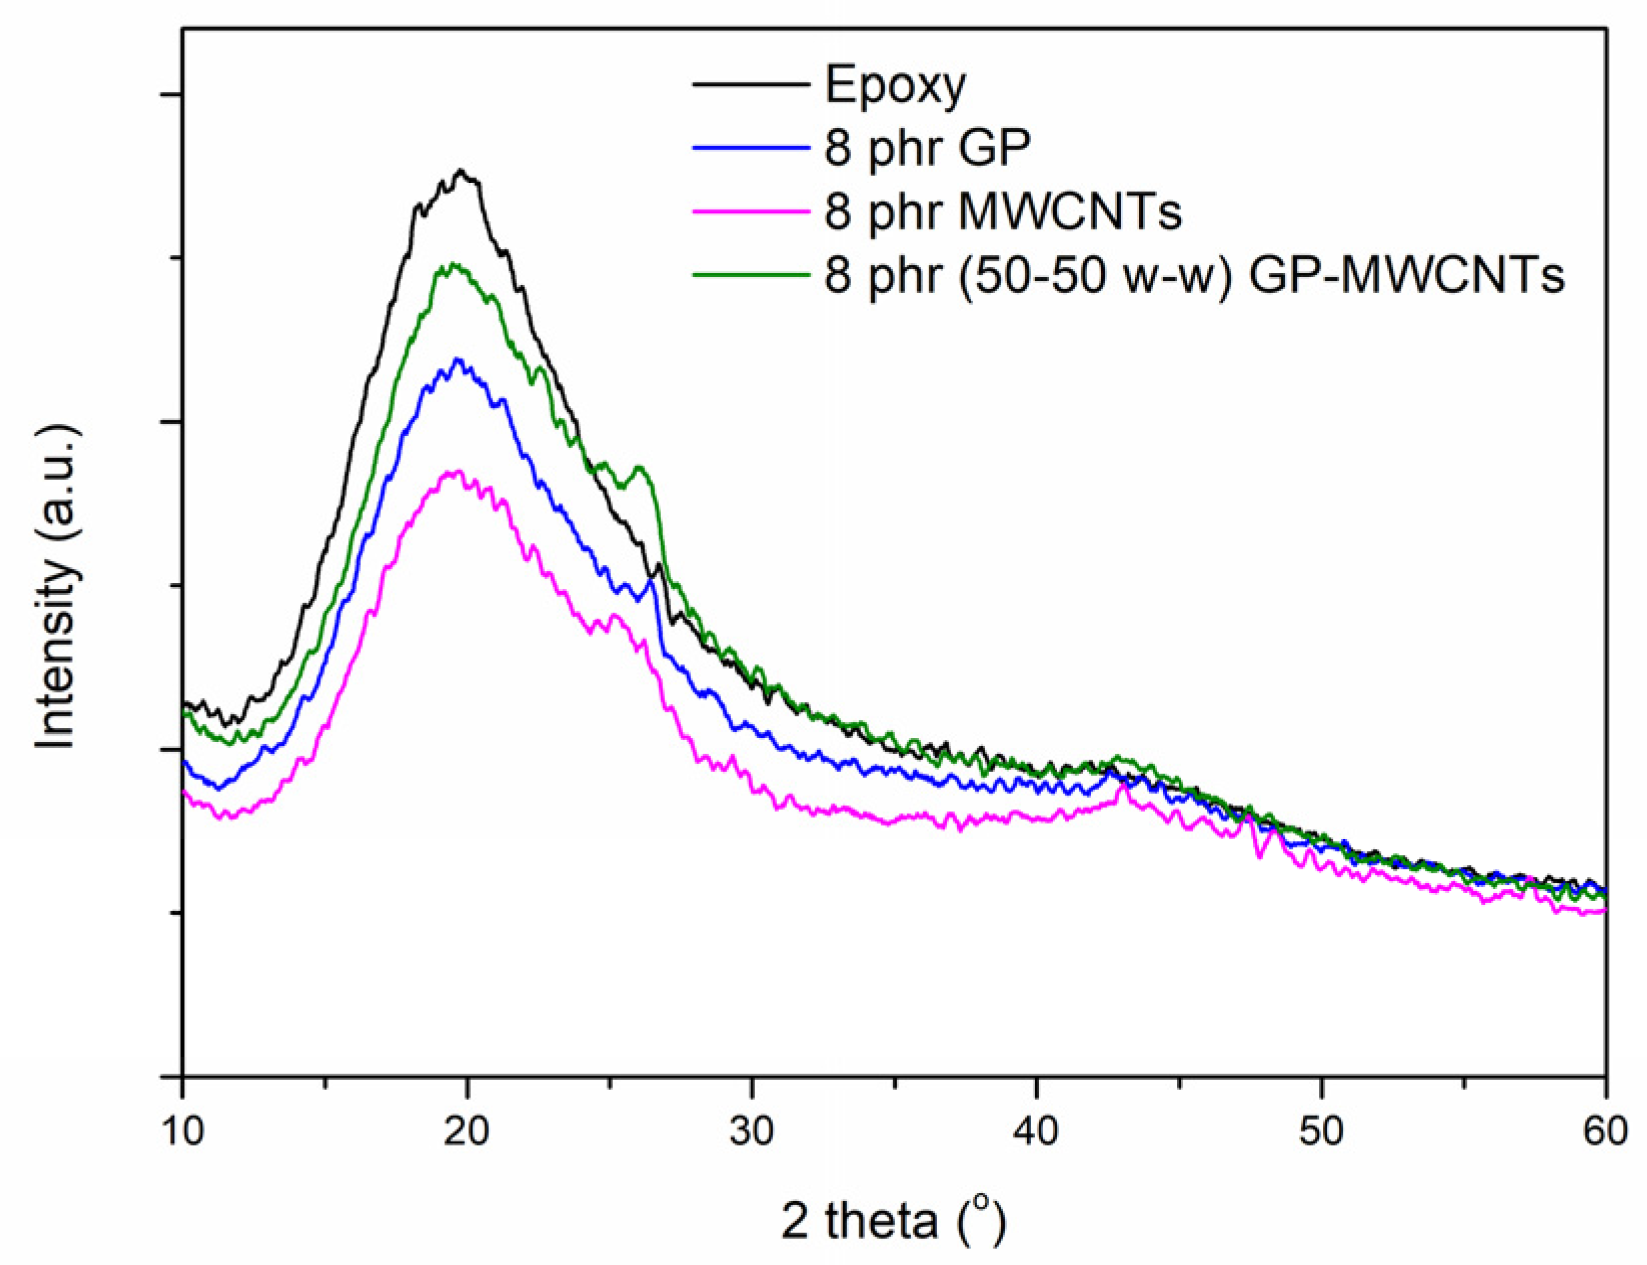
The study of the structure of the composites using X-Ray Diffraction (XRD) analysis revealed a broad peak for 2θ~20° (
Figure 3), which was attributed to epoxy resin, the position of which remained unaffected while its intensity was reduced by the addition of graphitic-based reinforcements. The symmetry of the epoxide peak at around ~20° was disrupted on the right side by the characteristic peak of the nanoinclusions. In particular, in the XRD patterns of the 8 phr GP, 8 phr MWCNT, and 8 phr (50-50 w-w) GP-MWCNT nanocomposites, a small peak was observed at ~26°, which is characteristic of the graphitic structure of the nanoinclusions.
3.2. SEM
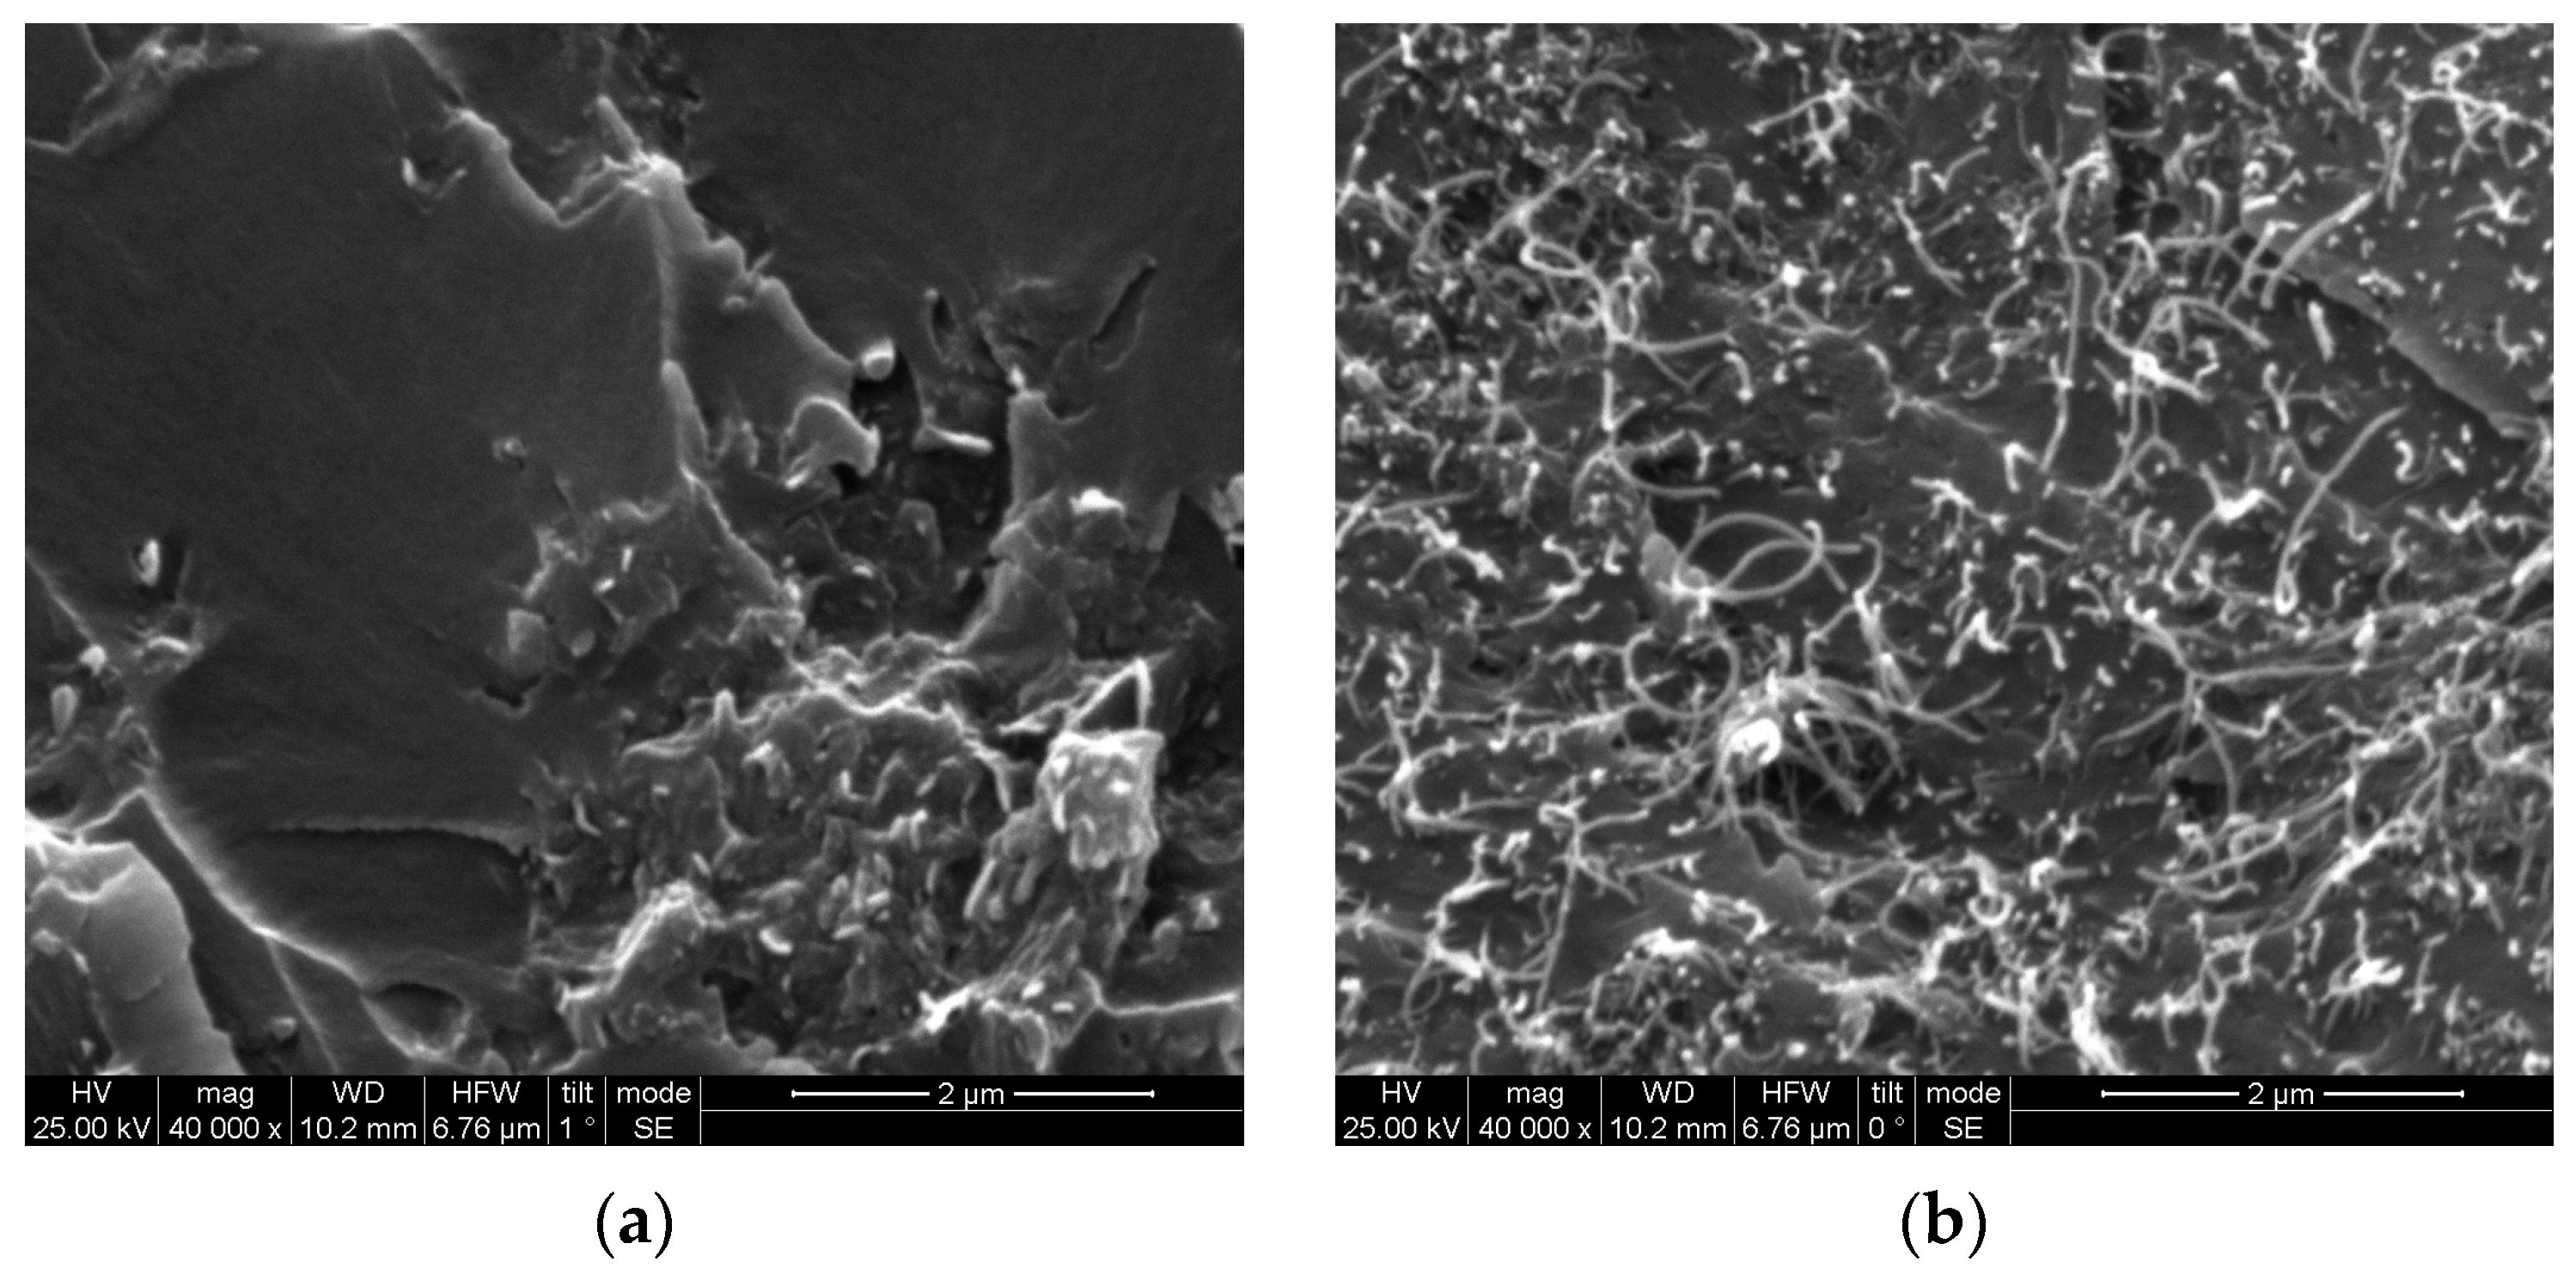
SEM micrographs were obtained of the cross-section of the epoxy resin nanocomposite specimens, as presented in
Figure 4. These micrographs indicate that the reinforcing agents (GP and MWCNTs) seem to have been homogeneously dispersed within the epoxy matrix.
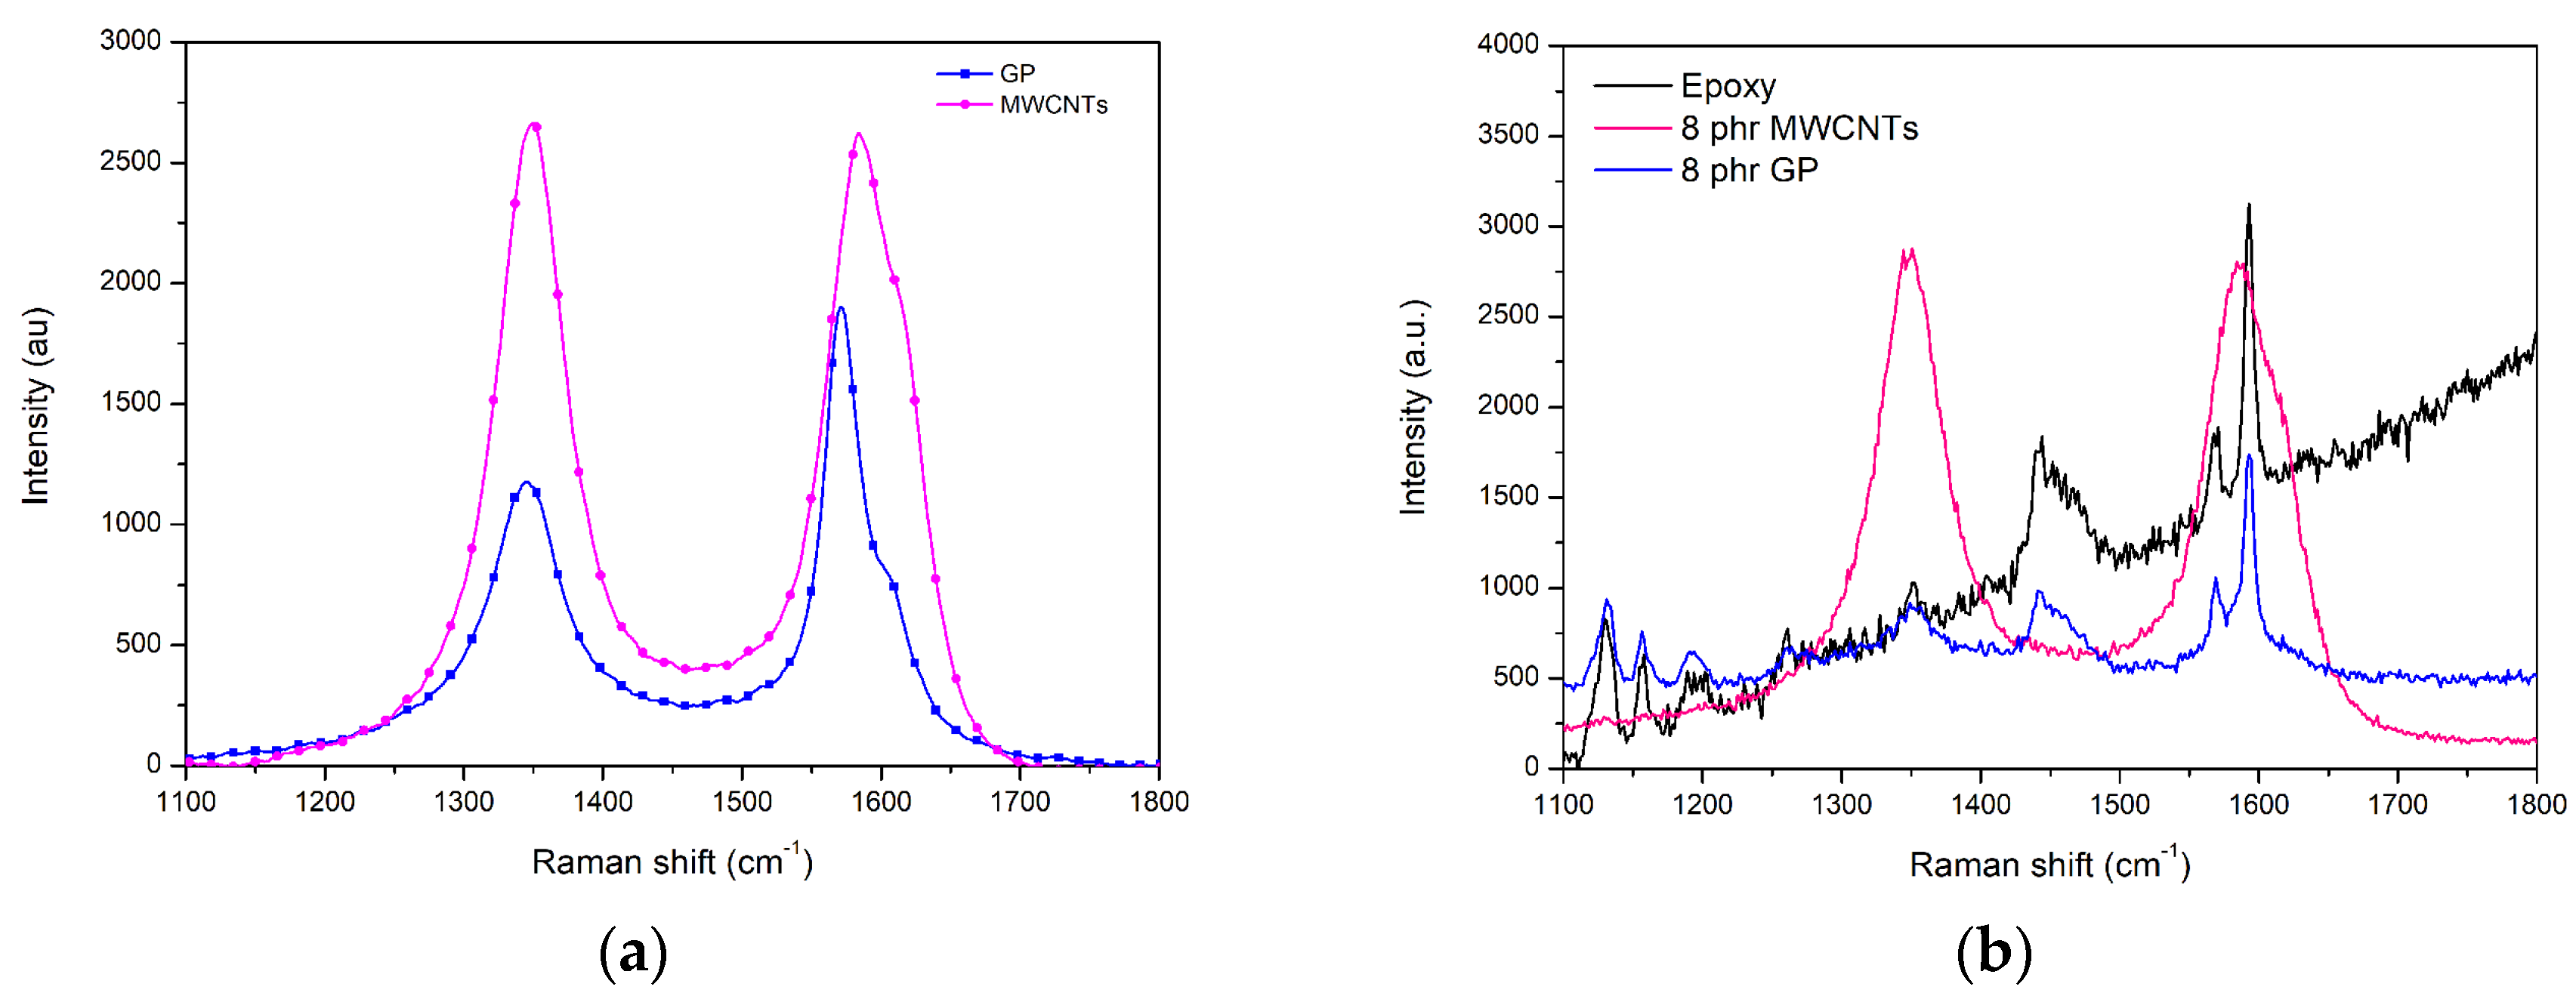
3.3. Raman
Structural defects were examined using RAMAN spectroscopy, and the results are presented in
Figure 5. The D band indicates defects in the graphitic structure, originating from out-of-plane vibrations, and appears at around 1350 cm
−1. The G band is located at 1580 cm
−1 and originates from the in-plane vibration of the sp
2-hybridized C–C bond, indicating a graphitic structure. The intensity ratio of these two peaks (Ι
D/I
G) serves as an indicator for assessing the quality of the carbon nanotubes and the structure of graphene. High values of the Ι
D/I
G ratio indicate the presence of defects in the graphitic structure. Therefore, based on the data in
Table 2, the commercial carbon nanotubes exhibited the most defects, followed by the commercial graphene nanoplatelets. This ranking was also maintained in their corresponding epoxy matrix nanocomposites.
It was observed that no significant difference existed in the intensity ratio (I
D/I
G) of the characteristic bands D (1350 cm
−1) and G (1580 cm
−1) between graphitic inclusions and nanocomposites at a concentration of 8 phr. This confirms that the preparation of the composites did not create further defects in the graphitic structure of the carbon-based nanoparticles [
14].
It was also noticed that the position of the G peak of graphene in the composites shifted from 1571 cm
−1 to 1593 cm
−1, a result that indicates the presence of interfacial interactions between the epoxy resin and graphene [
15].
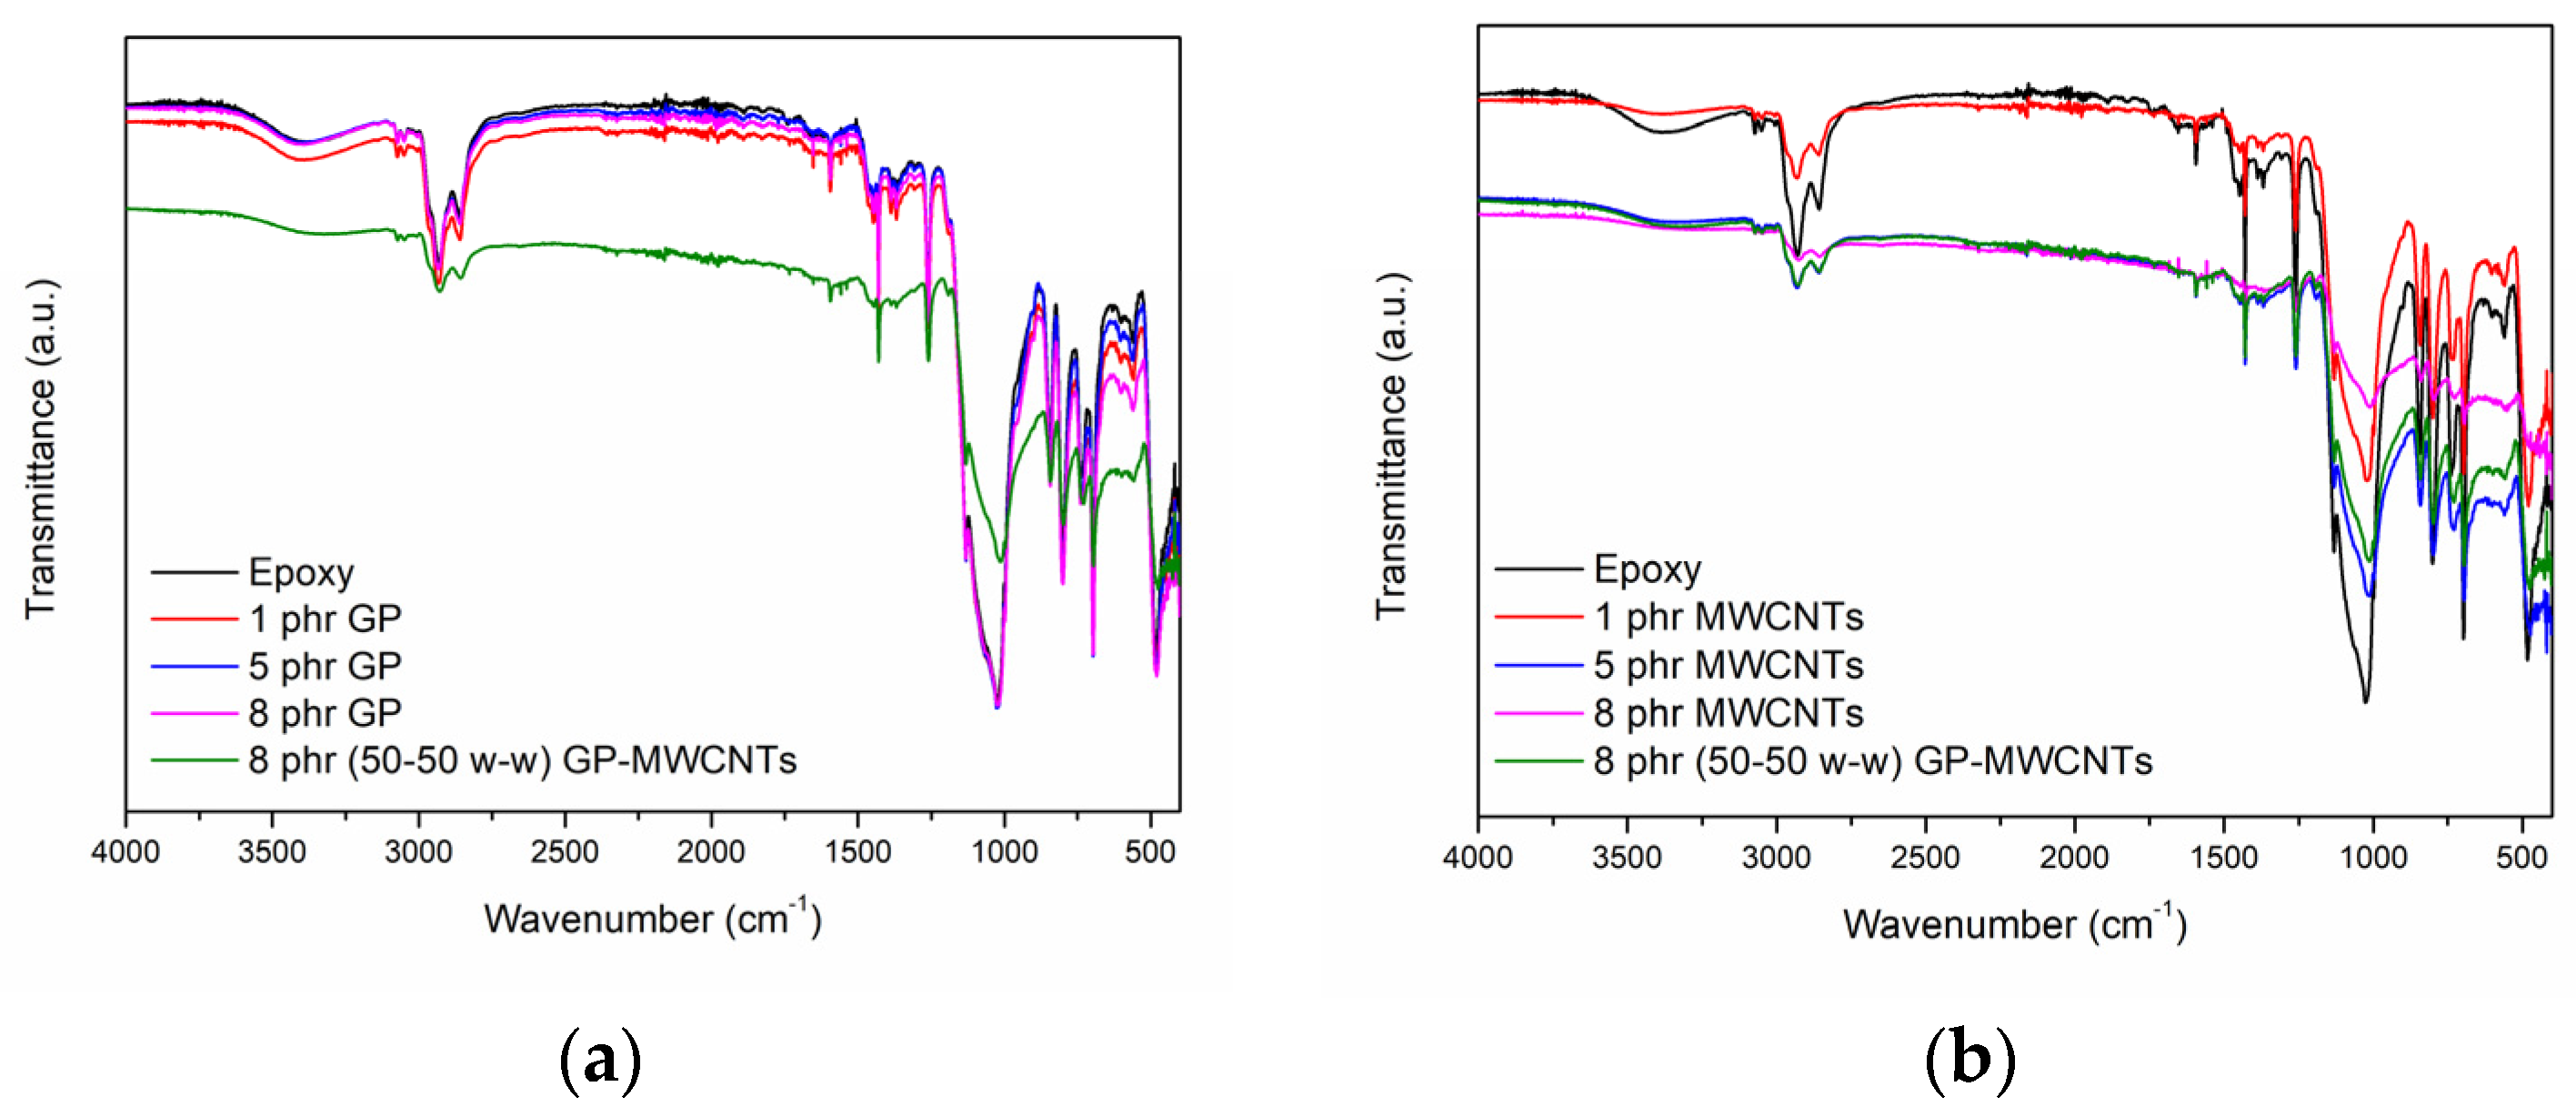
3.4. FTIR-ATR
Fourier Transform Infrared (FTIR) spectroscopy and the attenuated total reflectance (ATR) technique were utilized for the chemical characterization of the nanocomposites. The peaks of the epoxy resin at 2929 cm
−1 and 2852 cm
−1 (attributed to the symmetric and asymmetric stretching vibrations of the C–H bond in the methyl groups, –CH
3) were present in the nanocomposites without any shifts. A shift was observed in the peak at 1023 cm
−1 (attributed to the C–O–C stretching vibration of the ether group) of the epoxy resin, where the presence of MWCNTs in the epoxy resin caused it to shift to 1009 cm
−1 for the nanocomposite with 8 phr MWCNTs, to 1011 cm
−1 for the hybrid nanocomposite, and to 1014 cm
−1 for the nanocomposite with 5 phr MWCNTs (
Figure 6b). This shift could be attributed to interactions that developed between the epoxy matrix and the MWCNTs, such as hydrogen bonding or Van der Waals forces. In addition to the peak position shift, these samples exhibited a reduction in their intensity.
The peak at 1023 cm
−1 was attributed to the stretching vibration of the ether group of the epoxy resin. With the addition of carbon nanotubes, a shift in the peak in the lower wavenumber direction was observed, as can be seen in
Figure 6b, related to the developing interactions between the epoxy and MWCNTs. The FTIR-ATR spectra of the composites with graphene exhibited no shifting in the position of this peak (
Figure 6a).
3.5. DSC
Differential Scanning Calorimetry (DSC) was used to study the thermal transitions of the composites with a concentration of 8 phr, and the obtained graphs are presented in
Figure 7. From the results in
Table 3, it can be observed that the neat epoxy resin had a T
g of approximately 41.1 °C. The carbon nanotubes increased the glass transition temperature (T
g) of the epoxy matrix by limiting the mobility of the polymer chains, while the graphene nanoplatelets decreased it to around 34.1 °C. Roy et al. have reported that the presence of nanotubes affects the alignment of polymer chains, thereby increasing the T
g of nanocomposite materials [
16]. Only slight variation in the T
g was observed by Shen et al. [
17] for raw MWCNT-based nanocomposites, while the T
g decreased approximately by 20 °C when adding 1 wt% of amino-functionalized MWCNTs.
A decrease in the T
g values of MWCNT/epoxy resin nanocomposites with a 0.2 to 0.6 wt% MWCNT content, prepared via a sonication mixing process, was observed by Neto et al. [
18]. This effect was attributed to a reduction in crosslinking and the disruption of the matrix curing reaction caused by the presence of the nanotubes. However, as the MWCNT content increased further, the T
g also increased. An increase in the T
g of epoxy resin achieved through the addition of 0.2 wt% CNTs using sonication was mentioned by Turan et al. [
19], although it decreased at higher concentrations because a higher amount of residual solvent reduced the crosslinking density.
The highest Tg value, approximately 46.8 °C, was observed in the hybrid nanocomposite containing 4 phr GP and 4 phr MWCNTs. The simultaneous presence of graphene and carbon nanotubes contributed to their uniform dispersion in the polymer matrix, which further hindered the mobility of the polymer chains. This resulted in a 14% increase in the Tg for the hybrid nanocomposite compared to that of the neat epoxy polymer.
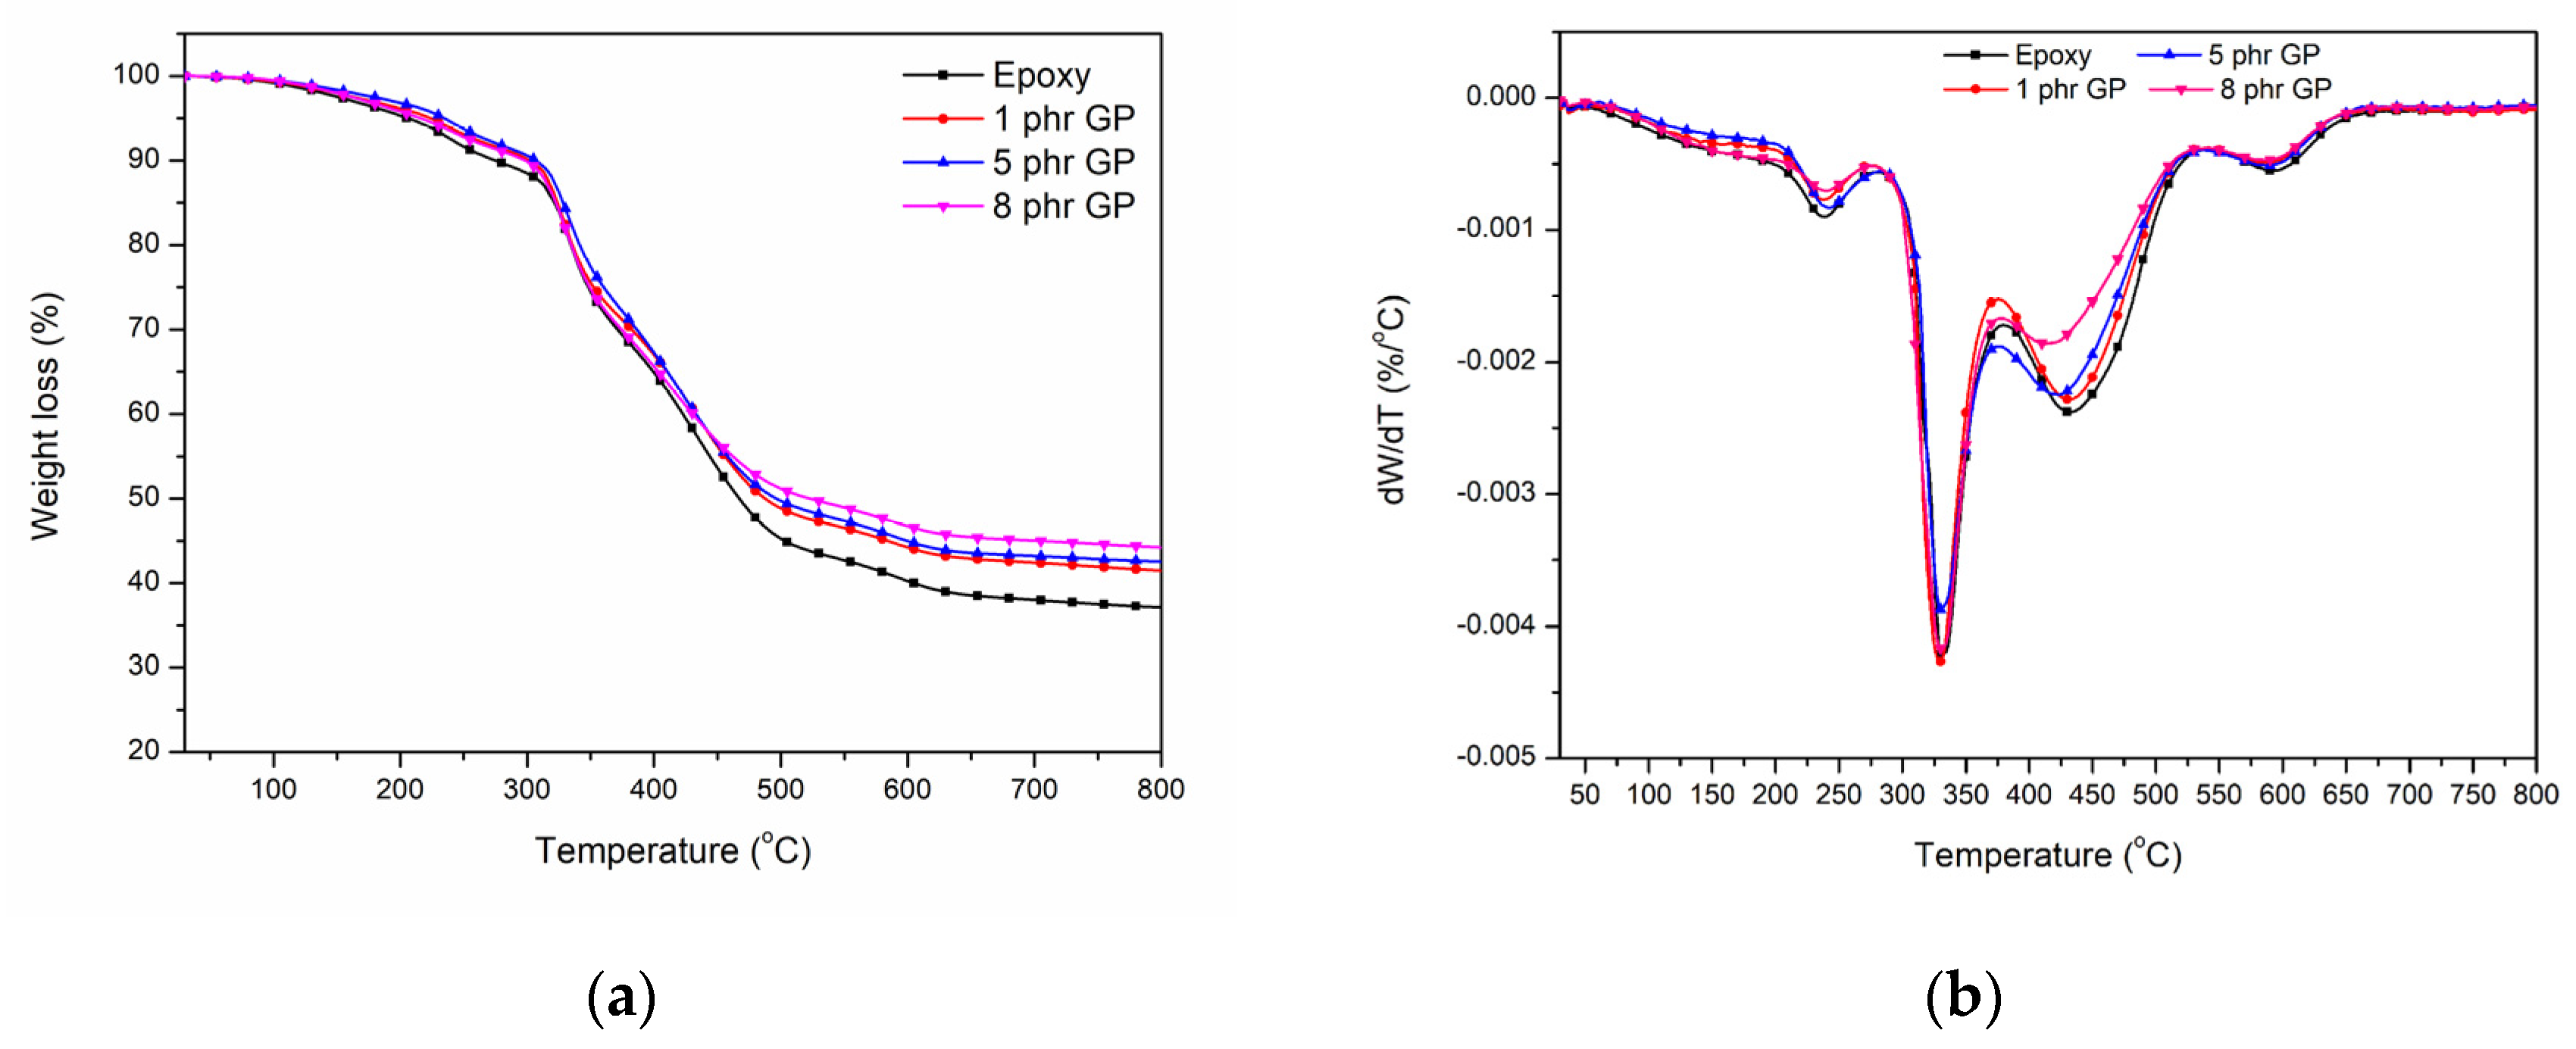
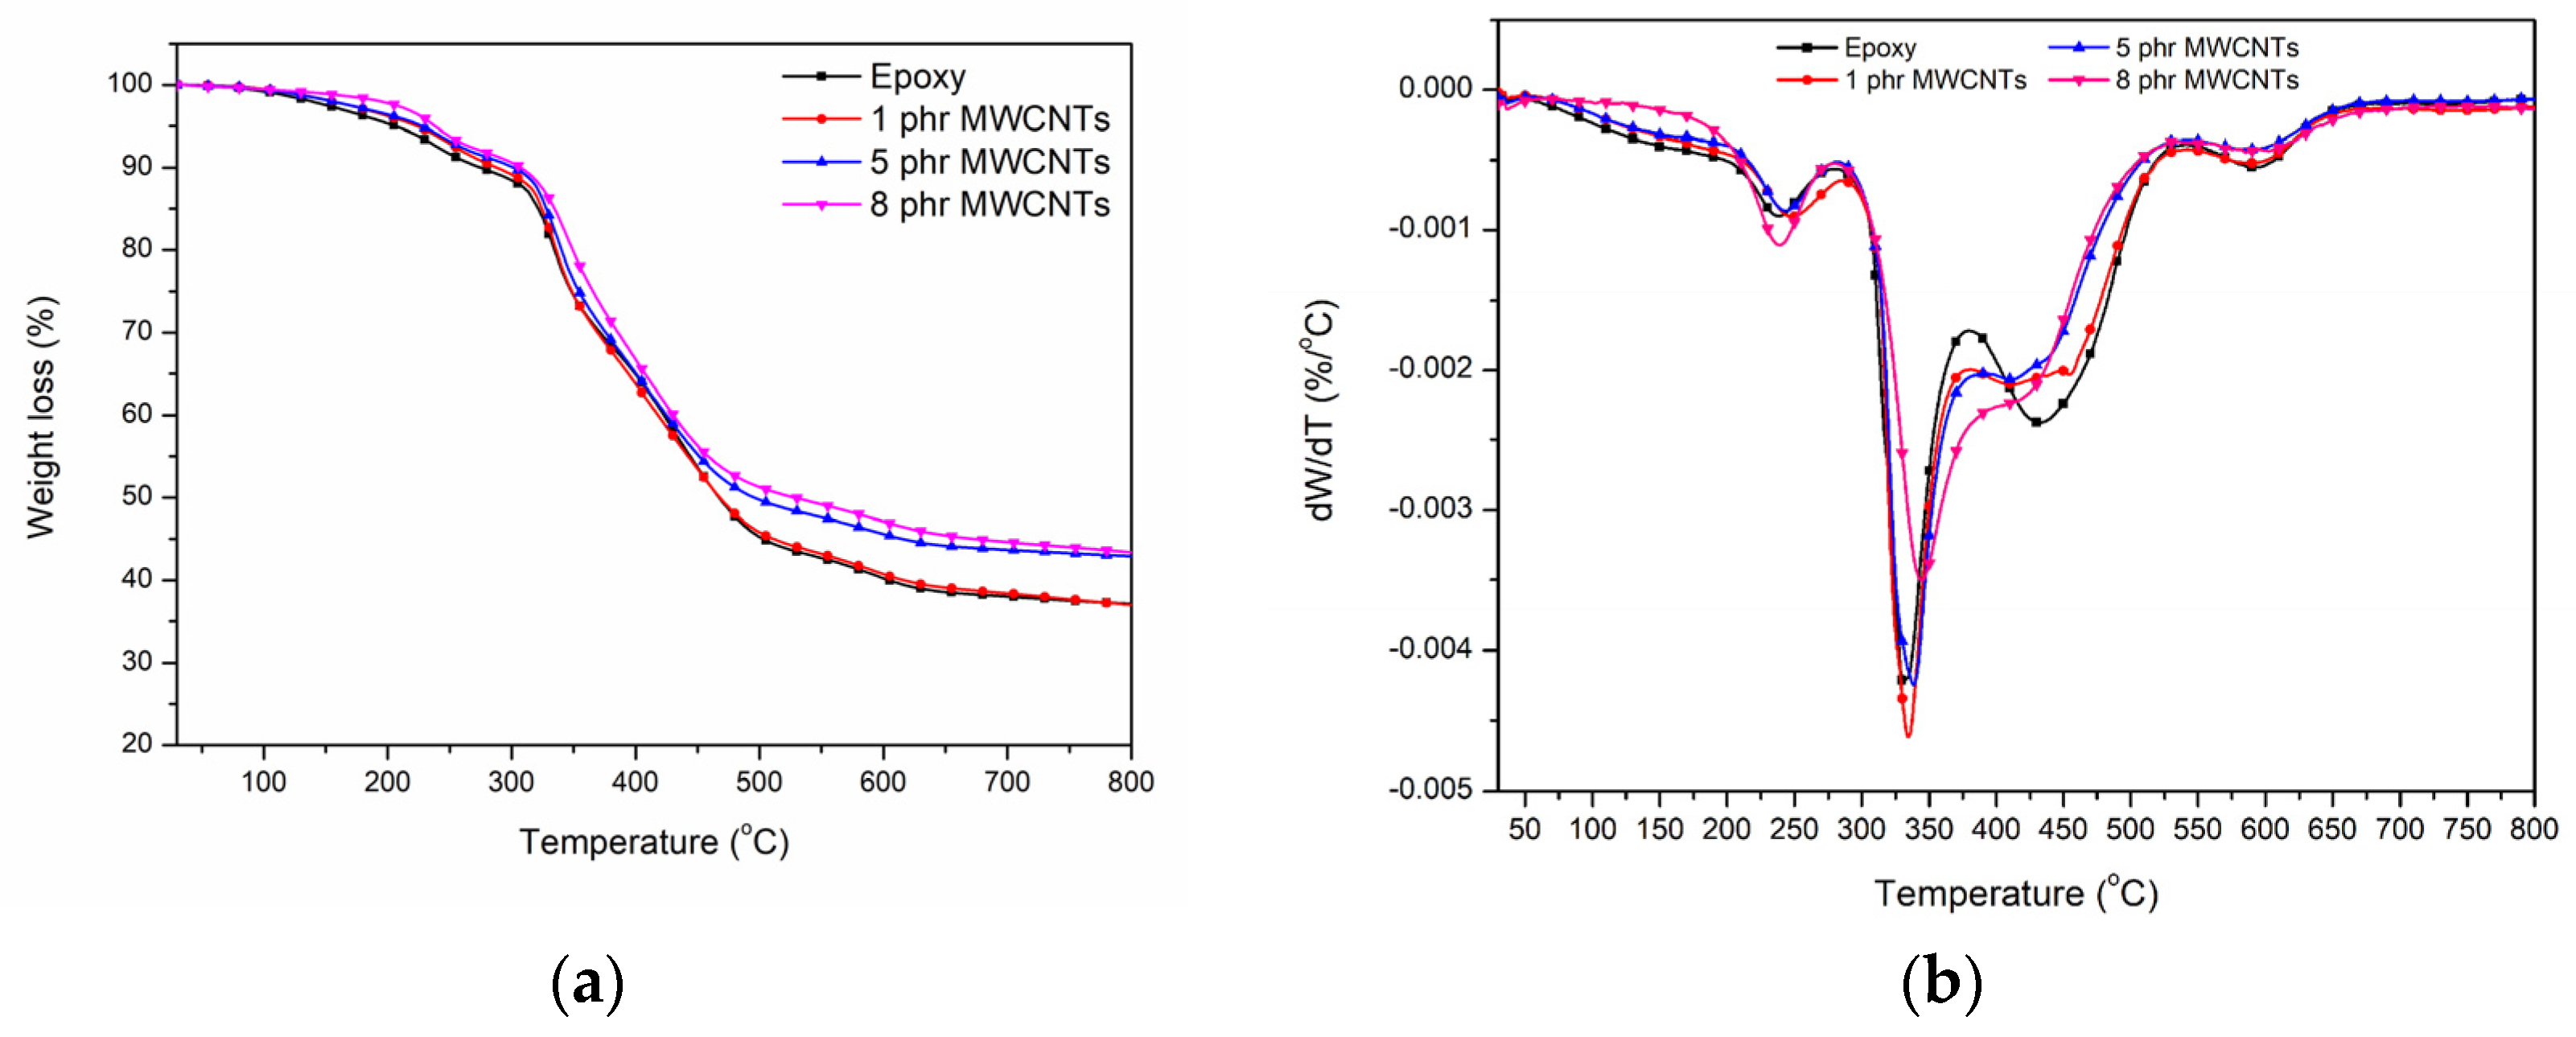
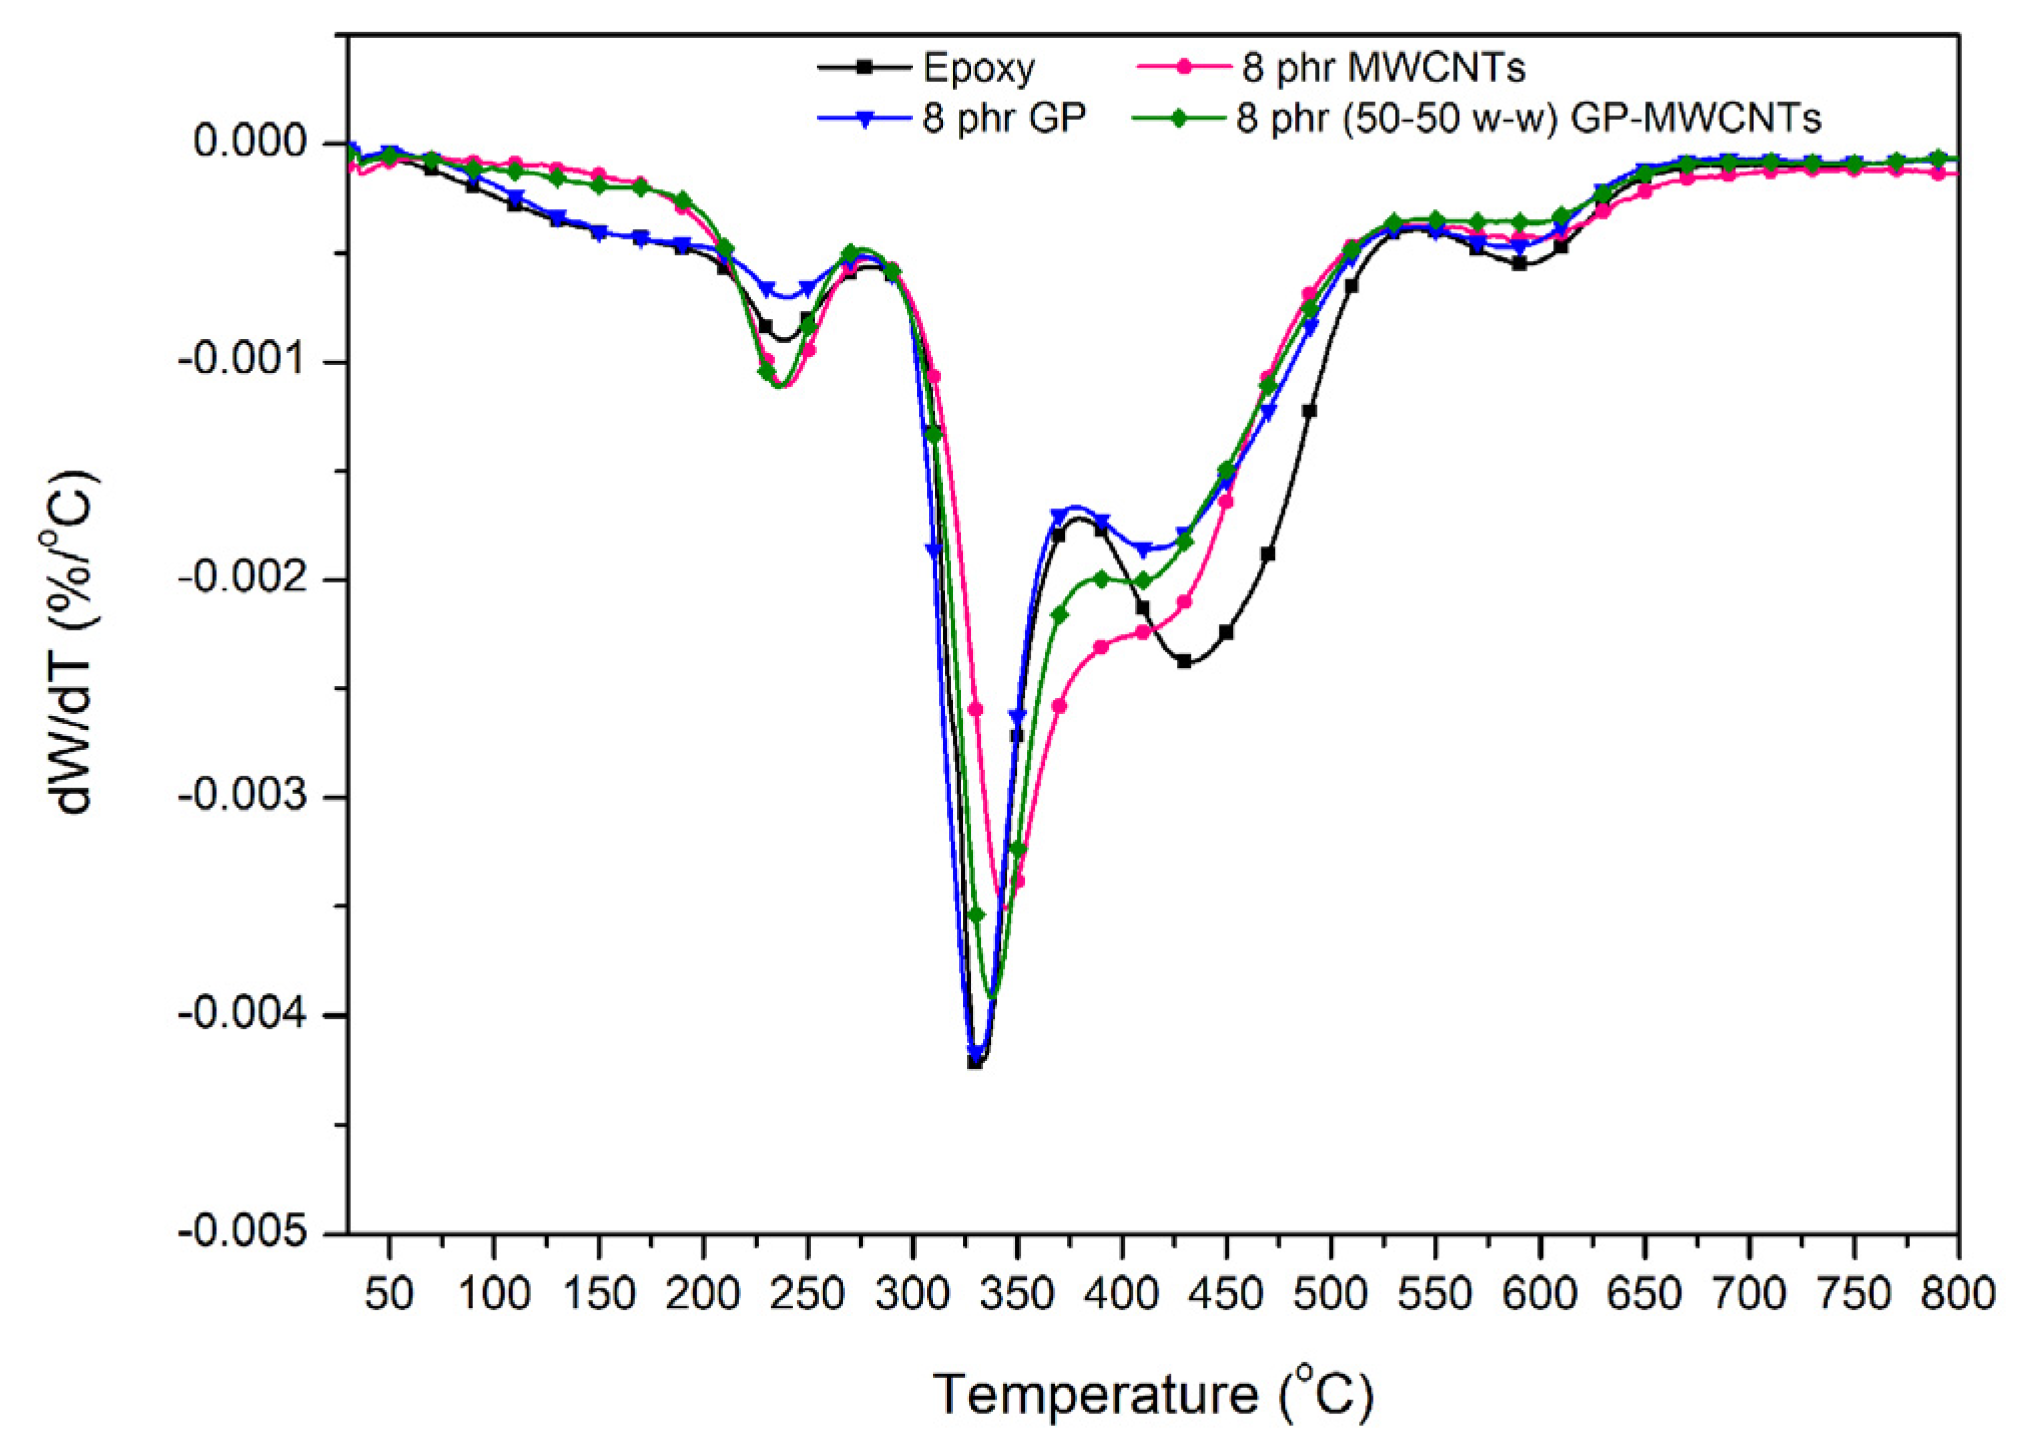
3.6. TGA
The thermogravimetric analysis (TGA) of the composites involved examining them in an inert nitrogen environment, in a temperature range of 30 to 800 °C, and the results are presented in
Figure 8 and
Figure 9 and
Table 4. The thermal degradation of the composites occurred in four distinct stages, the most important of which was the second stage (300–400 °C).
As mentioned above, the majority of the thermal degradation of the epoxy resin took place during the second stage, within a temperature range of 300–400 °C. Therefore, the influence of the investigated graphitic nanoparticles in this temperature range is of particular interest. As shown in
Figure 8, graphene reduced the thermal stability at concentrations of 1 and 5 phr, while a slight improvement was observed at 8 phr. The incorporation of carbon nanotubes increased the temperature at which the maximum degradation rate was reached during this stage proportionally to their concentration in the composite. In addition, carbon nanotubes significantly weakened the third stage of thermal degradation (400–550 °C). In this degradation stage what appeared as a distinct peak in the unreinforced epoxy resin was transformed into a ‘shoulder’ in its nanocomposites, and a decrease in the temperature at which the maximum degradation rate (T
d,3) was reached was observed (
Figure 8b and
Figure 9b). An exception was found in the CNT composites at a concentration of 1 phr. The hybrid GP-MWCNT system at 8 phr exhibited stability regarding this parameter. Additionally, all the examined carbon-based nanofillers reduced the degradation during the fourth stage (530–650 °C).
Regarding the hybrid composite containing GP and MWCNTs (
Figure 10), a smaller improvement was observed compared to that with the MWCNTs alone, since the presence of graphene nanoplatelets did not positively affect the thermal stability of the epoxy polymer at this stage. Therefore, the behavior of the hybrid system followed the rule of mixtures.
The temperature at which a 5% weight loss of the total sample mass occurred (Td,5%) was improved in all the MWCNT composites proportionally to the concentration of the reinforcing agent. The graphene composites showed an improvement at 1 and 5 phr, while at 8 phr their reinforcing effect was negated. The hybrid composite containing 8 phr GP-MWCNTs shows an increased Td,5% value similar to that of the CNT composite.
Based on the above, among the investigated reinforcing agents, the carbon nanotubes provide the greatest enhancement in resistance to the thermal degradation of their epoxy resin composites. The incorporation of graphene did not appear to have a positive effect on this property.
3.7. Surface Resistance and Electric Conductivity Mesurements (Loresta GX)
The electrical properties of the nanocomposites were studied by measuring their conductivity. The electrical conductivity measurements for the commercial carbon nanotubes and their epoxy resin composites were carried out using the Loresta GP MCP-T610 instrument, and the results are presented in
Table 5. Conductivity measurements for graphene using this method were not possible due to the breaking of the pellet upon contact with the ESP electrode. According to the literature, it is known that as the number of graphene sheets (nanoplatelets) and the thickness of the graphene increase, the resistance also increases, leading to a decrease in the electrical conductivity. When the number of layers reaches between 14 and 16 (assuming an interlayer spacing of 0.34 nm and a layer thickness of 0.42 nm), the conductivity approaches a limiting value of 1.1 × 10
3 S/m, which corresponds to the conductivity of graphite.
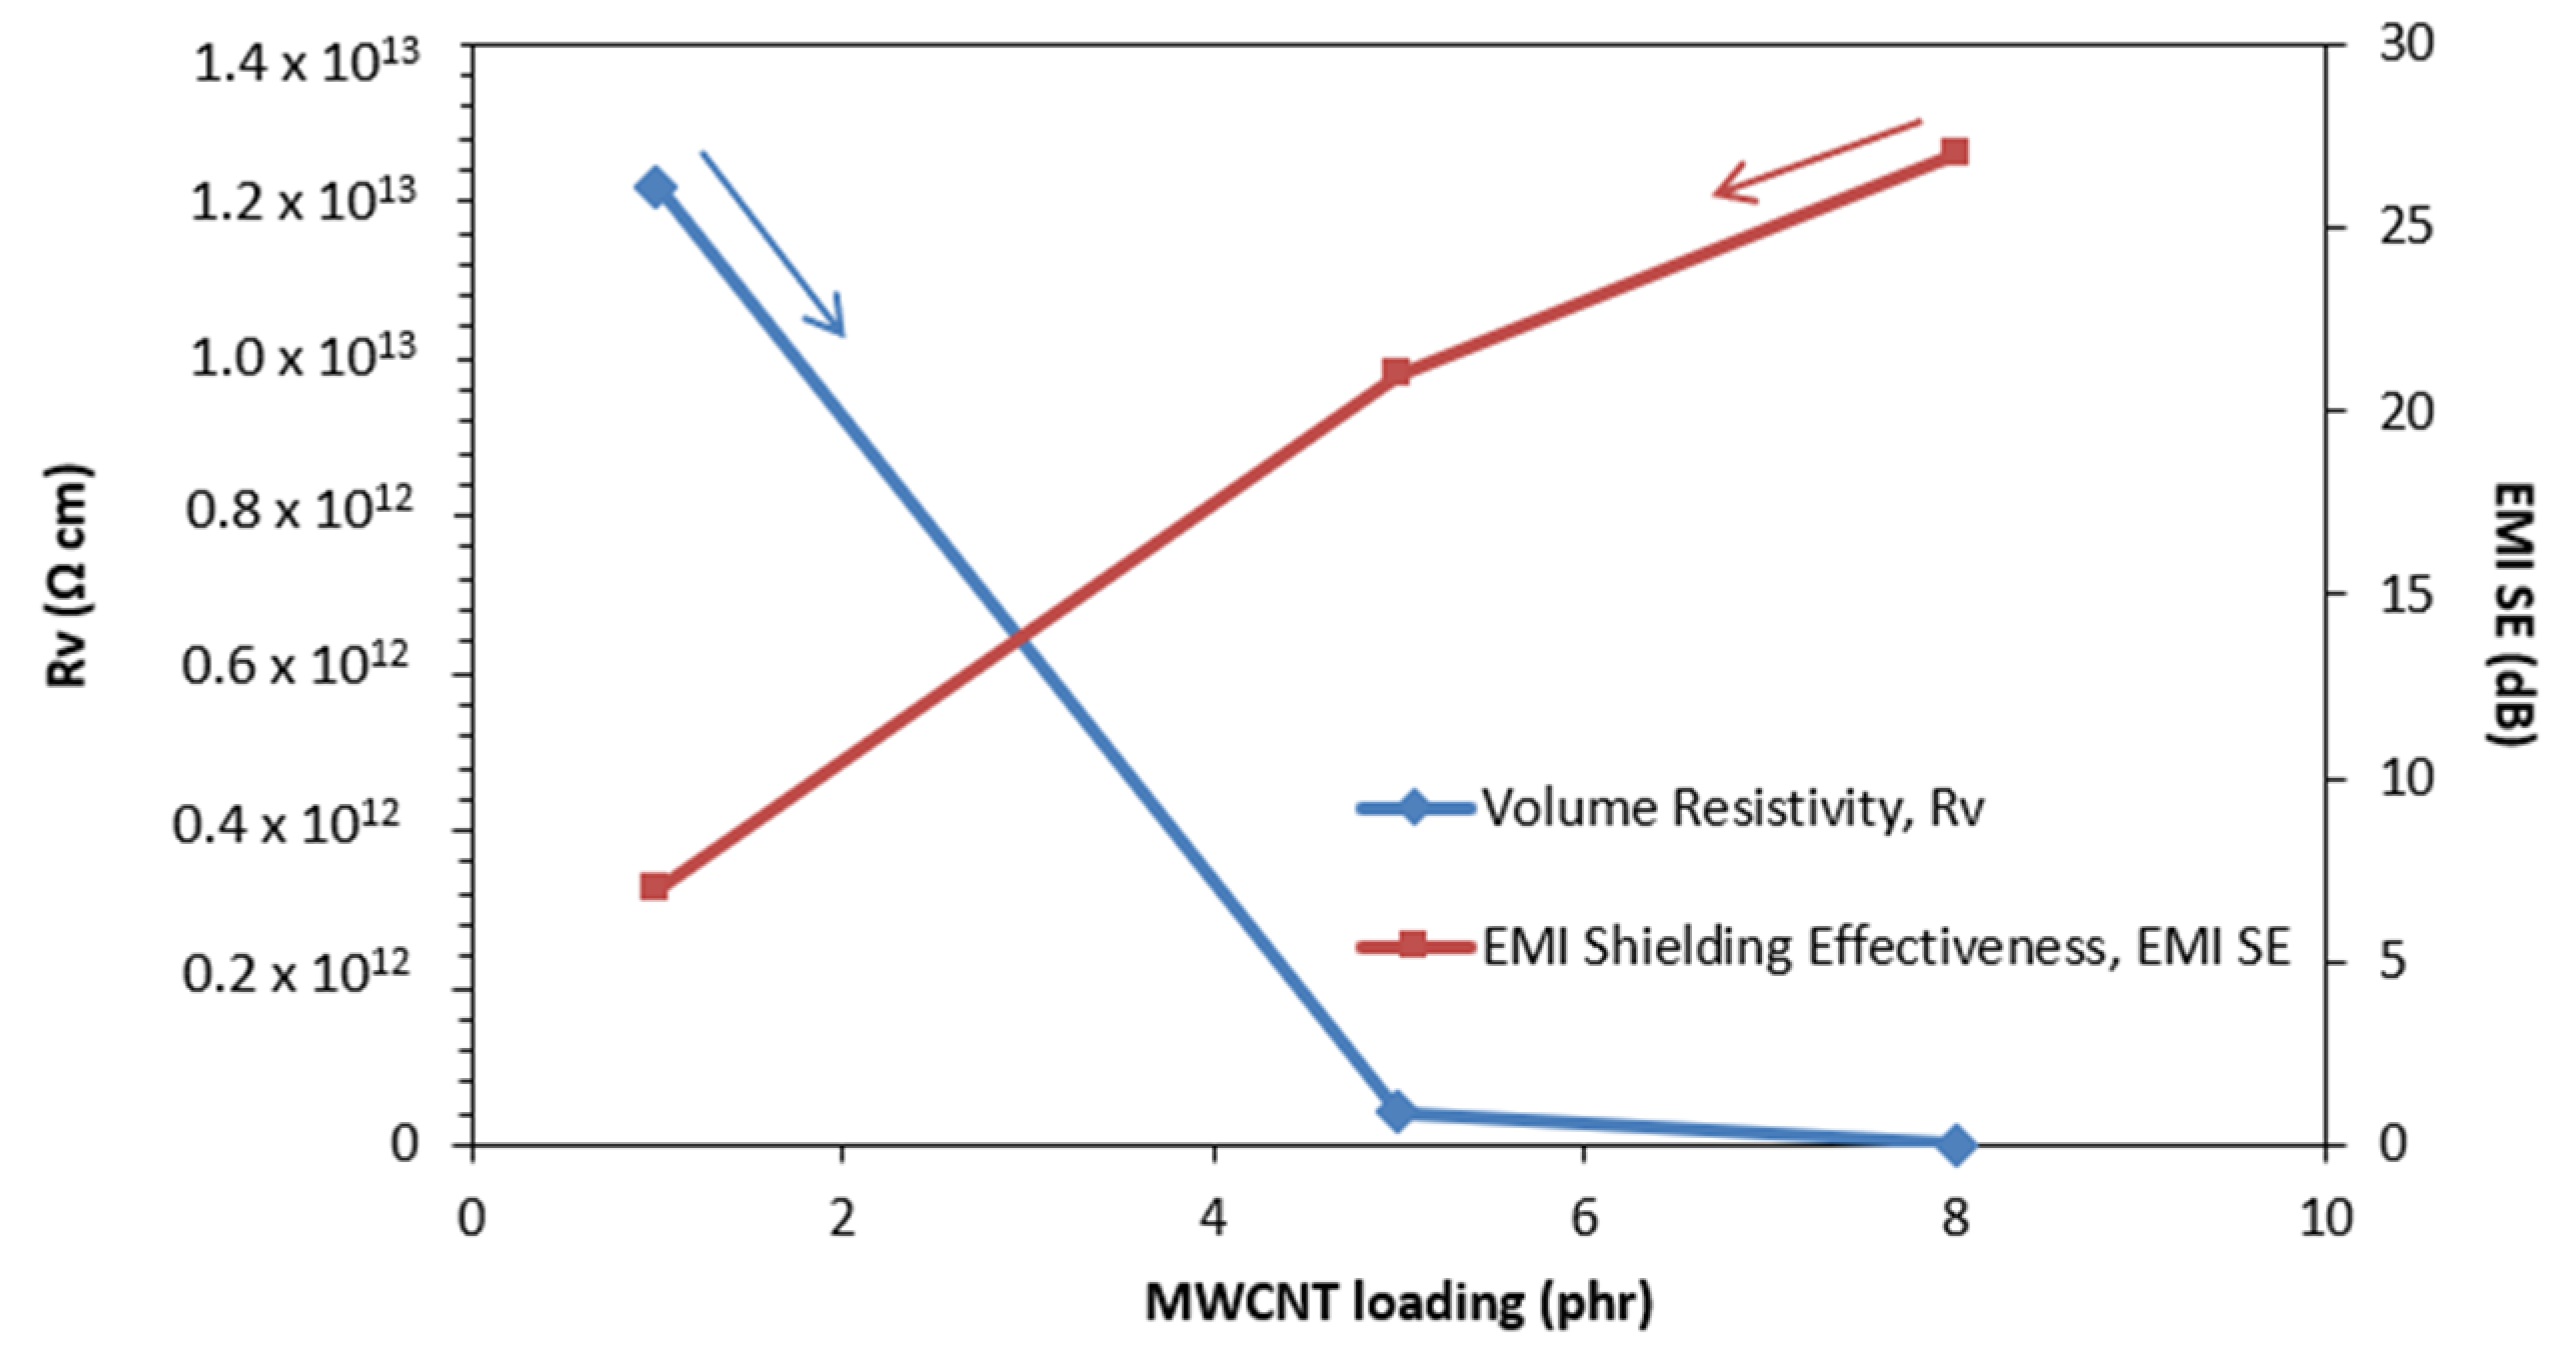
The highest conductivity value was observed in the nanocomposite with a concentration of 5 phr MWCNTs. The hybrid nanocomposite with 8 phr GP-MWCNTs exhibited lower conductivity than the nanocomposite with 8 phr MWCNTs due to the reduced conductivity contribution of the graphene nanoplatelets. The carbon nanotube composites showed higher conductivity than their graphene counterparts.
Figure 11 illustrates the dependence of the conductivity on the concentration of nanotubes in the nanocomposite. From this graph, it can be observed that at a low nanotube content, the conductivity was also low, as the average distance between the charge carriers was large and restricted by the matrix. At a concentration of 5 phr MWCNTs, the inclusions came closer together and formed a conductive network, resulting in increased conductivity [
20,
21]. This point could be considered the percolation threshold, i.e., the critical filler concentration at which a significant increase in the conductivity occurs. However, a further increase in the nanotube concentration may lead to the formation of agglomerates and poor dispersion, ultimately reducing the conductivity.
Using the least squares method, a second-degree polynomial equation was fitted:
The modification of MWCNTs using strong acids opened their end groups, resulting in the formation of -COOH and -OH groups on the tube walls and side edges [
22]. The dispersion of the modified MWCNTs in the epoxy matrix resulted in a three-dimensional conductive network, leading to a significant decrease in the volume resistivity. In nanocomposites containing 10 wt% MWCNTs, the resistivity was reduced by up to 10 orders of magnitude compared to that of the pure matrix.
For the nanocomposites with GP, electrical conductivity measurements were performed using the Hiresta UP MCP-HT450 setup. The surface resistance and volume resistance showed higher values at low concentrations, while the electrical conductivity followed the opposite trend (
Table 5).
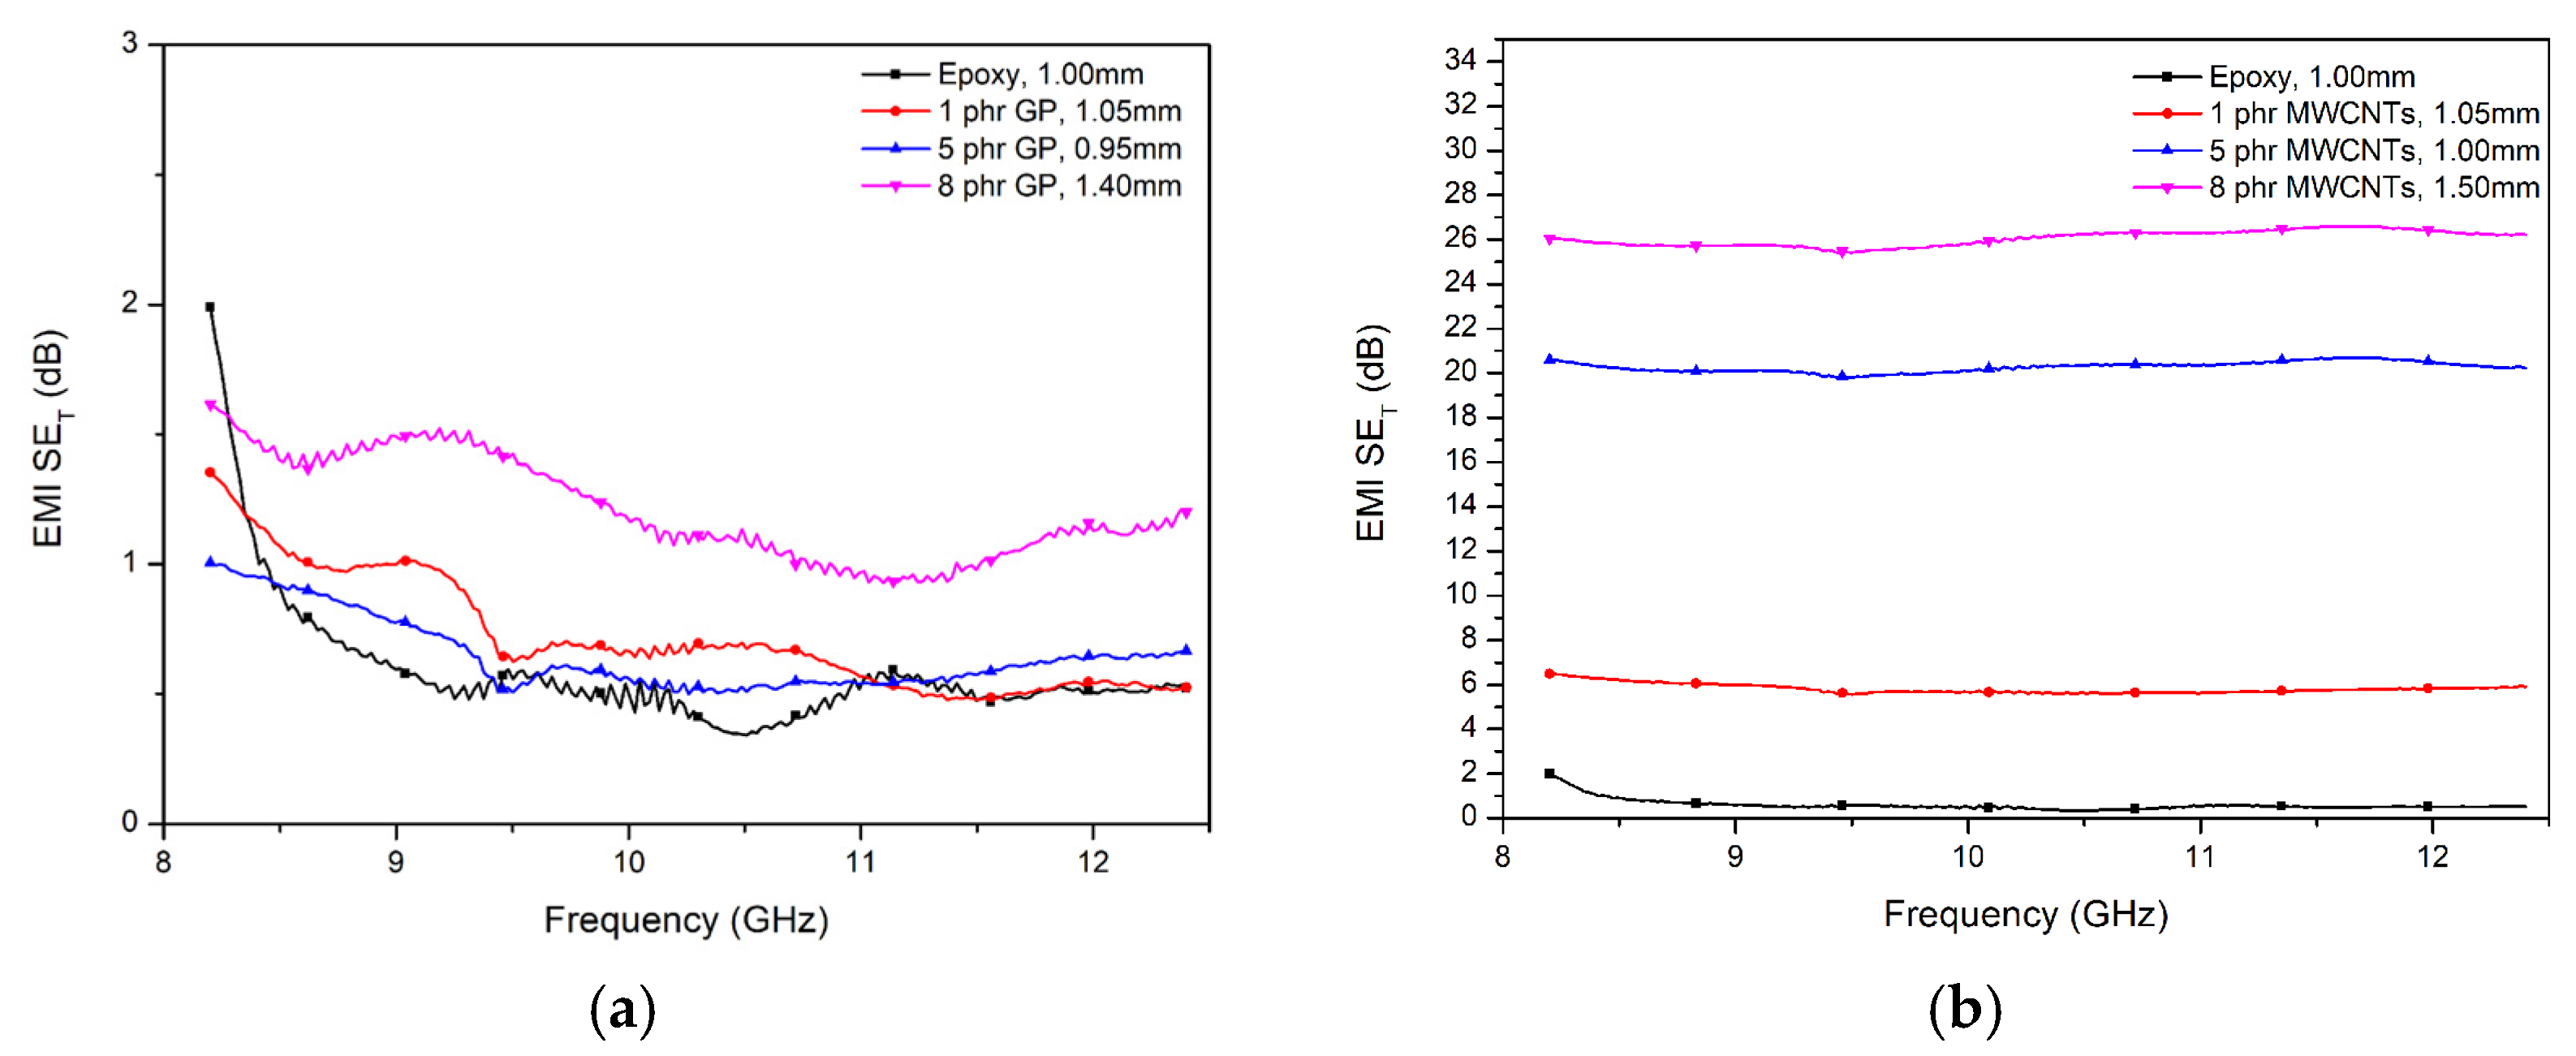
3.8. Electromagnetic Intereference (EMI) Shielding Effectiveness
Correspondingly, the measurements of the electromagnetic interference shielding effectiveness (EMI-SE) revealed that the samples with concentrations of 5 and 8 phr MWCNTs obtained the highest EMI-SE values of ~21 and 27 dB (
Figure 12b).
The thicknesses of the films prepared in the present study ranged from 0.5 to 1.5 mm. Specifically, the film containing 5 phr MWCNTs had a thickness of 1 mm. To theoretically estimate the EMI SE values for the 5 phr MWCNT/epoxy resin composites at thicknesses of 2 mm and 3 mm, Schelkunoff’s theory [
23] was applied, yielding values of 29.7 dB and 38.4 dB, respectively.
Huang et al. [
3] mentioned a 20–30 dB EMI SE in the X-band for 15% SWCNT/epoxy matrix composites, indicating that they can be used as effective lightweight EMI shielding materials.
Figure 13 shows the simultaneous effect of the MWCNT concentration in the nanocomposites on the conductivity and EMI shielding. The volume resistance initially decreased sharply with an increase in the MWCNT content up to 5 phr. This change in the volume resistance can be attributed to the formation of a carbon nanotube network. At this point, the EMI shielding effectiveness (EMI-SE) reached a satisfactory level of approximately 21 dB. A further increase in the nanotube concentration led to a slight increase in both the conductivity and electromagnetic shielding.
In the case of the GP/epoxy matrix composites, the EMI shielding effectiveness of the epoxy resin did not show any improvement with an increase in the filler content (
Figure 12a).
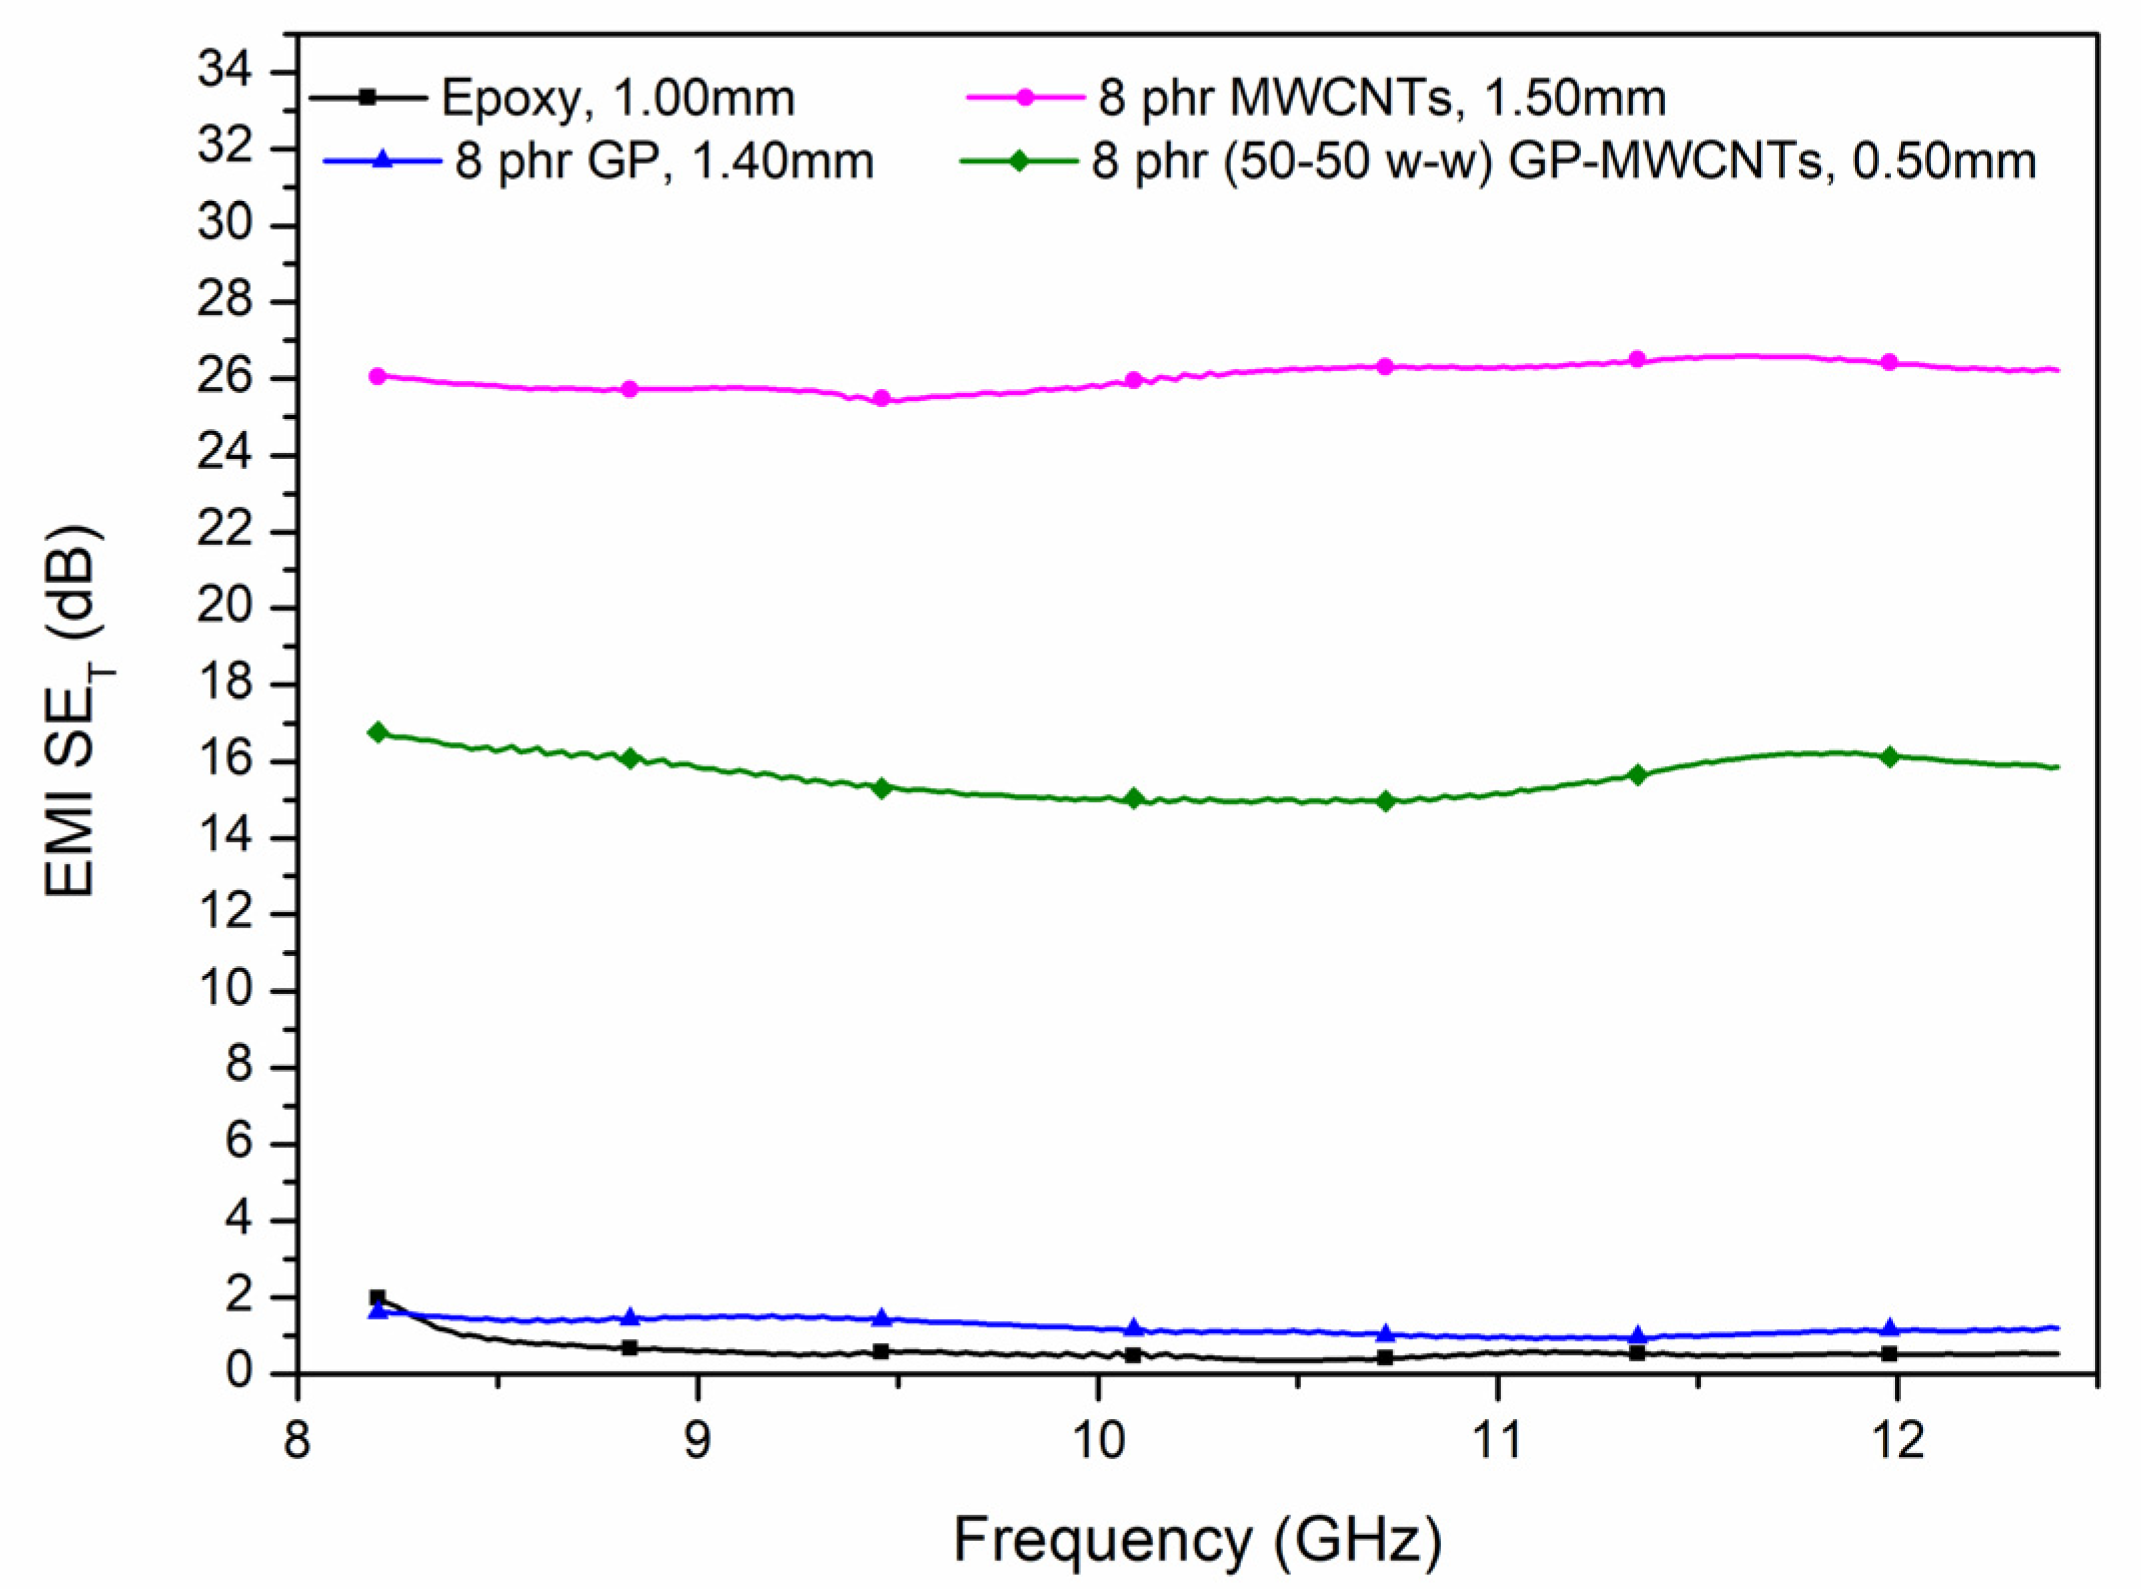
Figure 14 summarizes the EMI shielding effectiveness measurements of the epoxy resin nanocomposites with a concentration of 8 phr of the examind graphitic nanofillers. At this concentration, it was found that the carbon nanotubes formed conductive pathways within the epoxy composite, enhancing the electrical conductivity (
Table 5). Therefore, the EMI shielding effectiveness (EMI-SE) was satisfactory. For the GP nanoplatelets, the volume resistance was found to be several orders of magnitude higher than that of the nanotubes.
This high resistance indicates the absence of a sufficient conductive network within the composite and explains the low electromagnetic shielding effectiveness.
The presence of nanotubes, even in the hybrid sample, contributed to an increase in the shielding effectiveness (~17 dB) as well as the electrical conductivity. For graphene reinforcement, higher concentrations need to be applied in the composites in order to re-evaluate the potential formation of conductive pathways that could lead to improved conductivity and, consequently, enhanced EMI shielding.
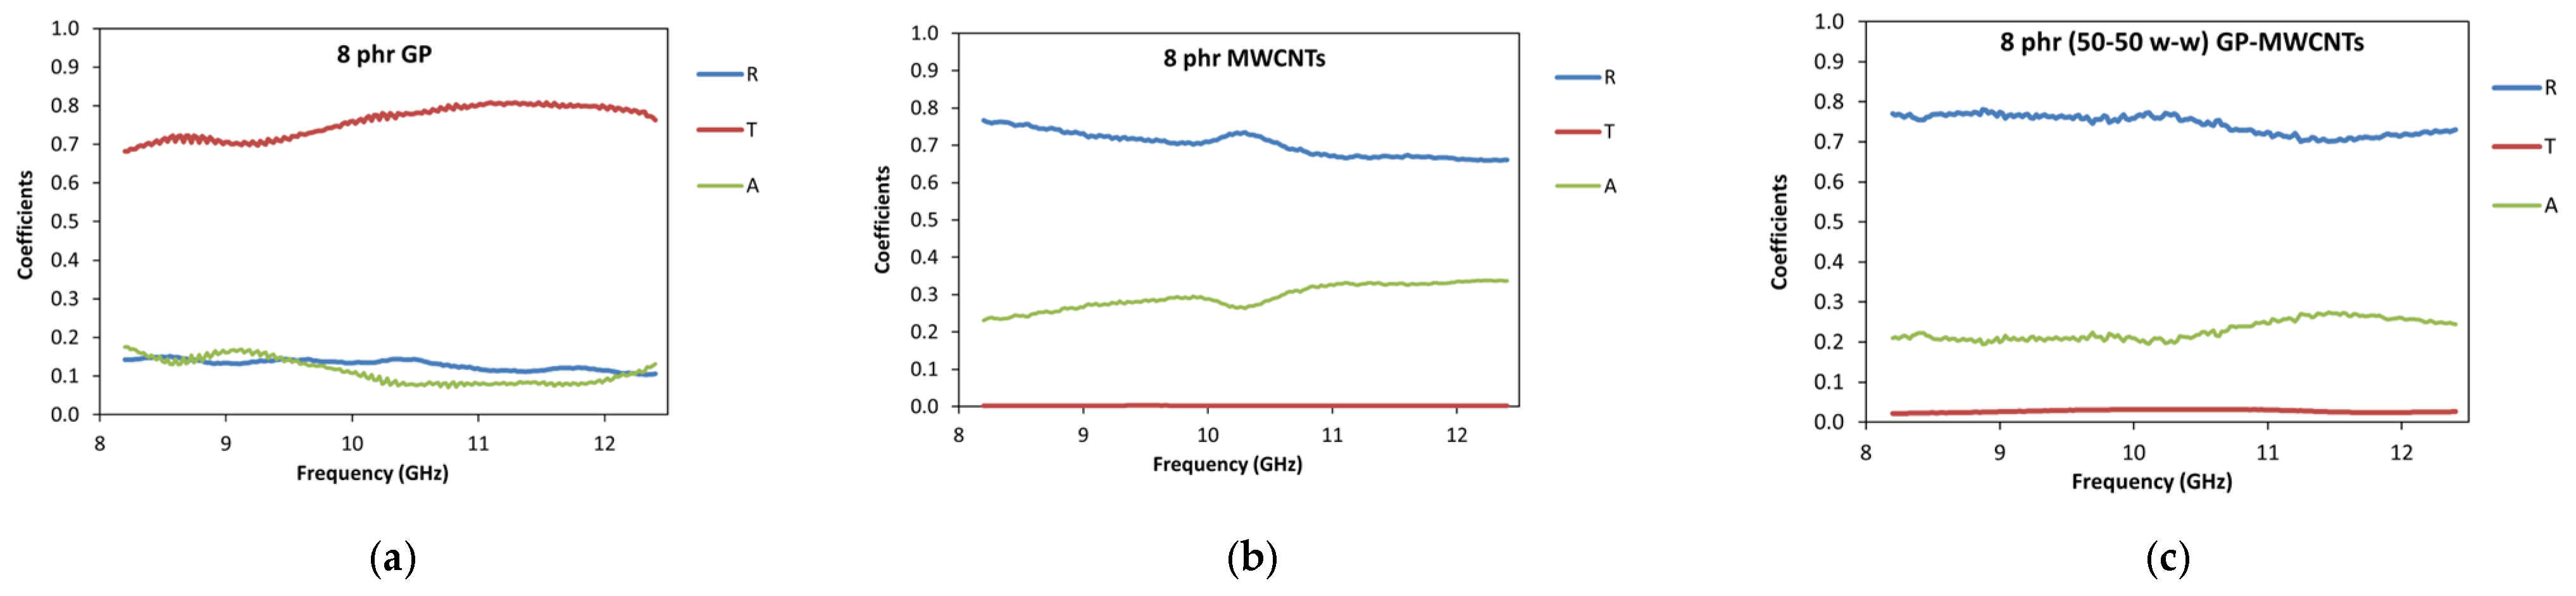
To better understand the mechanisms of electromagnetic interference (EMI) shielding—specifically the contributions of reflection and absorption—the power coefficients of reflection (R), absorption (A), and transmission (T) were calculated based on the measured S-parameters (Equations (6)–(8)). The power coefficients for the epoxy resin samples with MWCNT and GP inclusions at a concentration of 8 phr are shown in
Figure 15.
As expected from the shielding effectiveness measurements, the epoxy resin samples with MWCNT inclusions exhibited the lowest transmission among all the measured samples. The transmission decreased with an increasing nanotube concentration. Furthermore, from
Figure 15b, it is evident that the primary contribution to shielding in the MWCNT samples came from reflection. However, as the concentration of nanotubes increased, the role of absorption became more significant.
The hybrid composites with 8 phr (50–50
w/
w) GP-MWCNTs followed in terms of the EMI shielding effectiveness (
Figure 15c). They showed a similar contribution from reflection to that seen in the MWCNT-only composites but demonstrated lower absorption and higher transmission, which resulted in reduced shielding effectiveness compared to that of the MWCNT composites.
For the samples with graphene (GP), it was shown that the contributions of both reflection and absorption (R and A) were practically equivalent (
Figure 15a). However, these samples exhibited higher transmission and, consequently, relatively low EMI shielding.
4. Conclusions
MWCNT and GP epoxy matrix nanocomposites were prepared using a solvent-mixing method assisted by sonication. TGA in an inert nitrogen atmosphere showed that the thermal degradation of these composites occurred in four distinct stages, with the most significant being the second stage (300–400 °C). The greatest improvement in the thermal stability of the epoxy resin was provided by the carbon nanotubes, while the inclusion of graphene did not significantly enhance the stability of its composites.
From the study of thermal transitions using DSC, it was observed that the incorporation of carbon nanotubes increased the Tg of the epoxy matrix from 41.1 to 43 °C due to the restriction of the polymer chains’ mobility, a result of good dispersion and interactions that developed between the nanotubes and the polymer chains, as were noticed during the FTIR-ATR characterization. In contrast, the graphene composites showed a reduced Tg. However, the hybrid composite with 4 phr MWCNTs and 4 phr GP exhibited the highest Tg increase (14%), supporting the theory of a synergistic effect of graphene in improving the dispersion of carbon nanotubes within the polymer matrix.
The study of the electrical properties revealed that the carbon nanotube composites exhibited higher electrical conductivity compared to the graphene-based composites, with a percolation threshold estimated at around a 5 phr loading (σ = 2.48 × 10⁻¹ S/cm). The evaluation of the EMI shielding effectiveness showed that the highest shielding was achieved by the carbon nanotube composites, with values reaching approximately 21 and 27 dB for concentrations of 5 and 8 phr, respectively. The hybrid graphene–carbon nanotube composites followed in terms of their shielding performance, while the graphene composites exhibited the lowest effectiveness. Therefore, these composites could be utilized in the design of protective coatings for equipment exposed to elevated temperatures and electromagnetic radiation. For this reason, the further study of their electromagnetic (EM) shielding effectiveness across different frequencies—such as the 2 to 4 GHz range (S-band), which is commonly used in marine radar systems—is recommended. Additionally, since these materials could be utilized as protective coatings, it is proposed to investigate their behavior under accelerated aging conditions.


 ,
, 


