Article

Effect of Surface Functional Groups and Calcium Ion Adsorption on Formation of Polystyrene/Apatite Core–Shell Microspheres by Aqueous Solution Method

Graduate School of Energy Science, Kyoto University, Kyoto 606-8501, Japan
*
Author to whom correspondence should be addressed.
J. Compos. Sci. 2025, 9(7), 323; https://doi.org/10.3390/jcs9070323
Submission received: 30 April 2025 / Revised: 19 June 2025 / Accepted: 20 June 2025 / Published: 24 June 2025
(This article belongs to the Special Issue Biomedical Composite Applications)

Abstract

If a method for developing organic polymer/apatite core–shell microspheres encapsulating organic polymer microspheres with apatite shells can be constructed, it is possible to establish a fundamental methodology to fabricate apatite capsules for drug delivery carriers. In this study, polystyrene (PS) microspheres were used as model substances in organic polymer microspheres, and the effects of the surface functional groups on the PS microspheres on the amount of Ca2+ ions introduced onto the PS microspheres were investigated. The PS/apatite core–shell microspheres were prepared by immersing Ca2+-incorporated PS microspheres in a reaction solution containing Ca2+, HPO42−, and Mg2+ to coat the surface of PS microspheres with apatite. Particle characterization of the prepared PS/apatite core–shell microspheres was performed, and the relationships among the surface functional groups, surface potential, Ca2+ adsorption, and apatite shell formation in the aqueous solution on the PS microspheres were investigated.

1. Introduction

Apatite is an extremely important material in medical engineering. This is because apatite exhibits extremely high affinity toward living bones [1,2,3,4] and cells [5,6], enabling it to exist safely in the body without triggering an immune response. In addition, apatite possesses the property of directly bonds with living bone in the body [7]. Therefore, apatite is an indispensable biocompatible material in the biomedical field.
In addition to its high biocompatibility, the surface of apatite contains hydroxyl and phosphate groups that can adsorb biomolecules such as proteins, lipids, sugars, and nucleic acids [8]. By applying these properties, apatite is highly anticipated to be an excellent drug delivery carrier that can transport biomacromolecules without requiring special chemical bonding. Several researchers have proposed fabrication methods for functional material/apatite core–shell particles, such as biodegradable poly(L-lactide–co-e-caprolactone)/hydroxyapatite composite microparticles fabricated using the Pickering emulsion route [9], poly(lactic acid)/hydroxyapatite core–shell particles fabricated using an emulsification method without surfactant and calcium ion incorporation [10], carbonate apatite capsules [11], and apatite-coated cobalt ferrite particles fabricated using citric acid and simulated body fluid [12].
When the temperature and pH of a simulated body fluid (SBF) [13] increase, amorphous calcium phosphate fine particles precipitate in the solution. Yao et al. discovered that these fine particles induce apatite formation in SBF and named them apatite nuclei [14]. Apatite nuclei are believed to reduce the interfacial energy between the substrate surface and aqueous solution. The biomimetic method using apatite nuclei and SBF enables not only the coating of plate-like materials, but also the coating of particles and oil-like substances with apatite, demonstrating excellent substrate selectivity. The authors have reported that they attached apatite nuclei to the surfaces of microparticles or oil droplets and immersed them in SBF to obtain functional material/apatite core–shell microparticles [15]. Although apatite nuclei were effective in forming apatite coatings in SBF, a method to apply more minute seed substances for apatite formation is required to expand the size selectivities of the core particles because the particle size of apatite nuclei is larger than 50 nm. As a solution to this problem, the authors considered using calcium ions as seed substances for the formation of the apatite shell. If calcium ions are incorporated on the surface of organic polymer microparticles, a reaction between calcium ions and phosphate ions will occur in SBF or related supersaturated solutions with respect to apatite, and an apatite shell may be successfully formed on the organic polymer microparticles. To achieve this objective, a comprehensive investigation of the interactions between the surface states of organic polymer microparticles, including the functional groups and calcium ions, is important.
In this study, polystyrene (PS) microspheres were used as a model material for organic polymer microparticles and PS/apatite core–shell microspheres encapsulating PS microspheres with apatite shells were fabricated. The effects of the surface functional groups introduced on the surface of the microspheres on the formation of the PS/apatite core–shell microspheres were investigated. If the differences in apatite formation ability due to variations in the surface functional groups introduced on the organic polymer microspheres can be clarified, this will contribute to the establishment of a design methodology for functional material/apatite core–shell microparticles. In this study, Ca2+-introduced PS microspheres were prepared by introducing Ca2+ ions onto PS microspheres modified with six types of surface functional groups. Additionally, the influence of the type of surface functional group on the adsorption of Ca2+ on PS microspheres was investigated. Furthermore, by immersing the prepared Ca2+-introduced PS microspheres in a reaction solution containing Ca2+, HPO42−, and Mg2+, PS/apatite core–shell microspheres were fabricated. The particle properties of the fabricated PS/apatite core–shell microspheres were characterized.

2. Materials and Methods

2.1. Materials

In this study, the authors investigated the changes in the surface state of PS microspheres when Ca2+ ions were introduced by immersion in a CaCl2 solution. Additionally, to examine the influence of surface functional groups on Ca2+ ion introduction, experiments were conducted using 6 types of PS microspheres with different surface functional groups. The surface functional groups of the 6 types of PS microspheres used in this study, their characteristics, and their abbreviations are listed in Table 1.

2.2. Immersion of PS Microspheres in Calcium Chloride (CaCl2) Solution

First, 110.98 g of CaCl2 (Hayashi Pure Chemical, Osaka, Japan) was gradually added to 1000 mL of ultrapure water to prepare a 1 mmol mL−1 CaCl2 solution (pH = 9.2–9.4, 36.5 °C). Next, 20 mg of each of the 6 types of PS microspheres with 2.0 µm in average diameter (micromod, Rostock, Germany) with different surface functional groups listed in Table 1 were added to 50 mL of CaCl2 solution and sonicated for 10 min. This mixed solution was placed in a screw vial and shaken for 1 day using a rotary shaker in an incubator at 36.5 °C. The PS microspheres were collected by suction filtration through a nitrocellulose membrane filter with a pore size of 0.8 µm (Merck, Darmstadt, Germany). From here on, the PS microspheres collected by suction filtration after immersion in CaCl2 solution will be referred to as “Ca2+-PS microspheres.”

2.3. Preparation of 1.5m-SBF

In this study, the following reagents were dissolved in ultrapure water (1000 mL) to obtain the 1.5m-SBF concentrations listed in Table 2. The 1.5m-SBF is a solution with the same ion concentrations of Ca2+, HPO42−, and Mg2+ as 1.5 SBF, which is an aqueous solution with 1.5 times the inorganic ion concentration of human blood plasma [16]. The pH of the 1.5m-SBF was adjusted to 7.25, 36.5 °C by gradually adding (CH2OH)3CNH2 (Hayashi Pure Chemical, Osaka, Japan). This pH condition was the same as 1.5SBF, with 1.5 times the ion concentration of normal SBF, as reported by Abe et al. [16].
  • K2HPO4 3H2O (Nacalai Tesque, Kyoto, Japan) 0.342 g;
  • MgCl2 6H2O (Hayashi Pure Chemical, Osaka, Japan) 0.458 g;
  • 1 mmol mL−1 HCl (Hayashi Pure Chemical, Osaka, Japan) 52.5 mL;
  • CaCl2 (Hayashi Pure Chemical, Osaka, Japan) 0.417 g.

2.4. Analysis of the Ca2+-PS Microspheres

The Ca2+-PS microspheres were observed using a scanning electron microscope (SEM; SU6600, Hitachi High-Tech, Tokyo, Japan) at a 20 kV acceleration voltage, an energy dispersive X-ray analyzer (EDX; XFlash® 5010, Bruker, Billerica, MA, USA) at a 20 kV acceleration voltage and an X-ray photoelectron spectrometer (XPS; JPS-9030, JEOL, Tokyo, Japan) at 12 kV, 10 mA tube voltage and current with MgKα radiation using a neutralizing gun (JEOL, Tokyo, Japan). The surface potential in a 1.5m-SBF was measured using a zeta potential and particle size analyzer (ELS-80HZ, Otsuka Electronics, Hirakata, Osaka, Japan). The samples were gold-sputtered during SEM and EDX analyses before observation and analysis.

2.5. Formation of PS/Apatite Core–Shell Microspheres by 1.5m-SBF Immersion

The Ca2+-PS microspheres obtained in the experimental procedure of Section 2.2 were added to 1.5m-SBF adjusted to pH 7.25 at 36.5 °C and sonicated for 1 min to disperse the microspheres in the solution. This mixed solution was placed in a screw vial and shaken for 3 days in an incubator at 36.5 °C using a rotary shaker to obtain PS/apatite core–shell microspheres. The obtained microspheres were collected by suction filtration through a nitrocellulose membrane filter with a pore size of 0.8 µm (Merck, Darmstadt, Germany), washed with distilled water, and dried at 36.5 °C.

2.6. Characterization of the PS/Apatite Core–Shell Microspheres

The obtained microspheres were analyzed using a Fourier transform infrared spectrophotometer (FT-IR; FT/IR-4700, JASCO, Tokyo, Japan) with the diamond attenuated total reflection method and powder X-ray diffraction (XRD; Ultima IV, Rigaku, Tokyo, Japan) at 40 kV and 40 mA tube voltage and current with CuKα radiation, SEM, EDX, and transmission electron microscopy (TEM; JEM-2200FS, JEOL, Tokyo, Japan) at an acceleration voltage of 200 kV. During SEM observation and EDX analysis, the samples were gold-sputtered before observation and analysis. In addition, the thickness of the apatite film was evaluated using ImageJ version 1.53a [17,18], based on TEM images.

3. Results and Discussion

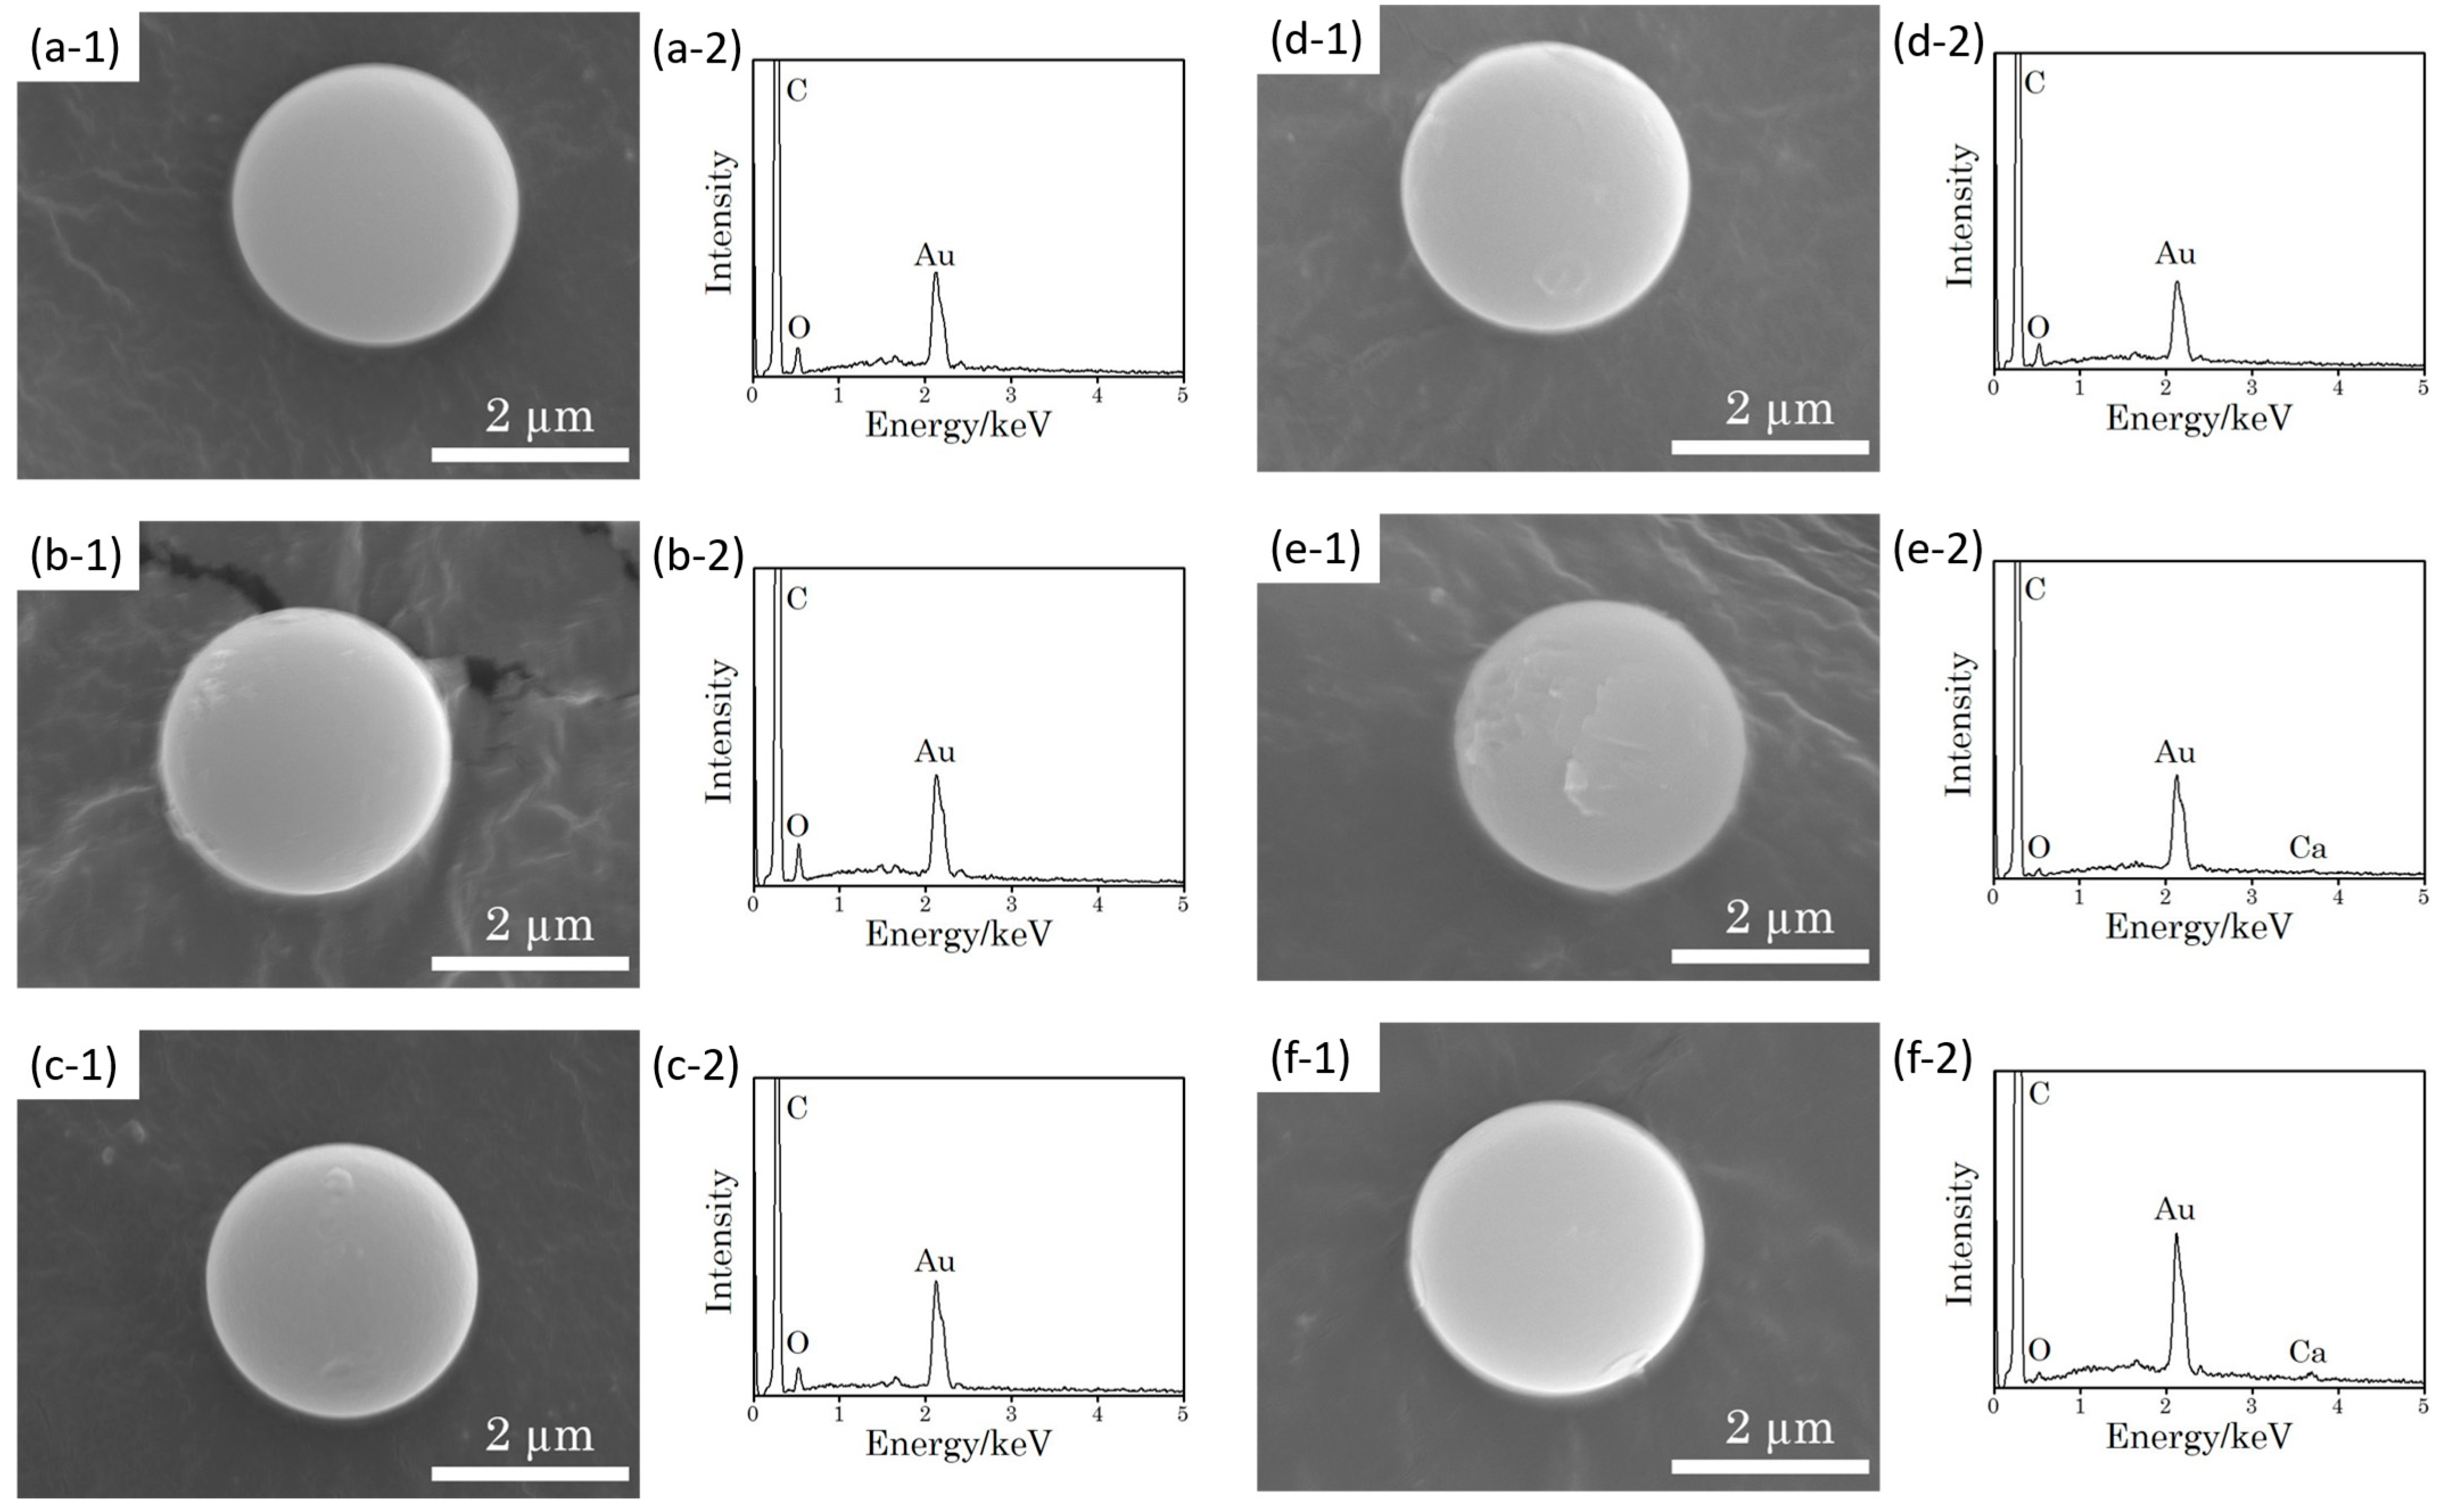
3.1. SEM Observation and EDX Analysis of the Ca2+-PS Microspheres

Figure 1 shows the SEM images and EDX profiles of six types of untreated PS microspheres, and Figure 2 shows those of Ca2+-PS microspheres. As shown in Figure 1, all PS microspheres were spherical particles with a diameter of approximately 2 µm, and analysis of the surface elements using EDX detected only peaks for C, O, and Au. As shown in Figure 2, no change in the particle diameter and surface morphology of the PS microspheres was observed, even after immersion in CaCl2 solution. However, EDX analysis of the surface elements detected weak peaks for Ca on the PEG and Alkyl-OH samples.

3.2. Surface Potential Measuremtnt of PS Microspheres

Six types of untreated PS microspheres and Ca2+-PS microspheres were soaked in 1.5m-SBF at a concentration of Section 2.3, and the surface potential of each PS microsphere in 1.5m-SBF was measured using a zeta potential and particle size analyzer. The results are shown in Figure 3. Student’s t-test was performed as a significant difference test. From Figure 3, it can be seen that the surface potential values changed significantly in the positive direction when immersed in the CaCl2 solution for the NH2, COOH, PEG, and Alkyl-OH samples, and the significance test showed a significant difference compared with before immersion in the CaCl2 solution. In contrast, in the normal and NR3+ samples, almost no changes in the surface potential were observed before and after immersion in CaCl2 solution, and the significance test also showed no significant difference. As the reason for the changes in zeta potential, it was speculated that the surface functional groups of the NH2, COOH, PEG, and Alkyl-OH samples were bound to Ca2+ ions in the CaCl2 solution through electrostatic interactions and therefore showed a more positive surface potential than the untreated samples. In addition, it is thought that the EDX analyses shown in Figure 2 possess notable limitations to precisely evaluate Ca2+ adsorption because the amount of adsorbed Ca2+ should be quite minute, that is, near the detection limit of EDX. As shown in Figure 2, NH2 and COOH did not produce Ca peaks; nevertheless, the zeta potential changed positively. To clarify Ca2+ adsorption in detail, XPS analysis was performed to verify this mechanism, as described in the next section.

3.3. XPS Measurement of PS Microspheres

Using XPS, the authors evaluated the changes in the peaks derived from Ca2p before and after immersion in CaCl2 solution for the six types of PS microspheres. The results are shown in Figure 4. For both the normal and NR3+ samples, no peaks derived from Ca2p were observed before or after immersion in the CaCl2 solution. In contrast, for the NH2, COOH, PEG, and Alkyl-OH samples, peaks derived from Ca2p were clearly observed after immersion in the CaCl2 solution. From these results, it was found that when the PS microspheres modified with each functional group were immersed in the CaCl2 solution, Ca2+ binding occurred because of the affinity for Ca2+ ions in the NH2, COOH, PEG, and Alkyl-OH samples but not in the normal and NR3+ samples. These results are almost consistent with the changes in the surface potential of the PS microspheres before and after immersion in CaCl2 solution, as shown in Figure 3. In other words, the positive change in surface potential observed in the NH2, COOH, PEG, and Alkyl-OH samples was once again suggested to be due to the binding of Ca2+ ions. This XPS result was partially in contrast with the EDX results shown in Figure 2; that is, Ca peaks were detected on NH2 and COOH in XPS, but not in EDX. This is considered to be because the reliability of EDX is relatively lower than that of XPS because of the larger detection limit in EDX than in XPS. In addition, NH2 and COOH showed larger relative intensities of Ca2p than PEG and Alkyl-OH. Although the authors could not obtain data to clarify this reason in this study, it is thought that such a difference might be related to the different states of Ca on these samples.
Chen et al. reported a study in which they introduced Ca2+ ions into poly(lactic acid) microspheres by immersing them in Ca(NO3)2 solution, and then formed apatite on the surface of the poly(lactic acid) microspheres by immersing them in K2HPO4 solution [19]. According to Chen et al. [19], unmodified poly(lactic acid) does not interact with Ca2+ ions in the Ca(NO3)2 solution, but when NH2 groups are introduced to the surface of poly(lactic acid), these NH2 groups interact with Ca2+ ions, and Ca2+ ions are introduced to the poly(lactic acid) surface. Based on the findings of Chen et al., Ca2+ ions were introduced to the surface of NH2-PS microspheres in a 1 mmol mL−1 CaCl2 solution by a similar mechanism.
In addition, Tanahashi et al. reported the effects of the surface functional groups of various self-assembled monolayers in SBF [20]. According to Tanahashi et al., monolayers with COOH or OH groups arranged on them exhibit preferential electrostatic interactions with Ca2+ ions. Based on this finding, it is estimated that the COOH-PS microspheres, PEG-PS microspheres, and Alkyl-OH-PS microspheres, which have COOH and OH groups, respectively, show similar interactions with Ca2+ ions in a 1 mmol mL−1 CaCl2 solution. On the other hand, Tanahashi et al. reported that monolayers with NH2 groups showed a higher affinity for PO43− ions than for Ca2+ ions in SBF. This is probably because the PO43− ions show a higher affinity in the presence of both Ca2+ and PO43− ions, as in the SBF. Because PO43− ions were not present in the CaCl2 solution used in this study, it is thought that the results obtained for the affinity of Ca2+ ions with NH2 groups are similar to those of Chen et al.

3.4. FT-IR Measurement After 1.5m-SBF Immersion

Figure 5 shows the FT-IR profiles of six types of untreated PS microspheres and PS microspheres immersed in CaCl2 solution and then immersed in 1.5m-SBF for 3 days. From Figure 5, it can be seen that in all six types of untreated PS microspheres, peaks that can be attributed to the aromatic groups of PS were observed at approximately 540 cm−1, 700 cm−1, and 760 cm−1. From Figure 5a,b, in both the normal and NR3+ samples, only the peaks attributed to the aromatic groups of PS were observed in the FT-IR profiles after immersion in 1.5m-SBF, and no new peaks were observed. On the other hand, in Figure 5c–f, it can be seen that the intensity of the peaks attributed to the aromatic groups of PS decreased in the NH2, COOH, PEG, and Alkyl-OH samples, and new peaks attributed to the phosphate groups were observed at approximately 560 cm−1, 600 cm−1, 1020 cm−1, and 1120 cm−1. From these results, it was found that phosphates were formed on the NH2, COOH, PEG, and Alkyl-OH samples by immersing them in CaCl2 solution and then in 1.5m-SBF. In addition, the NH2, COOH, PEG, and Alkyl-OH samples in which phosphate formation was confirmed were consistent with those in which Ca2+ introduction was successful, as shown in Section 3.3.

3.5. X-Ray Diffraction Measurement After 1.5m-SBF Immersion

Figure 6 shows the powder XRD profiles of six types of untreated PS microspheres and PS microspheres immersed in CaCl2 solution and then immersed in 1.5m-SBF for 3 days. In all untreated PS microspheres, a broad peak derived from PS was detected in the range of 15–30°. On the other hand, in the XRD profiles of the PS microspheres immersed in CaCl2 solution and then immersed in 1.5m-SBF for 3 days, there were almost no changes in the XRD profiles of the Normal and NR3+ samples compared to the untreated XRD profiles. In contrast, for the NH2, COOH, PEG, and Alkyl-OH samples, there was a decrease in the intensity of the broad peaks derived from the PS microspheres, and new apatite peaks were detected. This indicates that apatite formed on the surface of the PS microspheres in the NH2, COOH, PEG, and Alkyl-OH samples after immersion in the CaCl2 solution and then immersed in 1.5m-SBF. The samples in which apatite peaks were observed were also consistent with those in which Ca2+ ion introduction was successful, as discussed in Section 3.3.

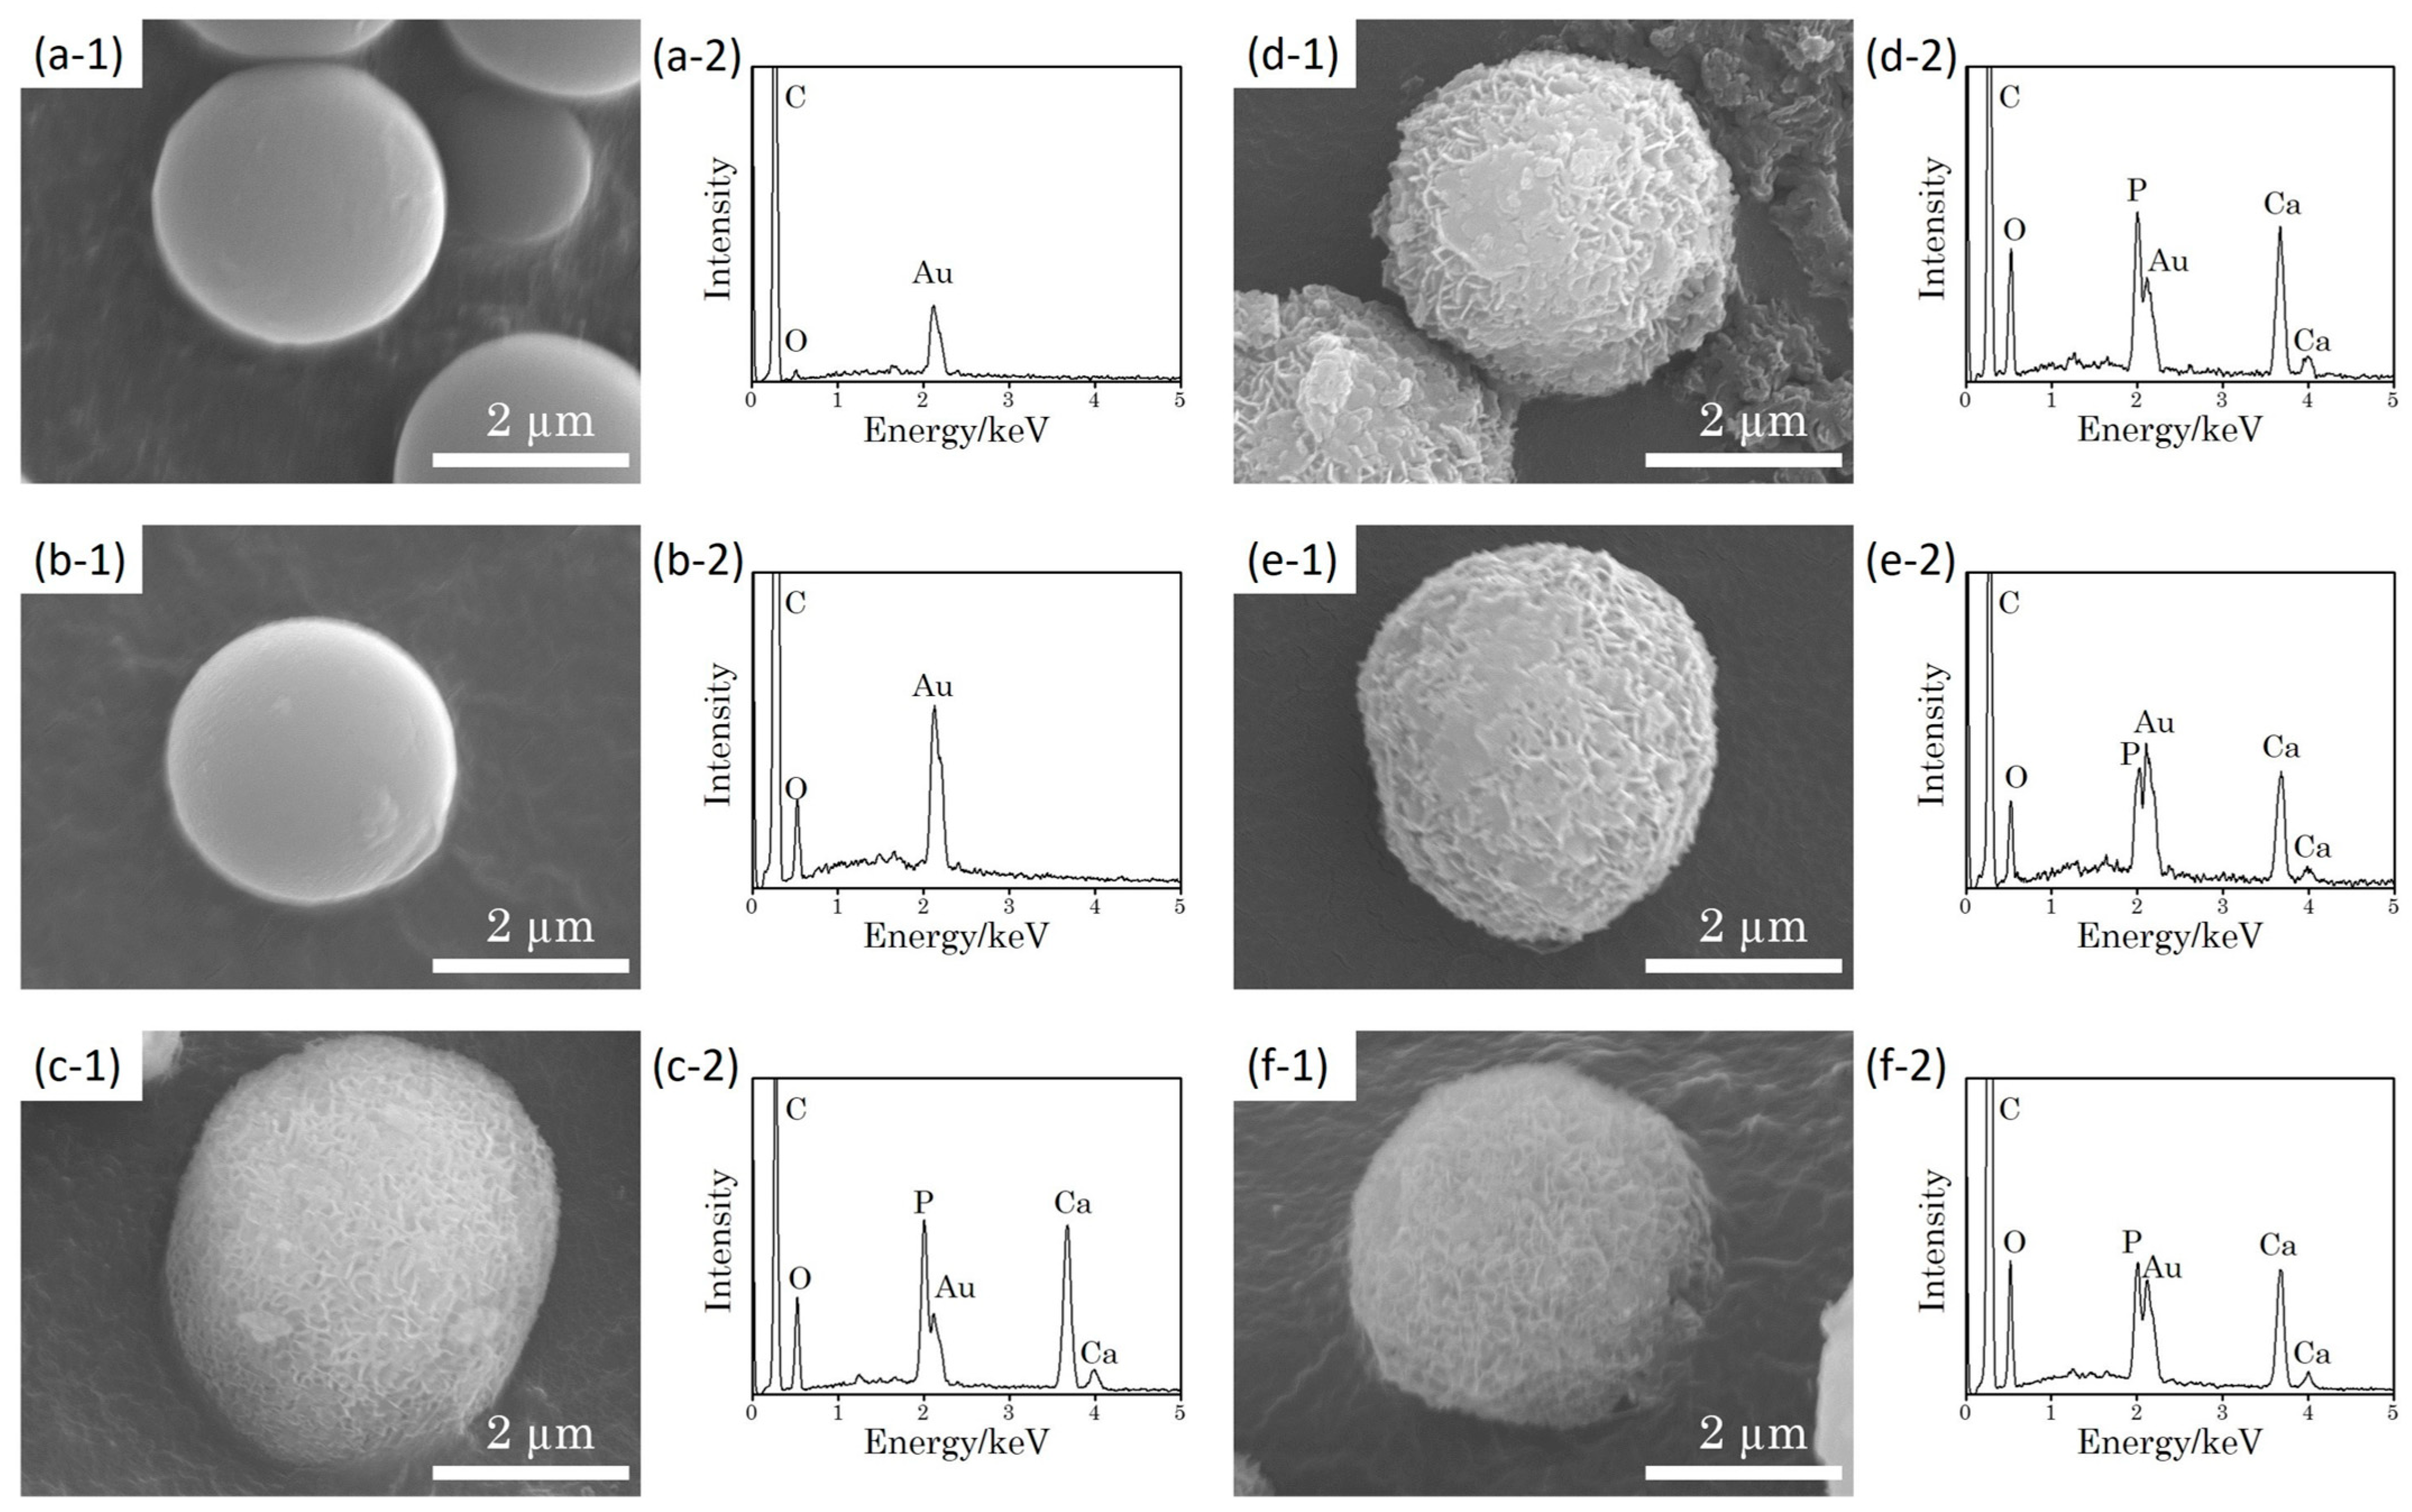
3.6. SEM Observation and EDX Analysis After 1.5m-SBF Immersion

Figure 7 shows the SEM images and EDX profiles of the six types of PS microspheres immersed in the CaCl2 solution and 1.5m-SBF for 3 days. Compared to the SEM images and EDX profiles of the untreated PS microspheres shown in Figure 1, there were almost no changes in the surface morphology or surface constituent elements of the normal and NR3+ samples. In contrast, in the NH2, COOH, PEG, and Alkyl-OH samples, the PS microspheres were completely covered with a thin film consisting of apatite flake-like crystals. In addition, these samples showed Ca and P peaks, which are the main components of apatite, on the surface of the PS microspheres.
From these results, it is thought that PS microspheres with Ca2+ ions introduced onto their surfaces by immersion in CaCl2 solution were immersed in 1.5m-SBF, causing the Ca2+ ions near the PS microsphere surfaces to become supersaturated with respect to apatite, and apatite formed on the PS microsphere surfaces, covering the entire PS microsphere.
Tanahashi et al. reported that the ability of self-assembled monolayers with each surface functional group to form apatite in SBF is in the order shown in Equation (1) [20].
COOH >> OH > NH2 >> CH3
According to Tanahashi et al. [20], apatite formation on monolayers with negatively charged surface functional groups progresses through complexation of Ca2+ ions with negatively charged surface functional groups, followed by complexation with phosphate ions. They also reported that monolayers with NH2 groups on the surface interacted with PO43− ions in SBF, but hardly induced apatite formation [20].
In this study, NH2 formed PS/apatite core–shell microspheres because, as described in Section 3.3, Ca2+ ions were introduced into the surface functional groups by immersion in CaCl2 solution before immersion in 1.5m-SBF, and complex formation occurred between the Ca2+ ions bound to the surface functional groups and the phosphate ions in the 1.5m-SBF.

3.7. TEM Observation and Film Thickness Evaluation After 1.5m-SBF Immersion

The particle characteristics of the three samples, normal (which had a surface potential value of approximately 0 after immersion in CaCl2 solution), COOH (which was the most negatively charged), and Alkyl-OH (which was moderately charged), were observed using TEM after immersion in 1.5m-SBF for 3 days. The results are shown in Figure 8.
As shown in Figure 8a, almost no apatite formation was observed in the normal sample. In addition, from Figure 8b,c-1, it can be seen that PS/apatite core–shell microspheres coated with flake-like apatite crystals were observed on the surface of the Alkyl-OH and COOH samples. The high-magnification TEM image in Figure 8c-2 shows that the apatite film coating the surface of the PS microspheres was formed by a dense arrangement of flake-like crystals. This finding and the SEM results indicated that the obtained microspheres possessed a core–shell structure consisting of apatite shells and PS cores.
In addition, the thickness of the apatite film coating the PS microspheres was evaluated using ImageJ, based on the TEM images obtained by transmitting the interface between the internal PS microspheres and apatite film. The average thickness of the apatite film coating the COOH-PS microspheres was 392.4 ± 136.9 nm (n= 20), and the thickness of the apatite film coating the Alkyl-OH-PS microspheres was 378.3 ± 183.4 nm (n = 15). On the other hand, there was variation in the thickness of the apatite film depending on the sample; PS/apatite core–shell microspheres with a thickness of approximately 700 nm and PS/apatite core–shell microspheres with a thickness of approximately 200 nm were also observed. As shown in these findings, although an apatite shell at the submicron level was obtained, it was also recognized that the thickness exhibited high standard deviations, indicating considerable variation. It is speculated that this might be because Ca2+ was distributed nonuniformly on the surface of each PS microsphere in the CaCl2 solution process.
The authors acknowledge the several limitations of this study. First, although the authors proposed electrostatic interactions as the driver for Ca2+ adsorption on the PS microspheres, they could not quantify the binding affinity or explore covalent modification strategies. Second, the authors use 1.5m-SBF for forming apatite shells instead of a normal SBF. Because the use of 1.5m-SBF does not replicate physiological conditions, potentially overstimulating apatite formation in vivo, the formed apatite may be largely different in crystal properties in comparison with apatite in living bone. To obtain apatite capsules with higher biocompatibility, investigation of milder preparation conditions similar to physiological conditions is required. Third, the core–shell structures of NH2 and PEG were not clarified using TEM. In this study, the authors carried out a TEM study of normal, COOH, and alkyl-OH groups, focusing on the differences in surface potential after CaCl2 treatment. By investigating other types of PS microspheres using TEM, it is expected that stronger backing will be provided for the findings presented in this paper. Fourth, the authors did not evaluate the in vitro cytotoxicity or long-term stability of the core–shell structures. These points are clarified in the next step.

4. Conclusions

In this study, the authors fabricated PS/apatite core–shell microspheres containing solid microspheres and investigated the relationship between surface functional groups, surface potential, Ca2+ adsorption, and apatite formation. The authors prepared Ca2+-introduced PS microspheres by introducing Ca2+ ions onto the surfaces of six types of PS microspheres with different surface functional groups. In the samples modified with NH2, COOH, PEG, and Alkyl-OH groups, Ca2+ ions were introduced into the surface functional groups by electrostatic interactions by immersing them in a 1 mmol mL−1 CaCl2 solution. By immersing the Ca2+-introduced PS microspheres in 1.5m-SBF, apatite formed on the surface of the PS microspheres, grew on the surface of the PS microspheres, and coated the entire PS microspheres. The method used in this study to fabricate organic polymer/apatite core–shell microspheres is expected to have a wide range of applications in the medical field as drug delivery carriers.

Author Contributions

Conceptualization, T.Y.; methodology, T.Y. and K.N.; validation, T.Y., K.N. and S.T.; formal analysis, K.N.; investigation, K.N.; resources, T.Y.; data curation, T.Y. and K.N.; writing—original draft preparation, T.Y.; writing—review and editing, K.N. and S.T.; visualization, T.Y. and K.N.; supervision, T.Y.; project administration, T.Y.; funding acquisition, T.Y. All authors have read and agreed to the published version of the manuscript.

Funding

This research was funded by Nippon Sheet Glass Foundation for Materials Science and Engineering, The Kazuchika Okura Memorial Foundation, and Joint Usage/Research Program on Zero-Emission Energy Research, Institute of Advanced Energy, Kyoto University 2025B-01.

Data Availability Statement

The original contributions presented in the study are included in the article; further inquiries can be directed to the corresponding authors.

Conflicts of Interest

The authors declare no conflicts of interest.

References

  1. Jarcho, M.J.; Kay, J.F.; Gumaer, K.I.; Doremus, R.H.; Drobeck, H.P. Tissue, cellular and subcellular events at bone-ceramic hydroxyapatite interface. J. Bioeng. 1977, 1, 79–92. [Google Scholar] [PubMed]
  2. LeGeros, R.Z.; LeGeros, J.P. Hydroxyapatites. In An Introduction to Bioceramics, 2nd ed.; Hench, L.L., Ed.; Imperial College Press: London, UK, 2013; pp. 229–277. [Google Scholar]
  3. LeGeros, R.Z.; LeGeros, J.P. Hydroxyapatite. In Bioceramics and Their Clinical Applications; Kokubo, T., Ed.; Woodhead Publishing: Cambridge, UK, 2008; pp. 367–394. [Google Scholar]
  4. Oonishi, H.; Oonishi, H., Jr.; Kim, S.C. Clinical application of hydroxyapatite. In Bioceramics and Their Clinical Applications; Kokubo, T., Ed.; Woodhead Publishing: Cambridge, UK, 2008; pp. 606–687. [Google Scholar]
  5. Deligianni, D.D.; Katsala, N.D.; Koutsoukos, P.G.; Missirlis, Y.F. Effect of surface roughness of hydroxyapatite on human bone marrow cell adhesion, proliferation, differentiation and detachment strength. Biomaterials 2001, 22, 87–96. [Google Scholar] [CrossRef] [PubMed]
  6. Rizzi, S.C.; Heath, D.J.; Coombes, A.G.A.; Bock, N.; Textor, M.; Downes, S. Biodegradable polymer/hydroxyapatite composites: Surface analysis and initial attachment of human osteoblasts. J. Biomed. Mater. Res. 2001, 55, 475–486. [Google Scholar] [CrossRef] [PubMed]
  7. Jarcho, M. Calcium phosphate ceramics as hard tissue prosthetics. Clin. Orthop. Relat. Res. 1981, 157, 259–278. [Google Scholar] [CrossRef]
  8. Tiselius, A.; Hjerten, S.; Levin, O. Protein chromatography on calcium phosphate columns. Arch. Biochem. Biophys. 1956, 65, 132–155. [Google Scholar] [CrossRef] [PubMed]
  9. Liua, X.; Okada, M.; Maeda, H.; Fujii, S.; Furuzono, T. Hydroxyapatite/biodegradable poly(L-lactide–co-e-caprolactone) composite microparticles as injectable scaffolds by a Pickering emulsion route. Acta Biomater. 2011, 7, 821–828. [Google Scholar] [CrossRef] [PubMed]
  10. Suzuki, S.; Lee, S.; Miyajima, T.; Kato, K.; Sugawara-Narutaki, A.; Sakurai, M.; Nagata, F. Evaluation of Drug-Loading Ability of Poly(Lactic Acid)/Hydroxyapatite Core–Shell Particles. Materials 2021, 14, 1959. [Google Scholar] [CrossRef] [PubMed]
  11. Komatsu, S. Creation of carbonate apatite particles with drug treatable bone reproduction ability for bone defects treatment. Impact 2022, 2022, 51–53. [Google Scholar] [CrossRef]
  12. Tang, I.-M.; Krishnamra, N.; Charoenphandhu, N.; Hoonsawat, R.; Pon-On, W. Biomagnetic of Apatite-Coated Cobalt Ferrite: A Core–Shell Particle for Protein Adsorption and pH-Controlled Release. Nanoscale Res. Lett. 2011, 6, 19. [Google Scholar] [CrossRef] [PubMed]
  13. Kokubo, T.; Takadama, H. How useful is SBF in predicting in vivo bone bioactivity? Biomaterials 2006, 27, 2907–2915. [Google Scholar] [CrossRef] [PubMed]
  14. Yao, T.; Hibino, M.; Yamaguchi, S.; Okada, H. Method for Stabilizing Calcium Phosphate Fine Particles, Process for Production of Calcium Phosphate Fine Particles by Utilizing the Method, and Use Thereof. U.S. Patent 8178066, 2012. [Google Scholar]
  15. Matsunaga, T.; Yabutsuka, T.; Takai, S.; Yao, T. Fabrication of Hydroxyapatite Microcapsules for Controlled Release of Hydrophobic Drug. Key Eng. Mater. 2016, 720, 12–16. [Google Scholar] [CrossRef]
  16. Abe, Y.; Kokubo, T.; Yamamuro, T. Apatite coating on ceramics, metals and polymers utilizing a biological process. J. Mater. Sci. Mater. Med. 1990, 1, 233–238. [Google Scholar] [CrossRef]
  17. Rasband, W.S. ImageJ, U.S. National Institutes of Health, Bethesda, M.D. Available online: https://imagej.net/ij/ (accessed on 23 June 2025).
  18. Schneider, C.A.; Rasband, W.S.; Eliceiri, K.W. NIH Image to ImageJ: 25 years of image analysis. Nat. Methods 2012, 9, 671–675. [Google Scholar] [CrossRef] [PubMed]
  19. Chen, S.; Cuo, R.; Xie, C.; Liang, Q.; Xiao, X. Biomimetic mineralization of nanocrystalline hydroxyapatites on aminated modified polylactic acid microspheres to develop a novel drug delivery system for alendronate. Mater. Sci. Eng. C 2020, 110, 110655. [Google Scholar] [CrossRef] [PubMed]
  20. Tanahashi, M.; Matsuda, T. Surface functional group dependence on apatite formation on self-assembled monolayers in a simulated body fluid. J. Biomed. Mater. Res. 1997, 34, 305–315. [Google Scholar] [CrossRef]
Figure 1. (a) Normal, (b) NR3+, (c) NH2, (d) COOH, (e) PEG, and (f) Alkyl-OH: (1) SEM images and (2) EDX profiles of six types of PS microspheres before treatment.
Jcs 09 00323 g001
Figure 2. Six types of PS microspheres ((a) normal, (b) NR3+, (c) NH2, (d) COOH, (e) PEG and (f) Alkyl-OH) after immersion in CaCl2 solution: (1) SEM image and (2) EDX profile.
Jcs 09 00323 g002
Figure 3. Surface potentials in 1.5m-SBF of the six types of PS microspheres before and after immersion in the CaCl2 solution. ‘**’ is p < 0.01, ‘*’ is p < 0.05, and ‘n.s.’ is p ≥ 0.05 in Student’s t-test.
Jcs 09 00323 g003
Figure 4. Changes in XPS peaks originating from Ca2p in six types of PS microspheres before and after immersion in CaCl2 solution ((a) normal, (b) NR3+, (c) NH2, (d) COOH, (e) PEG and (f) Alkyl-OH).
Jcs 09 00323 g004
Figure 5. FT-IR profiles of six types of PS microspheres ((a) normal, (b) NR3+, (c) NH2, (d) COOH, (e) PEG and (f) Alkyl-OH) before treatment (black lines) and after 1.5m-SBF immersion (red lines).
Jcs 09 00323 g005
Figure 6. XRD profiles of six types of PS microspheres ((a) Normal, (b) NR3+, (c) NH2, (d) COOH, (e) PEG and (f) Alkyl-OH) before treatment (black lines) and after 1.5m-SBF immersion (red lines). Each index of the diffraction patterns corresponds to the diffraction index attributed to hydroxyapatite, as specified in JCPDS 24-0033.
Jcs 09 00323 g006
Figure 7. (1) SEM image and (2) EDX profile of six types of PS microspheres ((a) normal, (b) NR3+, (c) NH2, (d) COOH, (e) PEG, and(f) Alkyl-OH) after immersion in 1.5m-SBF.
Jcs 09 00323 g007
Figure 8. TEM images of (a) normal, (b) Alkyl-OH, (c-1) COOH at low magnification, and (c-2) COOH at high magnification after 1.5m-SBF immersion.
Jcs 09 00323 g008
Table 1. Surface functional groups, characteristics, and abbreviations of 6 types of PS microspheres.
Surface Functional GroupsCharacteristicsAbbreviation
NoneParticles without any coating or special functional groups added to the particle surfaceNormal
N(CH3)3+Particles with a positive zeta potentialNR3+
NH2Particles stable in aqueous mediaNH2
COOHParticles stable in aqueous mediaCOOH
Polyethylene glycolHydrophilic particlesPEG
Alkyl-OHHydrophilic particlesAlkyl-OH
Table 2. Ion concentrations in blood plasma, 1.5SBF and 1.5m-SBF.
Ion Concentration/μmol mL−1
Blood Plasma1.5SBF1.5m-SBF
Na+142.0213.00.0
K+5.07.53.0
Ca2+2.53.83.8
Mg2+1.52.32.3
Cl103.0221.712.0
HCO327.06.30.0
HPO42−1.01.51.5
SO42−0.50.80.0
Disclaimer/Publisher’s Note: The statements, opinions and data contained in all publications are solely those of the individual author(s) and contributor(s) and not of MDPI and/or the editor(s). MDPI and/or the editor(s) disclaim responsibility for any injury to people or property resulting from any ideas, methods, instructions or products referred to in the content.

