Article

Uniaxial Compressive Stress–Strain Model for Bauxite Residue Concrete

by
Yassine Brahami
1,*,
Mathieu Fiset
1,
Ali Saeidi
1,
Kadiata Ba
1 and
Rama Vara Prasad Chavali
2
1
Department of Applied Science, Université de Québec a Chicoutimi, Chicoutimi, QC G7H 2B1, Canada
2
Department of Civil Engineering, Siddhartha Academy of Higher Education Deemed to be University, Vijayawada 520007, India
*
Author to whom correspondence should be addressed.
J. Compos. Sci. 2025, 9(7), 318; https://doi.org/10.3390/jcs9070318
Submission received: 5 April 2025 / Revised: 19 June 2025 / Accepted: 19 June 2025 / Published: 23 June 2025
(This article belongs to the Special Issue Novel Cement and Concrete Materials)

Abstract

This paper investigates the full stress–strain response of bauxite residue concrete under uniaxial compression and presents an adapted constitutive model. This study investigates the stress–strain behavior in a series of uniaxial compression experiments and compares to the Popovics, Thorenfeldt et al. and Hoshikuma et al. model predictions. All models accurately predict the pre-peak behavior, showing a very acceptable error rate; however, none of these models adequately predict the post-peak response. A new post-peak stress–strain model is therefore developed in this paper for bauxite residue concrete. The proposed model predictions agreed well with the experimental measurements obtained in this paper for post-peak stress–strain of bauxite residue concrete.

1. Introduction

Over the last few decades, new energy and environmental requirements and needs have required different economic sectors, in particular the construction industry, to investigate means of reducing energy and the use of virgin materials. Reusing industrial waste, such as bauxite residues, to produce concrete and mortar is one example and provides a more environmentally friendly solution. Bauxite residue (BR), commonly known as “red mud,” is an industrial waste generated during the production of alumina. Its chemical composition varies greatly depending on the origin of the bauxite and the aluminum production site. Its composition also depends on the industrial process used to treat the sludge (for pH neutralization). Several works have been published on the use of bauxite residue in portland cement concrete (BRC) [1,2,3,4,5,6,7,8,9]. Many studies have investigated BRC and found that BR affects the properties and behavior of fresh and hardened concrete, such as workability, tensile and compressive strength, and the stress–strain response. No studies, to the best of the authors’ knowledge, have yet to investigate the relationship between BR quantity and BRC strength and behavior under uniaxial compression.
The strength ( f c ) and the stress–strain relationship ( f c i , ε c i ) of unconfined concrete under uniaxial compression are the most used properties for the design and analysis of reinforced concrete structural elements [10,11,12] In engineering, knowledge of the complete stress–strain relationship is required to determine, for example, the deflection, ductility, and prestressing loss of members resisting compressive stress, such as reinforced or prestressed concrete beams, columns, foundations and arches [13]. The stress–strain response of concrete is also a fundamental property for modeling and simulating concrete structure behavior as well as for design purposes.
Several stress–strain response models for concrete under various stress states have been developed for typical portland cement concrete. These constitutive models are typically based on elasticity, plasticity, and stress of failure. Some as well-known models based on plasticity and failure stress have been developed for typical portland cement concrete not containing recycled materials such as BR [14,15,16]. These models are used by engineers for design and are commonly included in finite-element analyses. In the structural concrete stress–strain response to compression, the ascending (pre-peak) and descending (post-peak) branches of this relationship typically depend on the concrete mix composition and cure (e.g., water/cement ratio, mechanical and physical properties of the constituents, type of curing, and the age of the concrete at the time of testing) and the test conditions (e.g., reliability of the instruments, the shape and size of the specimen, the strain rate, and the type of strain gauge) [17,18]. Several studies have assessed the effect of gravel size and shape on concrete behavior [19,20,21,22] and found a significant effect on the stress–strain response. In [23] found that the size effect in compression, i.e., how the diameter of the tested specimen affects compressive strength [24], was noticeably more important for light weight concrete than normal lightweight concrete. In [25] developed a stress–strain behavior model to account for the effect of concrete size on the descending (post-peak) branch using a function of the strain dissipated by the shear band, including the failure energy. The compressive strength and stress–strain response of concrete are strongly affected by the stiffness and roughness of the aggregates, which improve the anchorage of the binder, i.e., cement paste for conventional concrete, as well as the binder matrix density, strength, and stiffness [26]. Replacing concrete mixture components, such as cement and aggregates, with recycled materials significantly affects the properties and behavior of concrete [3].
Recent studies have examined the potential of bauxite residue (BR) in concrete applications. For example, [27] demonstrated the feasibility of using BR as fine aggregate in structural concrete [28] provided a comprehensive review of BR as a binder and its effects on mechanical properties of composites [29] analyzed strength, shrinkage, and abrasion behavior of alkali-activated slag concrete incorporating BR [30] evaluated mechanical properties of concrete containing liquefied red mud under uniaxial compression. These works support the motivation to further develop models capturing the behavior of BRC under load.
The objective of this study is to examine the uniaxial compressive behavior of BRC and propose a simple and practical stress–strain model for several BR replacement ratios. This study applies the basic stress–strain model of Popovics [16] to determine key parameters of the pre- and post-peak behavior. This study includes bauxite residue replacement ratios into the model and assesses the model’s accuracy using a normalized square root mean error between the predicted curves and the experimental results.

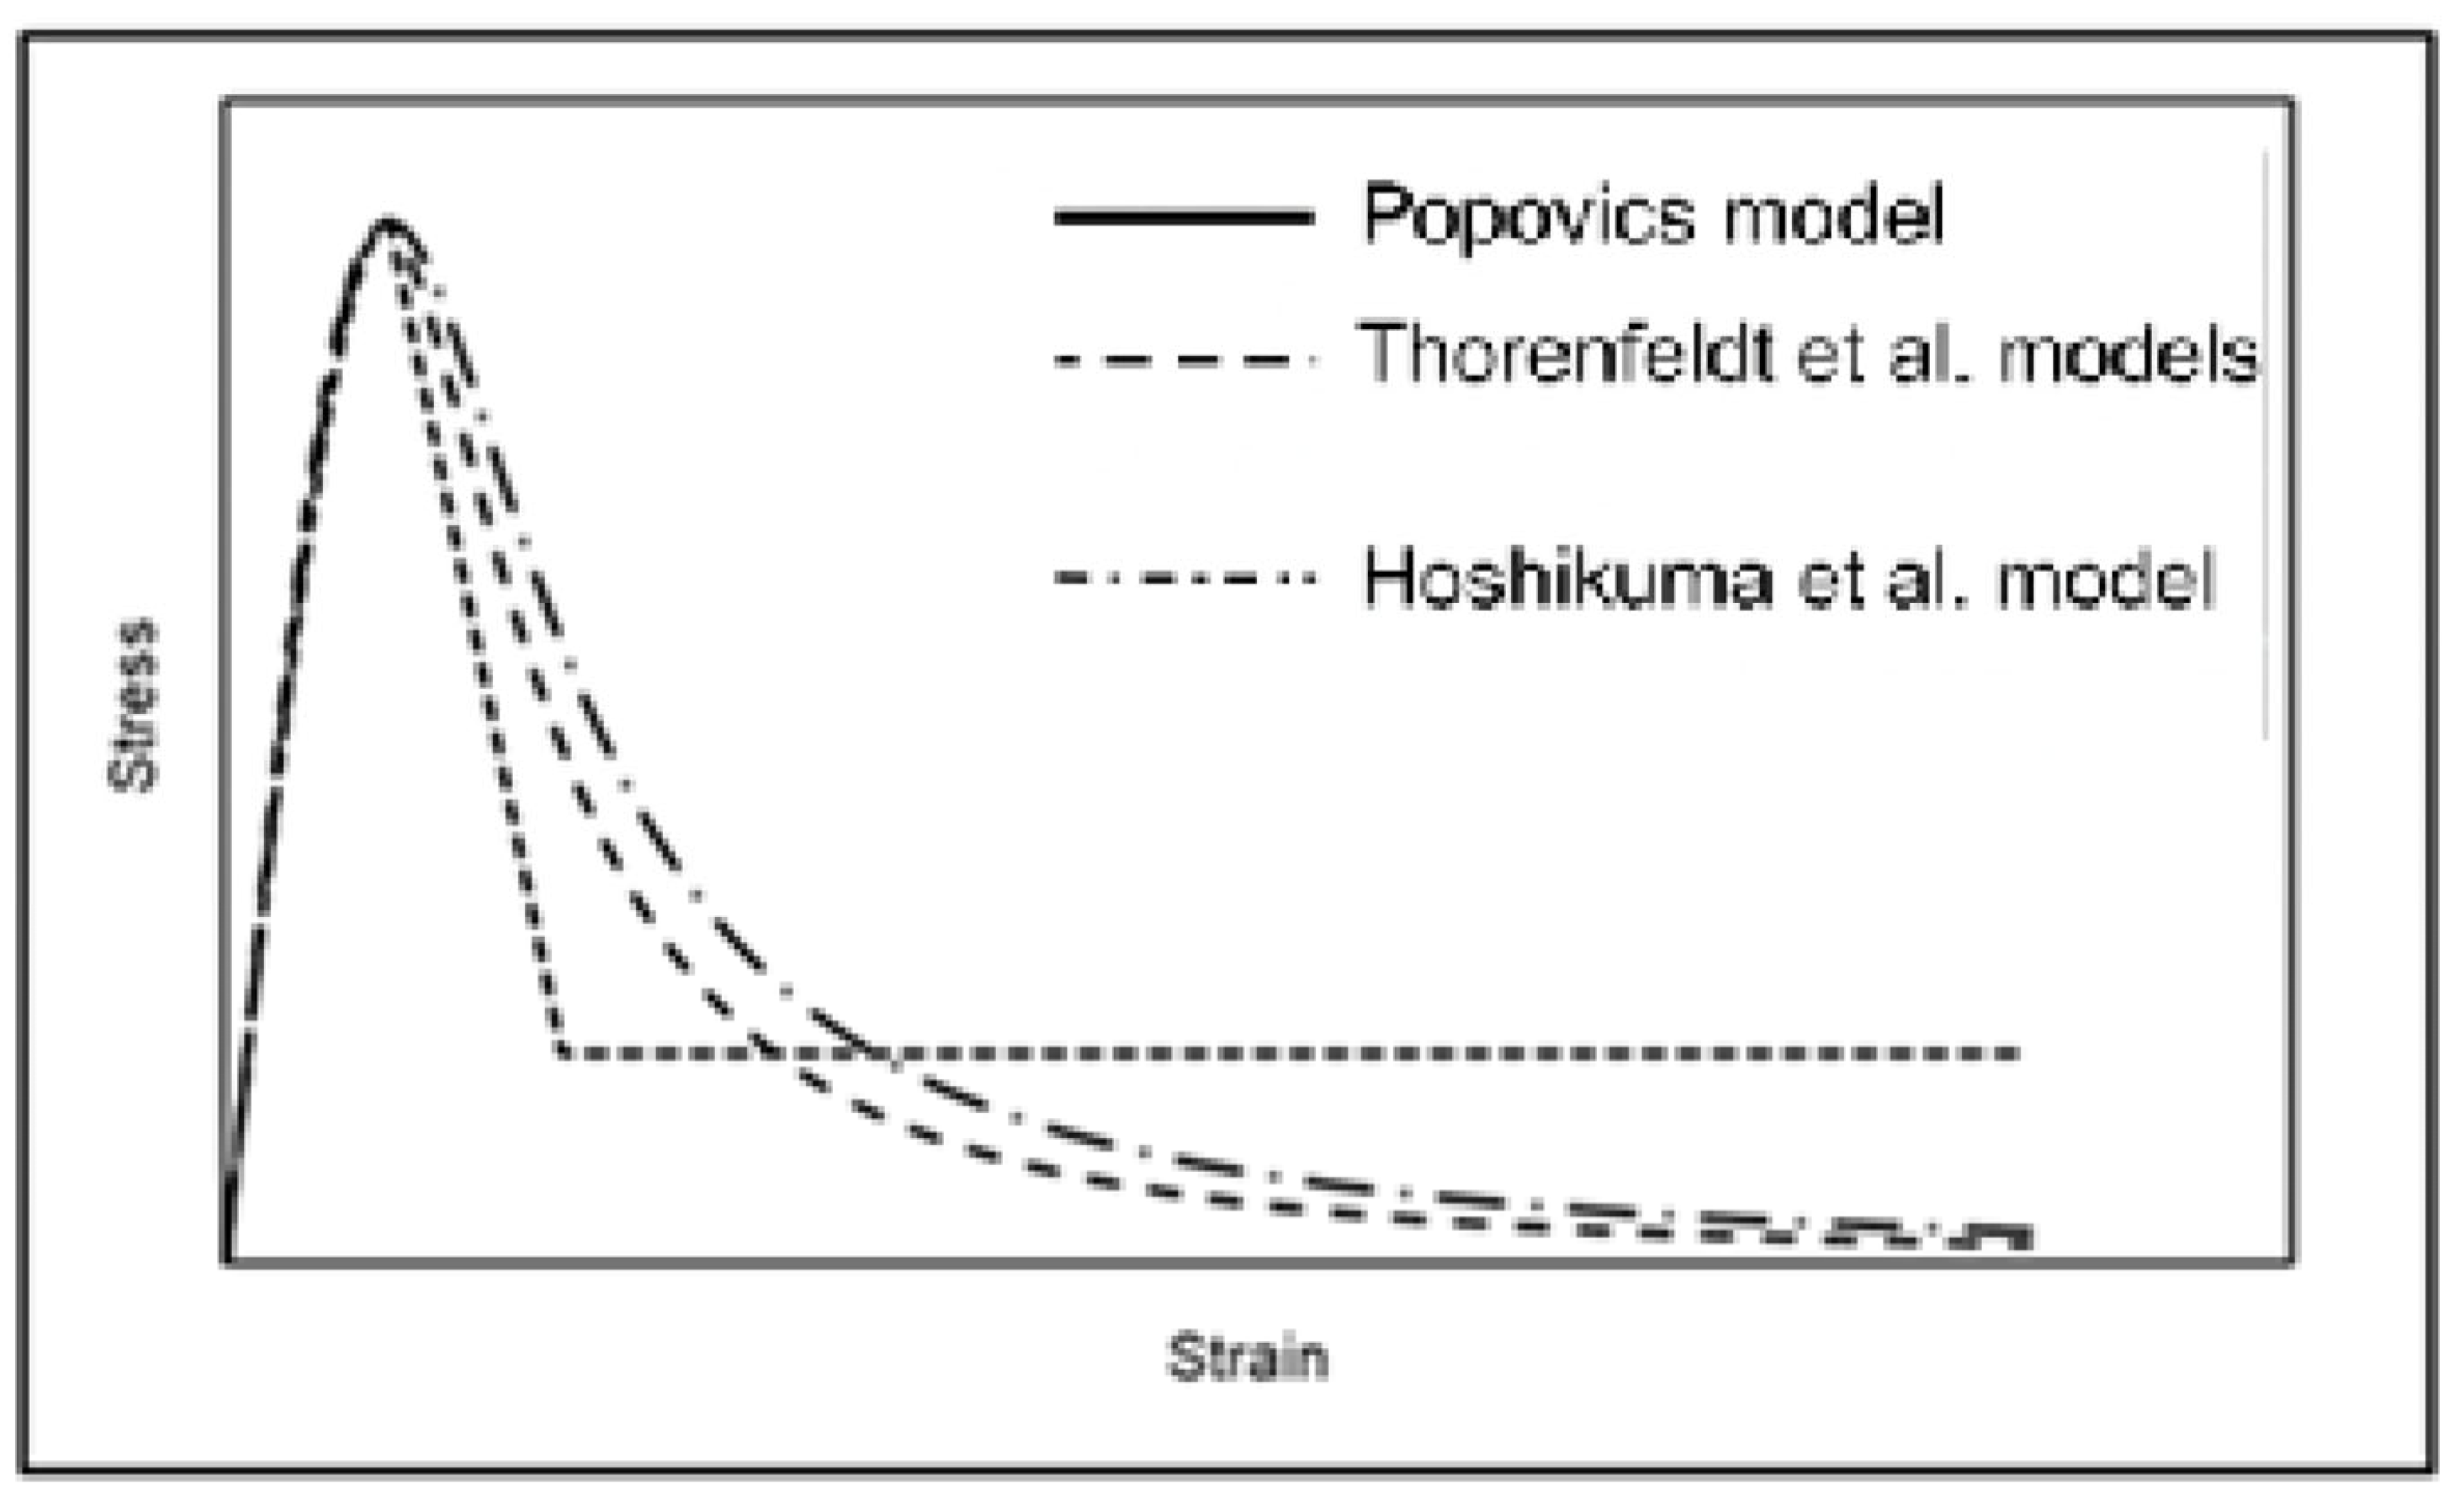
2. Review of Existing Behavior and Models of Concrete

In modern fracture mechanics, concrete is considered as a quasi-fragile material; this classification is explained by the subcritical cracking that occurs during the loading of concrete [31]. Subcritical cracking of concrete that precedes ultimate failure produces a nonlinear stress–strain response and R-curve behavior. Thus, the hardness of concrete is determined by its subcritical failure curve. Concrete also has a heterogeneous structure because of the variable composition of its ingredients [31]; this heterogeneity also complicates the analysis of concrete.
According to [32], the uniaxial compressive stress ( f c i ) versus strain ( ε c i ) response of a normal concrete exhibits a relatively linear and elastic behavior up to a stress level of about 0.4 f c . Although a tangent modulus can be determined from any point on the slope of this part, a secant modulus of elasticity, E c , defined by a line between the point of zero stress and 0.4 f c , is generally used by engineers and specifically by North American design codes [33,34,35]. Beyond 0.4 f c , microcracks develop in the concrete matrix, and the behavior becomes nonlinear. The curve rises to a peak equal to the maximum compressive stress, f c , and a corresponding peak strain, ε p , typically estimated as 0.0020 for normal strength portland cement concrete ( f c between approximately 20 and 60 MPa). The secant modulus of elasticity at peak, i.e., the “peak stress–strain ratio,” is equal to the maximum stress divided by the strain ( f c / ε p ). In the post-peak phase ( ε c i > ε p ), the concrete stress decreases non-linearly as the material shows localized macrocracking. The typical stress–strain curve for concrete under compression is shown in Figure 1.
For conventional concrete, the behavior of concrete in uniaxial compression can be integrated into a stress–strain law:
f c i = 1 A ε c i ε p f c n n 1 + ε c i ε p n k ,
with A being a parameter that describes the residual resistance, and n and k are the pre- and the post-peak parameters, respectively.
Several models have been developed to predict the stress–strain response of concrete under uniaxial loading. For example, Popovics [16] used normal strength concrete (20 ≤ f c ≤ 60) to determine pre-peak and post-peak stress–strain response and used Equation (1) with the values A = 0, k = 1, and n as
n = E c E c f c ε p .
E c = 4500 f c
Thorenfeldt et al. [36] modified the Popovics model [16] to consider the more fragile post-peak response of high-strength concrete ( f c ≥ 60 MPa) with the value of n given by Equation (4) and the value of k given by Equation (5) after the peak (k = 1 for the pre-peak response).
n = 0.80 + f c 17 ,   and
k = 0.67 + f c 62 1.0 .
More recently, several researchers have proposed stress–strain curves for specific applications, especially for considering the effect of confinement on the post-peak response. Among them is the well-known Hoshikuma et al. model [14], which was originally developed for concrete columns undergoing a certain level of confinement. Their model is given in Equations (6) and (7), for the pre-peak and the post-peak response, respectively.
f c i = E c .   ε c i 1 1 n ε c i ε p n 1 ,
f c i = f c + E d e s ε c i ε p 0.2 f c ,
where n is evaluated by Equation (4) given by Popovics [16], and E d e s is the deterioration rate of the descending branch taking into account the effects of confinement, given as E d e s = 0.5 E c for unconfined concrete under uniaxial compression.
This study can compare the predicted behavior of concrete in the unconfined uniaxial compression of the three models presented in Equations (2)–(7) with Figure 2 ( f c = 30 MPa). Prior to the peak, the three predicted behaviors are similar. After reaching the maximum load, the Hoshikuma et al. model [14] presents a drop in strength followed by a residual stress equal to 20% of the maximum stress f c . As mentioned by the authors, this residual stress better represents the behavior of structural concrete with confinement. The Popovics [16] and Thorenfeldt et al. models [36], in contrast, present a more progressive post-peak drop, and the stress decreases to about 0 MPa for a very large strain.

3. Experimental Methodology

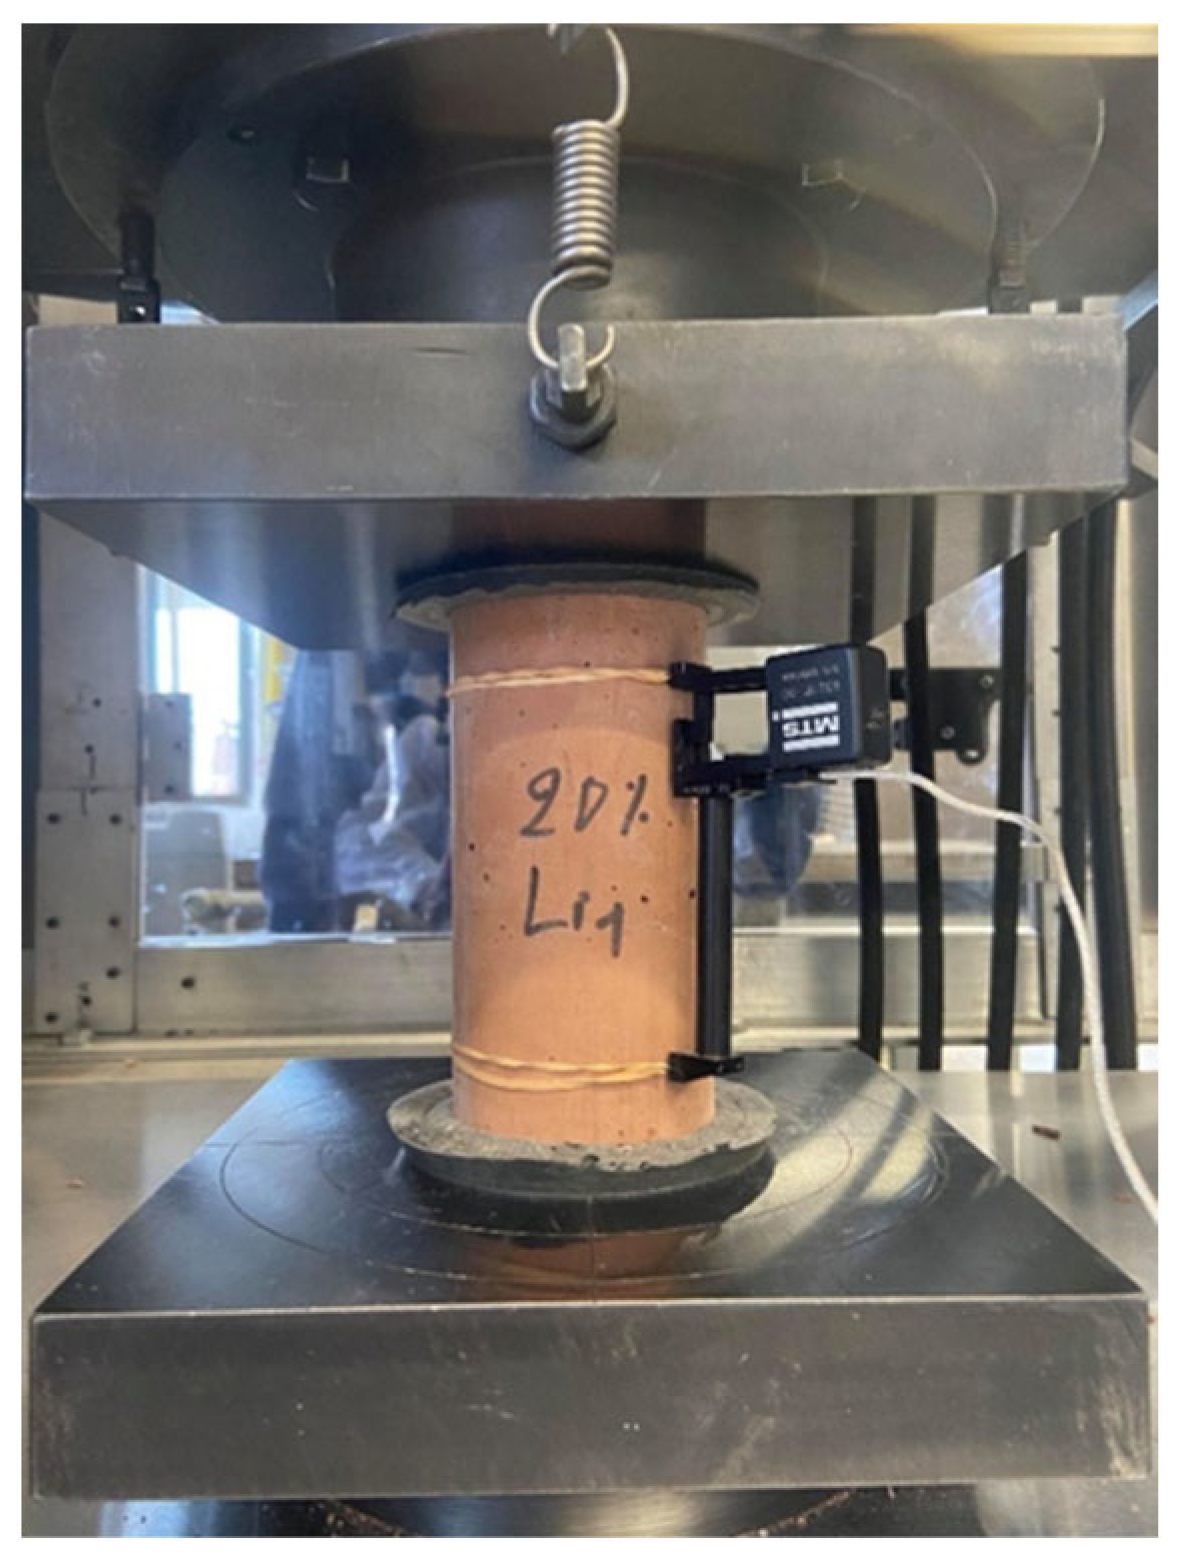
3.1. Loading System, Installation and Measuring System

Concrete cylinders comprising different concrete mixes the authors cast and underwent a moist cure for a period varying from 7 to 180 days before being tested under uniaxial compression according to CSA A23.2 [34]. For each concrete mix, cylindric samples (diameter of 76.2 mm × height of 152.4 mm) the authors loaded by two methods. A first sample was preloaded at 0.8 kN and then loaded at a rate of 1.14 kN/s (force controlled) up to failure, as described in CSA A23.2 [34]. From these first tests, the authors determined that a displacement rate of about 0.01 mm/s was the best match for a pre-peak loading rate of 1.14 kN/s, as specified by CSA A23.2 [34]. The other samples of the tested concrete mix the authors then preloaded at 0.8 kN and loaded at this displacement rate of 0.01 mm/s (displacement controlled) to adequately monitor the pre- and post-peak stress–strain response. Figure 3 presents the testing apparatus and the deformation data acquisition system.

3.2. Materials and Sample Preparation

The design of the concrete mix proportions was carried out in accordance with CSA A23.1 [37]. A crushed fine aggregate conforming to CSA A23.1-19, with a specific gravity of 2.56, fineness modulus of 2.6, water absorption of 1.01%, and maximum size of 5 mm, was used. Similarly, a coarse aggregate with a density of 2.67 g/cm3, a maximum size of 20 mm, and a water absorption rate of 1.39% was employed. The proportions and properties of a control concrete mix for portland cement lacking BR are presented in Table 1. The investigated concrete mixes with BR (BRC) the authors made by replacing cement with 5%, 10%, 15%, and 20% by mass BR. For the BRC mixtures, the authors had to increase the water content by 1.5% for every 5% of BR to maintain an acceptable workability and slump (see Table 1). Similar behavior has been observed by other researchers [1,5,38].

4. Results

4.1. Properties of Fresh Concrete

Workability, air content and density were determined by the authors for all mixes according to [37] CSA A23.2 [34] and are presented in Table 2. Substituting cement with bauxite residues in the concrete reduced workability and air content. However, the BRC exhibited a slightly higher density than the control concrete lacking BR. These observations are consistent with previous studies using similar mixtures of BR [39]. Although a general trend of reduced workability was observed, the increase in slump at 20% BR may be due to the additional water content or altered rheological behavior at higher BR levels.

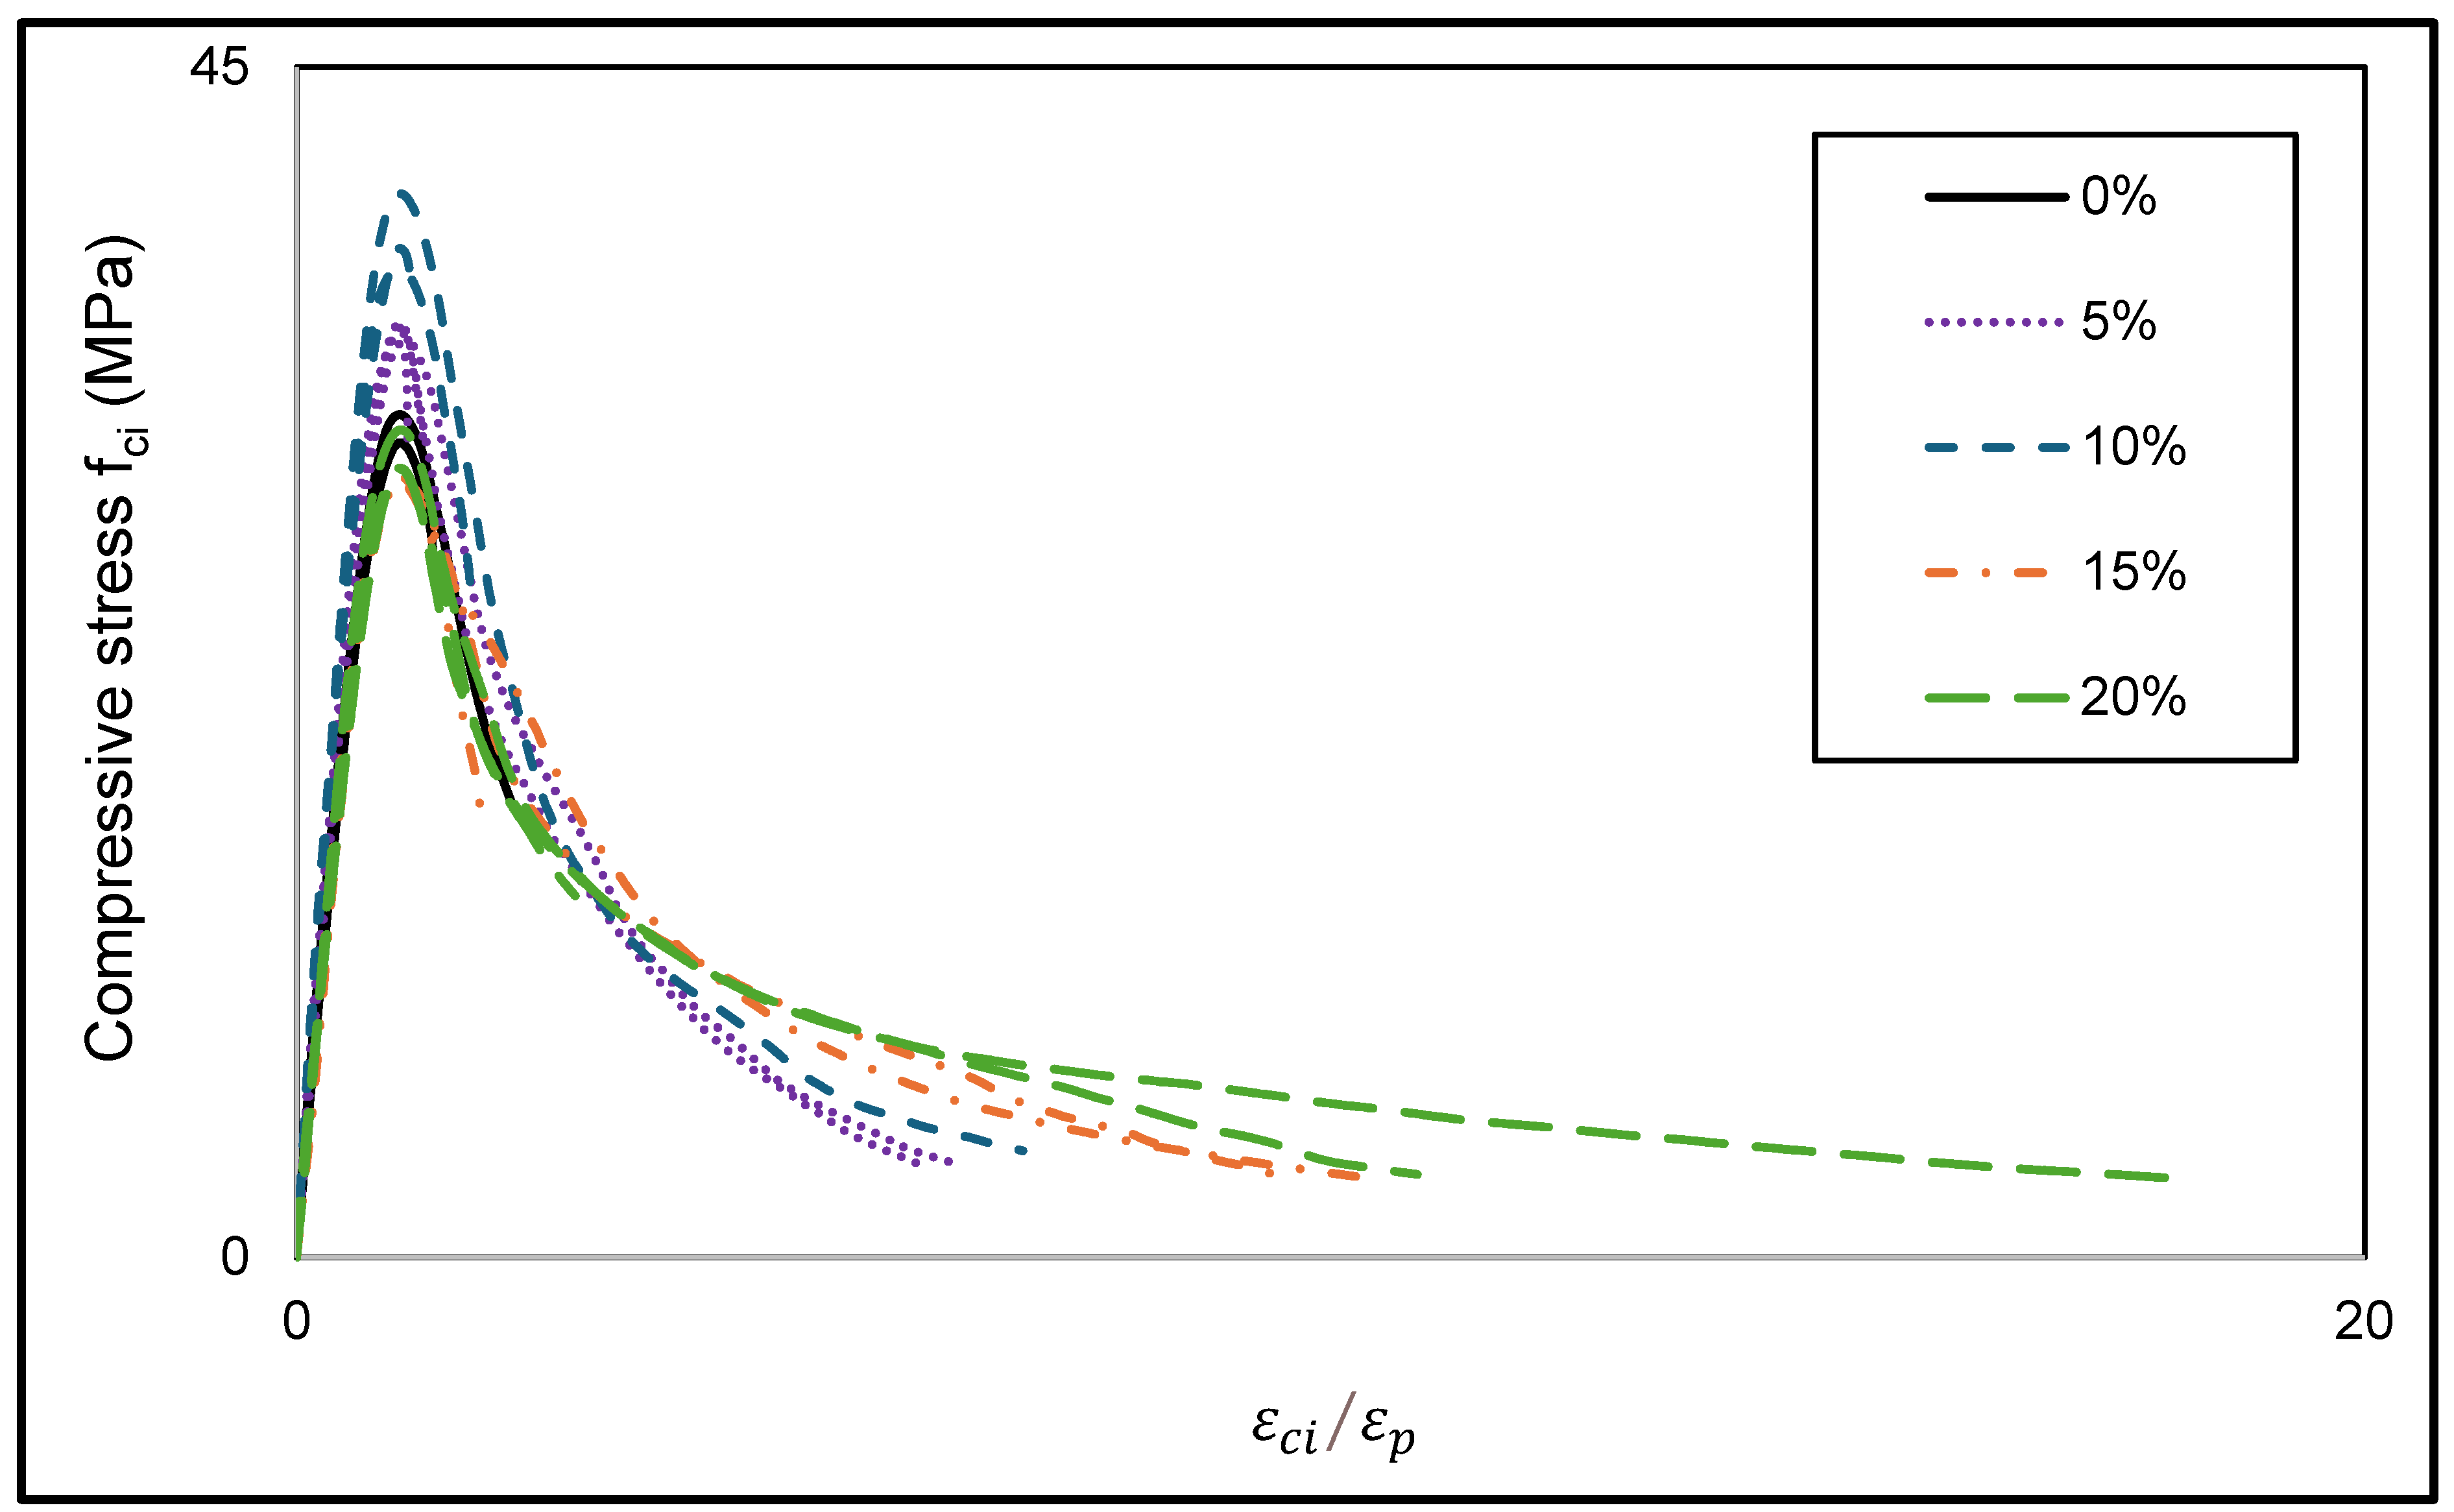
4.2. Hardened Concrete Stress–Strain Response

The displacement-controlled stress–strain response for the BRC samples is shown in Figure 4, and the main parameters determined from the force-controlled and displacement-controlled stress–strain responses are presented in Table 3. This study found the post-peak slope, E , to be between 90% and 60% of peak stress, f c Equation (8).
E = 0.3 f c ε 0.6 f c ε 0.9 f c .
Figure 4 shows the displacement-controlled stress–strain response for BRC mixtures. Each curve corresponds to one replicate sample tested for each level of BR replacement, highlighting the consistency and variability within each mix design.
Table 3 presents the mechanical properties and stress–strain curve parameters obtained for each replicate test. The column labeled ‘Test’ identifies each specimen tested, reflecting the variability across samples for a given BR replacement level. For each BR replacement percentage, four replicate samples were tested.

4.3. Observations and Failure Mode

Figure 4 compares the stress–strain response for specimens of the same mix, and Figure 5 compares the response of all mixes in terms of stress versus normalized strain ( ε c i / ε p ). This normalization simplifies the comparison of the different types of mixes and failure according to the compressive strength. Generally, introducing BR does not appear to modify the shape of the curve established with conventional concretes. Figure 5 and Figure 6 show that the stress–strain curves differ very little in the pre-peak phase, although the same concrete formulation and the cylinders underwent the same treatment conditions. Adding BR has very little effect on the pre-peak phase.
Conversely, in the post-peak phase, the specimens varied greatly in their behavior, ranging from a low to very large softening behavior with the residual stress maintained as BR quantity increased. The stronger the concrete, the higher the post-peak slope; thus, failure will be more fragile. For the BRC specimens, the post-peak curve is more elongated, and the strain increases as BR amounts increase (Figure 4).

5. Development of a Stress–Strain Model

5.1. Development of the Pre-Peak Phase

To determine the effect of BR on the pre-peak response, the comparison was made between theoretical and experimental curves for all BRC mixtures. Figure 6 presents the average pre-peak stress–strain curves for each concrete formulation. The BR replacement ratio exerts only a minor influence on the experimental curves relative to the theoretical curves.
Drawing from the experimental data presented in Figure 6, an algorithm was used the Nelder-Mead algorithm programmed on MATLAB software R2023b to determine the parameter values of the three models that produce the best agreement between the experimental results and model predictions. The Nelder-Mead is a nonlinear optimization algorithm that seeks to minimize a continuous function in a multi-dimensional space.
One of the key parameters influencing pre-peak behavior for most of the models is the parameter n (see Table 4 for the Popovics and modified Popovics models). For conventional portland cement concrete, the experimental value of n is generally slightly higher than the theoretical prediction provided by the various models. The average ratio between the values prescribed by the models and those resulting from the experimental data is 0.96 (SD = 0.10) and 0.80 (SD = 0.18%) for the Popovics and modified Popovics models, respectively. Although the Popovics model appears better adapted to the tested concrete, these results, and comparisons of the curves in Figure 6, show that the modeled values are acceptable and can be used to describe the ascending curve (pre-peak) concrete from bauxite residues.
This study used root mean square error (RMSE) to evaluate the similarity of the experimental results with the Popovics and modified Popovics models. RMSE is often used as a standard statistic to measure model performance in the weather, air quality, and climate research studies, among many others. RMSE is often used to assess the quality of modeling both in terms of accuracy and precision [40,41,42,43]. As shown in Equation (9), the RMSE parameter corresponds to the average difference between the parameter n obtained from the theoretical equations and the experimental value of n obtained by an optimization program using MATLAB software. A higher RMSE value indicates a greater difference between the experimental and theoretical values of n produced by the Popovics [16] and Thorenfeldt et al. models [36].
R M S E = 1 n i = 1 n ( n e x p é r i m e n t a l e n t h é o r i q u e ) 2 1 / 2 .
The Popovics model [16] produced an RMSE of 0.55, whereas the Thorenfeldt et al. model [36] had an RMSE of 1.38. The small difference between the root mean square errors shows that both models can be used to plot the stress–strain curves of the control concrete and BRC. However, the Popovics model [16] was closest to the authors’ pre-peak experimental responses.

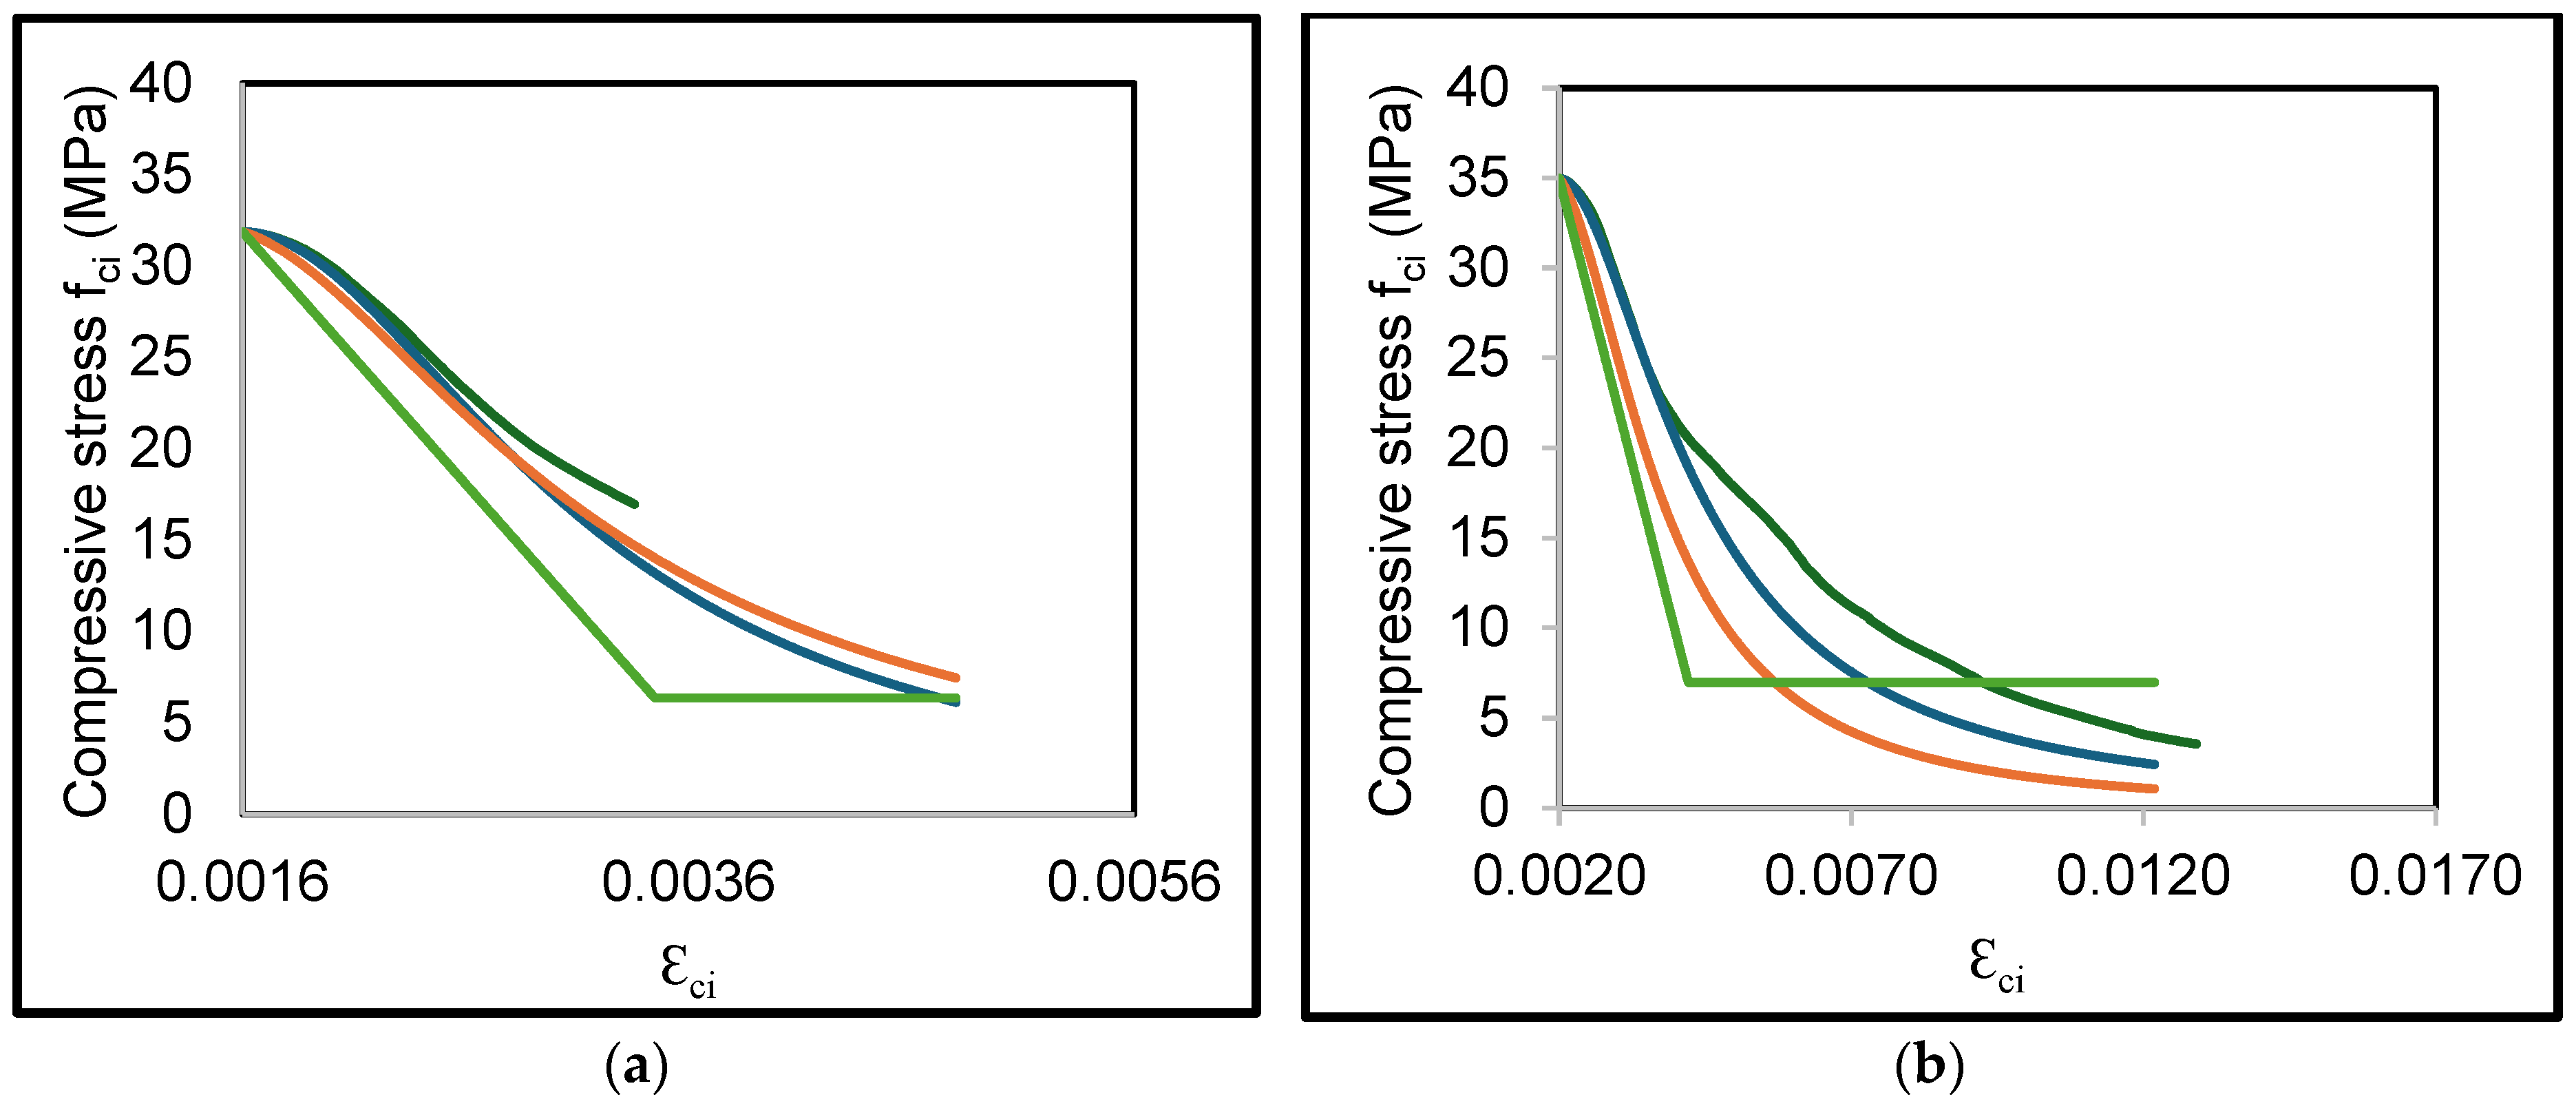
5.2. Development of the Post-Peak Phase

Figure 7 compares the stress–strain response under uniaxial compression measured in the descending part of the curve after reaching the compressive strength f c (post peak) with the predictions obtained from the theoretical models for the tested BRC. The models did not adequately predict the experimental responses of BRC; therefore, the models must be improved to produce better predictions. Moreover, increasing the proportion of BR reduces the fragility of the post-peak failure.
This study determined the fracture energy (area under the post-peak curve) by comparing the strain measured at the peak and a strain of 10% of the maximum stress, presented in Figure 8 as a function of the BR replacement ratio. Fracture energy increases and the slope of the post-peak response decreases as BR content increases. This study observes a quasi-linear relationship between the post-peak slope and the BR replacement ratio, with a coefficient of determination R 2 = 0.724 defined by the relationship (Equation (10)), where the bauxite residue replacement ratio expressed in % (Figure 9). This relationship holds for the entire range of experimental BR replacement ratios. A limit lower than E′ was therefore set at 35 Mpa.
E = 1.26   B R R + 68.6

5.3. Proposal of a Post-Peak Model Adapted to Bauxite Residue Concrete

For the pre-peak predictions, the three models investigated in this paper match the experimental results as well and are suitable for use with BRC. For the post-peak predictions, the proposed behavior model ( ε c i > ε p ) can be written from Equation (11).
F c i = 1 A ε c i ε p f c K K 1 + ε c i ε p K + A f c ,   if   ε c i ε p .
In this equation, the parameter K is a function of the slope of the descending branch, whereas parameter A represents the residual resistance in compression in proportion to the resistance at the peak. Typically, the value of parameter A is about 10% to 20% for portland cement concrete [44]. For the tested compounds, a residual strength corresponding to approximately 10% of peak strength was obtained for large deformations, regardless of the amount of BR. For the tested concrete mixes, this study therefore proposes A = 0.10 as a value to be applied.
To evaluate parameter K, an algorithm was used to determine the slope of the post-peak phase (see Table 3 and Figure 9). After calculating the slopes defined by Equation (12), the authors developed a MATLAB program to determine the relationship between the coefficient K of Equation (11) and the slope of the post-peak part, E′. The relationship between these two parameters is quasi-linear and can be very accurately predicted by Equation (12), with a coefficient of determination R 2 = 0.999 (Figure 10).
K = E 25 + 1.1 .
By substituting the expression for E′ in Equation (12), a relationship between the parameter K and the percentage of BR can be expressed by Equation (13):
K = 3.85 ( B R R / 20 ) 2.50 .
The stress–strain relation of the post-peak part f c i can be obtained from Equation (14), where K is determined from Equation (13), according to the BR replacement ratio.
f c i = 0.9 ε c i ε p f c K K 1 + ε c i ε p K + 0.1 f c .
To better understand the trend of Equation (14), the authors plotted stress–strain curves for the BRC mixtures and the control concrete. Figure 11 represents the compatibility of the experimental data of the post-peak part of the stress–strain curves with the authors’ model and the existing models in the literature. Our proposed model and its parameters A and K are in better agreement with the experimental results than those of Popovics and Thorenfeldt et al. [16,36].
Although the model was validated using bauxite residue concrete under specific conditions, its applicability to other concrete types with varying compositions remains to be tested. Under specific conditions, its applicability to other concrete types with differing mix designs should be assessed with caution.

6. Conclusions

This paper investigates the mechanical behavior of concrete that incorporates various amounts of bauxite residue and that resists uniaxial compression. This study also propose a new stress–strain model for bauxite residue–containing concrete. For the tested concrete mixes with different amounts of bauxite residue replacing cement, the main conclusions of this study are summarized as follows.
  • The compressive strength and the elastic modulus significantly increased with the addition of bauxite residues relative to the control concrete lacking bauxite residue.
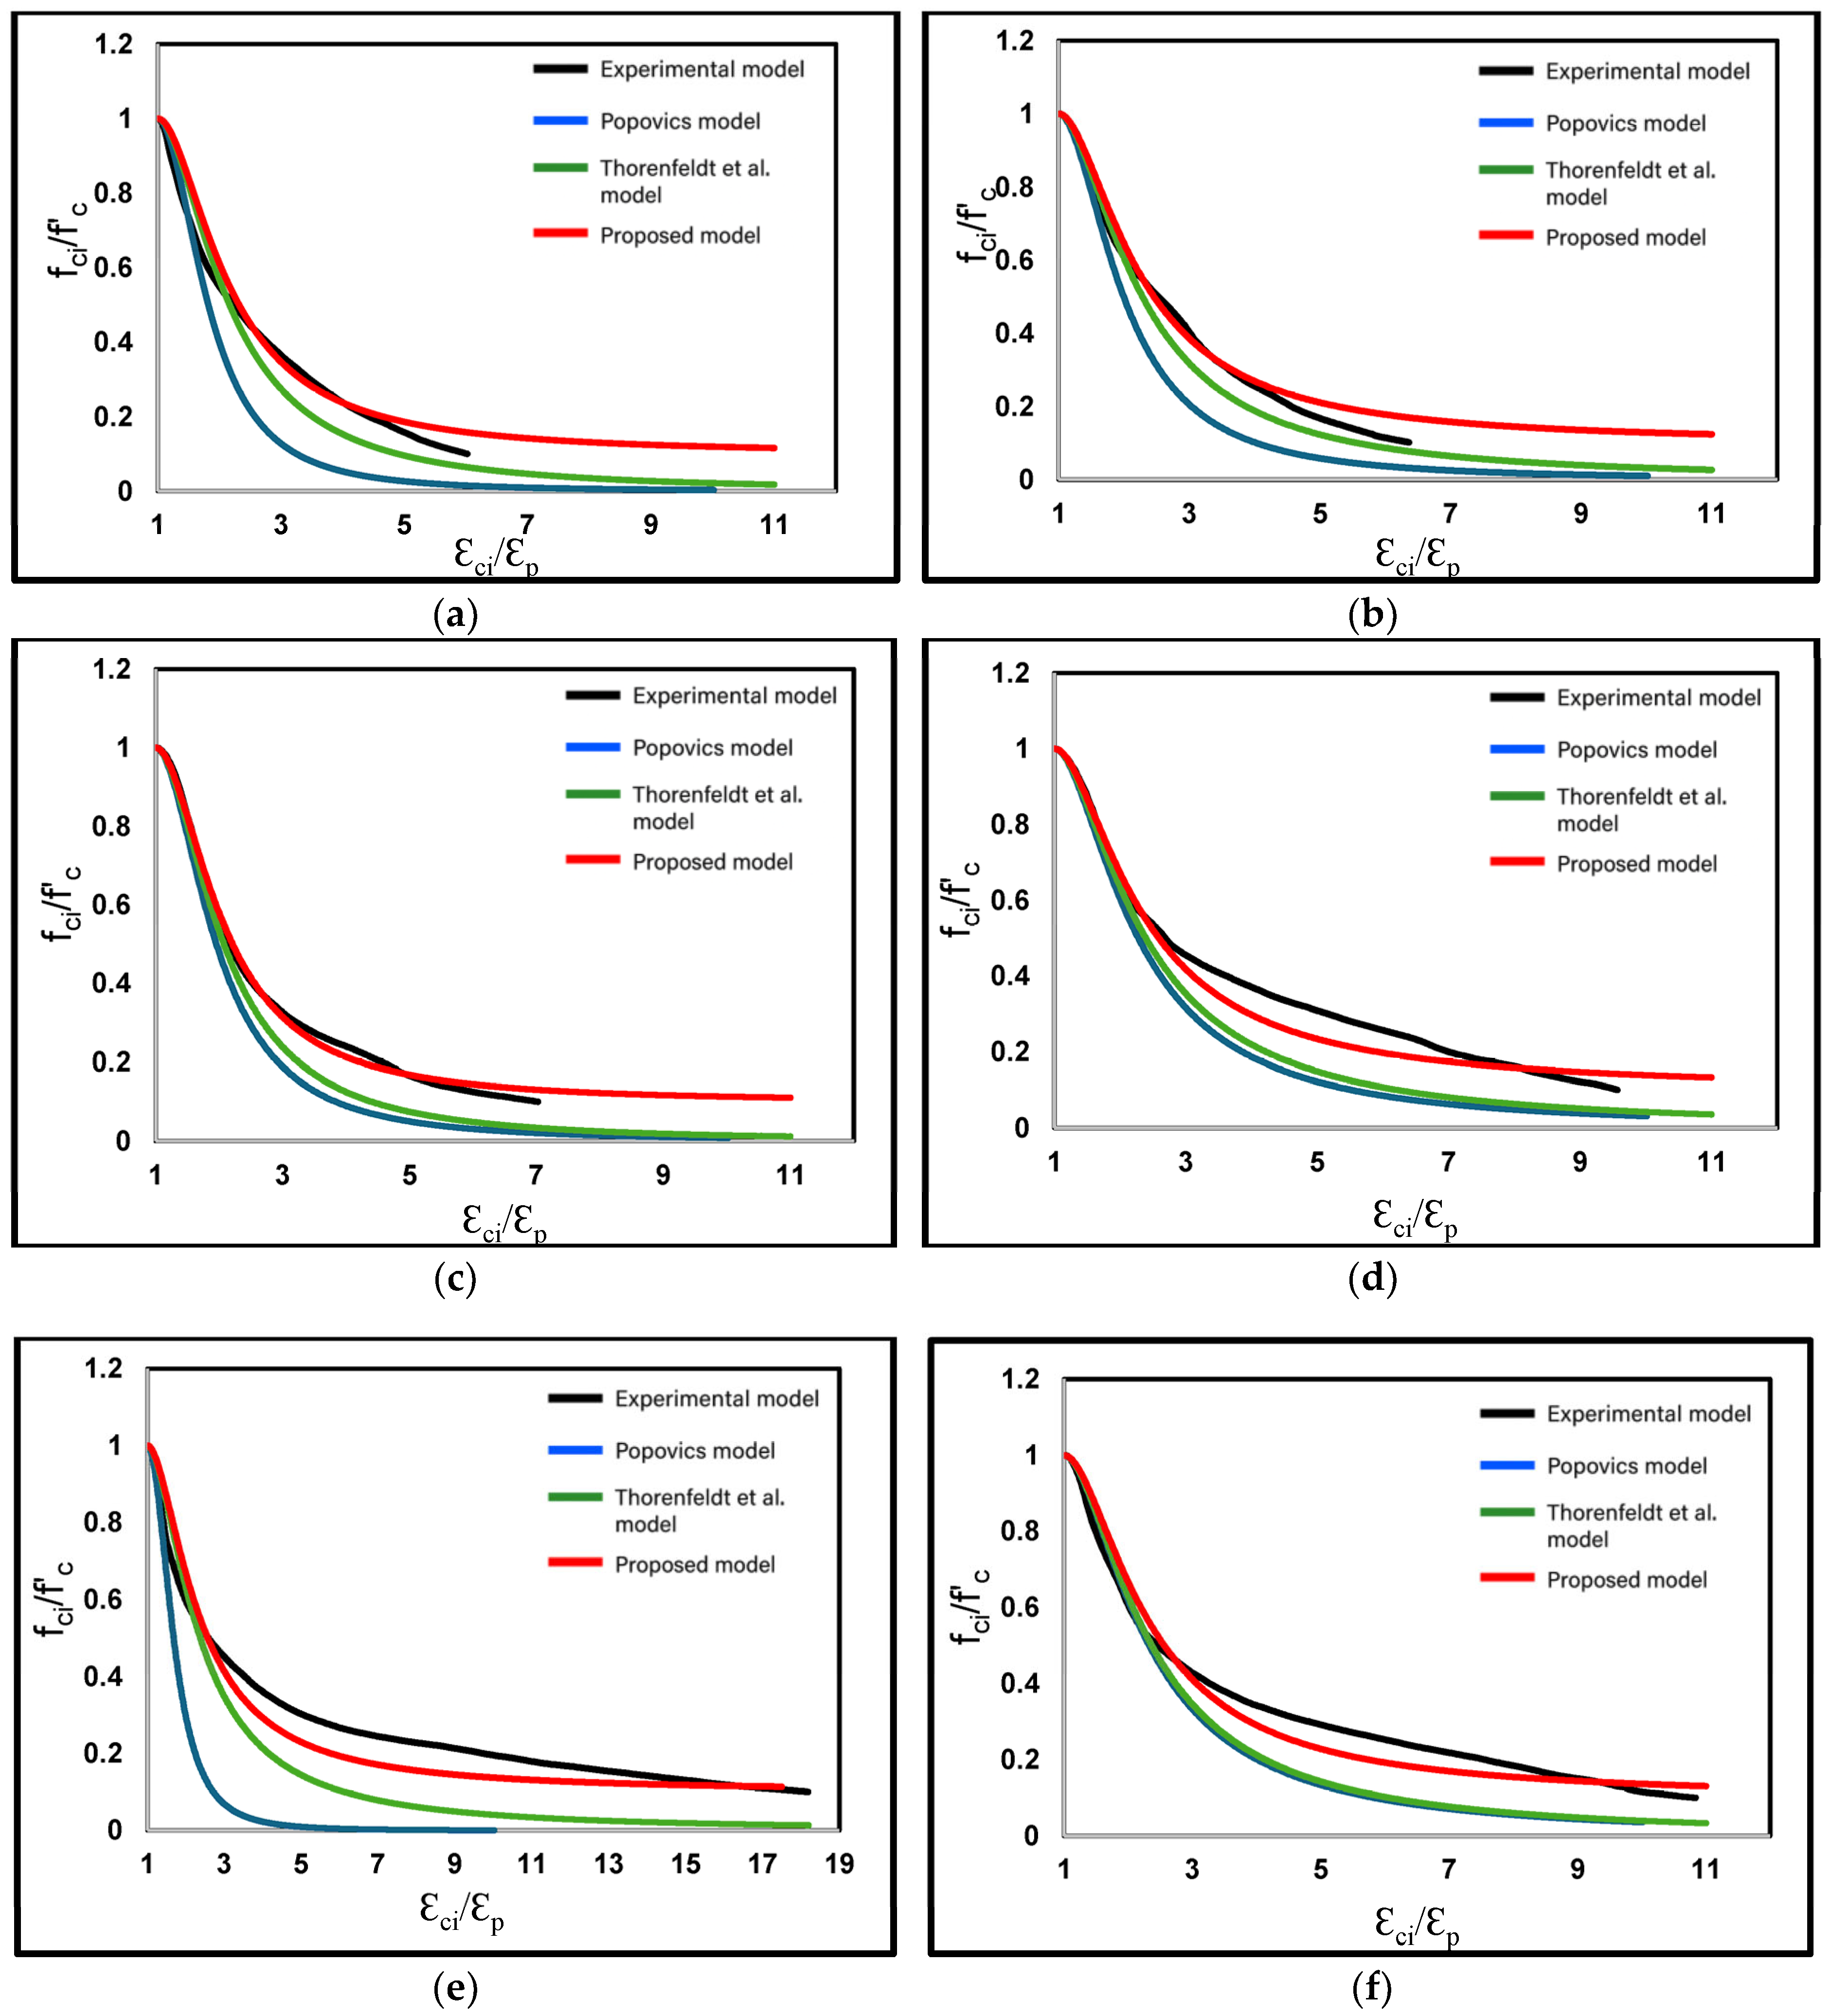
  • The adding of bauxite residues to concrete does not significantly influence the pre-peak stress–strain response. The stress–strain response predicted by all tested models matches as well as the experimental results; however, the Popovics model provided the best fit to the experimental results and is therefore recommended for the pre-peak strain response of concrete with bauxite residue.
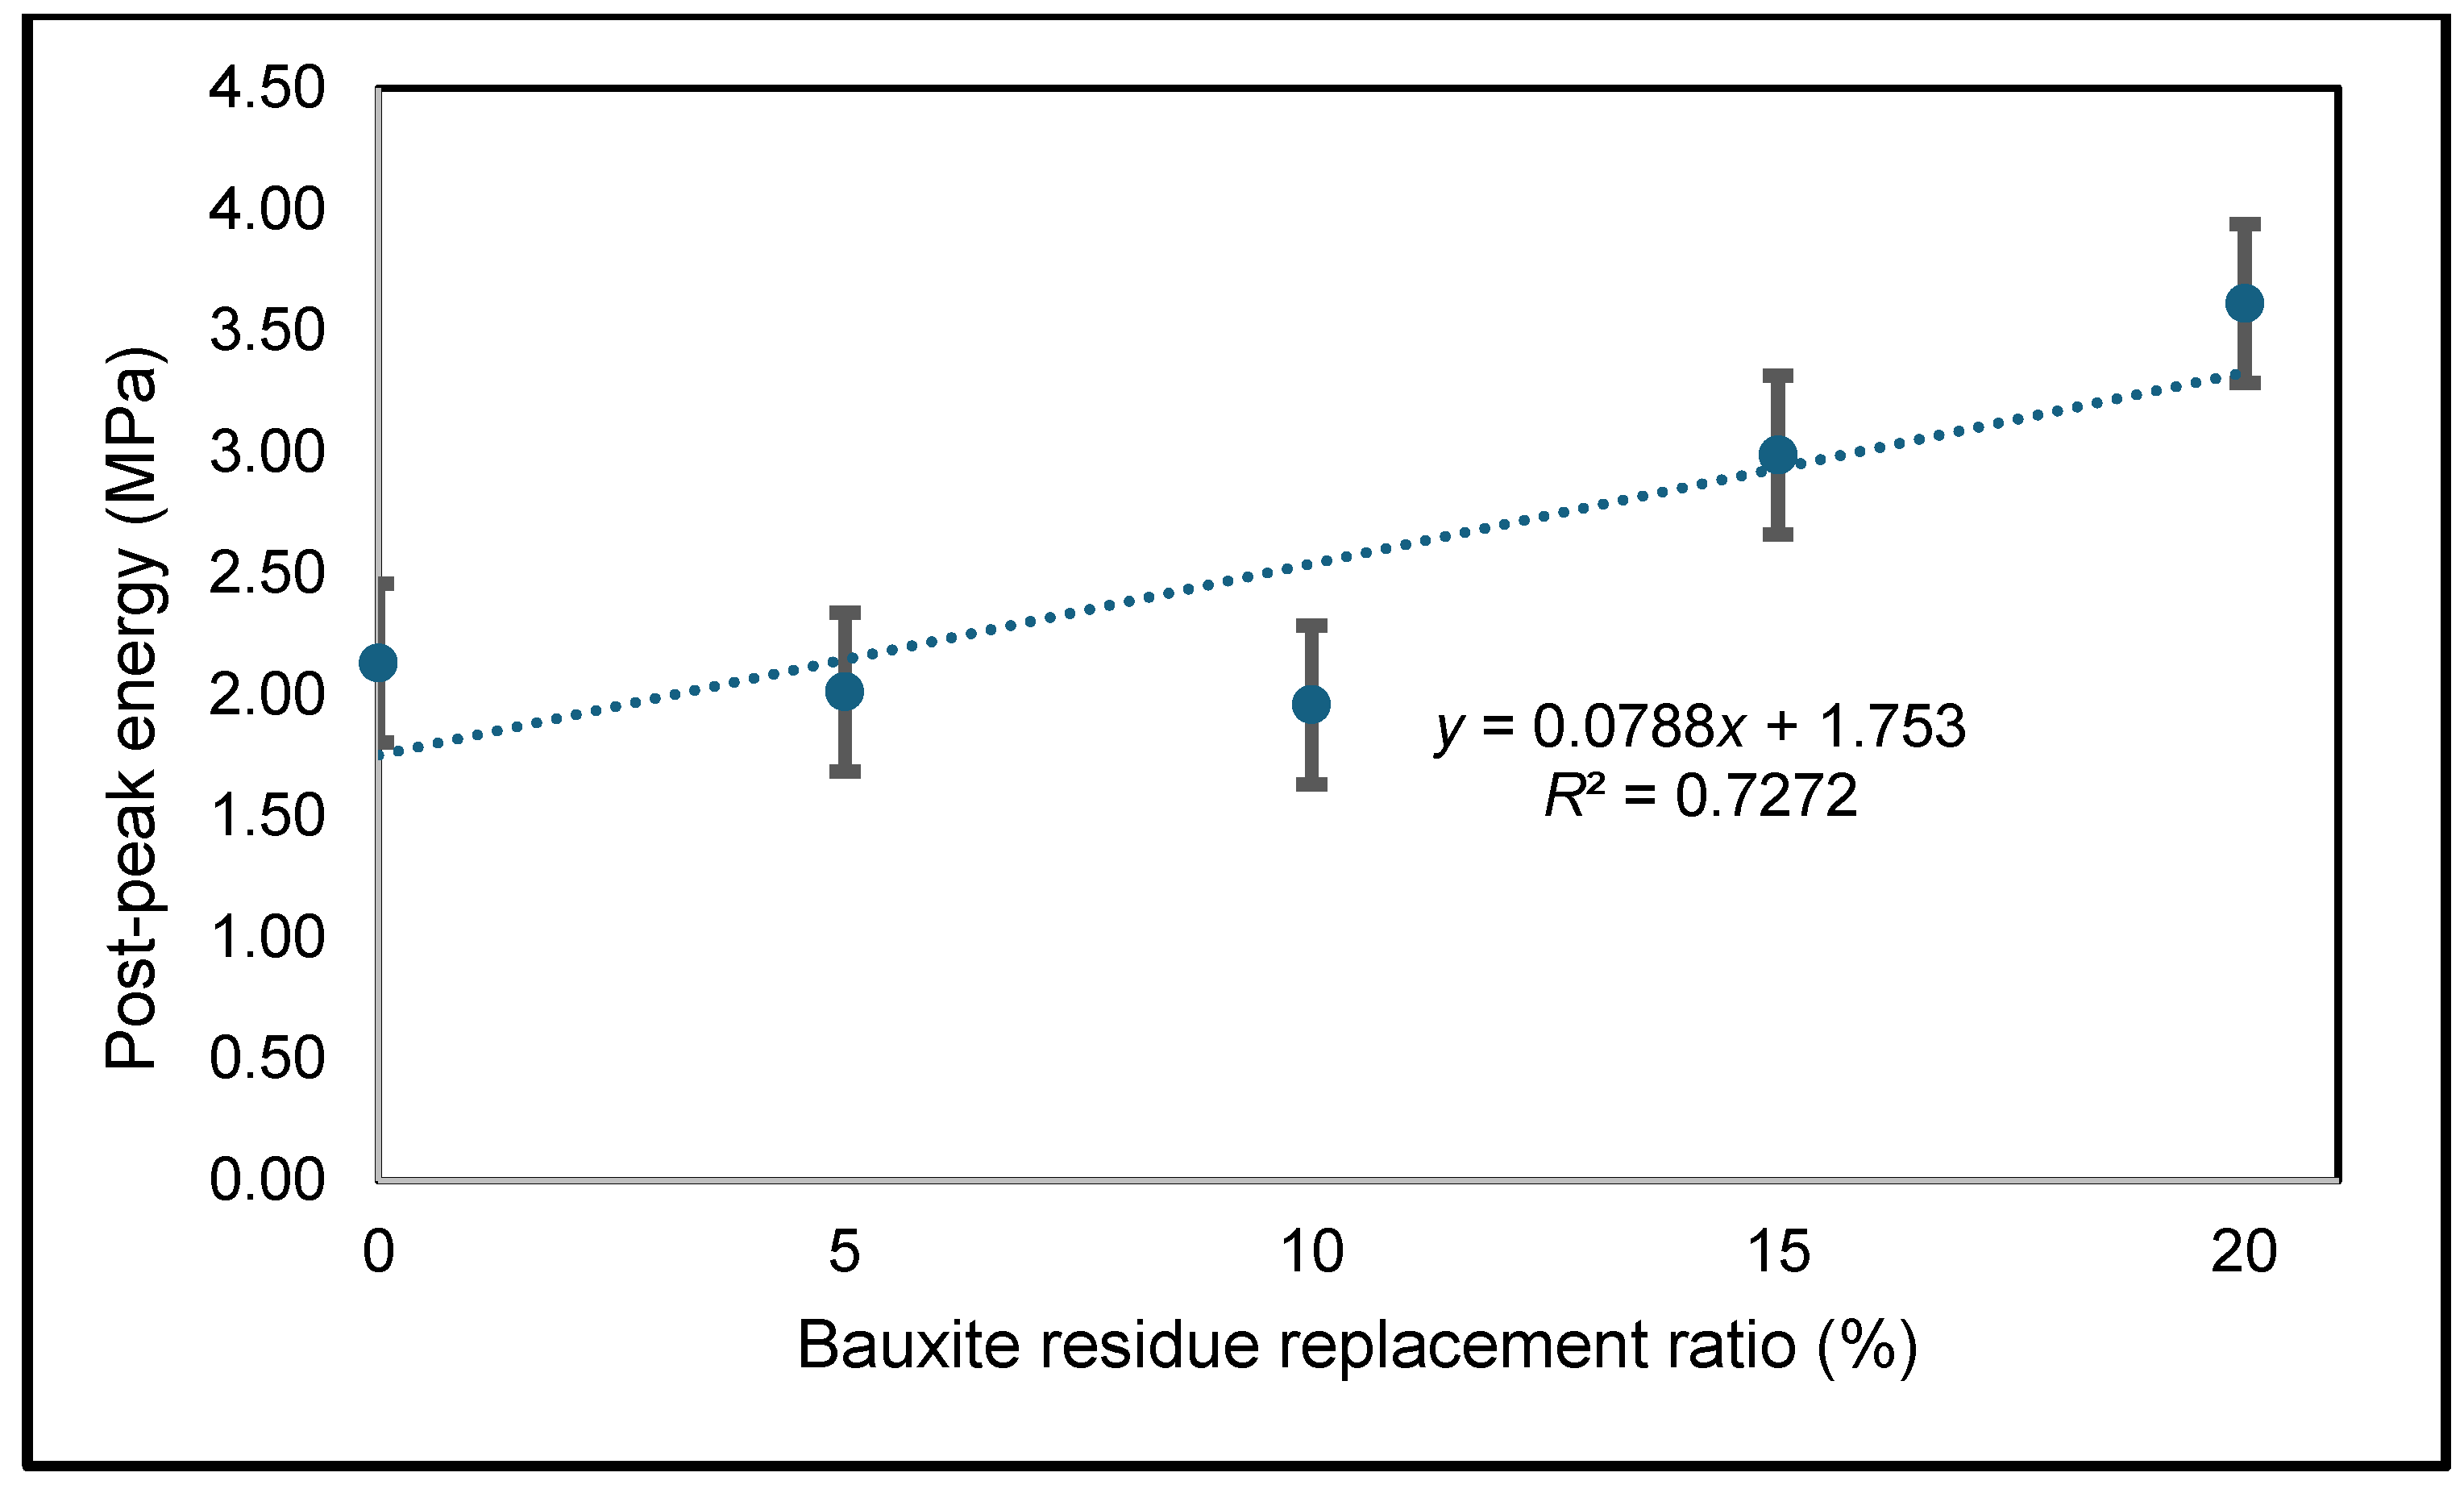
  • The post-peak response of concrete resisting uniaxial compressive stress is influenced by the amount of bauxite residue used to replace cement. Increasing the amount of bauxite increases the post-peak energy.
  • Existing models do not provide good predictions of the post-peak uniaxial compressive stress–strain response of concrete containing bauxite residue. This study produced a new stress–strain model to better consider the effect of the bauxite residue ratio on the post-peak rupture energy. The proposed model can adequately predict the stress–strain response of bauxite residue concrete and portland cement concrete resisting uniaxial compressive stress.

Author Contributions

Conceptualization, A.S. and Y.B.; methodology, Y.B., M.F., A.S. and K.B.; software, Y.B. and M.F.; validation, M.F., K.B. and A.S.; formal analysis, M.F.; investigation, Y.B.; resources, Y.B.; data curation, Y.B.; writing—original draft preparation, Y.B.; writing—review and editing, Y.B., M.F. and R.V.P.C.; visualization, K.B.; supervision, A.S.; project administration, A.S. and M.F.; funding acquisition, A.S. and M.F. All authors have read and agreed to the published version of the manuscript.

Funding

This research was funded by the Canada Research Chair program grant number #950232724; FRQ-NT and Research Center on Concrete Infrastructures.

Data Availability Statement

The raw data supporting the conclusions of this article will be made available by the authors on request.

Acknowledgments

The authors thank the Canada Research Chair program grant number #950-232724; FRQ-NT and the Research Center on Concrete Infrastructures for financing and supporting this research work. The authors also acknowledge the support provided by Rio Tinto, Guy Simard and the CURAL-Bauxite-Residue research group.

Conflicts of Interest

On behalf of all authors, the corresponding author states that there are no conflicts of interest.

References

  1. Al-Amoush, H.; Abu Rajab, J. The use of electrical resistivity tomography to investigate basaltic lava tunnel based on the case study of Al-Badia cave in Jordan. Indones. J. Geosci. 2018, 5, 161–177. [Google Scholar] [CrossRef]
  2. Bayat, A.; Hassani, A.; Azami, O. Thermo-mechanical properties of alkali-activated slag-Red mud concrete. Road Mater. Pavement Des. 2020, 21, 411–433. [Google Scholar] [CrossRef]
  3. Brahami, Y.; Saeidi, A.; Fiset, M.; Ba, K. The effects of the type and quantity of recycled materials on physical and mechanical properties of concrete and mortar: A review. Sustainability 2022, 14, 14752. [Google Scholar] [CrossRef]
  4. Comite Euro-International du Beton. RC Elements Under Cyclic Loading: State of the Art Report; Thomas Telford Ltd.: London, UK, 1996. [Google Scholar]
  5. Illavarason, P.; Renjit, A.; Mohan Kumar, P. Clinical evaluation of functional vision assessment by utilizing the visual evoked potential device for cerebral palsy rehabilitation. Procedia Comput. Sci. 2018, 132, 128–140. [Google Scholar] [CrossRef]
  6. Collins, M.P.; Mitchell, D.; MacGregor, J.G. Structural design considerations for high-strength concrete. Concr. Int. 1993, 15, 27–34. [Google Scholar]
  7. Pujar, S.M.; Prakash, K.B. Effect of replacement of cement by red mud on the properties of concrete. Int. J. Sci. Eng. Res. 2014, 5, 805–814. [Google Scholar]
  8. Shetty, K.K.; Nayak, G.; Vijayan, V. Effect of red mud and iron ore tailings on the strength of self-compacting concrete. Eur. Sci. J. 2014, 10, 168–176. [Google Scholar]
  9. Ye, J.; Hu, A.; Ren, G.; Chen, M.; Tang, J.; Zhang, P.; Zhou, S.; He, Z. Enhancing sludge methanogenesis with improved redox activity of extracellular polymeric substances by hematite in red mud. Water Res. 2018, 134, 54–62. [Google Scholar] [CrossRef]
  10. Almusallam, T.H.; Alsayed, S.H. Stress-strain relationship of normal, high-strength and lightweight concrete. Mag. Concr. Res. 1995, 47, 39–44. [Google Scholar] [CrossRef]
  11. Bae, B.I.; Choi, H.K.; Lee, B.S.; Bang, C.H. Compressive behavior and mechanical characteristics and their application to stress-strain relationship of steel fiber-reinforced reactive powder concrete. Adv. Mater. Sci. Eng. 2016, 2016, 6465218. [Google Scholar] [CrossRef]
  12. Yang, K.H.; Mun, J.H.; Cho, M.S.; Kang, T.H.K. Stress-strain model for various unconfined concretes in compression. ACI Mater. J. 2014, 111, 819–826. [Google Scholar] [CrossRef]
  13. Jansen, D.C.; Shah, S.P. Effect of length on compressive strain softening of concrete. J. Eng. Mech. 1997, 123, 25–35. [Google Scholar] [CrossRef]
  14. Hoshikuma, J.; Kawashima, K.; Nagaya, K.; Taylor, A.W. Stress-strain model for confined reinforced concrete in bridge piers. J. Struct. Eng. 1997, 123, 624–633. [Google Scholar] [CrossRef]
  15. Mander, J.B.; Priestley, M.J.N.; Park, R. Theoretical stress-strain model for confined concrete. J. Struct. Eng. 1988, 114, 1804–1826. [Google Scholar] [CrossRef]
  16. Popovics, S. A numerical approach to the complete stress-strain curve of concrete. Cem. Concr. Res. 1973, 3, 583–599. [Google Scholar] [CrossRef]
  17. Haj, S.T.S.A.; Darvishvand, H.R.; Ebrahimi, M. Utilizing the modified Popovics model in study of effect of water to cement ratio, size and shape of aggregate in concrete behavior. Int. J. Eng. 2021, 34, 393–402. [Google Scholar] [CrossRef]
  18. Newman, J.; Choo, B.S. Advanced Concrete Technology: Processes; Butterworth-Heinemann: Oxford, UK, 2003. [Google Scholar]
  19. Ede, A.N.; Olofinnade, O.M.; Bamigboye, G.O.; Shittu, K.K.; Ugwu, E.I. Prediction of fresh and hardened properties of normal concrete via choice of aggregate sizes, concrete mix-ratios and cement. Int. J. Civ. Eng. Technol. 2017, 8, 288–301. [Google Scholar]
  20. Neetu, N.; Rabbani, A. Influence of size of aggregates on the compressive strength of concrete. Int. J. Eng. Dev. Res. 2017, 5, 27–30. [Google Scholar]
  21. Ogundipe, O.M.; Olanike, A.O.; Nnochiri, E.S.; Ale, P.O. Development of soil distribution and liquefaction potential maps for downtown area in Yangon. Civ. Eng. J. 2018, 4, 836–842. [Google Scholar] [CrossRef]
  22. Yu, F.; Sun, D.; Wang, J.; Hu, M. Influence of aggregate size on compressive strength of pervious concrete. Constr. Build. Mater. 2019, 209, 463–475. [Google Scholar] [CrossRef]
  23. Sim, J.-I.; Yang, K.-H.; Kim, H.-Y.; Choi, B.-J. Size and shape effects on compressive strength of lightweight concrete. Constr. Build. Mater. 2013, 38, 854–864. [Google Scholar] [CrossRef]
  24. Bazant, Z.P.; Planas, J. Fracture and Size Effect in Concrete and Other Quasibrittle Materials; Routledge: New York, NY, USA, 1998. [Google Scholar] [CrossRef]
  25. Markeset, G.; Hillerborg, A. Softening of concrete in compression—Localization and size effects. Cem. Concr. Res. 1995, 25, 702–708. [Google Scholar] [CrossRef]
  26. Miah, J.; Ali, K.; Suvash, C.P.; Miah, S.; Haque, M.M.; Islam, M.S.; Islam, M.R. Impact of partial replacement of brick coarse aggregate by waste rubber tyre on the fresh and hardened properties of concrete. Key Eng. Mater. 2021, 877, 131–137. [Google Scholar] [CrossRef]
  27. Kusumanjali, G.; Tejas, S.; Chatterjee, A.; Pasla, D. Utilization of bauxite residue as fine aggregate for the development of structural concrete: An approach towards sustainable construction materials. Case Stud. Constr. Mater. 2025, 22, e04348. [Google Scholar] [CrossRef]
  28. Salim, M.U.; Mosaberpanah, M.A.; Danish, A.; Ahmad, N.; Khalid, R.A.; Moro, C. Role of bauxite residue as a binding material and its effect on engineering properties of cementitious composites: A review. Constr. Build. Mater. 2023, 409, 133844. [Google Scholar] [CrossRef]
  29. Bayat, A.; Rooholamini, H.; Farahani, M.M.B. Effect of bauxite residue inclusion on the strength, shrinkage, and abrasion of alkali-activated slag concrete. Mater. Circ. Econ. 2022, 7, 331. [Google Scholar] [CrossRef]
  30. Choe, G.; Kang, S.; Kang, H. Mechanical properties of concrete containing liquefied red mud subjected to uniaxial compression loads. Materials 2020, 13, 854. [Google Scholar] [CrossRef]
  31. Anderson, T.L. Fracture Mechanics: Fundamentals and Applications, 3rd ed.; CRC Press: Boca Raton, FL, USA, 2005. [Google Scholar] [CrossRef]
  32. Paultre, P. Structures en Béton Armé, 2nd ed.; Presses Internationales Polytechnique: Montreal, QC, Canada, 2017. [Google Scholar]
  33. ASTM C39; Standard Test Method for Compressive Strength of Cylindrical Concrete Specimens. ASTM International: West Conshohocken, PA, USA, 2020.
  34. CSA A23.2; Methods of Test and Standard Practices for Concrete. Canadian Standards Association: Toronto, ON, Canada, 2019.
  35. CSA A23.3; Design of Concrete Structures. Canadian Standards Association: Toronto, ON, Canada, 2019.
  36. Thorenfeldt, M.P.; Porasz, A. Shear design for high strength concrete. CEB Bull. D’information 1989, 193, 77–83. [Google Scholar]
  37. CSA A23.1; Concrete Materials and Methods of Concrete Construction/Methods of Test and Standard Practices for Concrete. Canadian Standards Association: Toronto, ON, Canada, 2019.
  38. Tang, W.C.; Wang, Z.; Liu, Y.; Cui, H.Z. Influence of red mud on fresh and hardened properties of self-compacting concrete. Constr. Build. Mater. 2018, 178, 288–300. [Google Scholar] [CrossRef]
  39. Liu, Z.; Cai, C.S.; Peng, H.; Fan, F. Experimental study of the geopolymeric recycled aggregate concrete. J. Mater. Civ. Eng. 2016, 28, 04016077. [Google Scholar] [CrossRef]
  40. Gokceoglu, C.; Zorlu, K. A fuzzy model to predict the uniaxial compressive strength and the modulus of elasticity of a problematic rock. Eng. Appl. Artif. Intell. 2004, 17, 61–72. [Google Scholar] [CrossRef]
  41. Jones, N.L.; Davis, R.J.; Sabbah, W. A comparison of three-dimensional interpolation techniques for plume characterization. Groundwater 2003, 41, 411–419. [Google Scholar] [CrossRef] [PubMed]
  42. Wise, S. Assessing the quality for hydrological applications of digital elevation models derived from contours. Hydrol. Pro-Cesses 2000, 14, 1909–1929. [Google Scholar] [CrossRef]
  43. Zimmerman, D.; Pavlik, C.; Ruggles, A.; Armstrong, M.P. An experimental comparison of ordinary and universal kriging and inverse distance lightweighting. Math. Geol. 1999, 31, 375–390. [Google Scholar] [CrossRef]
  44. Wong, P.S.; Vecchio, F.J.; Trommels, H. VecTor2 and Formworks User’s Manual, 2nd ed.; University of Toronto: Toronto, ON, Canada, 2013. [Google Scholar]
Figure 1. Typical stress–strain response of portland cement concrete under uniaxial compression.
Jcs 09 00318 g001
Figure 2. Comparison of the stress–strain curves of three uniaxial compression stress–strain models [14,16,36].
Jcs 09 00318 g002
Figure 3. The uniaxial compression test setup used in this study.
Jcs 09 00318 g003
Figure 4. Stress–strain curves loaded in displacement for bauxite residue grades of (a) 0%; (b) 5%; (c) 10%; (d) 15%; (e) 20%.
Jcs 09 00318 g004aJcs 09 00318 g004b
Figure 5. Normalized stress–strain response.
Jcs 09 00318 g005
Figure 6. The pre-peak normalized stress–strain response and models for concrete having different bauxite residue replacement ratios: (a) 0%; (b) 5%; (c) 10%; (d) 15%; (e) 20% [14,16,36].
Jcs 09 00318 g006
Figure 7. The post-peak normalized stress–strain response and models for concrete having different bauxite residue replacement ratios: (a) 0%; (b) 5%; (c) 10%; (d) 15%; (e) 20% [14,16,36].
Jcs 09 00318 g007aJcs 09 00318 g007b
Figure 8. Average post-peak energy as a function of the bauxite residue replacement ratio (%).
Jcs 09 00318 g008
Figure 9. Average post-peak slope as a function of bauxite residue replacement ratio.
Jcs 09 00318 g009
Figure 10. Relationship between the parameter K and the post-peak slope.
Jcs 09 00318 g010
Figure 11. Validation of the proposed model and comparison with other models. Subfigures: (a) 0%, (b) 0%, (c) 5%, (d) 10%, (e) 15%, (f) 20% [16,36].
Jcs 09 00318 g011
Table 1. Composition of the tested concrete mixtures.
Percentage of Cement Replaced by BRCement (kg)Fine Aggregates (kg)Coarse Aggregates (kg)Bauxite Residue (kg)Water (L)
Reference concrete0%370.0767.51151.30166.5
Bauxite residue diameter <300 µm5%351.5766.01149.018.5169.0
10%333.0764.51146.537.0171.5
15%314.5762.71144.055.5174.0
20%296.0761.11141.674.0176.5
Note: For all mixtures, 1.000 L of air-entraining agent (Air-Extra), 0.925 L of dispersant (WR-75) and 0.650 L of superplasticizer (Eucon-37).
Table 2. Physical properties of the fresh concrete mixtures.
Percentage of Cement Replaced by BRSlump (mm)Air Content (%)Density (kg/m3)
0%836.002276
5%575.602310
10%645.702355
15%655.602296
20%885.902298
Table 3. Mechanical properties of concrete and the stress–strain curve parameters.
Percentage of Cement Replaced by BRTest f c (MPa) ε p (×10−3) E c (GPa)E′ (MPa)
0%131.91.5927.652.4
230.81.1735.296.6
330.51.1935.172.3
432.11.1937.3
5%135.31.3335.050.6
235.21.3135.676.0
335.02.0323.945.7
435.61.3833.759.2
10%137.41.7531.071.2
240.21.5435.855.2
339.61.4038.8100.1
438.61.1723.5
15%129.41.2532.625.0
229.51.3632.142.1
331.61.2837.345.3
431.61.2727.044.6
20%129.81.5042.346.0
231.31.2737.242.8
329.31.1834.151.9
432.01.3227.698.5
Table 4. Value of parameter n as determined from the experimental data (exp) with values of n predicted by the Popovics (Pop) and modified Popovics (PopM) models.
Percentage of Cement Replaced by BRTest f c (MPa)Optimal exp nPop-Predicted nPop/expPopM-Predicted nPopM/exp
0%131.883.473.440.992.680.77
230.813.563.390.952.610.73
330.514.373.710.852.590.59
432.085.594.190.752.690.48
5%134.552.973.031.022.830.95
235.333.593.240.902.880.80
335.163.653.600.992.870.79
434.962.983.041.022.860.96
535.574.234.311.022.890.68
633.723.273.501.072.780.85
10%137.392.912.941.013.001.03
240.223.283.291.003.170.97
338.163.613.150.873.040.84
439.573.673.691.013.130.85
536.562.242.321.042.951.32
638.566.185.680.923.070.50
15%129.272.843.001.062.520.89
229.403.652.710.742.530.69
329.543.043.351.102.540.84
431.615.874.330.742.660.45
531.563.843.841.002.660.69
20%129.843.353.310.992.560.76
229.813.372.940.872.550.76
331.302.963.131.062.640.89
429.282.893.011.042.520.87
532.013.393.461.022.680.79
Average 0.96 0.80
Standard deviation0.100.18
Disclaimer/Publisher’s Note: The statements, opinions and data contained in all publications are solely those of the individual author(s) and contributor(s) and not of MDPI and/or the editor(s). MDPI and/or the editor(s) disclaim responsibility for any injury to people or property resulting from any ideas, methods, instructions or products referred to in the content.

