Article

UV-Accelerated Aging of PLA and PP-Based Biocomposites: A Spectral and Colorimetric Study

1
Fiber Materials and Environmental Technologies Research Unit (FibEnTech-UBI), University da Beira Interior, R. Marquês D’Ávila e Bolama, 6201-001 Covilhã, Portugal
2
Forest and Paper Research Institute (RAIZ), R. José Estevão, Eixo, 3800-783 Aveiro, Portugal
3
The Navigator Company, Av. Fontes Pereira de Melo, 27, 1050-117 Lisboa, Portugal
*
Author to whom correspondence should be addressed.
J. Compos. Sci. 2025, 9(7), 317; https://doi.org/10.3390/jcs9070317
Submission received: 14 May 2025 / Revised: 29 May 2025 / Accepted: 10 June 2025 / Published: 22 June 2025

Abstract

In this work, biocomposites of polylactic acid (PLA) and polypropylene (PP) with micronized cellulose (MC) were produced by mold injection and subjected to accelerated aging with ultraviolet (UV) radiation. The tests took place over 10 weeks, during which the produced specimens were exposed to a total of 1050 h of ultraviolet light. During the UV aging test, images were captured, and spectral reflectance and colorimetric measurements were carried out on the specimens exposed to UV and on specimens of the same materials kept in the dark (originals). As expected, only residual color differences were observed in the original specimens with values of ΔE*ab always below 0.5. On the other hand, spectral reflectance and colorimetric changes were noticed over time in the specimens subjected to UV radiation. In particular, the values of ΔE*ab increased over time and were found to be higher for PLA with MC compared to PP with MC. Values of ΔE*ab = 4.7, 9.0, and 10.4 were obtained for weeks 1, 5, and 10, respectively, for the specimens of PLA with MC, whereas ΔE*ab = 4.5, 6.8, and 7.3 were obtained for weeks 1, 5, and 10, respectively, for the specimens of PP with MC. Therefore, it was found that the specimens of PLA with MC showed greater color fading compared to the specimens of PP with MC when subjected to UV exposure. In addition, it was also found in this work that besides the color differences noted in the tested specimens, those made of PP with MC also showed signs of surface damage.

1. Introduction

Biocomposites are a category of materials that combine two or more elements, with at least one of them being natural, to form a new material [1]. Biocomposites are usually made of one matrix element and one reinforcement element, which work together to provide a new material with better properties than either individual element alone [1]. Over the years, they have become very popular and, nowadays, they are widely used in many areas and applications, such as the automotive sector, aerospace, medical science, music, furniture, electronics, building and construction, agriculture, cutlery, packaging, and others [1,2,3,4,5,6,7,8].
There are various possible combinations of polymers that can be explored as matrix elements [1,2,3,4], and from the available options, polylactic acid (PLA) and polypropylene (PP) are two well-known thermoplastics commonly used and found in many everyday products [9,10,11,12,13]. As for the reinforcement element, many options are also available [2,4,12], and in particular, plant fibers (cellulose) have recently seen increasing demand due to their green and eco-friendly nature, abundance, and cost-effectiveness [2,4].
Biocomposites, as well as their individual components, are affected by the elements of nature, especially those designed to be used outdoors. In addition to the effects of erosion, mechanical forces, and exposure to humidity and water, sunlight affects biocomposites and many other materials to varying extents [14,15,16]. When sunlight reaches the surface of the Earth, it has already been absorbed and filtered by the atmosphere, ozone layer, clouds, and other elements that may be present in the air, allowing only a fraction of the total electromagnetic radiation emitted by the sun to pass through [17]. Of the entire solar radiation that reaches the Earth, the portion of it with the strongest irradiance corresponds to visible light, with wavelengths ranging from 400 nm to 760 nm, which comprises the radiation spectrum sensitive to our eyes. Infrared radiation (IR), with longer wavelengths and lower energy, has a wide range, from 760 nm to 1 mm, but it has a much lower irradiance compared to visible light. The last portion of solar radiation that reaches the surface of the planet is ultraviolet (UV) light, which has shorter wavelengths below 400 nm and is the most energetic of the three.
UV can be divided into three different classes: UV-A, from 315 nm to 400 nm; UV-B, from 280 nm to 315 nm; and UV-C, from 100 nm to 280 nm. It is believed that UV-C, the most dangerous of the three classes, is absorbed entirely or almost entirely by the ozone layer and does not reach the surface of the planet except for places located at high altitude [17]. However, the work of Herndon et al. [18] demonstrated that all wavelengths ranging from 200 nm to 400 nm reach the Earth’s surface, which is contrary to the widespread perception mentioned earlier. This is clearly a matter of great concern and high importance that should be thoroughly monitored now and in the coming years. As for the remaining two classes, UV-B and UV-A, the first is more dangerous than the second, and it is believed that they are both present on Earth in proportions of around 5% and 95% of the total UV radiation (excluding UV-C) [17]. Although updates to these figures might occur any time, it is clear that UV-A is by far the dominant UV class corresponding to the majority of the ultraviolet light present on Earth.
Another relevant remark about ultraviolet radiation is that it has both benefits and hazards for us all. For instance, in terms of health, it can stimulate the synthesis of vitamin D, which is beneficial for humans, but it can also cause direct damage to deoxyribonucleic acid (DNA) [17]. In materials and medical sciences, it can be used for the curing of coatings [19] or for the disinfection of equipment and reusable utensils [16,20], which is beneficial in a high number of applications, but it can also damage the structure of materials [14,15,16]. In this latter case, it should be noted that biocomposites and polymers in general are usually very much affected by UV through the process of photodegradation [21], as indicated and explored in several works that can be found in the literature [2,14,15,16,22,23,24,25,26,27,28,29,30,31,32,33,34,35,36,37,38,39,40].
In light of everything mentioned and the importance of studying how ultraviolet light affects everyday materials/products, the current work will also analyze how biocomposites deteriorate when exposed to UV radiation with a particular focus on three key points: (1) the specimens to be tested will be PLA and PP-based biocomposites, which are widely used in a variety of applications; (2) the experiments to be carried out will use the UV-A radiation class, which accounts for the majority of the ultraviolet light that exists on Earth; and (3) the analysis to be conducted will be based in the changes in spectral reflectance and colorimetric characteristics during the UV radiation tests.
Finally, the results obtained in this work will be thoroughly discussed and compared with the results and findings from other works, providing valuable information about the color changes as well as the overall appearance of two commonly used materials when exposed to accelerated aging.

2. Materials and Methods

2.1. Materials—Biocomposite Samples

Two different types of biocomposite specimens were produced by the industry through mold injection to be tested with our methodologies. For the first, we chose polylactic acid (MFI = 80 g/10 min at 210 °C/2.16 kg) as the matrix element and micronized cellulose as the reinforcement element, which was obtained by milling bleached eucalyptus kraft pulp (BEKP) on specialized equipment kindly provided by the Navigator Company (Aveiro, Portugal). For the second type, we chose polypropylene (MFI = 40 g/10 min at 230 °C/2.16 kg) as the matrix element, and for the reinforcement element, we used the same micronized cellulose plus a coupling agent of maleic anhydride modified polypropylene (MFI = 170 g/10 min at 190 °C/2.16 kg) and a processing additive of a blend of complex, modified fatty acid esters. For both biocomposites, the content of micronized cellulose was maintained at 30 wt.%.
To simplify the reading of the article, from here on, the two produced biocomposites will be referred to as PLA + MC and PP + MC.

2.2. Methods—Biocomposite Manufacturing

The preparation of the biocomposites was carried out using a co-rotation extruder ZSE 35 iMAXX–48 D from Leistritz (Nuremberg, Germany) with a double interpenetrating spindle (L/D = 48, spindle diameter 35 mm), three feeders, and an underwater granulator. The temperatures of the different extrusion zones ranged from 160 °C to 180 °C for the PLA + MC and from 160 °C to 175 °C for the PP + MC. The screw speed was maintained at 135 rpm.
Their injection was performed with a Victory 80T machine from ENGEL (Schwertberg, Austria) to produce rectangular specimens (dimensions: 80 mm length, 10 mm width, 4 mm thickness) and dog-bone specimens (dimensions: 170 mm total length, 30 mm length of grip section, 20 mm width of grip section, 10 mm width of gauge section, 4 mm thickness), using pellets dried before injection at 80 °C for 6 h in the case of the PLA + MC and at 115 °C for 3 h in the case of the PP + MC. The injection temperatures ranged from 170 °C to 210 °C for the PLA + MC and from 160 °C to 190 °C for the PP + MC, while the mold temperature was kept at room temperature.
Four different sets of specimens were taken into consideration in the experimental assays. Two of the four sets consisted of PLA + MC, while the other two consisted of PP + MC. One of each was kept in the dark for the entire duration of the assays (original specimens), and they were only removed from the dark when measurements needed to be taken. The two remaining sets, one made of PLA + MC and the other of PP + MC, were placed inside the UV chamber to undergo accelerated aging.

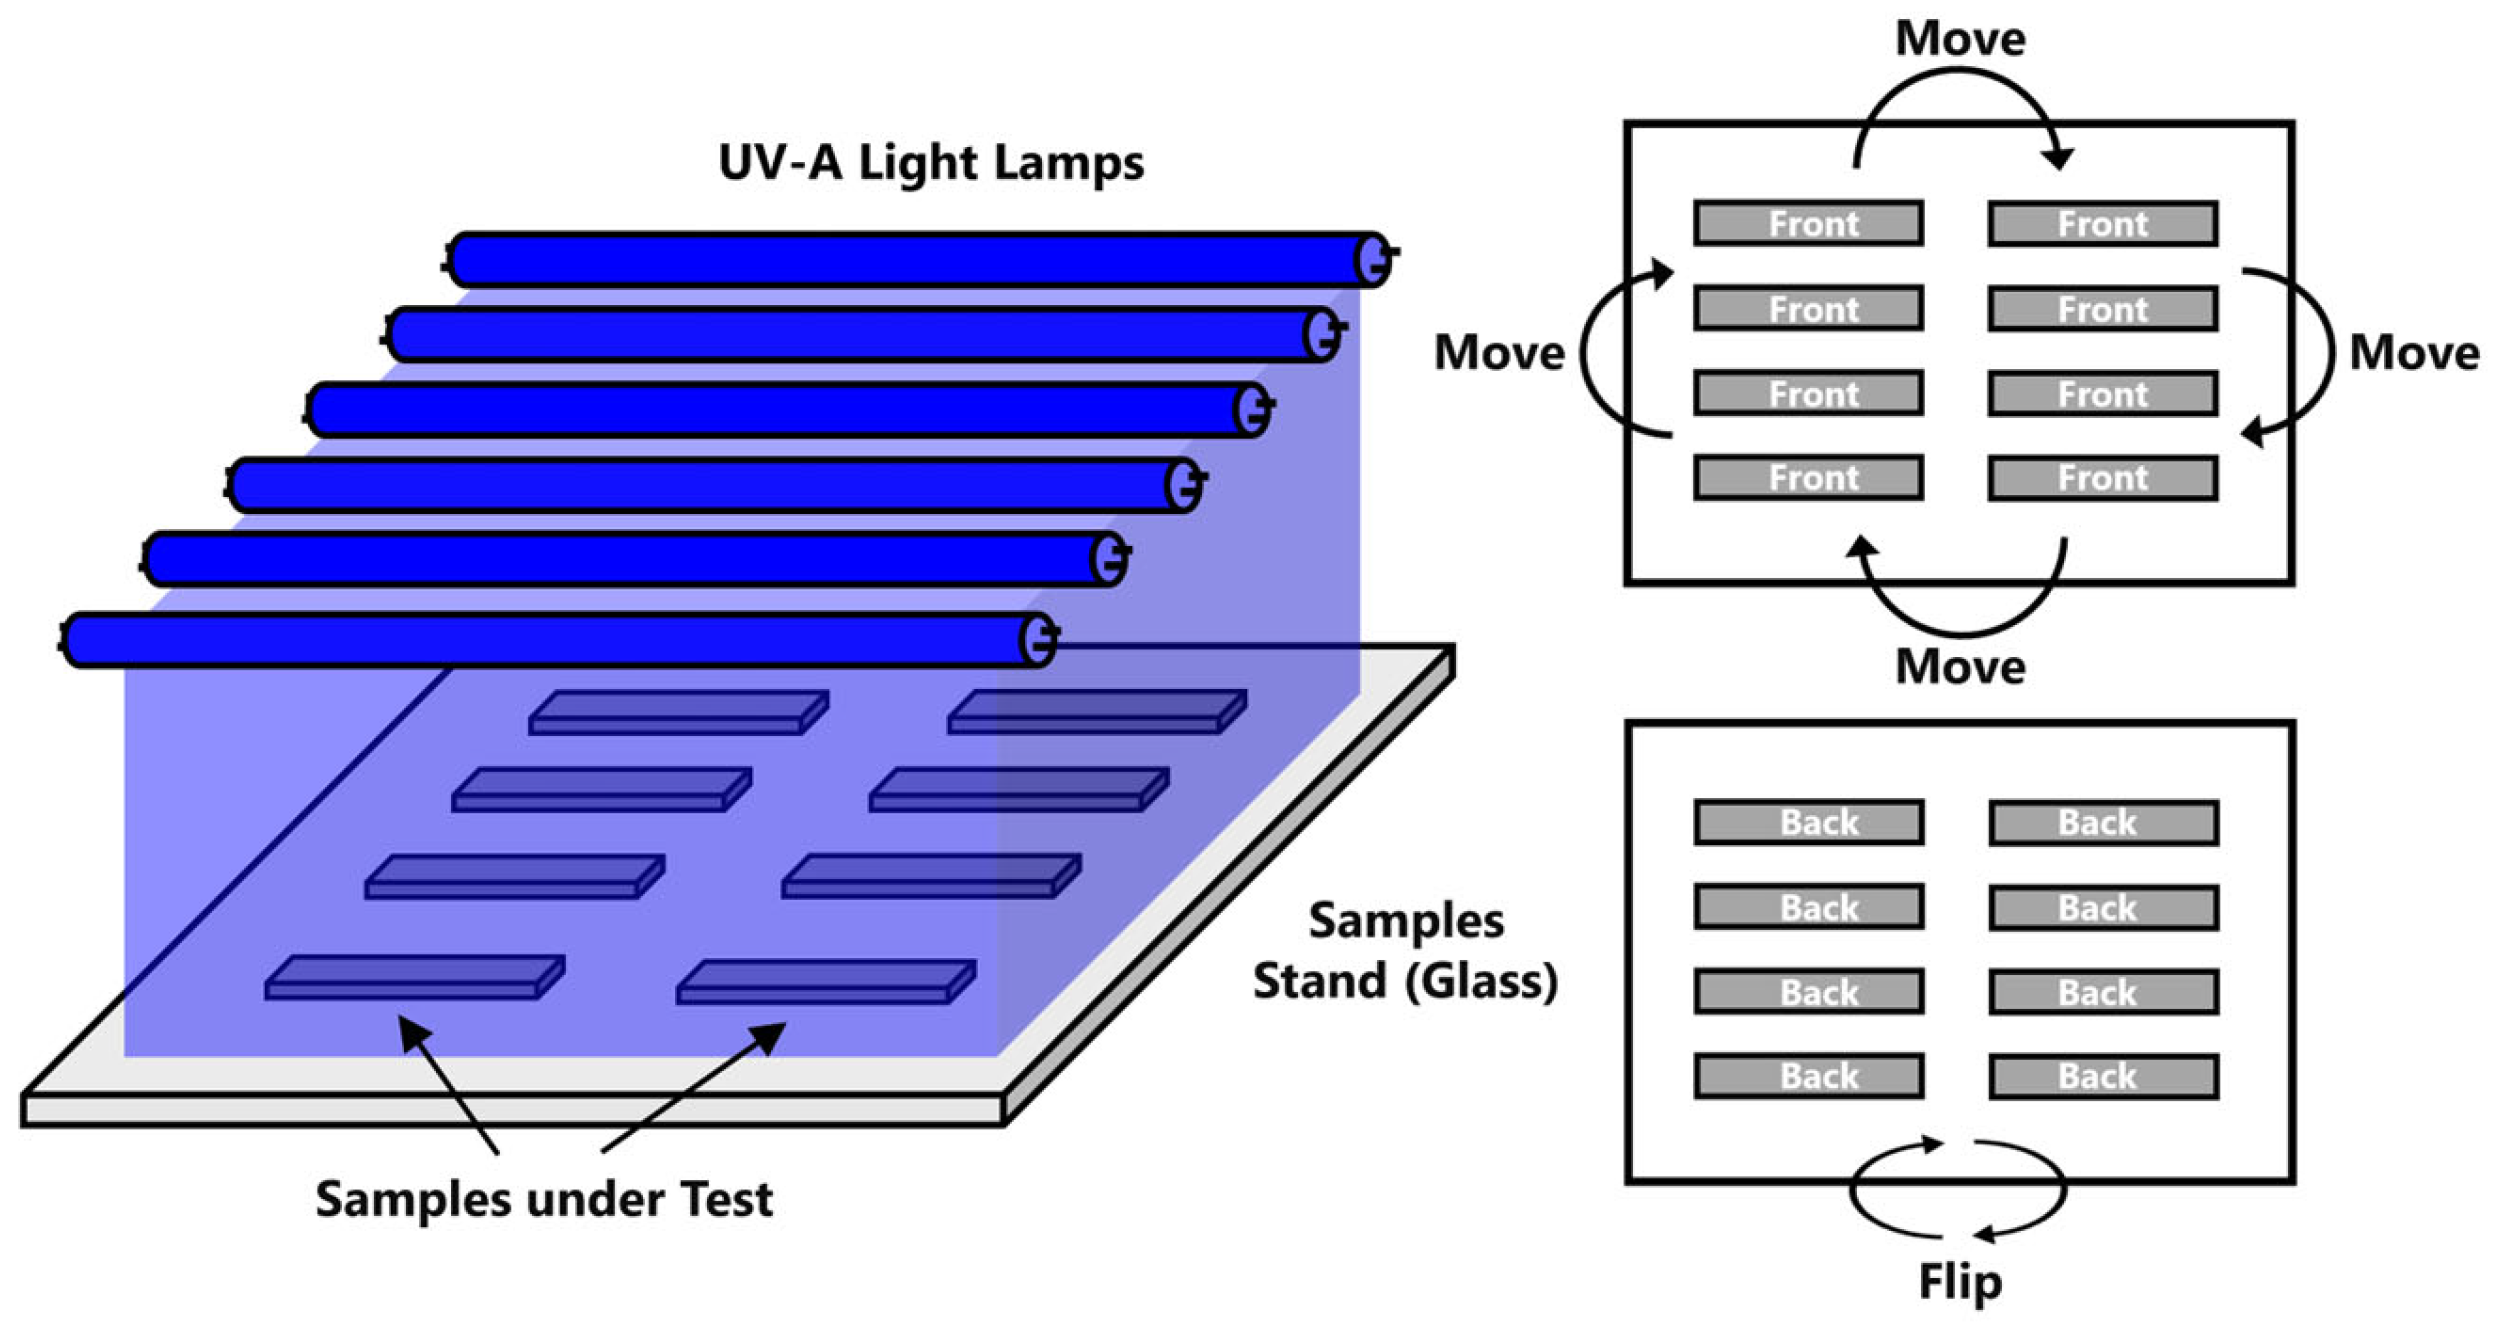
2.3. Methods—UV Aging Chamber

The aging chamber used in our experiments, model IV 43 DF from CITEL (Paris, France), allowed to illuminate the specimens with UV light, subjecting them to accelerated aging for comparison with the original specimens kept in the dark. The experiments that were conducted were based in the recommendations of ISO 4892-1 [41] and ISO 4892-3 [42]. A diagram of the chamber used in the experiments is shown on the right side of Figure 1, displaying its main components, namely, six UV-A light lamps of 15 Watts each, T8 15W BL UV-A G13 Luxtek from Fillday (Vila Nova de Famalicão, Portugal), which illuminated the specimens from above, and the samples stand, made of glass, on which the specimens were conveniently positioned inside the chamber. Figure 1 also shows the approach followed to achieve uniform irradiation on all samples inside the chamber throughout the test. Specifically, the samples were systematically moved clockwise to occupy each location on the samples stand. Additionally, the samples were flipped in the stand to ensure direct irradiation from both the front and back.
The UV aging chamber may have also been used to illuminate the samples from both the top and bottom sides. However, only the top side was considered in our experiments for three main reasons: (1) to ensure that the samples are primarily illuminated with direct light (they also receive light from below through reflections that reach the samples from the glass but at a lower percentage); (2) to ensure that the samples are exposed to an adequate amount of UV-A radiation inside the chamber (the total wattage of the UV lamps was 6 × 15 = 90 Watts, resulting in a UV-A irradiance of approximately 45 W/m2); (3) to maintain the temperature inside the chamber at acceptable levels without exposing the specimens to excessive heat.
In relation to the third point, additional information must be provided regarding the operational procedure adopted in the experiment. Specifically, the specimens were exposed to UV-A radiation for a period of ten weeks (total exposure of 1050 h) considering alternating cycles of light and dark. Four light cycles of 4 h, 4 h, 4 h, and 3 h were planned per day, which were alternated with four dark cycles of 1.5 h, 1.5 h, 2 h, and 4 h. The need for a 4 h dark cycle for the proper measurement of all the samples required the other three dark cycles to be adjusted and shortened. During a light cycle, the temperature inside the chamber was 43 ± 2 °C. Conversely, during a dark cycle, the temperature inside the chamber was 24 ± 1 °C. Neither ventilation nor added humidity were considered in the experiments: only the light emitted by the UV-A lamps and the natural heat they generated.

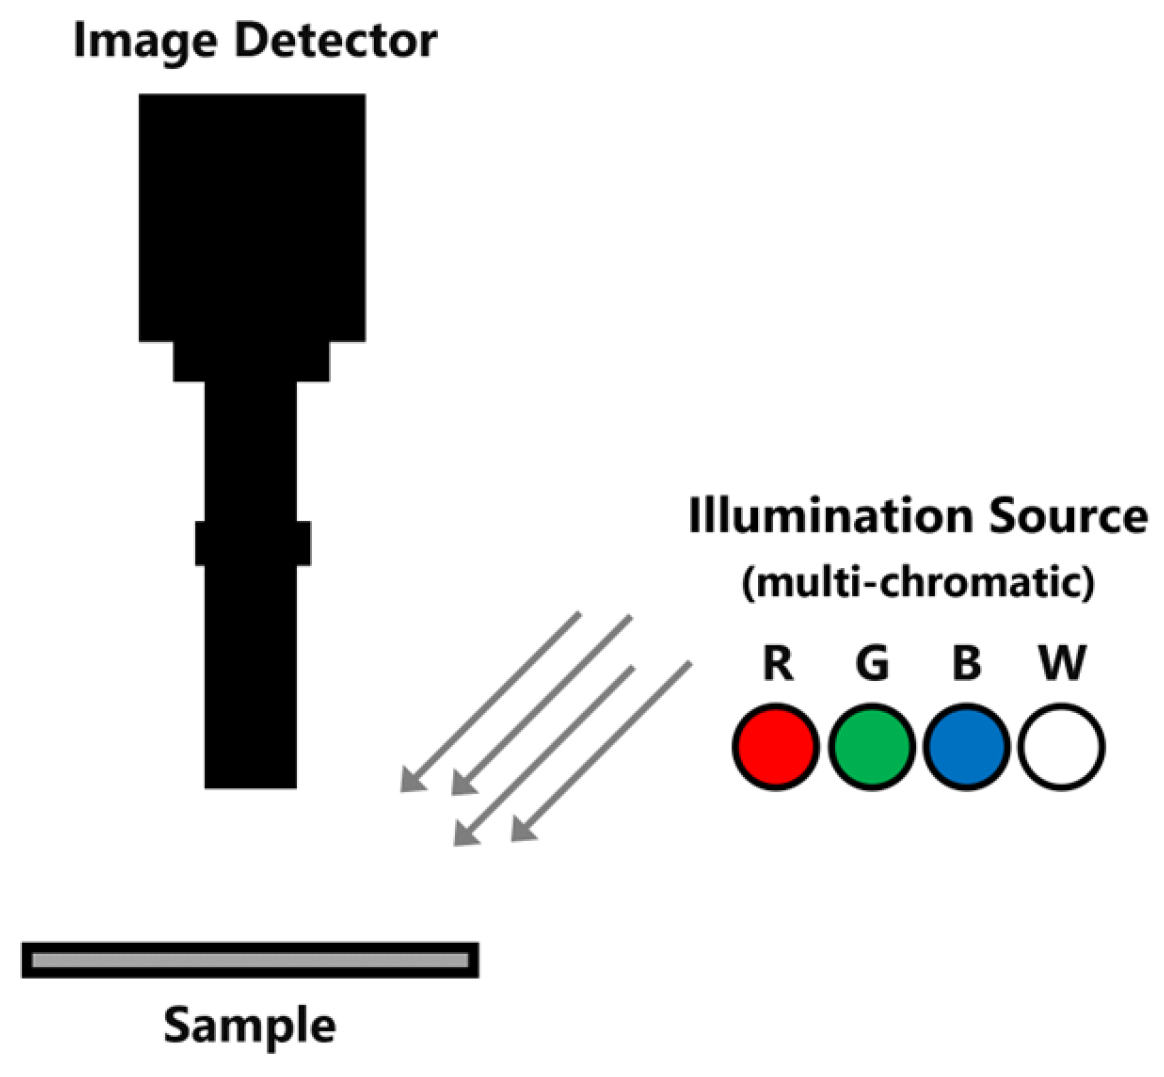
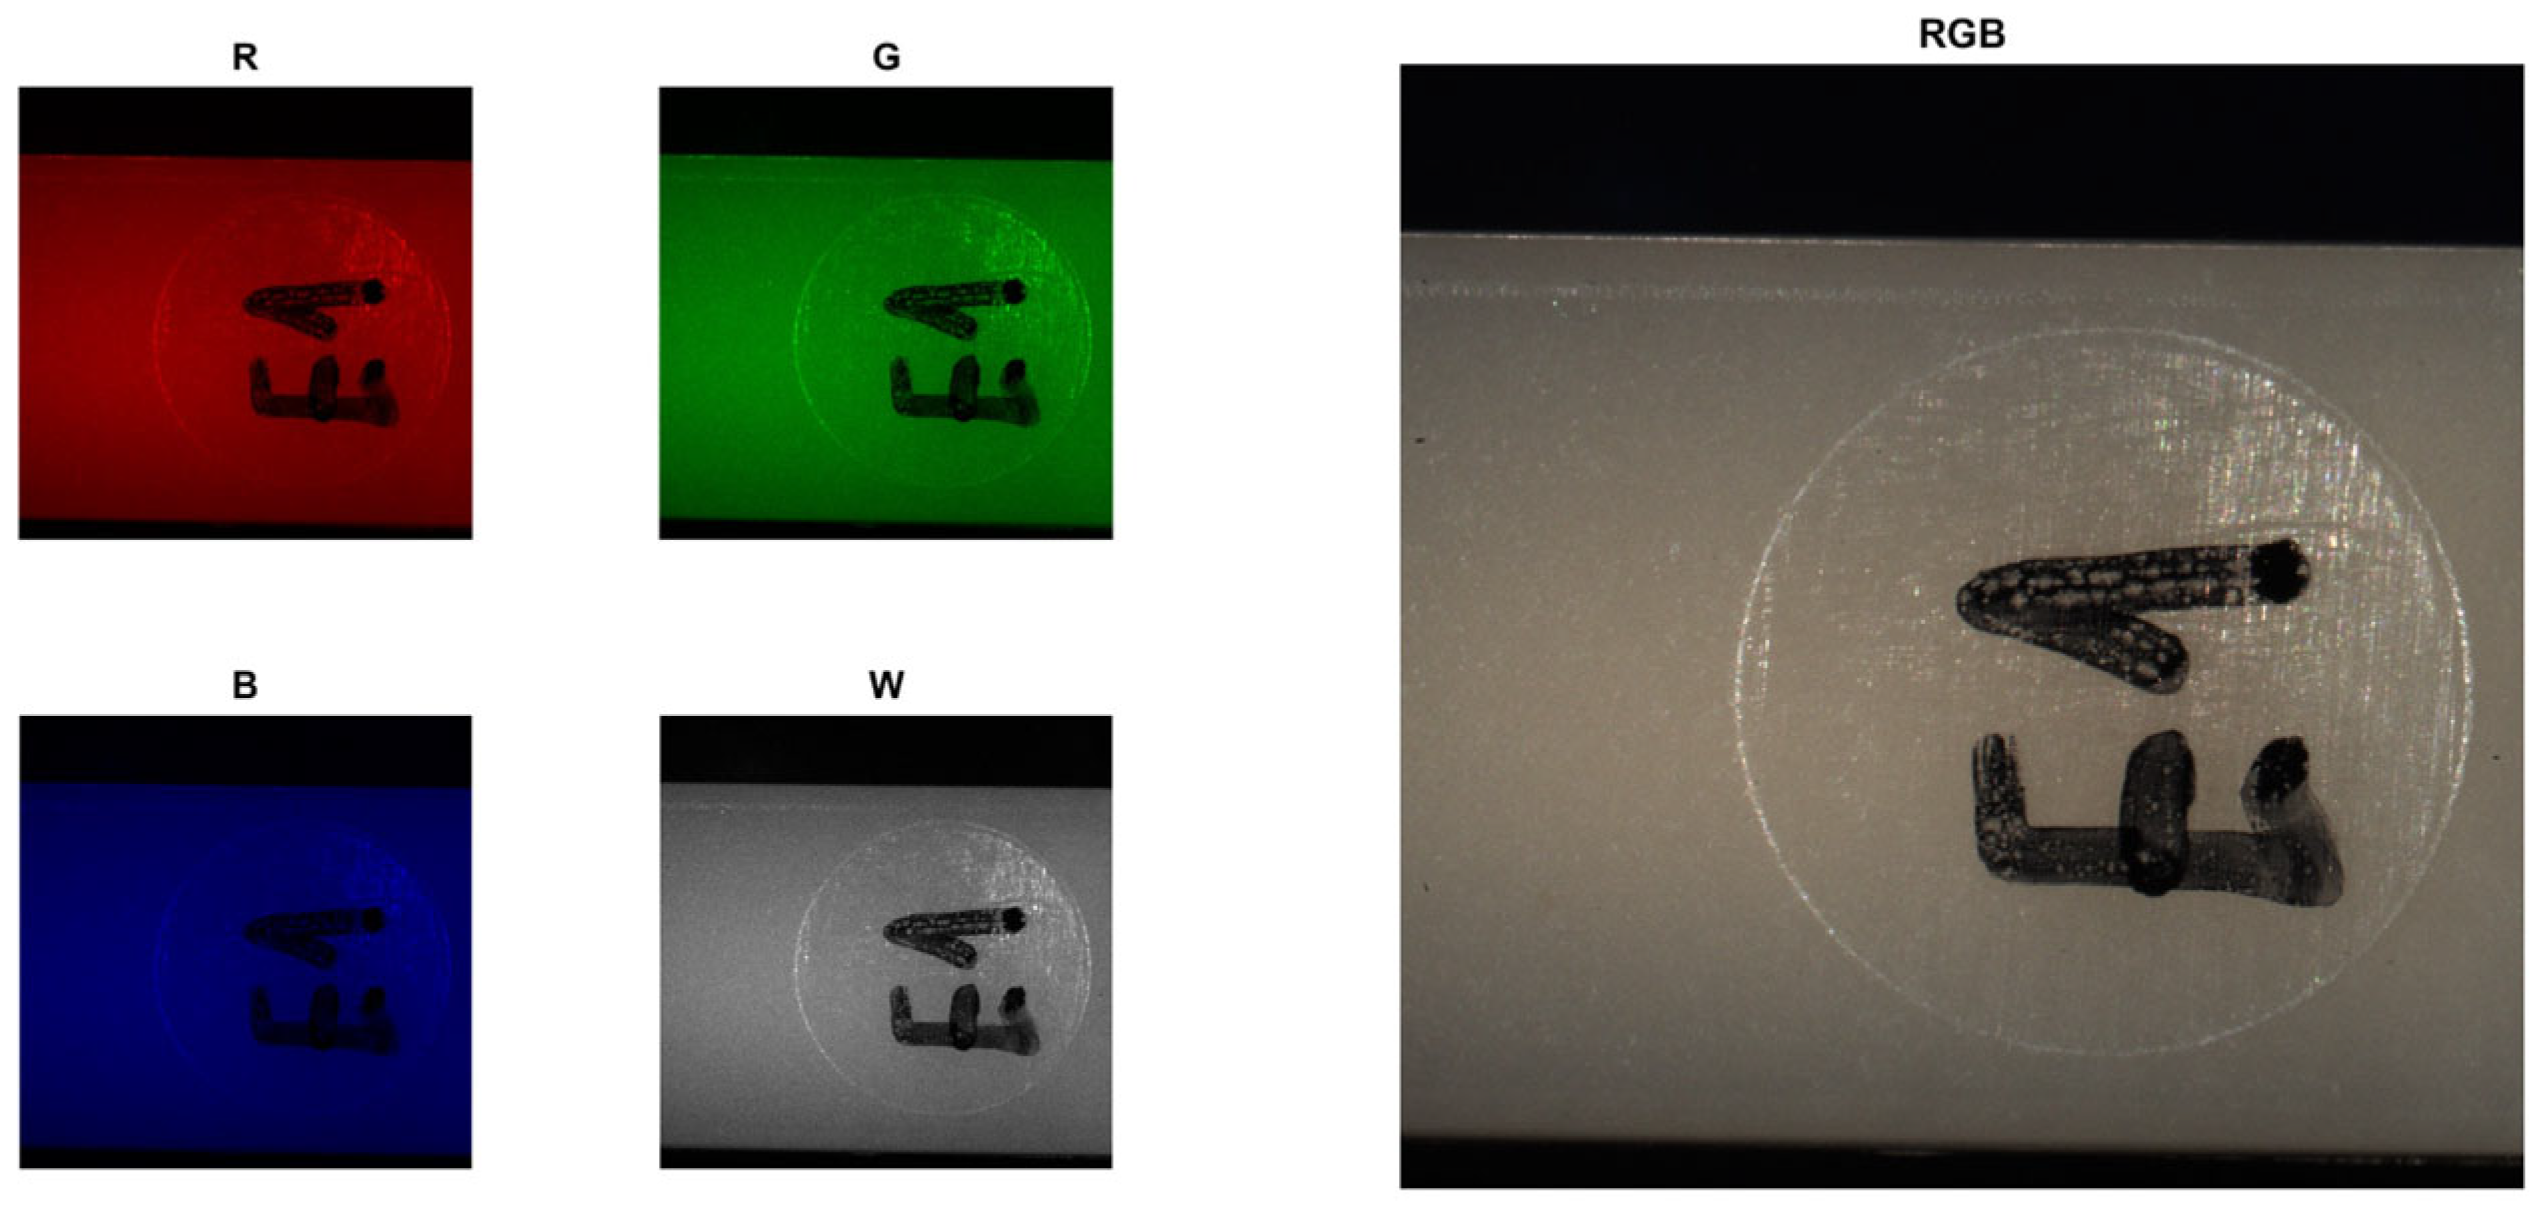
2.4. Methods—Optical System

Images of the PLA + MC and PP + MC specimens were acquired using a customized optical system with multi-chromatic LED lighting. A diagram of the used optical system is shown in Figure 2, displaying its main components: namely, an image detector Alvium 1800 U-2040m from Allied Vision (Stadtroda, Germany), a controlled illumination source composed of an LED lamp Parathom Pro from OSRAM (Augsburg, Germany), and a motorized wheel filter USFW-100 from Newport (CA, USA). This system captures a sequence of images by illuminating the sample with red (630 nm), green (530 nm), blue (460 nm) monochromatic light, and white (400–780 nm) polychromatic light.
The specimens kept in the dark and those exposed to UV radiation were inspected with this system for comparison purposes. The various images obtained in the process are presented and can be consulted in Section 3 of this article.

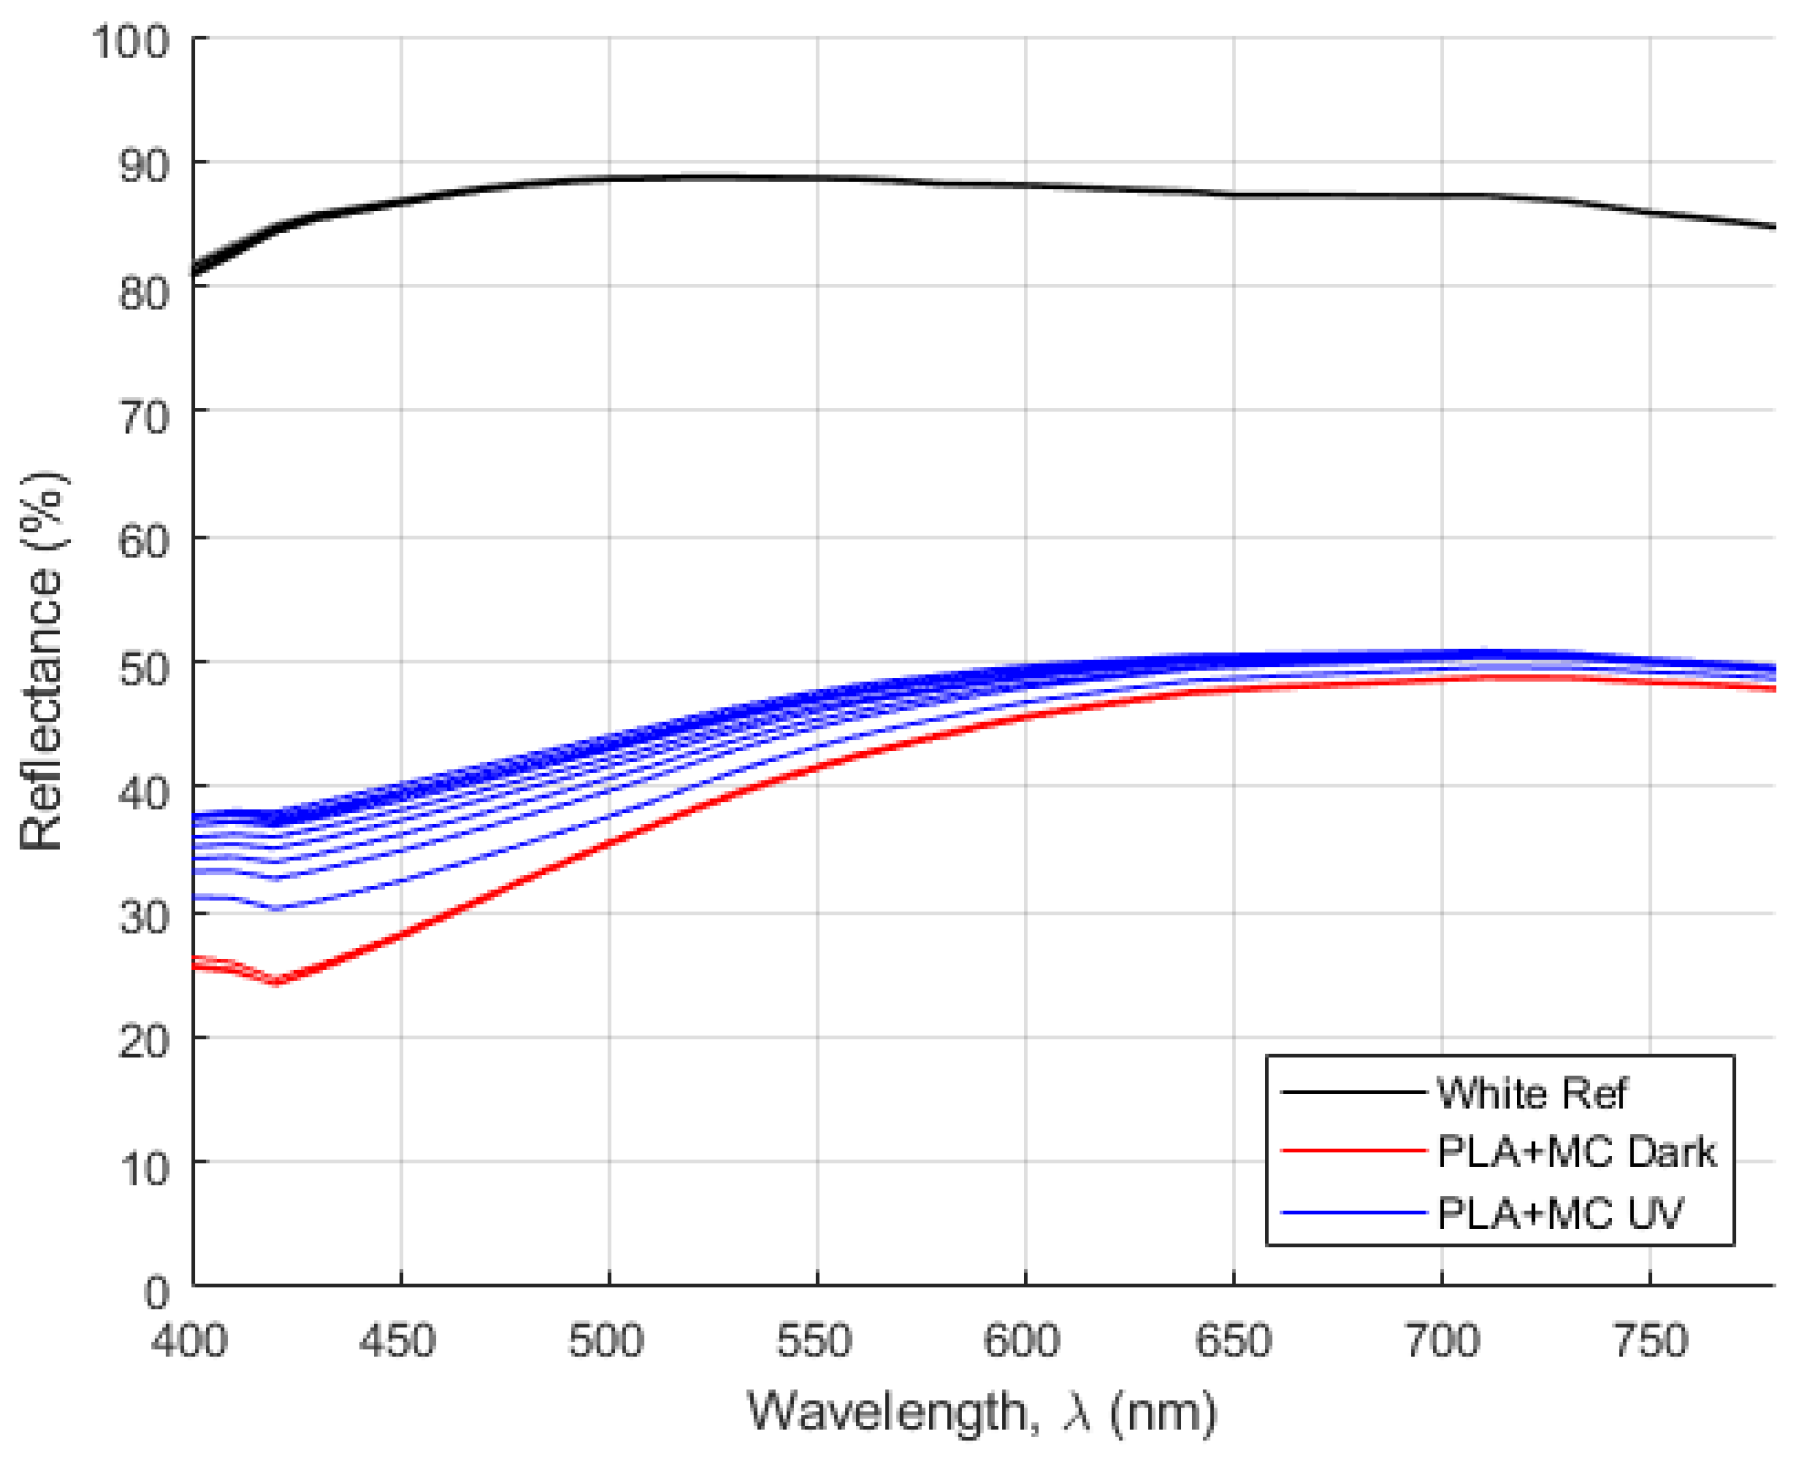
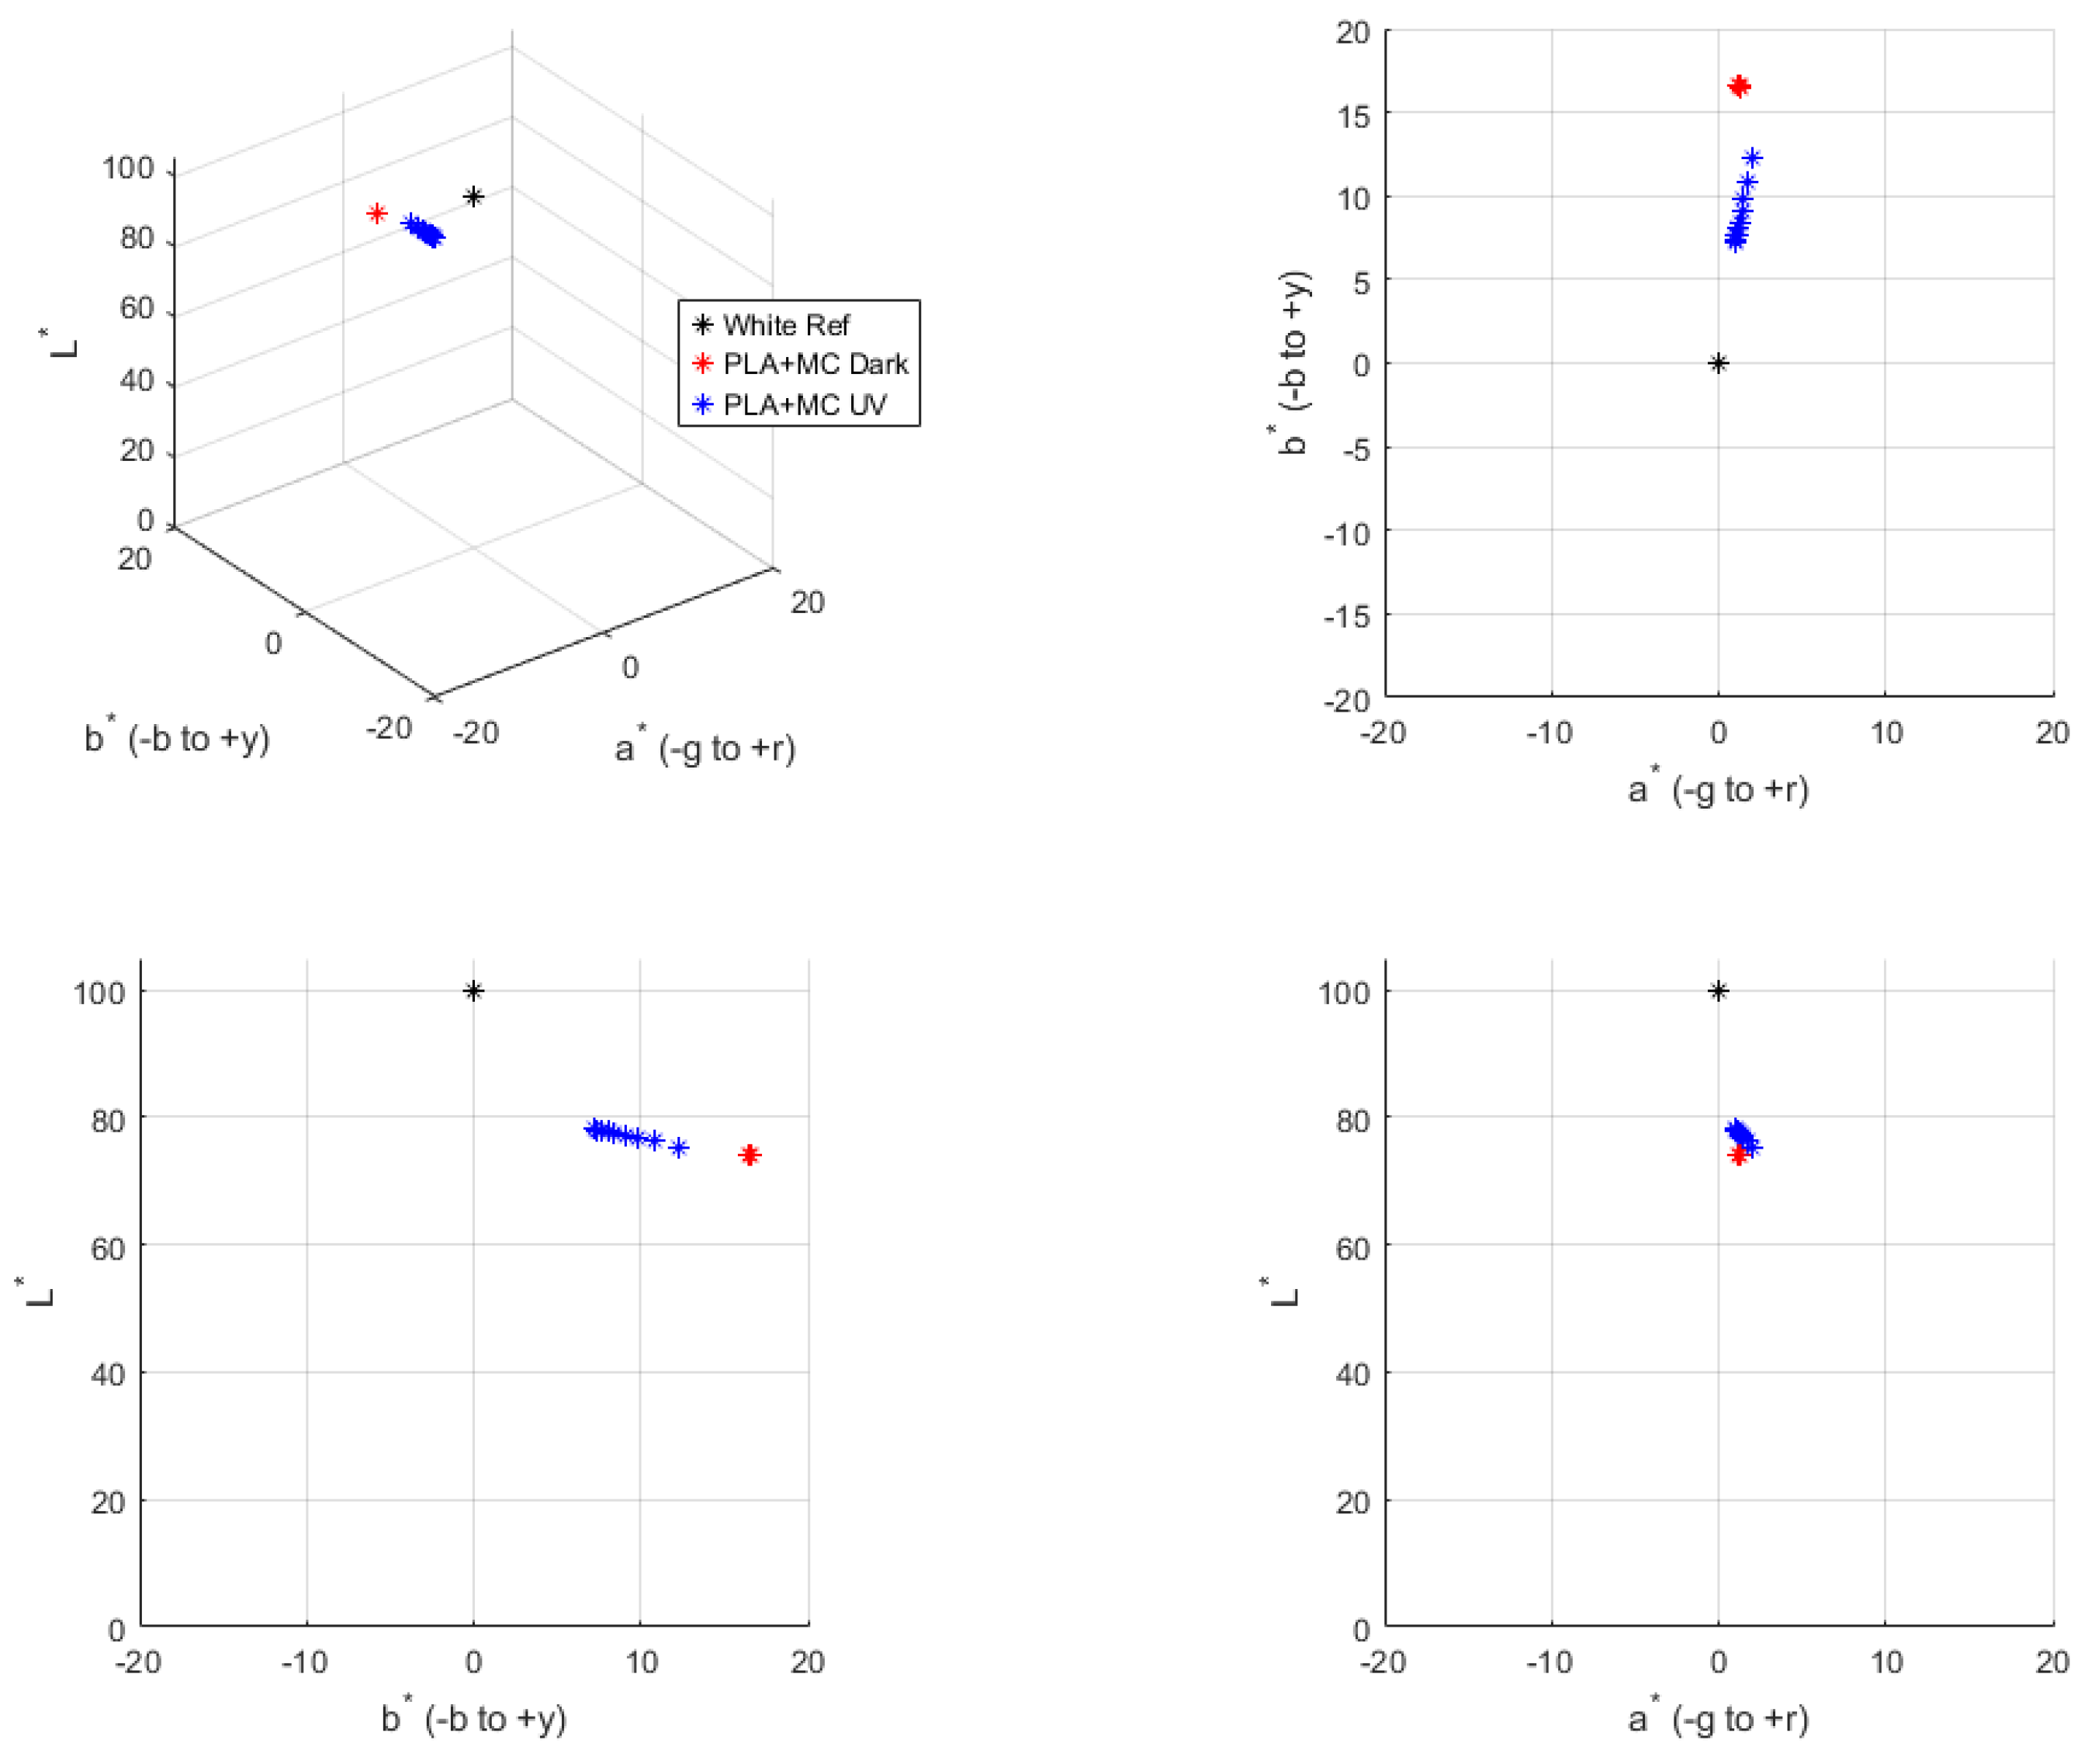
2.5. Methods—Spectrophotometer

Throughout the entire duration of the UV accelerated aging test, spectral reflectance and colorimetric measurements in the color space CIE 1976 L*a*b*, ISO/CIE 11664-4 [43] were conducted on the tested specimens. These measurements were used to track any potential changes on the specimens from the beginning of the test to its conclusion. L* denotes lightness, whereas a* and b* denote color coordinates (a* is related with the opponent colors red–green; b* is related with the opponent colors blue-yellow). For this part of the experiment, a spectrophotometer, model Chroma Sensor CS-5, and the corresponding white calibration standard from Datacolor International (Zurich, Switzerland) were used. A simplified diagram of the equipment is shown in Figure 3, displaying its main components. Namely, an illumination source emits light to an integrating sphere that will then pass through two openings: one where the sample is placed and the other which is connected to an array of detectors. All the light collected by the sphere is ultimately decomposed into several spectral bands (400 to 780 nm with a 10 nm step), allowing the measurement of the spectral reflectance distribution of the samples, as well as the corresponding colorimetric data, expressed in the CIE 1976 L*a*b* color space, using the standard illuminant D65 [44] for a standard observer of 2°.
The principal results obtained with this equipment for all specimens of PLA + MC and PP + MC are presented in the following section.

3. Results and Discussion

Images of the specimens of PLA + MC and PP + MC that were stored in the dark (original specimens), as well as those exposed to UV radiation, were captured using the optical system described in Section 2.3. Figure 4, Figure 5, Figure 6, Figure 7, Figure 8, Figure 9, Figure 10, Figure 11, Figure 12, Figure 13, Figure 14 and Figure 15 show the images obtained throughout the entire test period (10 weeks). The left side of the figures shows the images of the individual components of the samples (R—red, G—green, B—blue, and W—white), while the right side shows the corresponding full color images (RGB), resulting from the combination of the different individual components.
Through analysis of the images obtained with the optical system, it can be seen in Figure 4, Figure 5 and Figure 6 that no changes are detected in the appearance of the specimens of PLA + MC kept in the dark (original specimen) for the entire period of the test [45]. Furthermore, the same can also be observed in Figure 7, Figure 8 and Figure 9 regarding the appearance of the specimen of PP + MC kept in the dark (original specimen) [45]. For the specimens of PLA + MC exposed to UV radiation, images of one of the specimens are presented in Figure 10, Figure 11 and Figure 12 for the same three moments. In this case, changes can clearly be seen in the specimen, which is lighter at the end of the UV test (whitish appearance noted over time) [45]. The last three figures of the set (Figure 13, Figure 14 and Figure 15) show the images obtained for one of the specimens of PP + MC exposed to UV radiation at the beginning, middle and end of the UV test. In this case, changes were also noted in the specimen. In addition to becoming lighter at the end of the UV test (whitish appearance noted over time) [45], the PP + MC specimen also seemed to experience more surface damage, showing a rougher surface and slight crazing [45]. These findings are consistent with other studies that indicated polypropylene as being more susceptible to embrittlement and fractures [21,35]. The study of Niu et al. [23] is particularly interesting because they also investigated accelerated fragmentation of the same thermoplastics (PLA and PP) that were considered in the current study. In their study, they used UV radiation ranging from 300 nm to 400 nm, primarily in the UV-A class, with an irradiance of 60 W/m2. Additionally, they immersed the samples in seawater. After 57 and 76 days of UV exposure, they observed cracks forming on the surface of polypropylene but not on polylactic acid. They also found that polylactic acid released fewer microplastics than polypropylene, indicating that it was more resistant to fragmentation.
During the entire UV accelerated aging test, spectral reflectance and colorimetric measurements were also carried out with the spectrophotometer described in Section 2.4. The results obtained here are presented in Figure 16, Figure 17, Figure 18 and Figure 19.
Through analysis of the measurements carried out with the spectrophotometer equipment, the specific characteristics of each tested sample can be immediately evidenced in the graphs. In particular, it can be seen in Figure 16 that all the spectral reflectance curves of the white reference, identified in the graph as “White Ref”, are very similar. Many of the lines are overlapping, creating the thick black line at the top of the graph. This suggests that the equipment used is highly reliable, as it did not show relevant deviations in the measurements obtained throughout the entire test period. In Figure 16, three red lines can also be seen very close to each other, corresponding to the spectral reflectance curves of the PLA + MC kept in the dark (original specimens), which are identified in the graph as “PLA + MC Dark”. The three curves represent the three moments at which the PLA + MC Dark was measured: beginning of the test (week 1—DK 01), at the middle (week 5—DK 05), and the end (week 10—DK 10). Since these three red curves are very similar, it indicates that the PLA + MC specimens stored in the dark did not experience relevant spectral reflectance and color changes throughout the entire test period. Finally, the blue lines in the graph of Figure 16, identified as “PLA + MC UV”, correspond to the spectral reflectance curves of the PLA + MC specimens that were exposed to UV radiation. There are ten different curves on the graph representing the various moments (10 weeks—WK 01 to WK 10) when these samples were measured. The blue curves are all located above the red curves, showing a tendency of approximation toward the white reference. This indicates a color fading or a lighter appearance of the samples over time [45]. The same observation can also be made in the graphs of Figure 17 in the CIE 1976 L*a*b* color space [43], which show the blue spots moving toward the black spot of the white reference (L* = 100, a* = 0, b* = 0).
Figure 18 and Figure 19 present exactly the same but in this case for the PP + MC specimens instead of the PLA + MC specimens. The conclusions drawn earlier are equally valid for the PP + MC specimens. However, there is one difference between the samples that must be highlighted. In particular, the blue curves shown in Figure 18 and the blue dots shown in Figure 19 are closer to each other compared to the PLA + MC case. This means that the PP + MC specimens showed less dispersion in the spectral reflectance and colorimetric results throughout the entire UV test period, indicating that they experienced less color fading.
All of the effects mentioned above can also be observed through the corresponding color differences (ΔL*, Δa*, Δb*, ΔE*ab) [43] calculated for the two types of biocomposites tested (PP + MC and PLA + MC) stored in the dark and exposed to UV radiation. These results are summarized in Table 1 and Table 2 (results are shown in Table A4 and Table A5 of Appendix A).
The tables reveal that in fact, the specimens stored in the dark consistently show low color differences, with ΔE*ab values always below 0.5. As for the specimens exposed to UV radiation, they exhibit increasing ΔE*ab values over time. For PLA + MC, the values are higher compared to PP + MC with values of 4.7, 9.0, and 10.4 for weeks 1, 5 and 10 in the first case and values of 4.5, 6.8, and 7.3 for weeks 1, 5 and 10 in the second case in comparison to the corresponding specimens stored in the dark. DK 01 was selected for the calculations mentioned above, although any of the three (DK 01, DK05 or DK10) could have been used as they are all similar and would not have affected the final results.

4. Conclusions

In this work, biocomposites of two commonly used thermoplastics, polylactic acid (PLA) and polypropylene (PP), were examined for their resistance to ultraviolet (UV) light. They were exposed to a total of 1050 h of UV-A radiation, and were analyzed by image, spectrally and colorimetrically. The specimens exposed to UV radiation were then compared to specimens of the same materials stored in the dark.
In our experiments, the following was found:
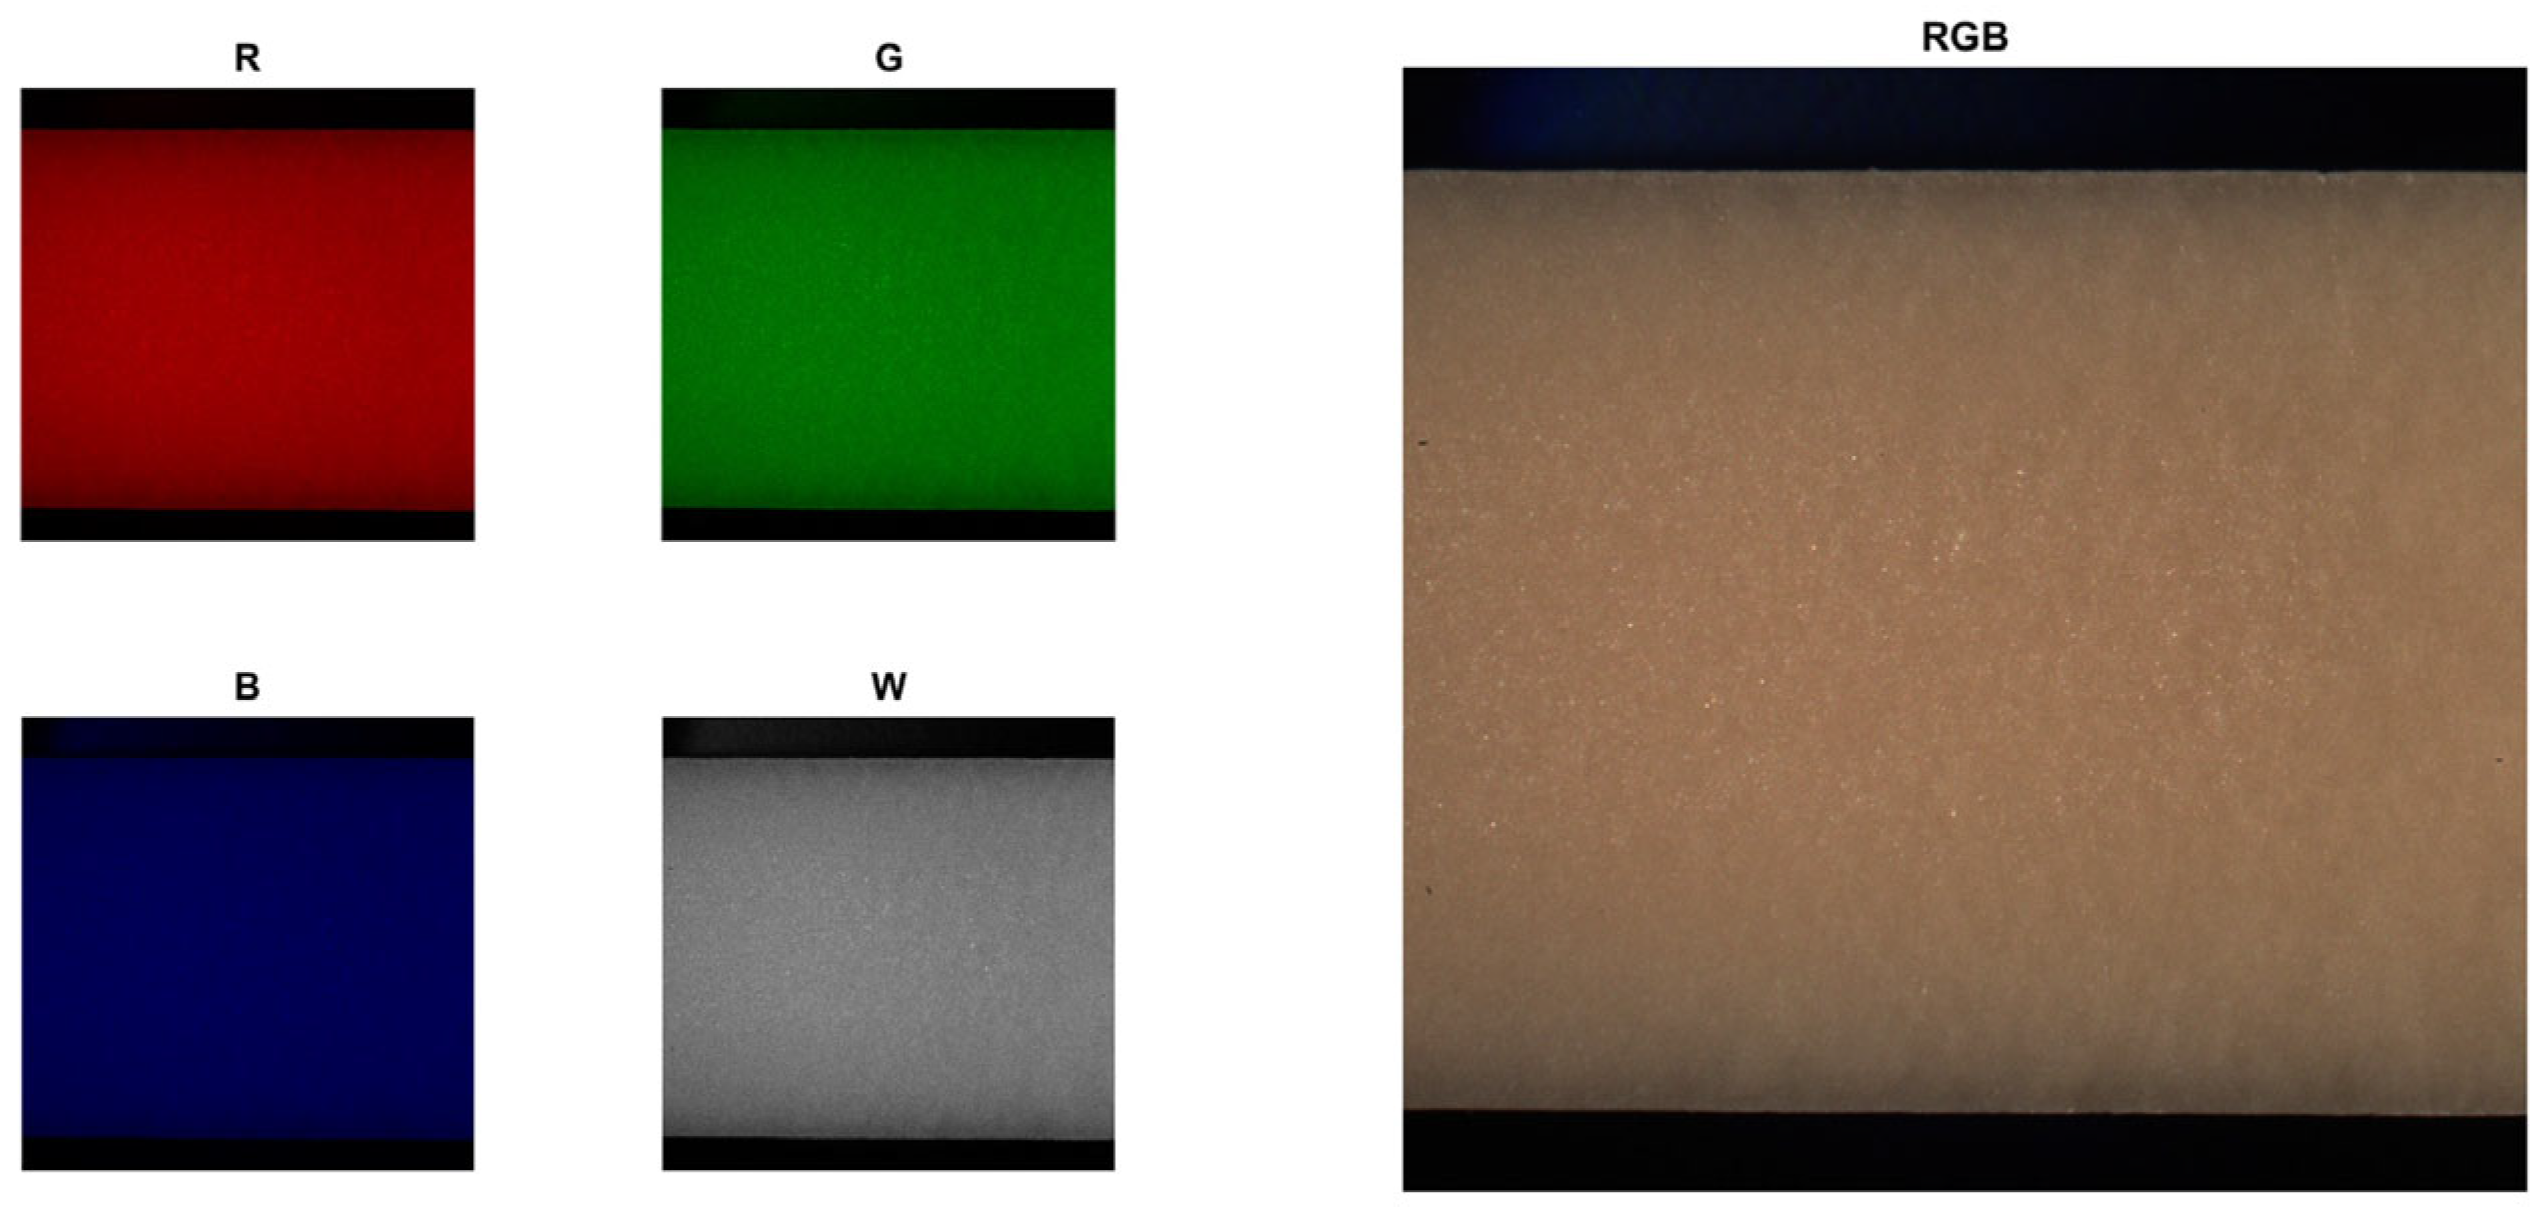
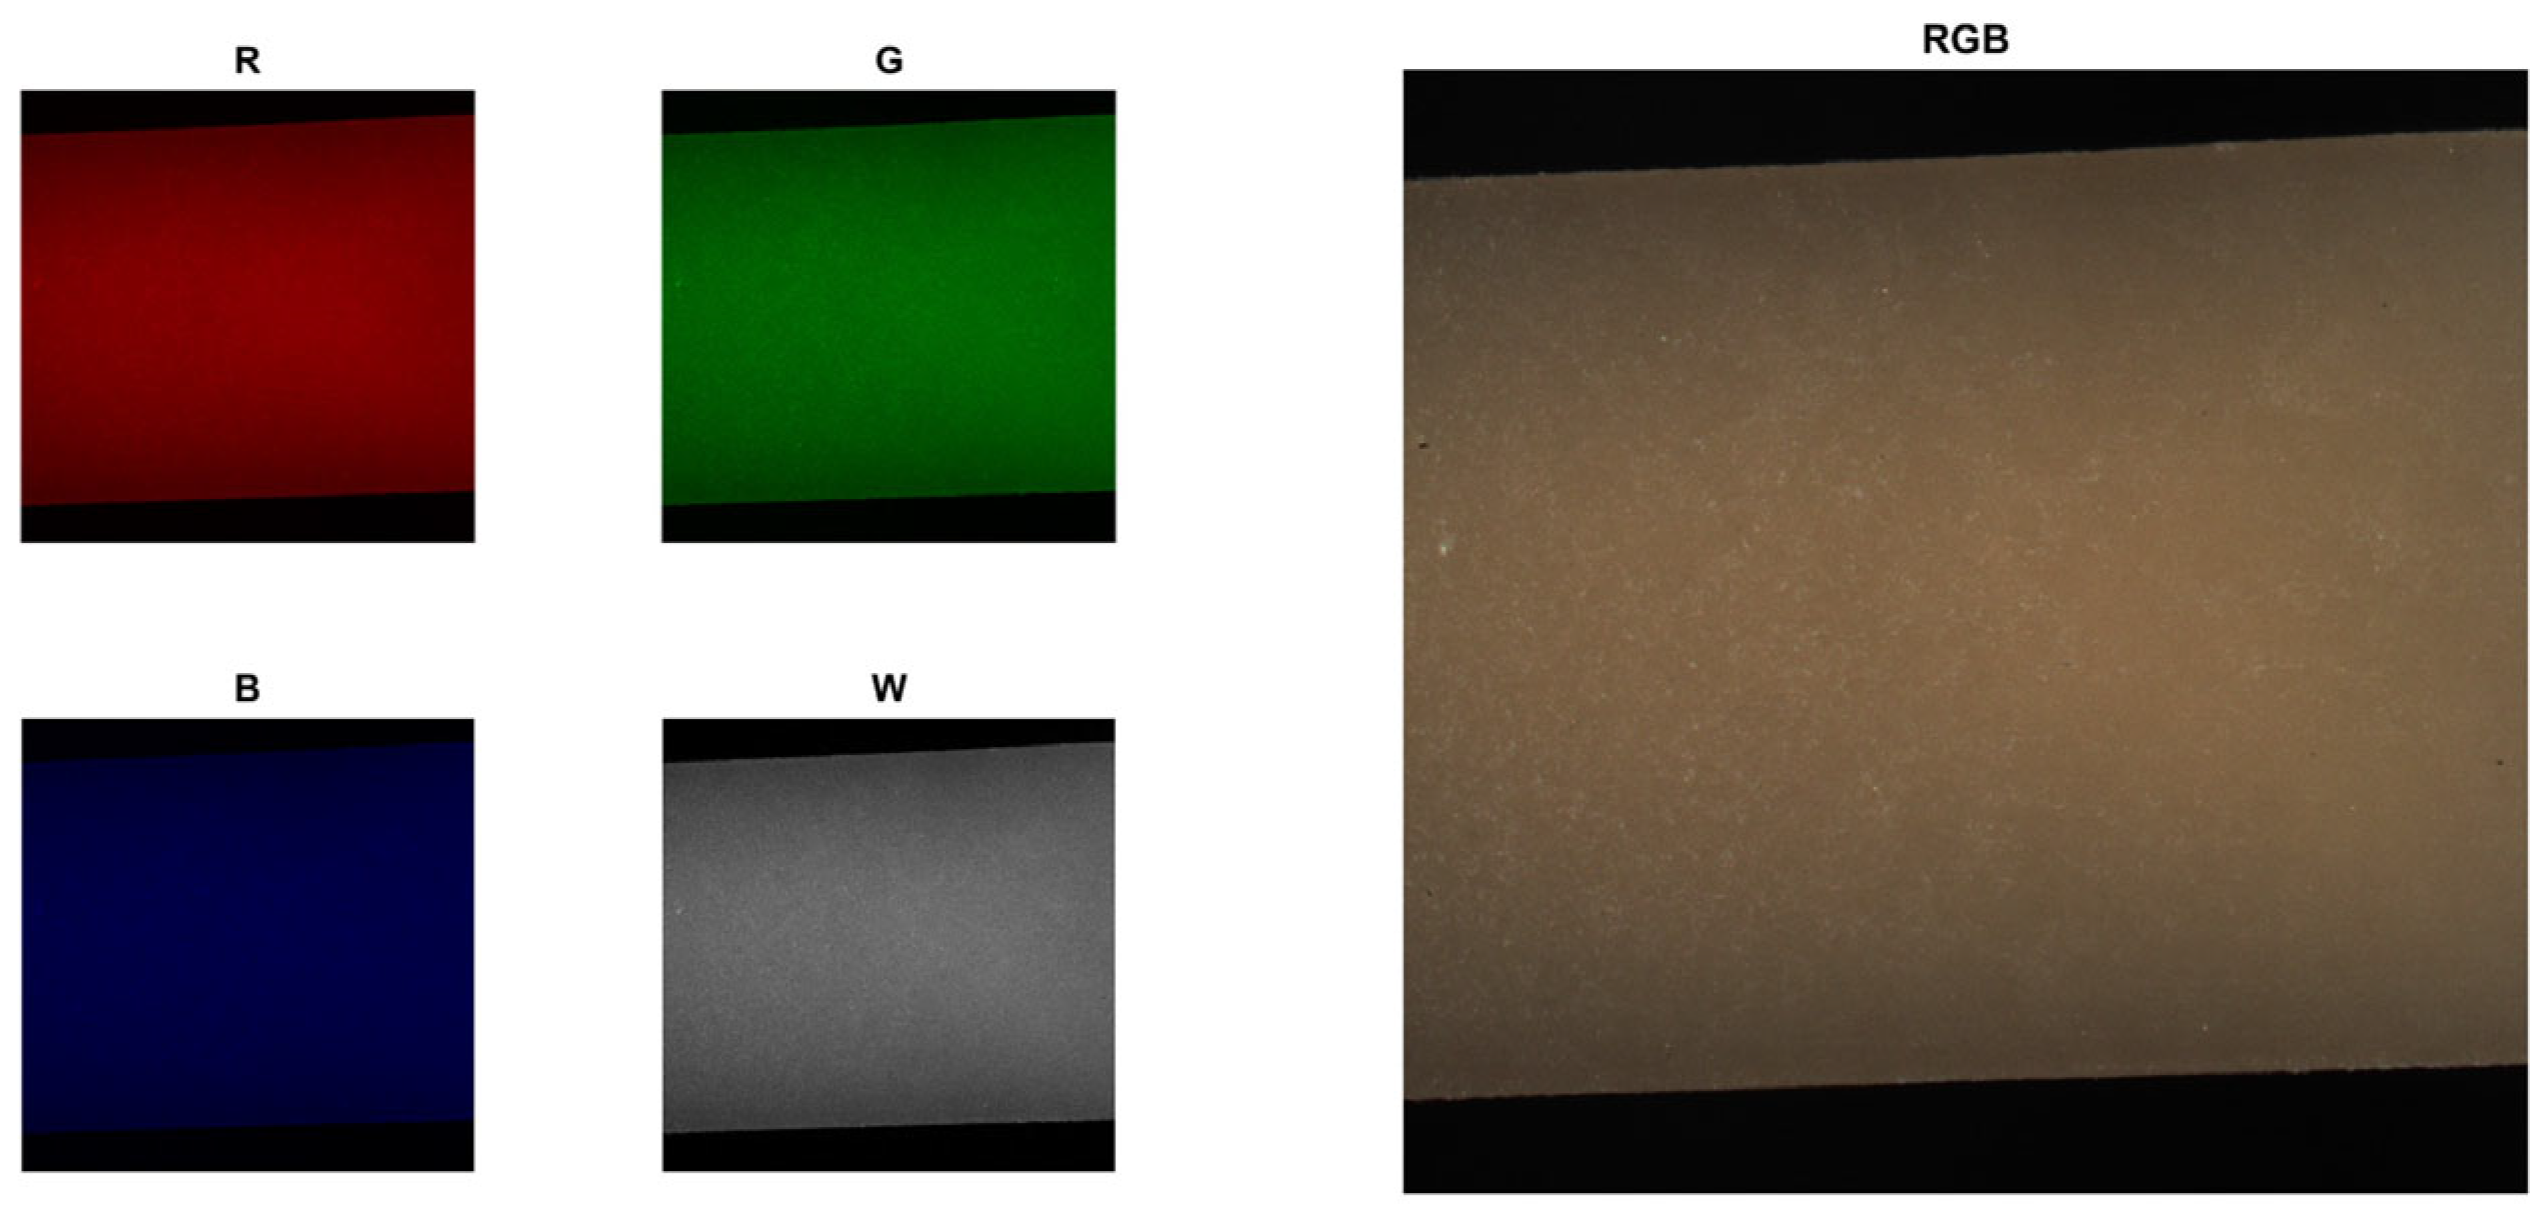
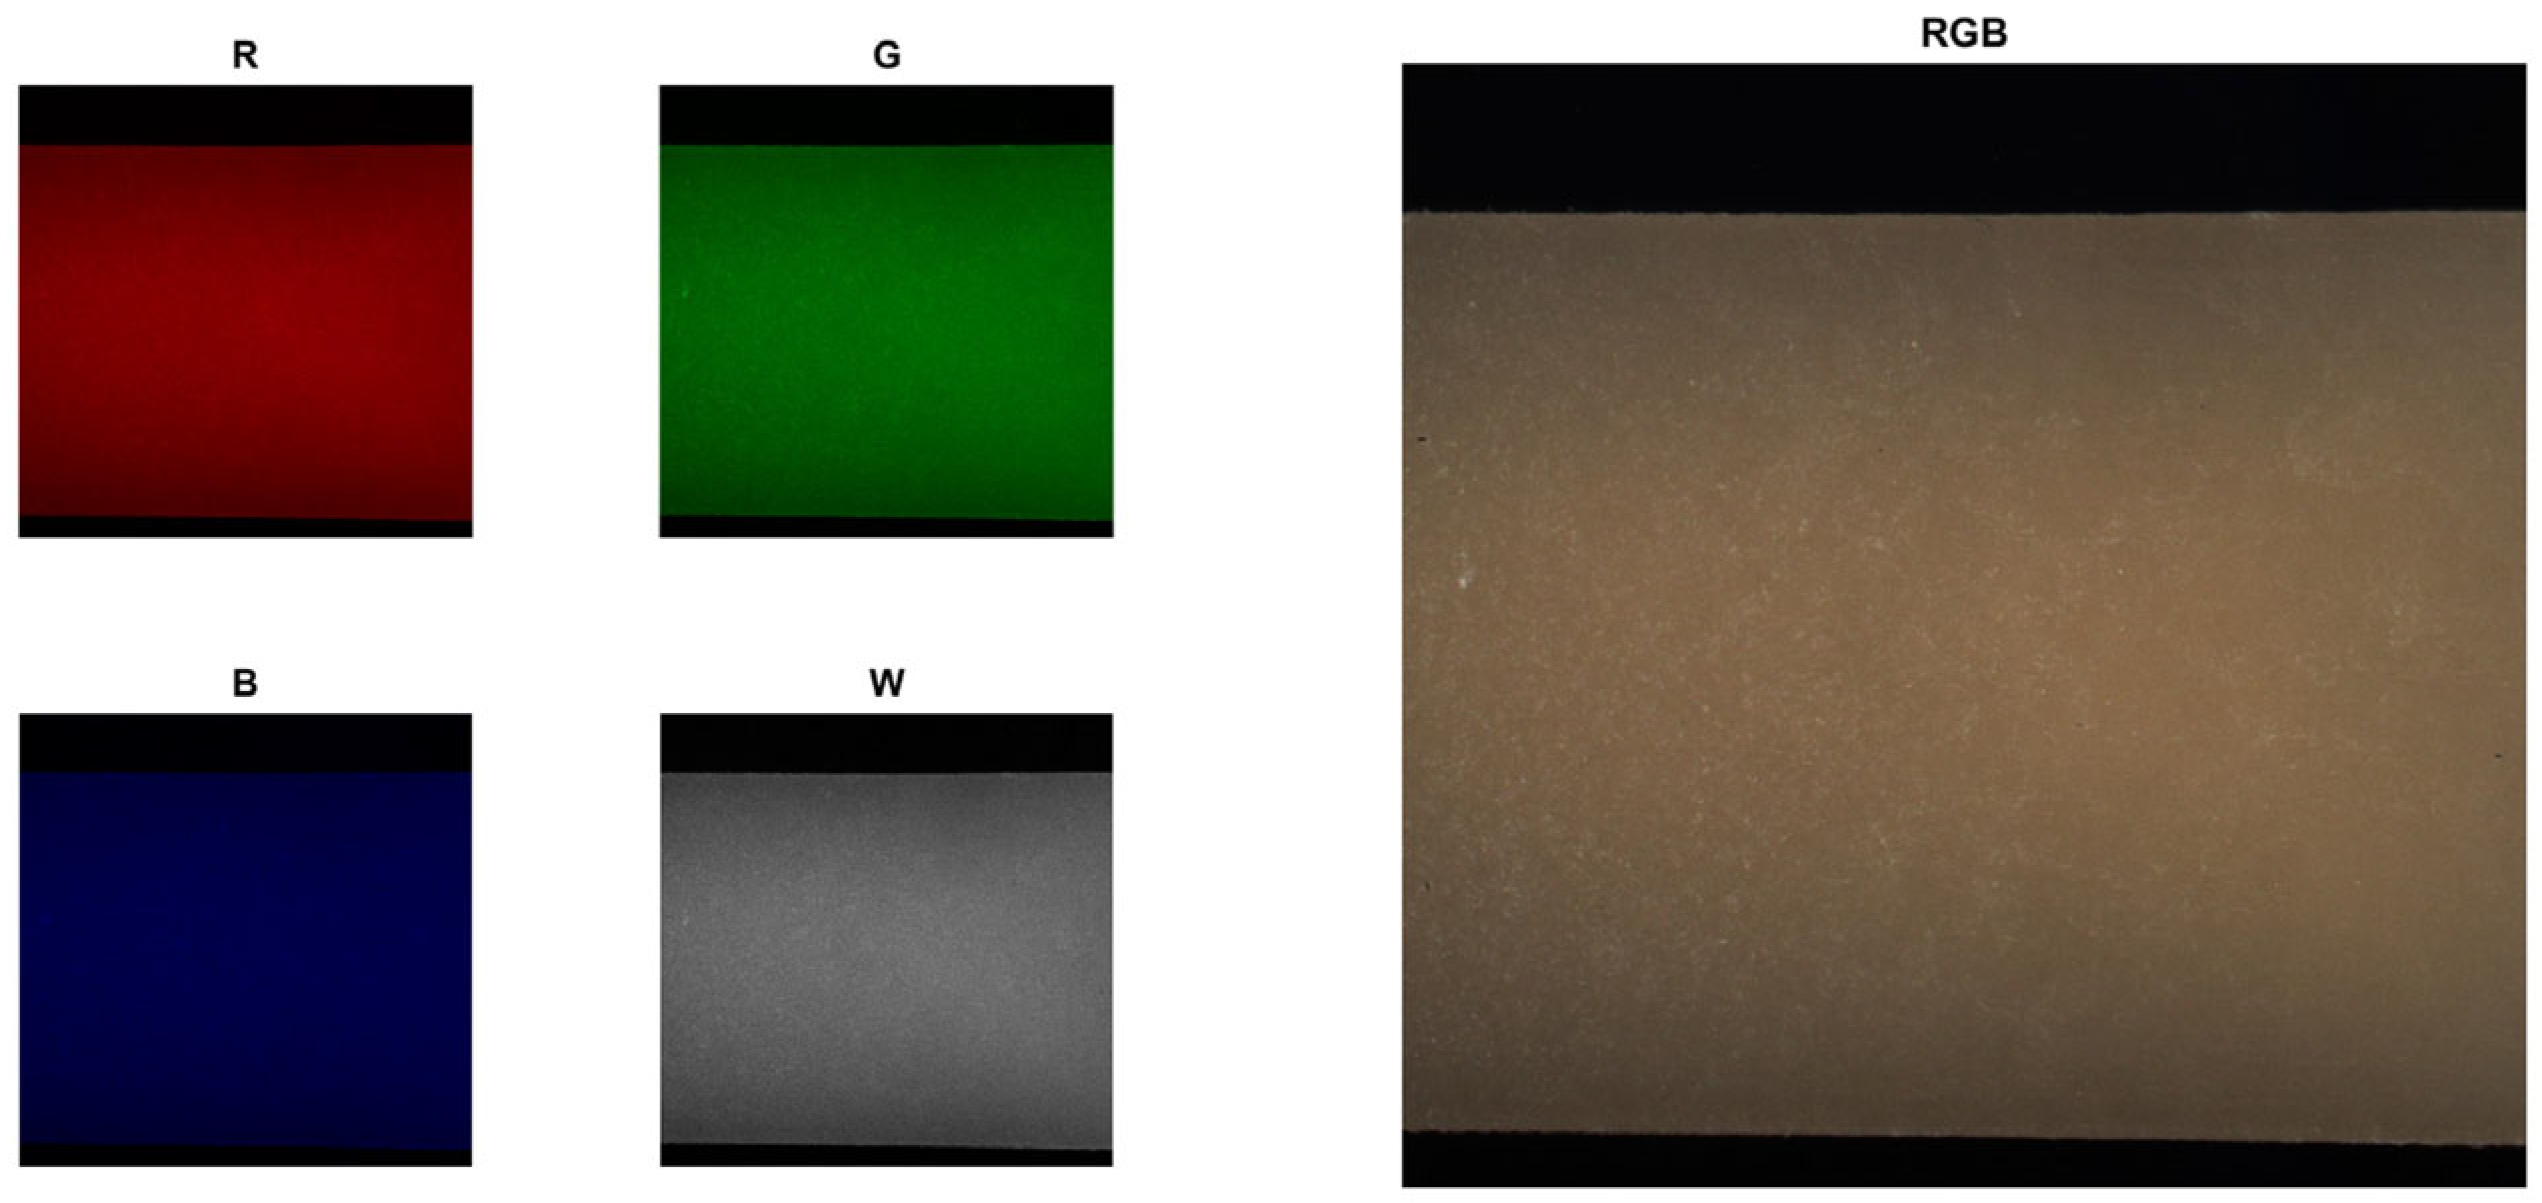
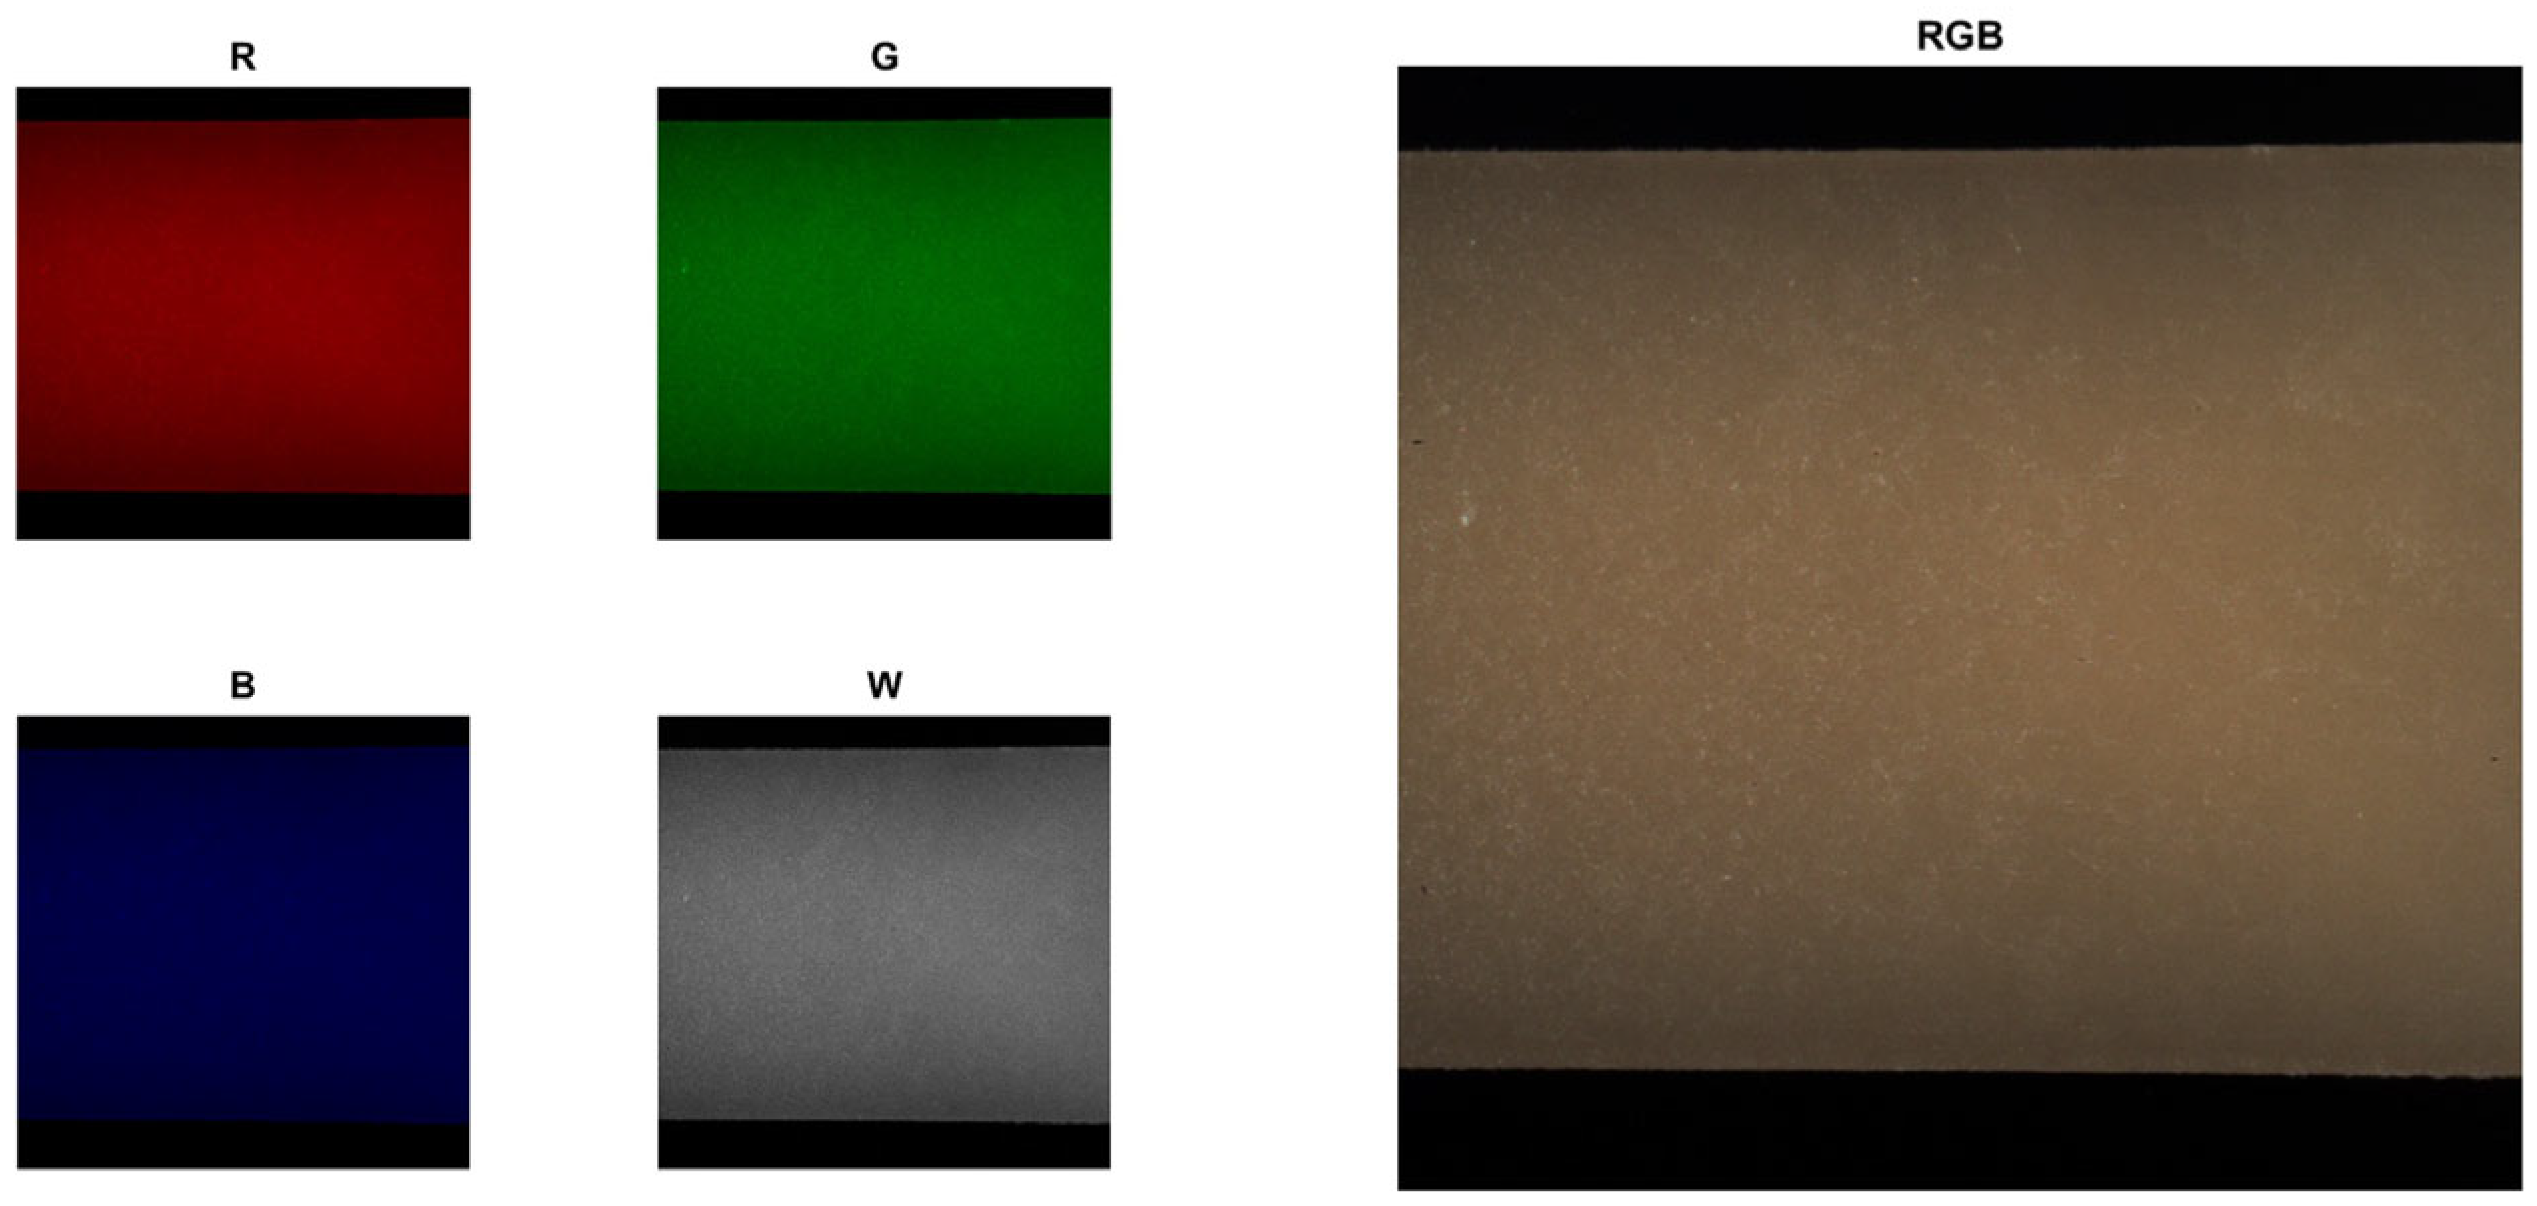
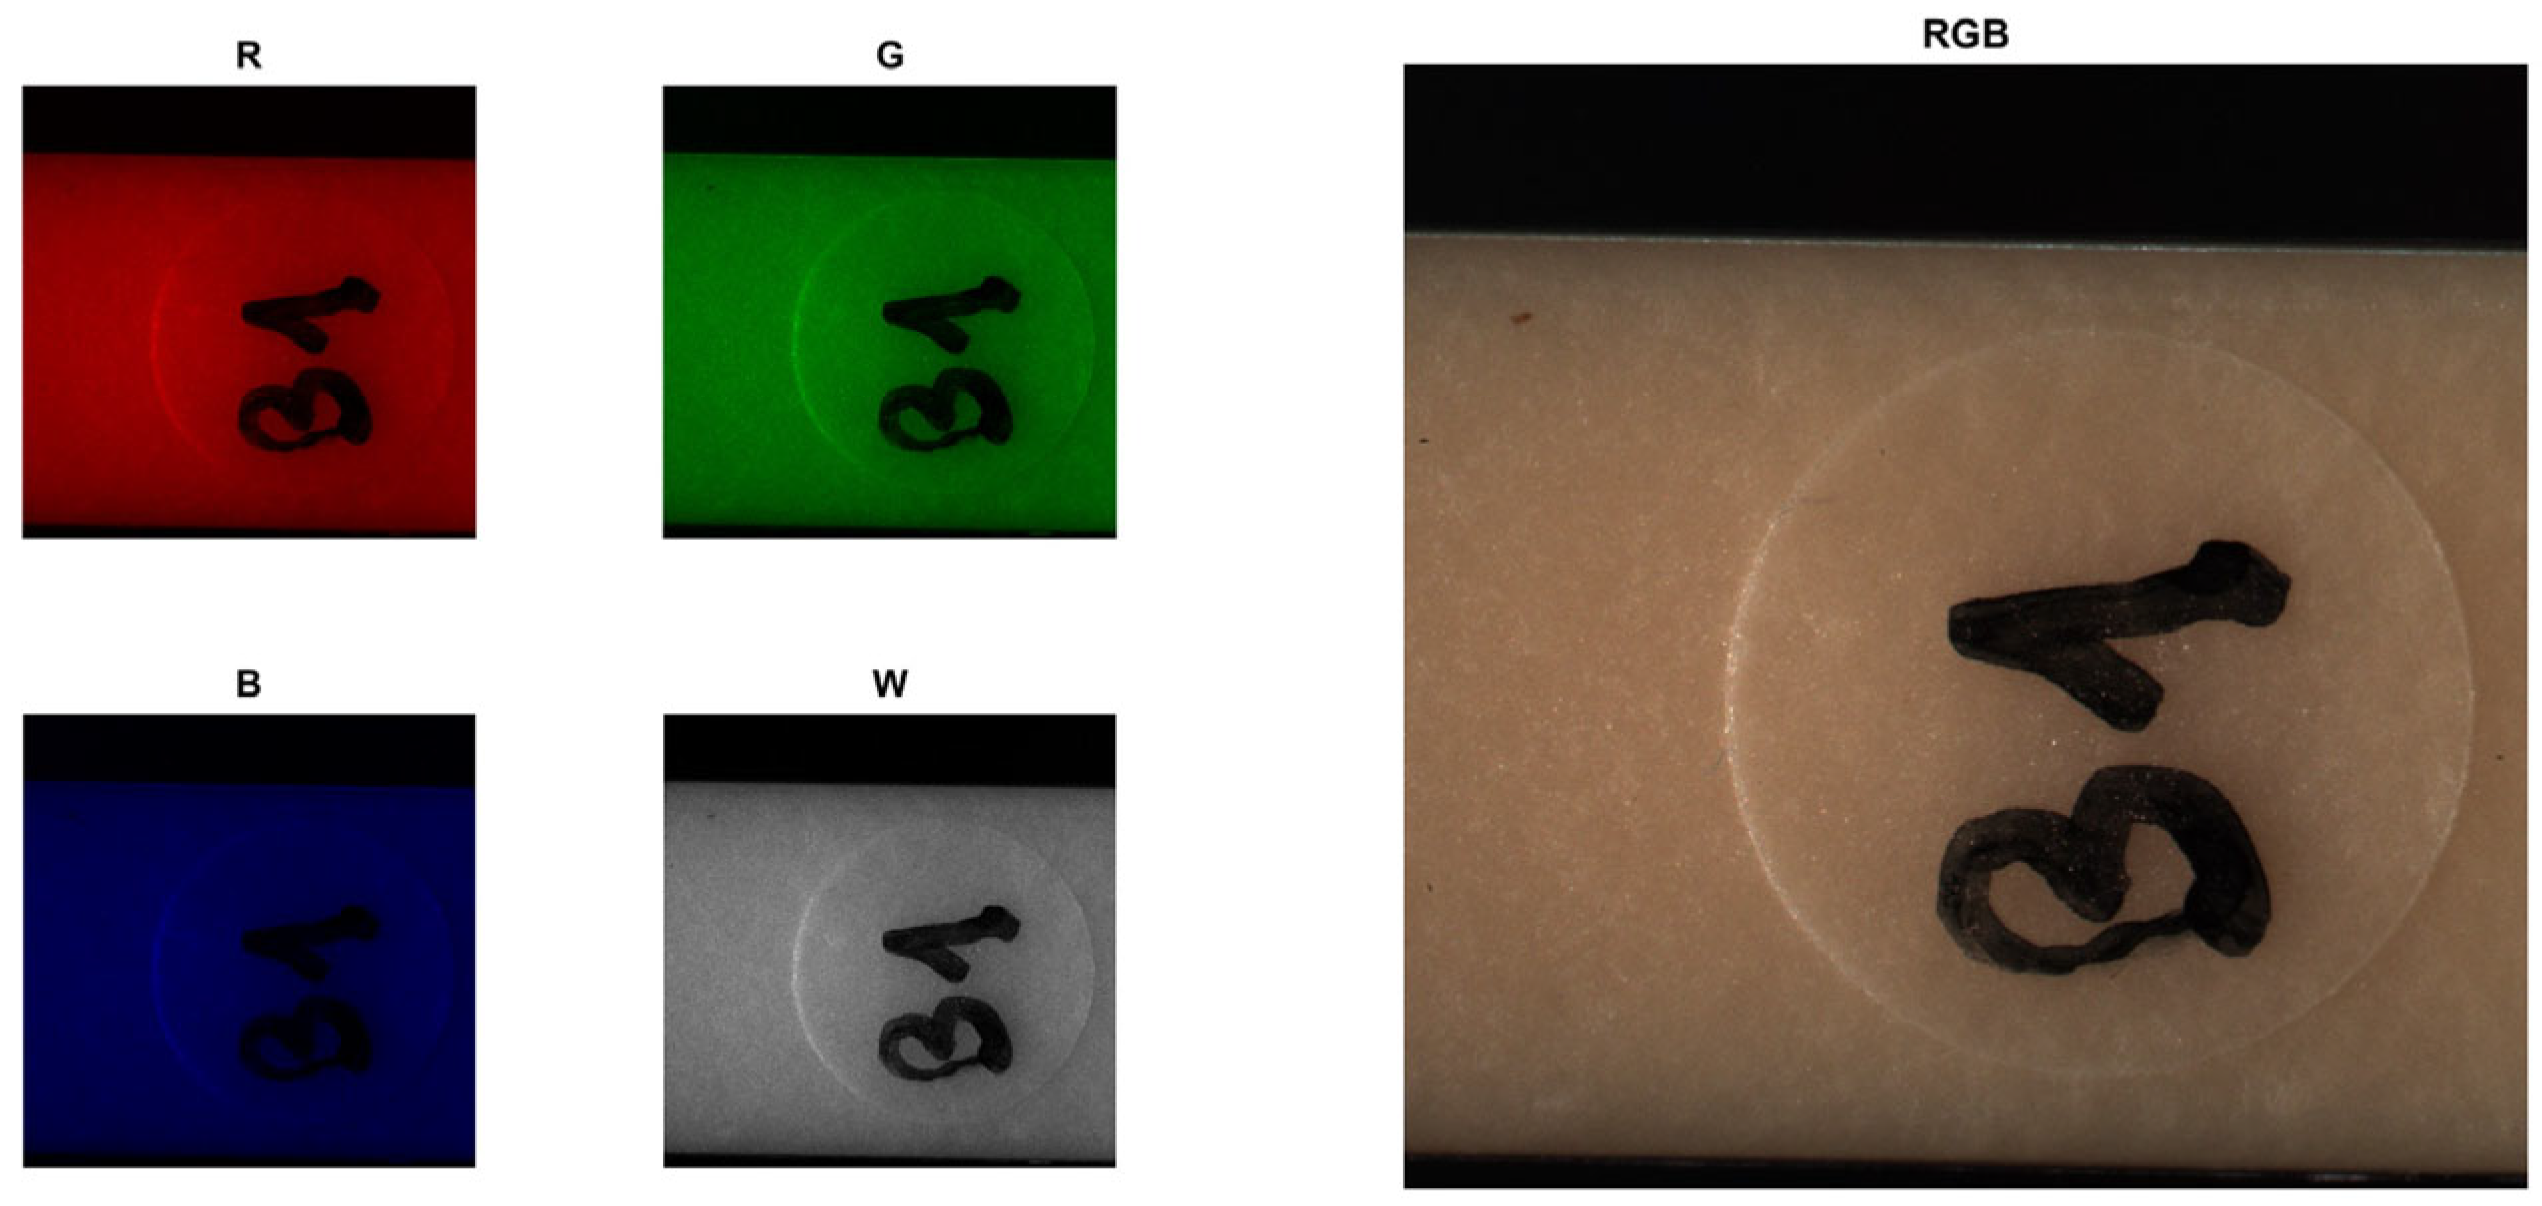
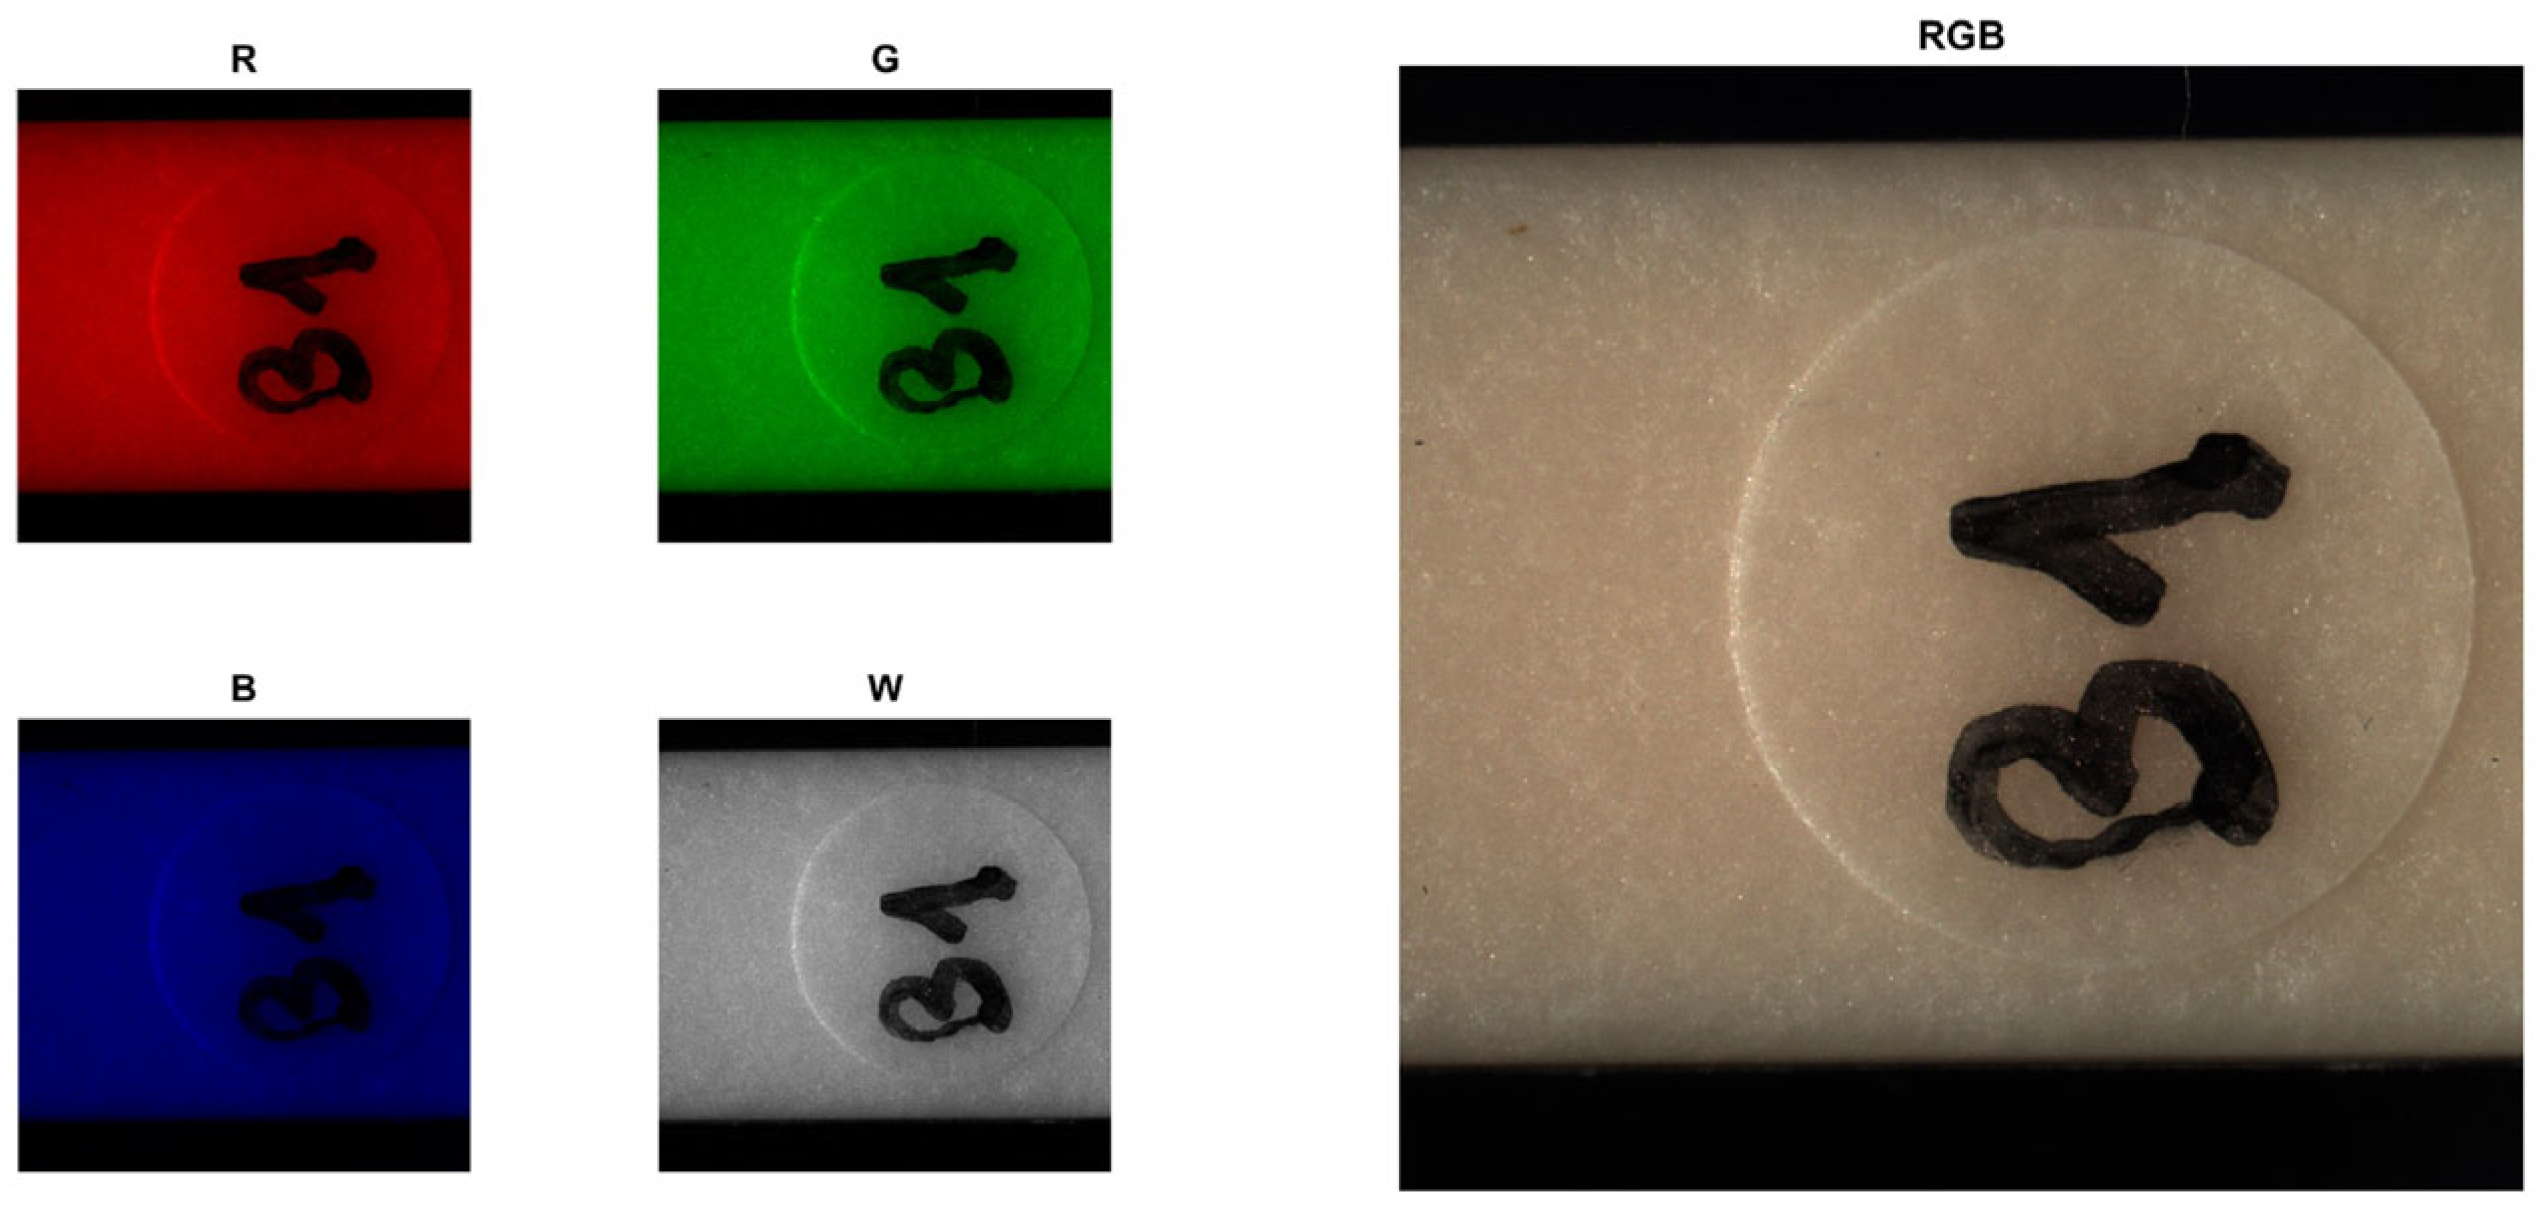
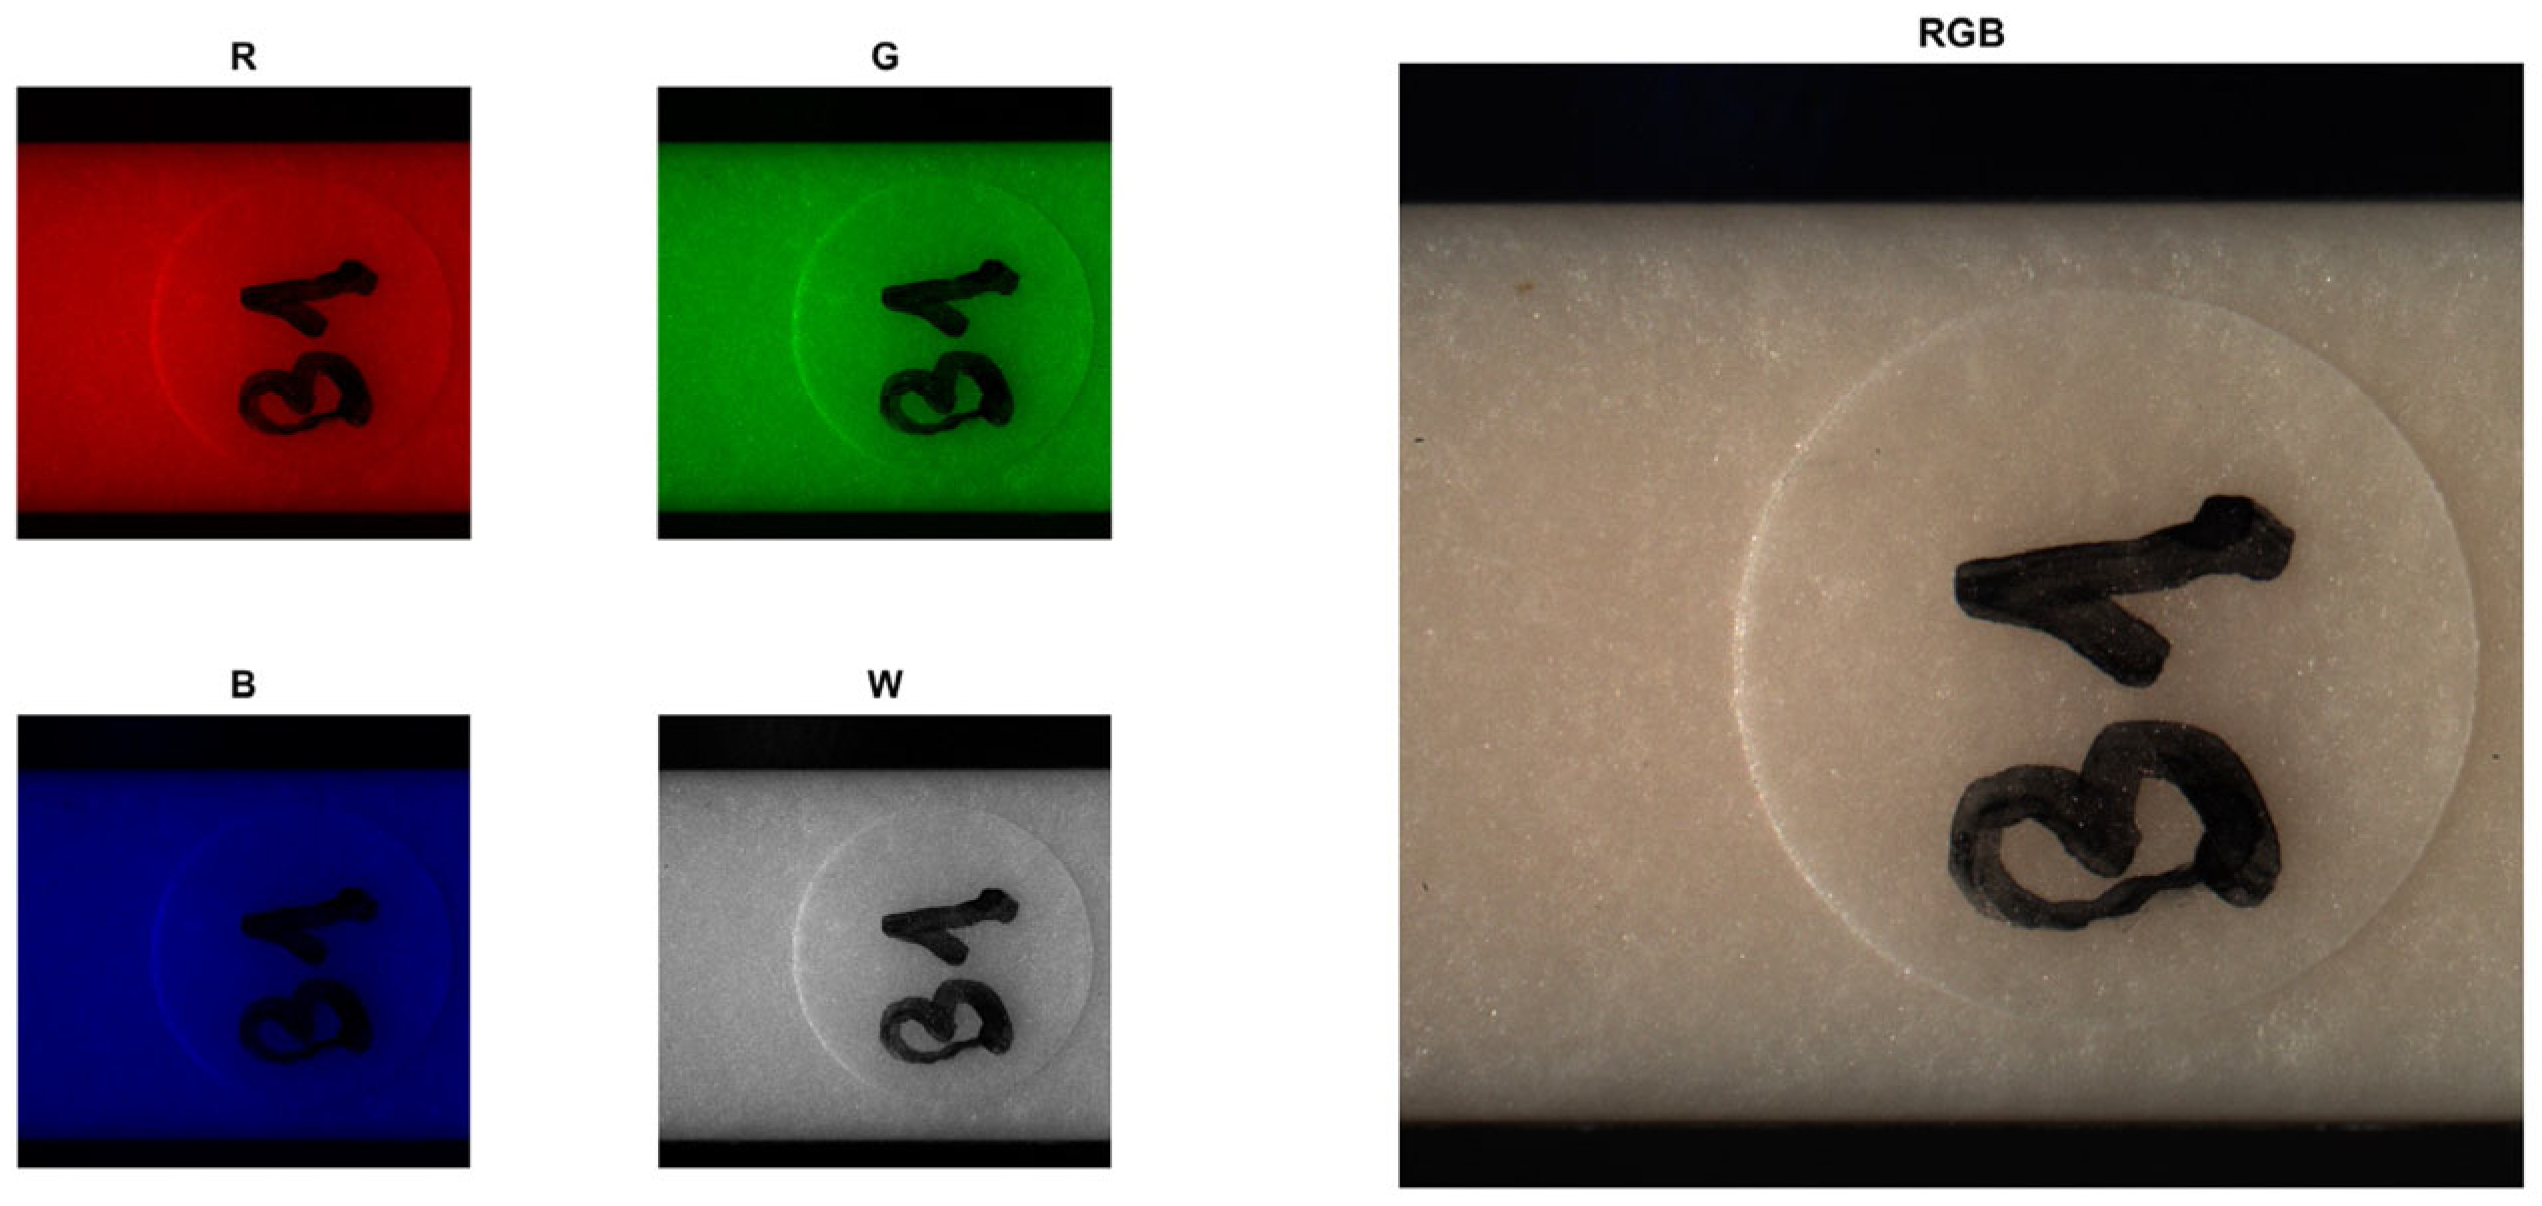
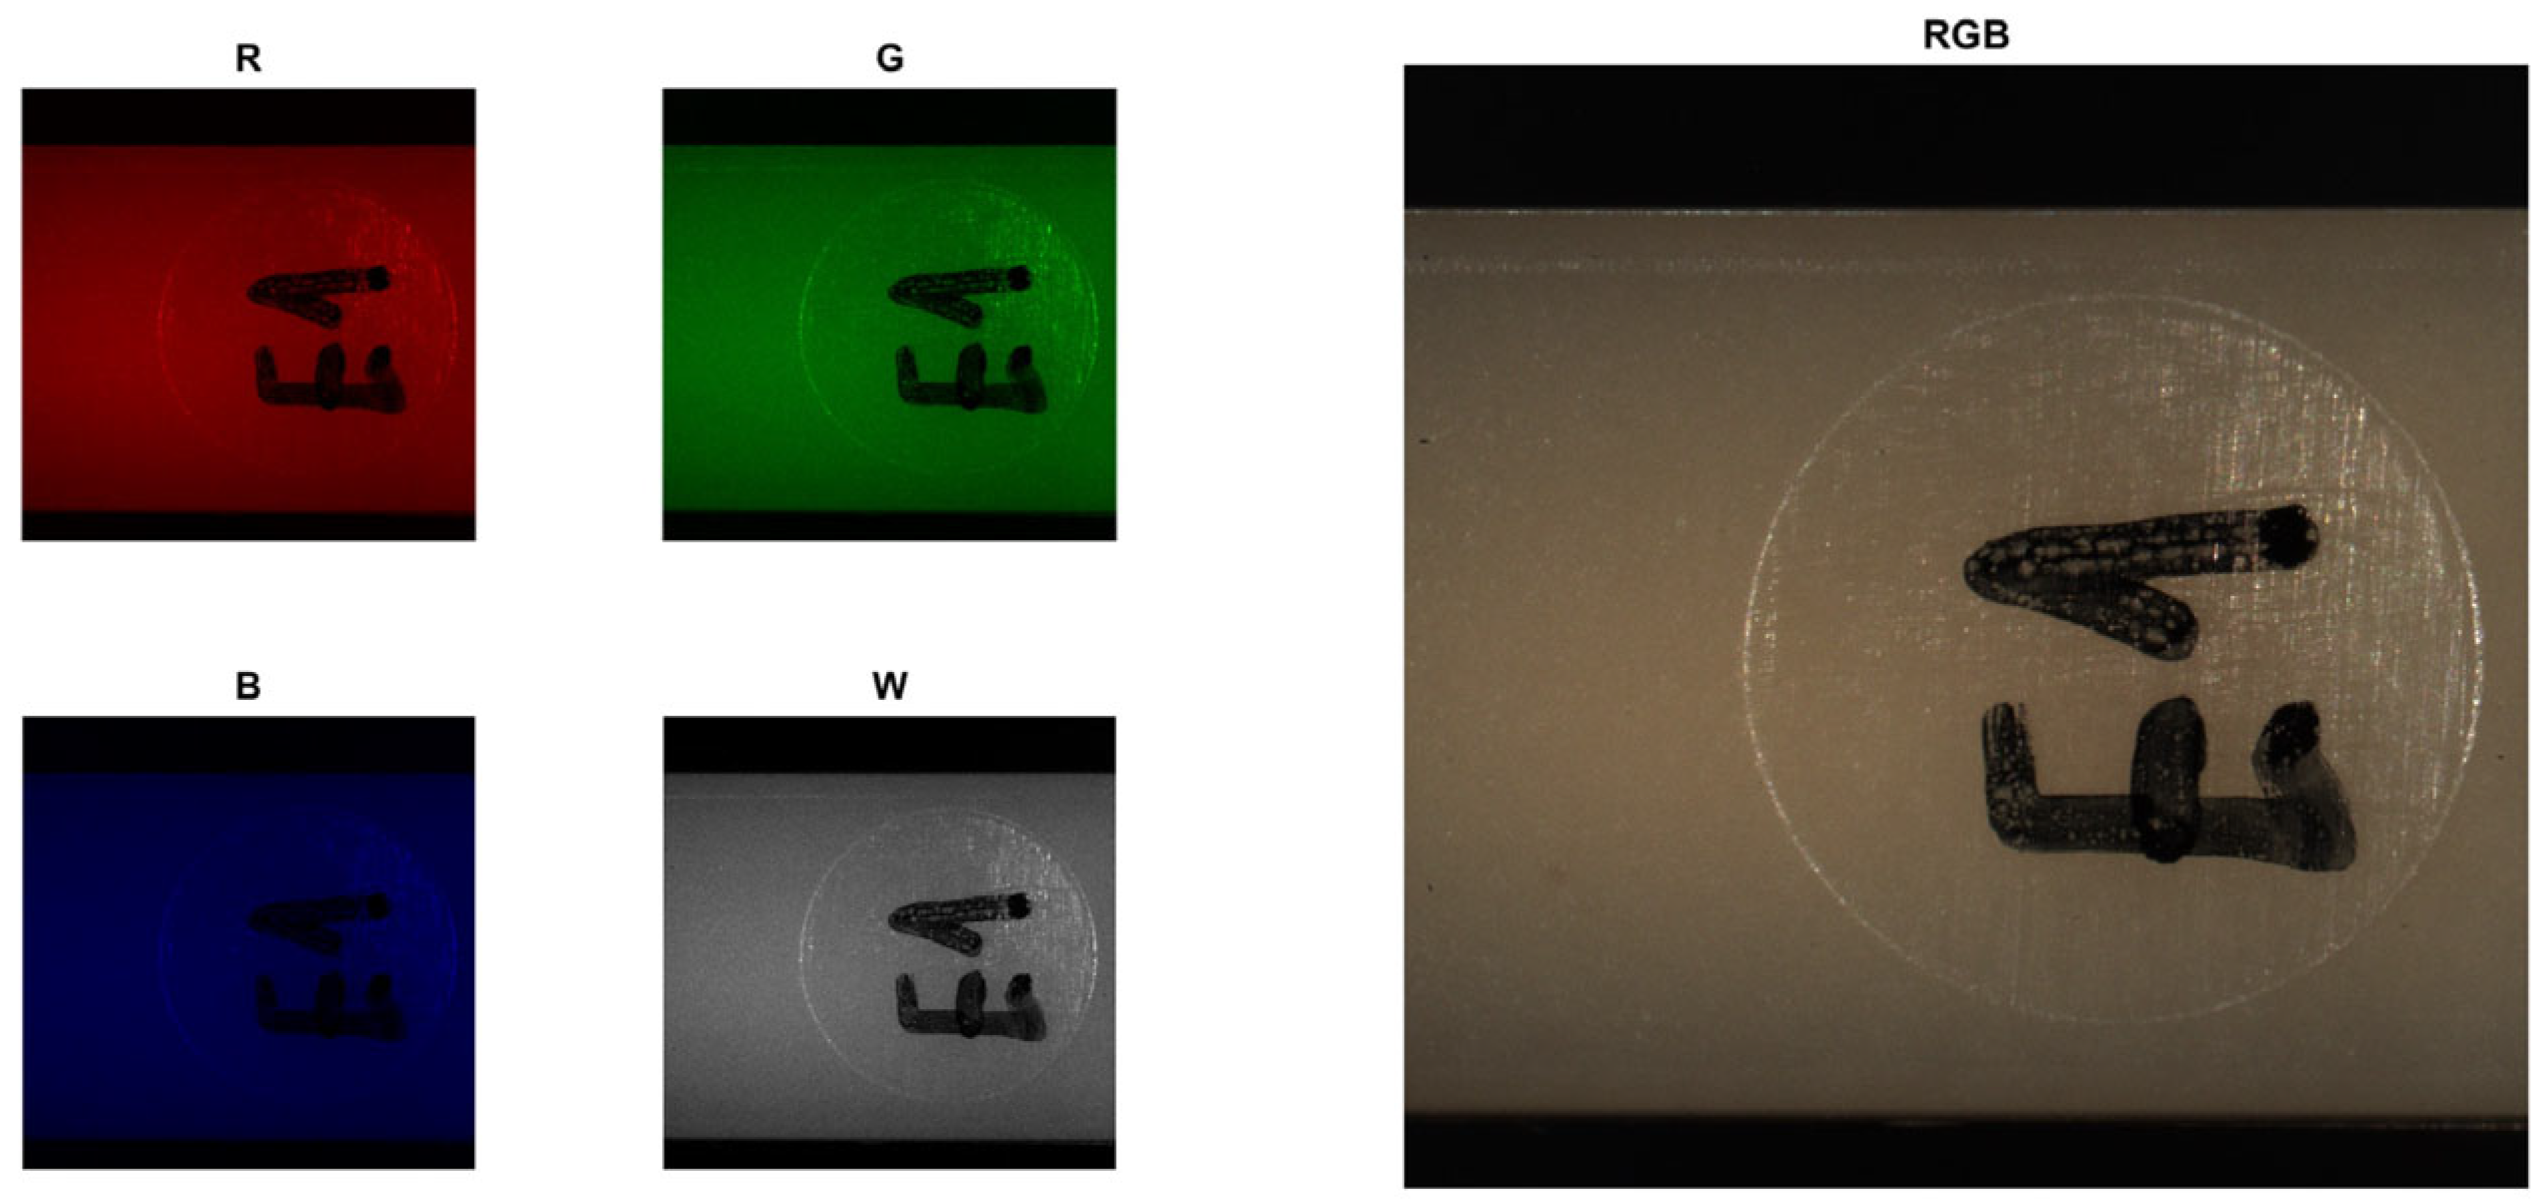
  • As expected, the specimens that did not receive any UV radiation showed no relevant color changes throughout the entire UV test period.
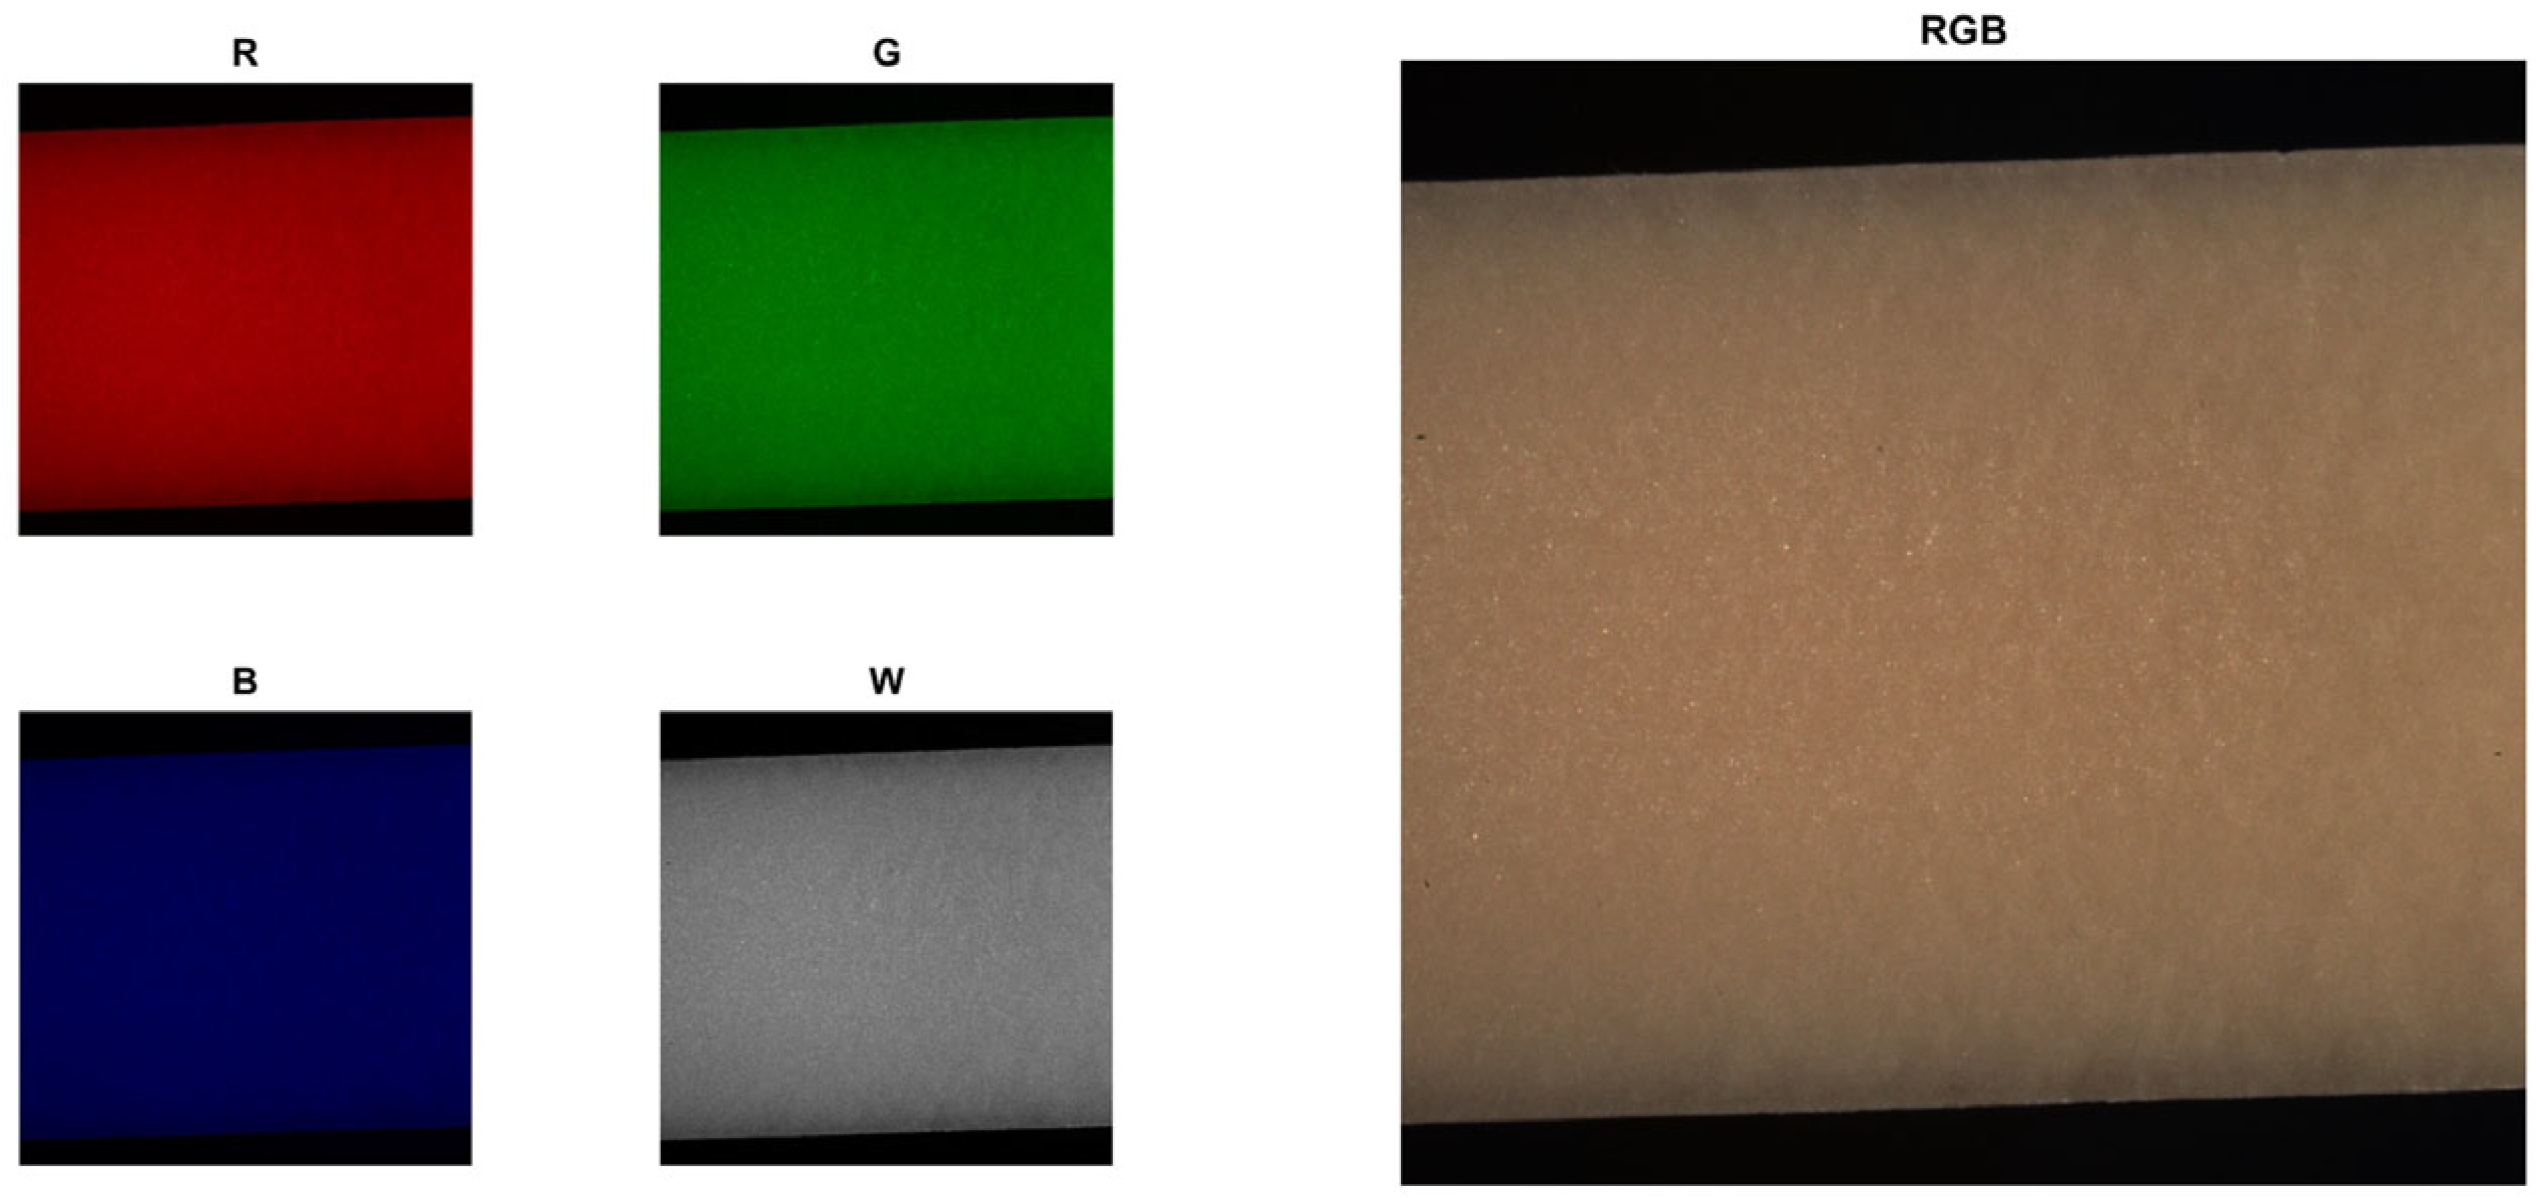
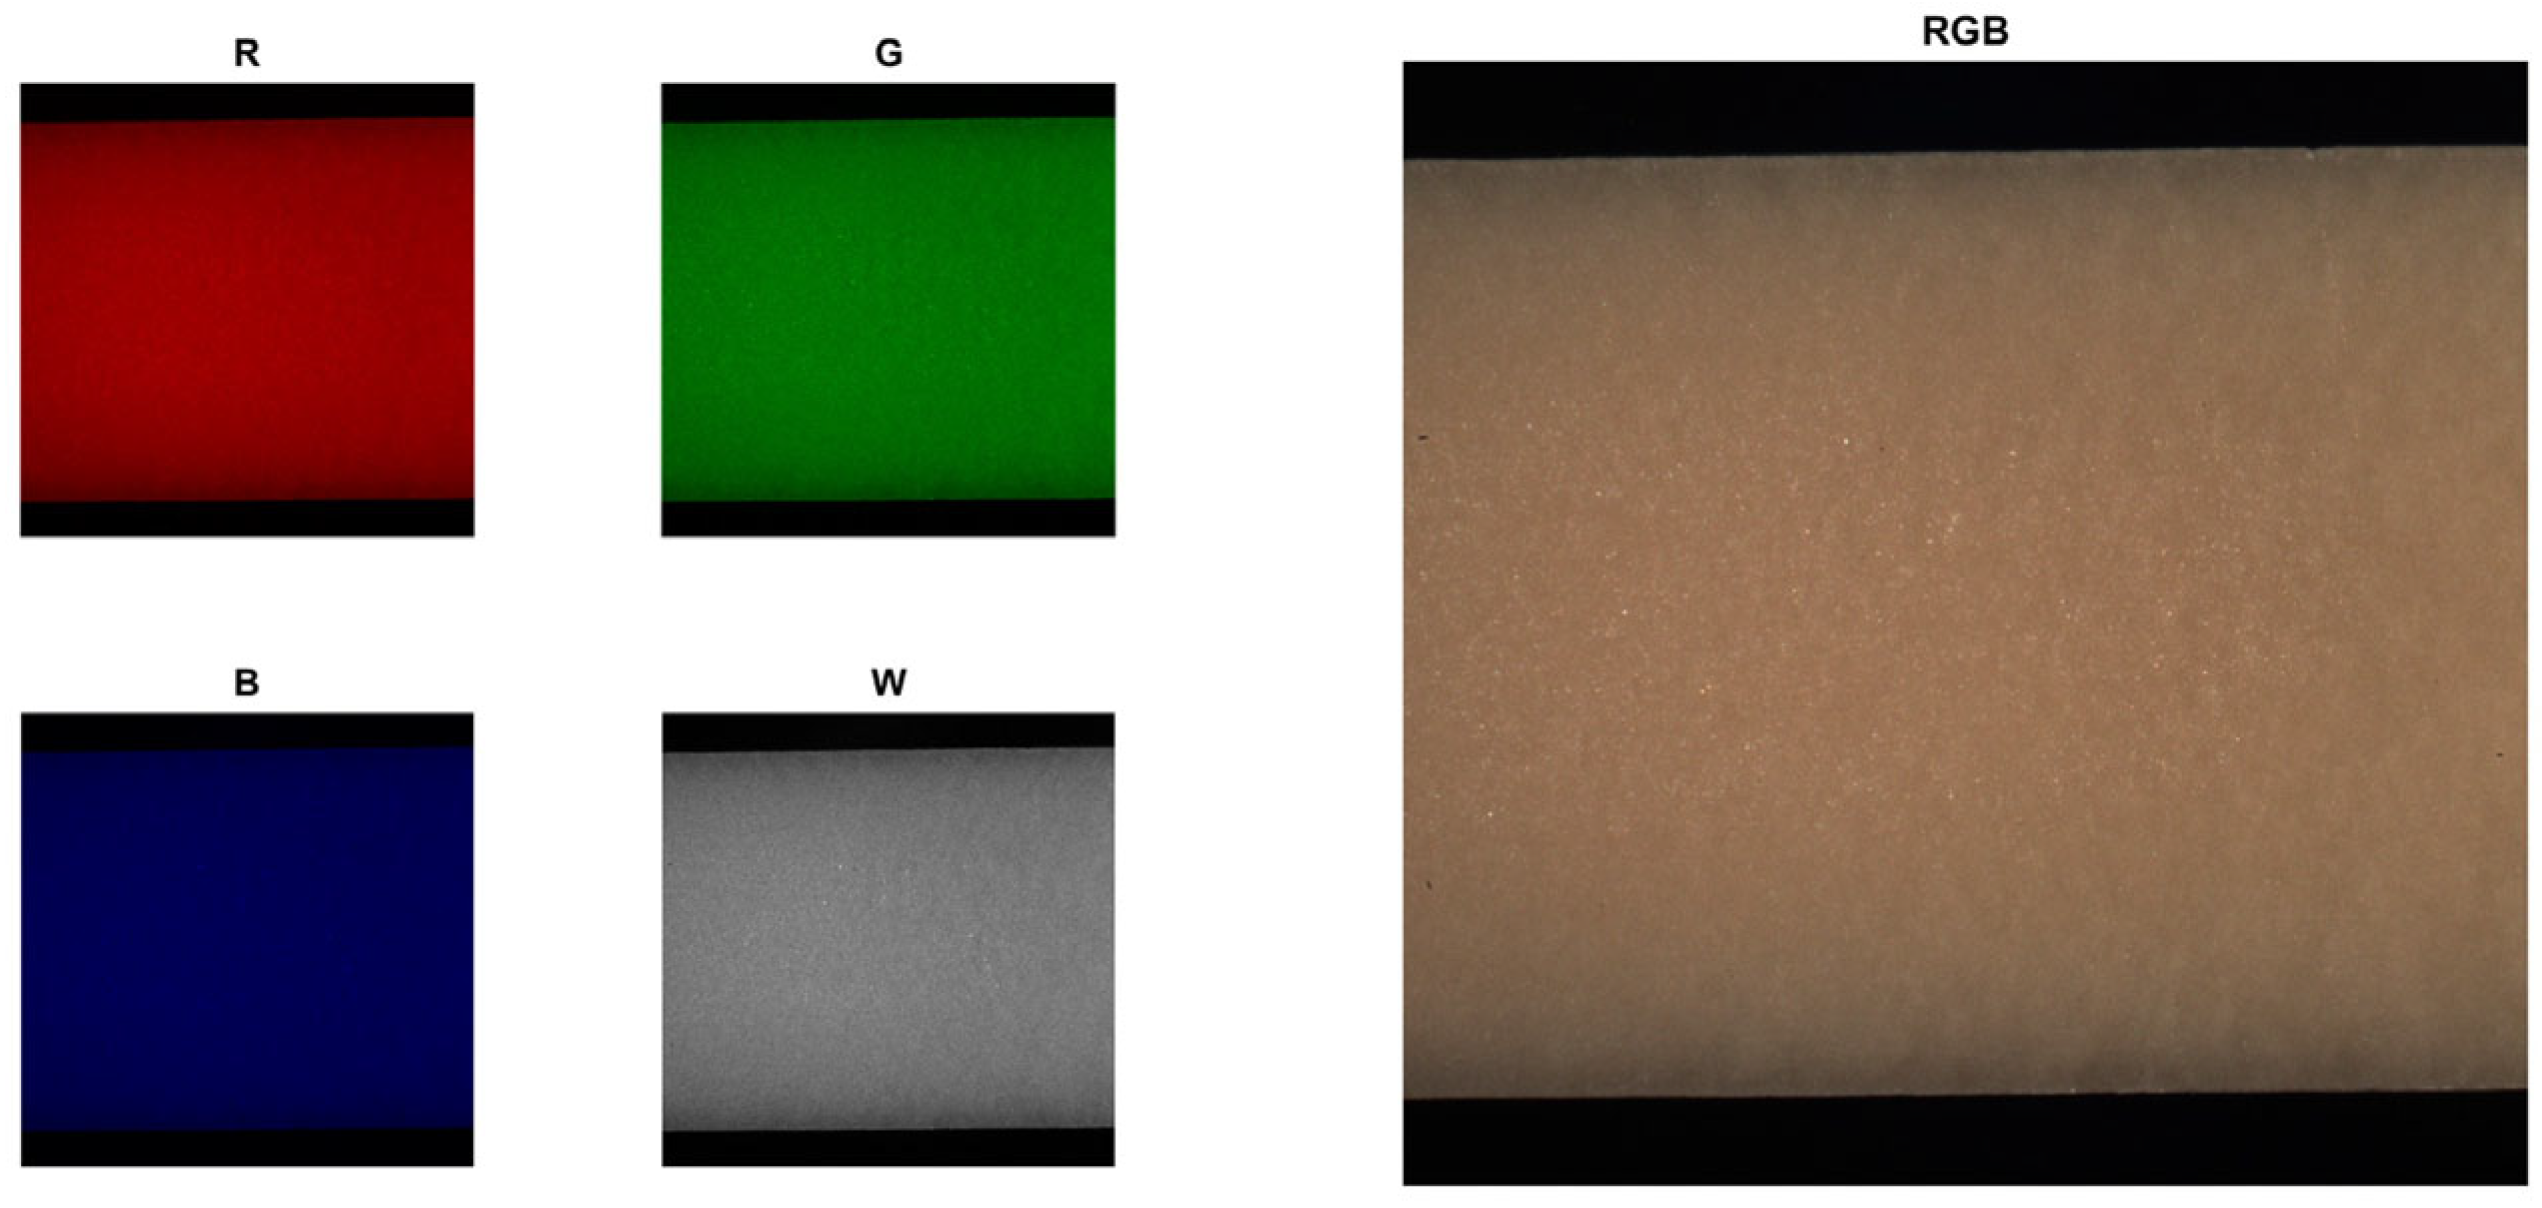
  • On the other hand, the specimens that were exposed to UV radiation showed noticeable changes, revealing color fading and a lighter appearance over time.
  • This effect was observed in the images captured from the tested samples as well as in the spectral reflectance and colorimetric measurements taken during the 10 week test period.
  • The color fading was more pronounced in the PLA + MC specimens compared to the PP + MC specimens.
  • The images captured during the UV test revealed that in addition to the color fading experienced by the PP, the specimens of this material also exhibited signs of surface damage. There was a slight crazing present on the surface of the specimens that were exposed to UV light, which was consistent with other research found in the literature on this topic.
In terms of future work, additional studies are already underway to thoroughly investigate the mechanical properties of samples exposed to UV compared to samples stored in the dark, to explore the effects of a more prolonged UV radiation exposure on these materials, specifically in terms of spectral reflectance, colorimetric characteristics surface damages, and their evolution over time, and to examine the impact of UV stabilizers on these materials when they are exposed to UV radiation.

Author Contributions

Conceptualization, A.d.O.M. and P.T.F.; methodology, A.d.O.M., P.T.F. and A.G.; software, A.d.O.M. and P.T.F.; validation, A.d.O.M. and P.T.F., formal analysis, A.d.O.M. and P.T.F.; investigation, A.d.O.M., P.T.F., V.L.D.C., J.C.V., P.E.M.V., M.J.R.M.N., J.M.R.C., M.E.A. and A.P.C.; resources, A.d.O.M., P.T.F., V.L.D.C., P.E.M.V., M.J.R.M.N., A.G., P.P., J.B., J.C.V., J.M.R.C., M.E.A. and A.P.C.; data curation, A.d.O.M. and P.T.F.; writing—original draft preparation, A.d.O.M. and P.T.F.; writing—review and editing, A.d.O.M., P.T.F., A.G., P.P. and J.B.; visualization, A.d.O.M., P.T.F., V.L.D.C., P.E.M.V., M.J.R.M.N., J.C.V., J.M.R.C., M.E.A. and A.P.C.; supervision, P.T.F., A.G. and P.P.; project administration, P.T.F., A.P.C., J.M.R.C., M.E.A., A.G. and P.P.; funding acquisition, P.T.F., A.P.C., J.M.R.C., M.E.A., A.G. and P.P. All authors have read and agreed to the published version of the manuscript.

Funding

The authors are grateful for the financial support granted by the Recovery and Resilience Plan (PRR) and by the Next Generation EU European Funds to Universidade da Beira Interior through the Green Agenda for Business Innovation “From Fossil to Forest—Sustainable packaging and products to replace fossil plastic” (Project n. º 8 with the application C644920945-00000036). The authors are also very grateful for the support granted by the Research Unit of Fiber Materials and Environmental Technologies (FibEnTech-UBI) through the Project reference UIDB/00195/2020 funded by the Fundação para a Ciência e a Tecnologia, IP/MCTES through national funds (PIDDAC) and https://doi.org/10.54499/UIDB/00195/2020.

Institutional Review Board Statement

Not applicable.

Informed Consent Statement

Not applicable.

Data Availability Statement

The original contributions presented in this study are included in the article.

Acknowledgments

The authors acknowledge the materials, access to equipment and installations, and all the general support given by The Navigator Company, the Forest and Paper Research Institute (RAIZ), and the Optical Center, the Research Center of Paper Science and Technology, the Department of Physics, and the Department of Chemistry of the Universidade da Beira Interior.

Conflicts of Interest

Joana Baldaia was employed by The Navigator Company. The remaining authors declare that the research was conducted in the absence of any commercial or financial relationships that could be construed as a potential conflict of interest.

Abbreviations

The following abbreviations are used in this manuscript (alphabetically):
Bblue
CIEInternational Commission on Illumination
DKdark
DNAdeoxyribonucleic acid
Ggreen
hhour(s)
IRinfrared
ISOInternational Organization for Standardization
MCmicronized cellulose
MFImelt flow index
PLApolylactic acid
PPpolypropylene
Rred
Refreference
RGBred–green–blue
rpmrevolutions per minute
UVultraviolet
UV-Aultraviolet subtype A
UV-Bultraviolet subtype B
UV-Cultraviolet subtype C
vs.versus
Wwhite
WKweek

Appendix A

The following Table A1, Table A2, Table A3, Table A4 and Table A5 present the spectral reflectance and colorimetric data obtained with the spectrophotometer used in the present work.
Table A1. Spectral reflectance measurements obtained from 400 to 780 nm for the white calibration standard (white reference) at three different moments (weeks 1, 5, and 10) considered for the samples stored in the dark (DK 01, DK 05, and DK 10) and during the 10-week period of the UV aging test (WK 01 to WK 10).
λ (nm)DK 01DK 05DK 10WK 01WK 02WK 03WK 04WK 05WK 06WK 07WK 08WK 09WK 10
40080.8781.8280.7180.8580.8580.7680.7880.8681.1681.5380.9281.0580.72
41082.5783.4582.3982.5182.5382.4882.4482.5082.8283.1382.5782.6282.44
42084.3084.9884.2284.3484.2984.3684.3084.4184.6284.7384.2484.3784.25
43085.3085.8685.3585.4185.3185.3685.3185.4885.5585.7685.3785.4185.29
44085.9086.3985.9385.9685.9585.9785.9286.0486.1386.2785.9185.9485.93
45086.5286.9486.5086.5386.5186.5686.5686.6286.7186.8486.5186.5486.52
46087.1487.4987.1387.1887.1187.1687.1987.2087.2887.4387.1787.1587.12
47087.6087.9687.6587.6787.6487.6587.6587.6887.7987.8887.6787.6787.63
48088.0088.3288.0188.0488.0188.0488.0588.0688.1788.2188.0688.0888.01
49088.2788.5688.2988.3488.2688.3288.3288.3588.4488.4988.3388.3788.30
50088.4688.6988.5088.5188.4688.4788.4988.5188.6088.6888.5288.5688.46
51088.5488.7388.5788.5588.5388.5188.5888.5488.6488.7388.5788.6288.51
52088.6088.8188.6488.6588.6388.6188.6888.6388.7388.8188.6588.6988.60
53088.5888.8188.6388.6688.6588.6288.6788.6588.7288.8088.6588.6988.59
54088.5388.7688.5988.6188.6088.5988.6188.6288.6788.7688.6188.6588.55
55088.5288.7588.5788.5788.5888.5888.5788.5988.6588.7188.5888.6388.55
56088.4888.6988.5288.5188.5088.5288.5288.5288.6088.6488.5288.5988.49
57088.3288.5288.3688.3788.3388.3788.3688.3588.4488.4888.3688.4488.31
58088.0888.2888.1188.1188.1088.1588.1288.1388.2088.2388.1188.1888.09
59088.0488.2688.0888.0888.0588.1088.1088.0988.1688.1988.0888.1388.07
60087.9888.1788.0288.0287.9788.0188.0488.0488.1088.1188.0288.0688.00
61087.8788.0487.8987.9087.8487.8987.9487.9287.9787.9887.8887.9387.87
62087.7587.9087.7387.7487.6987.7487.7787.7487.8187.8287.7287.7687.72
63087.5987.7887.6187.6087.5587.6187.6487.6187.6987.6987.5887.6287.58
64087.4587.6687.5187.4987.4587.5087.5487.4887.5787.6087.4787.5187.48
65087.1887.3887.2487.2287.2087.2487.2887.2087.3087.3287.2187.2687.22
66087.1987.3887.2087.2187.1987.2387.2687.1987.2887.3087.1987.2687.20
67087.2187.3787.2187.2287.2187.2387.2787.2187.2987.3187.2187.2787.22
68087.1887.3487.2087.2087.1987.2087.2587.1987.2587.2887.1987.2387.20
69087.1587.3087.1987.1887.1887.1787.2387.1887.2287.2687.1787.1987.18
70087.1587.3287.2287.2087.1987.1987.2587.2087.2387.2787.2087.2087.21
71087.1587.3387.2487.2287.2187.2087.2787.2287.2587.2887.2387.2187.25
72086.9287.1287.0286.9986.9886.9887.0586.9987.0387.0587.0086.9887.02
73086.6986.9086.8086.7686.7486.7586.8286.7686.8286.8286.7886.7686.80
74086.2286.4486.3386.2986.2886.2986.3686.2986.3786.3786.3186.3386.32
75085.7385.9685.8485.7985.7885.8185.8785.8185.8985.9085.8185.8585.82
76085.4285.6585.5285.4885.4585.5085.5585.5085.5685.5985.5085.5385.50
77085.0685.2885.1185.1185.0785.1285.1585.1385.1685.2185.1285.1485.15
78084.6484.8484.6684.6784.6484.6884.7284.7184.7284.7784.6984.7084.73
Table A2. Spectral reflectance measurements obtained from 400 to 780 nm for the PLA + MC (original specimen) at three different moments (weeks 1, 5, and 10) considered for the samples stored in the dark (DK 01, DK 05, and DK 10) and for the PLA + MC exposed to UV during the 10-week period of the UV aging test (WK 01 to WK 10).
λ (nm)DK 01DK 05DK 10WK 01WK 02WK 03WK 04WK 05WK 06WK 07WK 08WK 09WK 10
40024.5725.4424.7330.3332.1533.4534.3735.1736.1436.8336.2436.8436.86
41024.1924.9824.3530.2332.1633.5234.5335.3936.3837.0536.5537.1337.17
42023.0323.6623.2929.4331.5733.0134.1035.1335.9936.5636.2736.8237.02
43024.0824.6324.3430.0432.1833.5634.6735.7236.4937.0536.8637.3237.61
44025.3825.8525.6230.7832.9234.2735.4136.3937.1637.6737.5237.9838.30
45026.6527.0826.9031.5933.6835.0236.1537.1037.8438.3238.2238.6638.99
46028.0928.4828.3432.5234.5435.8036.9437.8338.5739.0438.9739.3939.70
47029.5329.9129.8133.4835.4336.6437.7538.6139.3139.7539.7040.1340.42
48031.0031.3531.2634.4936.3837.5338.6039.4340.0940.4940.4740.8841.16
49032.3832.7232.6335.4937.2938.3939.4340.2040.8641.2341.2341.6241.89
50033.7634.1034.0336.5738.2839.3340.3441.0141.6642.0242.0142.3742.65
51035.0435.3735.3137.6639.3040.2641.2241.8342.4542.7942.7743.1343.38
52036.3336.6636.6038.8640.4041.2942.1742.7443.3143.6343.6043.9444.18
53037.5237.8437.8040.0241.4542.2643.0843.5844.1144.4044.3744.6844.90
54038.6238.9238.9041.0842.4343.1643.9144.3744.8545.1145.0645.3745.58
55039.6239.9139.8942.0243.3043.9644.6645.0645.5145.7445.6845.9846.19
56040.5540.8240.8242.8844.0844.6745.3545.6846.1246.2946.2646.5446.72
57041.3641.6341.6143.6244.7345.2745.9046.1946.6046.7746.7247.0047.15
58042.1342.4042.3744.3045.3545.8546.4146.6747.0447.1947.1347.4047.55
59042.8943.1643.1444.9845.9646.4146.9447.1547.5047.6347.5547.8047.96
60043.5643.8143.7945.5746.4846.8847.3947.5547.8747.9947.9148.1348.29
61044.1044.3444.3246.0546.9147.2647.7447.8748.1848.2848.1848.4048.54
62044.6044.8344.7846.5047.3147.6148.0548.1648.4548.5248.4148.6348.76
63045.0645.2845.2346.9147.6747.9448.3648.4348.7148.7748.6548.8648.98
64045.4945.7145.6647.3248.0548.2848.6748.7148.9849.0348.9049.1149.21
65045.6945.9045.8547.5148.2148.4148.7848.8049.0649.1048.9649.1649.25
66045.8946.0946.0347.7048.3648.5448.9048.9049.1549.1849.0349.2349.32
67046.0246.2046.1447.8348.4748.6248.9948.9749.2049.2149.0949.2649.36
68046.1646.3346.2747.9748.5948.7249.0749.0549.2749.2849.1549.3249.41
69046.3046.4546.4048.1148.7148.8249.1649.1449.3449.3449.2149.3749.46
70046.4746.6146.5548.2848.8648.9449.2749.2549.4449.4349.2949.4649.54
71046.6346.7746.7148.4549.0249.0749.3949.3749.5449.5249.3849.5449.63
72046.6246.7646.6948.4448.9849.0249.3349.3149.4849.4549.3149.4749.54
73046.6146.7546.6748.4248.9548.9749.2749.2449.4249.3849.2349.3949.46
74046.4546.5946.4948.2648.7648.7849.0649.0349.2149.1749.0149.1949.23
75046.2646.4146.3048.0748.5648.5748.8348.8048.9848.9548.7848.9648.98
76046.1546.3046.1747.9548.4248.4448.6948.6748.8248.8048.6348.8148.82
77045.9846.1346.0047.7648.2448.2748.5148.4848.6248.6048.4348.5948.62
78045.7745.9245.7847.5448.0248.0548.2848.2648.3948.3748.2048.3348.39
Table A3. Spectral reflectance measurements obtained from 400 to 780 nm for the PP + MC (original specimen) at three different moments (weeks 1, 5, and 10) considered for the samples stored in the dark (DK 01, DK 05, and DK 10) and for the PP + MC exposed to UV during the 10-week period of the UV aging test (WK 01 to WK 10).
λ (nm)DK 01DK 05DK 10WK 01WK 02WK 03WK 04WK 05WK 06WK 07WK 08WK 09WK 10
40019.9121.0320.0124.8126.6127.4827.5627.6628.3628.4828.1228.4728.65
41019.8220.8519.9024.9326.8127.7227.8127.9128.6228.6828.4128.7328.94
42019.3820.2019.5424.7726.8127.7627.9028.0028.5928.5928.4028.6829.02
43020.3221.0320.4725.3927.4028.2828.4828.5529.0729.0128.9329.1629.55
44021.3822.0521.5425.9827.9828.8229.0629.0929.6229.5029.4629.6830.10
45022.3522.9922.5226.6128.5829.4329.6529.6530.1930.0430.0630.2530.68
46023.4324.0223.5627.2829.2030.0130.2430.2330.7630.5830.6530.8631.30
47024.4625.0324.5927.9429.8130.5630.8130.7931.3131.1331.1931.4331.90
48025.4626.0025.5728.5930.4131.1431.4031.3631.8831.7031.7932.0332.51
49026.3726.8726.4329.2230.9731.6831.9531.9132.4432.2432.3632.5933.09
50027.2427.7227.3129.8631.5532.2332.5232.4432.9832.8032.9033.1433.69
51028.0128.4728.0830.4332.0732.7233.0332.9333.4833.3133.4233.6634.24
52028.7429.2228.8231.0532.6133.2333.5433.4433.9933.8133.9534.1834.78
53029.3829.8529.4631.5833.0633.6633.9733.8734.4134.2234.3934.6235.22
54029.9230.3730.0032.0233.4534.0234.3134.2234.7534.5634.7434.9735.59
55030.3830.8130.4532.3933.7734.3134.5934.4935.0334.8335.0235.2635.89
56030.7931.2130.8432.7134.0334.5434.8434.7235.2635.0535.2535.4836.14
57031.1431.5431.1732.9834.2534.7235.0334.9035.4335.2335.4335.6736.33
58031.4431.8431.4633.1834.4134.8735.1735.0435.5535.3635.5535.7936.46
59031.7132.1231.7433.3934.5635.0135.3035.1635.6835.4935.6835.9136.59
60031.9032.3031.9333.5134.6435.0735.3635.2135.7235.5335.7235.9536.64
61032.0332.4332.0633.5834.6735.0835.3835.2135.7235.5235.7235.9536.65
62032.1332.5232.1333.6234.6835.0635.3635.1935.7035.4935.6935.9236.63
63032.2132.6032.2133.6434.6735.0435.3335.1635.6735.4735.6535.8836.61
64032.2832.6632.2833.6734.6735.0335.3135.1335.6435.4535.6335.8636.59
65032.2132.5932.2033.5634.5434.8935.1734.9935.5035.2935.4935.7336.44
66032.1432.5232.1233.4834.4334.7735.0634.8735.3735.1735.3635.6136.32
67032.0632.4332.0433.3934.3334.6534.9434.7635.2435.0435.2435.4936.20
68032.0032.3731.9833.3134.2334.5534.8334.6635.1334.9435.1335.3836.09
69031.9432.3031.9133.2434.1334.4434.7234.5735.0234.8435.0235.2835.99
70031.9132.2631.8733.1934.0634.3734.6534.5034.9534.7734.9535.2135.92
71031.8832.2231.8433.1433.9834.3034.5734.4434.8834.7034.8735.1435.85
72031.7432.0931.7033.0033.8234.1334.4034.2734.7134.5334.6934.9735.67
73031.6131.9631.5632.8633.6533.9634.2334.1034.5434.3634.5234.8135.50
74031.3631.7231.3032.5933.3633.6633.9433.8134.2434.0734.2234.5335.20
75031.1131.4631.0432.3233.0833.3933.6533.5333.9533.7933.9434.2534.91
76030.9331.2930.8532.1332.8933.2133.4533.3333.7433.5933.7534.0434.70
77030.7531.1030.6731.9232.6933.0333.2533.1233.5333.3833.5633.8134.48
78030.5630.9130.4731.7132.4932.8333.0432.9033.3133.1633.3533.5834.26
Table A4. Colorimetric representations obtained in the CIE 1976 L*a*b* color space [43] for the PLA + MC (original specimen) at three different moments (weeks 1, 5, and 10) considered for the samples stored in the dark (DK 01, DK 05, and DK 10) and for the PLA + MC exposed to UV during the 10-week period of the UV aging test (WK 01 to WK 10).
CIE1976DK 01DK 05DK 10WK 01WK 02WK 03WK 04WK 05WK 06WK 07WK 08WK 09WK 10
L*72.8172.9672.9974.5575.4575.9076.3876.6576.9377.0677.0777.2577.41
a*1.321.291.262.071.871.681.531.411.331.281.211.191.12
b*16.4916.2416.3812.2010.789.799.098.357.927.597.577.327.19
Table A5. Colorimetric representations obtained in the CIE 1976 L*a*b* color space [43] for the PP + MC (original specimen) at three different moments (weeks 1, 5, and 10) considered for the samples stored in the dark (DK 01, DK 05, and DK 10) and for the PP + MC exposed to UV during the 10-week period of the UV aging test (WK 01 to WK 10).
CIE1976DK 01DK 05DK 10WK 01WK 02WK 03WK 04WK 05WK 06WK 07WK 08WK 09WK 10
L*65.0965.4165.1266.8568.0168.4468.6868.5969.0068.8269.0069.1869.72
a*−0.64−0.60−0.63−0.01−0.12−0.19−0.21−0.23−0.25−0.21−0.25−0.25−0.26
b*11.3210.9211.127.236.085.565.605.475.405.385.525.495.72

References

  1. Manu, T.; Nazmi, A.R.; Shahri, B.; Emerson, N.; Huber, T. Biocomposites: A review of materials and perception. Mater. Today Commun. 2022, 31, 103308. [Google Scholar] [CrossRef]
  2. Aaliya, B.; Sunooj, K.V.; Lackner, M. Biopolymer composites: A review. Int. J. Biobased Plast. 2021, 3, 40–84. [Google Scholar] [CrossRef]
  3. Babaremu, K.; Oladijo, O.P.; Akinlabi, E. Biopolymers: A suitable replacement for plastics in product packaging. Adv. Ind. Eng. Polym. Res. 2023, 6, 333–340. [Google Scholar] [CrossRef]
  4. Mahmud, M.Z.A. Exploring the versatile applications of biocomposites in the medical field. Bioprinting 2023, 36, e00319. [Google Scholar] [CrossRef]
  5. Faheed, N.K. Advantages of natural fiber composites for biomedical applications: A review of recent advances. Emergent Mater. 2024, 7, 63–75. [Google Scholar] [CrossRef]
  6. Udayakumar, G.P.; Muthusamy, S.; Selvaganesh, B.; Sivarajasekar, N.; Rambabu, K.; Banat, F.; Sivamani, S.; Sivakumar, N.; Hosseini-Bandegharaei, A.; Show, P.L. Biopolymers and composites: Properties, characterization and their applications in food, medical and pharmaceutical industries. J. Environ. Chem. Eng. 2021, 9, 105322. [Google Scholar] [CrossRef]
  7. Phiri, R.; Rangappa, S.M.; Siengchin, S.; Oladijo, O.P.; Dhakal, H.N. Development of sustainable biopolymer-based composites for lightweight applications from agricultural waste biomass: A review. Adv. Ind. Eng. Polym. Res. 2023, 6, 436–450. [Google Scholar] [CrossRef]
  8. Andrew, J.J.; Dhakal, H.N. Sustainable biobased composites for advanced applications: Recent trends and future opportunities—A critical review. Compos. Part C Open Access 2022, 7, 100220. [Google Scholar] [CrossRef]
  9. Graupner, N.; Müssig, J. Cellulose Fiber-Reinforced PLA versus PP. Int. J. Polym. Sci. 2017, 2017, 6059183. [Google Scholar] [CrossRef]
  10. Mofokeng, J.P.; Luyt, A.S.; Tábi, T.; Kovács, J. Comparison of injection moulded, natural fibre-reinforced composites with PP and PLA as matrices. J. Thermoplast. Compos. Mater. 2012, 25, 927–948. [Google Scholar] [CrossRef]
  11. Farah, S.; Anderson, D.G.; Langer, R. Physical and mechanical properties of PLA, and their functions in widespread applications—A comprehensive review. Adv. Drug Deliv. Rev. 2016, 107, 367–392. [Google Scholar] [CrossRef] [PubMed]
  12. Trivedi, A.K.; Gupta, M.K.; Singh, H. PLA based biocomposites for sustainable products: A review. Adv. Ind. Eng. Polym. Res. 2023, 6, 382–395. [Google Scholar] [CrossRef]
  13. Wen-Dong, T.; Guang-Jian, H.; Wei-Tao, H.; Xin-Liang, Z.; Xian-Wu, C.; Xiao-Chun, Y. The reactive compatibilization of PLA/PP blends and improvement of PLA crystallization properties induced by in situ UV irradiation. CrystEngComm 2021, 23, 864–875. [Google Scholar] [CrossRef]
  14. Andrady, A.L.; Hamid, H.; Torikai, A. Effects of solar UV and climate change on materials. Photochem. Photobiol. Sci. 2011, 10, 292–300. [Google Scholar] [CrossRef]
  15. Andrady, A.L.; Heikkilä, A.M.; Pandey, K.K.; Bruckman, L.S.; White, C.C.; Zhu, M.; Zhu, L. Effects of UV radiation on natural and synthetic materials. Photochem. Photobiol. Sci. 2023, 22, 1177–1202. [Google Scholar] [CrossRef]
  16. Kowalski, W. Ultraviolet Germicidal Irradiation Handbook UVGI for Air and Surface Disinfection, 1st ed.; Springer: Berlin/Heidelberg, Germany, 2009. [Google Scholar]
  17. Sklar, L.R.; Almutawa, F.; Lim, H.W.; Hamzavi, I. Effects of ultraviolet radiation, visible light, and infrared radiation on erythema and pigmentation: A review. Photochem. Photobiol. Sci. 2013, 12, 54–64. [Google Scholar] [CrossRef]
  18. Herndon, J.M.; Hoisington, R.D.; Whiteside, M. Deadly Ultraviolet UV-C and UV-B Penetration to Earth’s Surface: Human and Environmental Health Implications. J. Geogr. Environ. Earth Sci. Int. 2018, 14, 40245. [Google Scholar] [CrossRef]
  19. Czachor-Jadacka, D.; Pilch-Pitera, B. Progress in development of UV curable powder coatings. Prog. Org. Coat. 2021, 158, 106355. [Google Scholar] [CrossRef]
  20. Ou, Y.; Petersen, P.M. Application of ultraviolet light sources for in vivo disinfection. Jpn. J. Appl. Phys. 2021, 60, 100501. [Google Scholar] [CrossRef]
  21. Guillet, J.E. Fundamental Processes in the UV Degradation and Stabilization of Polymers. In Chemical Transformations of Polymers, 1st ed.; Rado, R., Ed.; Butterworth-Heinemann: Oxford, UK, 1972; pp. 135–144. [Google Scholar]
  22. Zaaba, N.F.; Jaafar, M. A review on degradation mechanisms of polylactic acid: Hydrolytic, photodegradative, microbial, and enzymatic degradation. Polym. Eng. Sci. 2020, 60, 2061–2075. [Google Scholar] [CrossRef]
  23. Niu, Z.; Curto, M.; Gall, M.L.; Demeyer, E.; Asselman, J.; Janssen, C.R.; Dhakal, H.N.; Davies, P.; Catarino, A.I.; Everaert, G. Accelerated fragmentation of two thermoplastics (polylactic acid and polypropylene) into microplastics after UV radiation and seawater immersion. Ecotoxicol. Environ. Saf. 2024, 271, 115981. [Google Scholar] [CrossRef] [PubMed]
  24. Gijsman, P.; Meijers, G.; Vitarelli, G. Comparison of the UV-degradation chemistry of polypropylene, polyethylene, polyamide 6 and polybutylene terephthalate. Polym. Degrad. Stab. 1999, 65, 433–441. [Google Scholar] [CrossRef]
  25. Ali, S.S.; Elsamahy, T.; Koutra, E.; Kornaros, M.; El-Sheekh, M.; Abdelkarim, E.A.; Zhu, D.; Sun, J. Degradation of conventional plastic wastes in the environment: A review on current status of knowledge and future perspectives of disposal. Sci. Total Environ. 2021, 771, 144719. [Google Scholar] [CrossRef] [PubMed]
  26. Gulmine, J.V.; Janissek, P.R.; Heise, H.M.; Akcelrud, L. Degradation profile of polyethylene after artificial accelerated weathering. Polym. Degrad. Stab. 2003, 79, 385–397. [Google Scholar] [CrossRef]
  27. Senatova, S.I.; Senatov, F.S.; Kuznetsov, D.V.; Stepashkin, A.A.; Issi, J.P. Effect of UV-radiation on structure and properties of PP nanocomposites. J. Alloys Compd. 2017, 707, 304–309. [Google Scholar] [CrossRef]
  28. Rios, A.d.S.; Júnior, W.F.d.A.; Moura, E.P.d.; Deus, E.P.d.; Feitosa, J.P.d.A. Effects of accelerated aging on mechanical, thermal and morphological behavior of polyurethane/epoxy/fiberglass composites. Polym. Test. 2016, 50, 152–163. [Google Scholar] [CrossRef]
  29. Janutėnienė, J.; Vasylius, M.; Tadžijevas, A.; Kartašovas, V.; Šapalas, D.; Grigaliūnienė, S. Influence of Recycling and UV Exposure on the Properties of 3D Printing Polymer Materials. Polymers 2024, 16, 3292. [Google Scholar] [CrossRef]
  30. François-Heude, A.; Richaud, E.; Desnoux, E.; Colin, X. Influence of temperature, UV-light wavelength and intensity on polypropylene photothermal oxidation. Polym. Degrad. Stab. 2014, 100, 10–20. [Google Scholar] [CrossRef]
  31. Andrady, A.L.; Barnes, P.W.; Bornman, J.F.; Gouin, T.; Madronich, S.; White, C.C.; Zepp, R.G.; Jansen, M.A.K. Oxidation and fragmentation of plastics in a changing environment; from UV-radiation to biological degradation. Sci. Total Environ. 2022, 851, 158022. [Google Scholar] [CrossRef]
  32. Yousif, E.; Haddad, R. Photodegradation and photostabilization of polymers, especially polystyrene: Review. SpringerPlus 2013, 2, 398. [Google Scholar] [CrossRef]
  33. Virág, A.D.; Tóth, C.; Molnár, K. Photodegradation of polylactic acid: Characterisation of glassy and melt behaviour as a function of molecular weight. Int. J. Biol. Macromol. 2023, 252, 126336. [Google Scholar] [CrossRef] [PubMed]
  34. Man, C.; Zhang, C.; Liu, Y.; Wang, W.; Ren, W.; Jiang, L.; Reisdorffer, F.; Nguyen, T.P.; Dan, Y. Poly (lactic acid)/titanium dioxide composites: Preparation and performance under ultraviolet irradiation. Polym. Degrad. Stab. 2012, 97, 856–862. [Google Scholar] [CrossRef]
  35. Iñiguez, M.E.; Conesa, J.A.; Fullana, A. Recyclability of four types of plastics exposed to UV irradiation in a marine environment. Waste Manag. 2018, 79, 339–345. [Google Scholar] [CrossRef] [PubMed]
  36. Kuyyakanont, A.; Iwata, M. Study of different degradation effects in UV-sensitive polymers using xenon lamp and deuterium lamp to simulate UV irradiation in space environment. Nucl. Instrum. Methods Phys. Res. Sect. B 2024, 549, 165267. [Google Scholar] [CrossRef]
  37. Jansen, M.A.K.; Andrady, A.L.; Bornman, J.F.; Aucamp, P.J.; Bais, A.F.; Banaszak, A.T.; Barnes, P.W.; Bernhard, G.H.; Bruckman, L.S.; Busquets, R.; et al. Plastics in the environment in the context of UV radiation, climate change and the Montreal Protocol: UNEP Environmental Effects Assessment Panel, Update 2023. Photochem. Photobiol. Sci. 2024, 23, 629–650. [Google Scholar] [CrossRef]
  38. Maraveas, C.; Kyrtopoulos, I.V.; Arvanitis, K.G.; Bartzanas, T. The Aging of Polymers under Electromagnetic Radiation. Polymers 2024, 16, 689. [Google Scholar] [CrossRef]
  39. Lu, T.; Solis-Ramos, E.; Yi, Y.; Kumosa, M. UV degradation model for polymers and polymer matrix composites. Polym. Degrad. Stab. 2018, 154, 203–210. [Google Scholar] [CrossRef]
  40. Mikac, L.; Csáki, A.; Zentai, B.; Rigó, I.; Veres, M.; Tolić, A.; Gotić, M.; Ivanda, M. UV Irradiation of Polyethylene Terephthalate and Polypropylene and Detection of Formed Microplastic Particles Down to 1 μm. ChemPlusChem 2024, 89, e202300497. [Google Scholar] [CrossRef]
  41. ISO 4892-1; Third Edition. Plastics—Methods of Exposure to Laboratory Light Sources—Part 1: General Guidance. International Organization for Standardization: Geneva, Switzerland, 2016.
  42. ISO 4892-3; Fourth Edition. Plastics—Methods of Exposure to Laboratory Light Sources—Part 3: Fluorescent UV Lamps. International Organization for Standardization: Geneva, Switzerland, 2016.
  43. ISO/CIE 11664-4; First Edition. Colorimetry—Part 4: CIE 1976 L*a*b* Colour Space. International Organization for Standardization: Geneva, Switzerland, 2019.
  44. ISO/CIE 11664-2; First Edition. Colorimetry—Part 2: CIE Standard Illuminants. International Organization for Standardization: Geneva, Switzerland, 2022.
  45. ISO 4582; Fourth Edition. Plastics—Determination of Changes in Colour and Variations in Properties After Exposure to Glass-Filtered Solar Radiation, Natural Weathering or Laboratory Radiation Sources. International Organization for Standardization: Geneva, Switzerland, 2017.
Figure 1. Diagram of the UV aging chamber (left side) and approach followed for positioning and flipping of the samples (right side).
Jcs 09 00317 g001
Figure 2. Diagram of the optical system used to acquire images of the samples.
Jcs 09 00317 g002
Figure 3. Diagram of the spectrophotometer used for spectral reflectance and colorimetric measurements on the samples.
Jcs 09 00317 g003
Figure 4. Images obtained in the different components (R, G, B, W) and in full color (RGB) of a specimen of PLA + MC (original specimen) at the beginning of the UV test (dimensions of the images: width × height = 12 × 12 mm2).
Jcs 09 00317 g004
Figure 5. Images obtained in the different components (R, G, B, W) and in full color (RGB) of a specimen of PLA + MC (original specimen) at week 5 of the UV test (dimensions of the images: width × height = 12 × 12 mm2).
Jcs 09 00317 g005
Figure 6. Images obtained in the different components (R, G, B, W) and in full color (RGB) of a specimen of PLA + MC (original specimen) at week 10 of the UV test (dimensions of the images: width × height = 12 × 12 mm2).
Jcs 09 00317 g006
Figure 7. Images obtained in the different components (R, G, B, W) and in full color (RGB) of a specimen of PP + MC (original specimen) at the beginning of the UV test (dimensions of the images: width × height = 12 × 12 mm2).
Jcs 09 00317 g007
Figure 8. Images obtained in the different components (R, G, B, W) and in full color (RGB) of a specimen of PP + MC (original specimen) at week 5 of the UV test (dimensions of the images: width × height = 12 × 12 mm2).
Jcs 09 00317 g008
Figure 9. Images obtained in the different components (R, G, B, W) and in full color (RGB) of a specimen of PP + MC (original specimen) at week 10 of the UV test (dimensions of the images: width × height = 12 × 12 mm2).
Jcs 09 00317 g009
Figure 10. Images obtained in the different components (R, G, B, W) and in full color (RGB) of a specimen of PLA + MC (specimen exposed to UV radiation) at the beginning of the UV test (dimensions of the images: width × height = 12 × 12 mm2).
Jcs 09 00317 g010
Figure 11. Images obtained in the different components (R, G, B, W) and in full color (RGB) of a specimen of PLA + MC (specimen exposed to UV radiation) at week 5 of the UV test (dimensions of the images: width × height = 12 × 12 mm2).
Jcs 09 00317 g011
Figure 12. Images obtained in the different components (R, G, B, W) and in full color (RGB) of a specimen of PLA + MC (specimen exposed to UV radiation) at week 10 of the UV test (dimensions of the images: width × height = 12 × 12 mm2).
Jcs 09 00317 g012
Figure 13. Images obtained in the different components (R, G, B, W) and in full color (RGB) of a specimen of PP + MC (specimen exposed to UV radiation) at the beginning of the UV test (dimensions of the images: width × height = 12 × 12 mm2).
Jcs 09 00317 g013
Figure 14. Images obtained in the different components (R, G, B, W) and in full color (RGB) of a specimen of PP + MC (specimen exposed to UV radiation) at week 5 of the UV test (dimensions of the images: width × height = 12 × 12 mm2).
Jcs 09 00317 g014
Figure 15. Images obtained in the different components (R, G, B, W) and in full color (RGB) of a specimen of PP + MC (specimen exposed to UV radiation) at week 10 of the UV test (dimensions of the images: width × height = 12 × 12 mm2).
Jcs 09 00317 g015
Figure 16. Spectral reflectance measurements in the visible spectrum for the specimens of PLA + MC as well as for the white calibration standard (white reference) during the 10 weeks of the UV accelerated aging test (the full results are shown in Table A1 and Table A2 of Appendix A).
Jcs 09 00317 g016
Figure 17. Colorimetric representations in the CIE 1976 L*a*b* color space [43] for the specimens of PLA + MC as well as for the white calibration standard (white reference) during the 10 weeks of the UV accelerated aging test (the full results are shown in Table A4 of Appendix A).
Jcs 09 00317 g017
Figure 18. Spectral reflectance measurements in the visible spectrum for the specimens of PP + MC as well as for the white calibration standard (white reference) during the 10 weeks of the UV accelerated aging test (the full results are shown in Table A1 and Table A3 of Appendix A).
Jcs 09 00317 g018
Figure 19. Colorimetric representations in the CIE 1976 L*a*b* color space [43] for the specimens of PP + MC as well as for the white calibration standard (white reference) during the 10 weeks of the UV accelerated aging test (the full results are shown in Table A5 of Appendix A).
Jcs 09 00317 g019
Table 1. Color differences calculated for the PLA + MC and PP + MC specimens stored in the dark (original specimen) in week 5 relative to week 1 (DK 05 vs. DK 01), in week 10 relative to week 5 (DK 10 vs. DK 05), and in week 10 relative to week 1 (DK 10 vs. DK 01).
Color
Differences
DK 05 vs. DK 01DK 10 vs. DK 05DK 10 vs. DK 01
PLA + MCPP + MCPLA + MCPP + MCPLA + MCPP + MC
ΔL*0.10.30.0−0.30.20.0
Δa*0.00.00.00.0−0.10.0
Δb*−0.3−0.40.10.2−0.1−0.2
ΔE*ab0.30.50.10.40.20.2
Table 2. Color differences calculated for the PLA + MC and PP + MC specimens exposed to UV radiation compared to the specimens stored in the dark (original specimens) in week 1 (WK 01 vs. DK 01), week 5 (WK 05 vs. DK 01), and week 10 (WK 10 vs. DK 01).
Color
Differences
WK 01 vs. DK 01WK 05 vs. DK 01WK 10 vs. DK 01
PLA + MCPP + MCPLA + MCPP + MCPLA + MCPP + MC
ΔL*1.71.83.83.54.64.6
Δa*0.70.60.10.4−0.20.4
Δb*−4.3−4.1−8.1−5.8−9.3−5.6
ΔE*ab4.74.59.06.810.47.3
Disclaimer/Publisher’s Note: The statements, opinions and data contained in all publications are solely those of the individual author(s) and contributor(s) and not of MDPI and/or the editor(s). MDPI and/or the editor(s) disclaim responsibility for any injury to people or property resulting from any ideas, methods, instructions or products referred to in the content.

