Article

Experimental Study of the Combined Use of Silver Nanoparticles and Graphene Oxide to Predict the Operational Properties of New Bactericidal Composite Materials

by
Svetlana E. Dimitrieva
1,*,
Andrey N. Timonin
1,2,
Sergey A. Baskakov
1,3,
Oksana A. Kuznetsova
4 and
Alexey V. Shkirin
1,5
1
P.N. Lebedev Physical Institute of the Russian Academy of Sciences, Leninskiy Prospekt 53, 119991 Moscow, Russia
2
Federal Research Center of Nutrition, Biotechnology and Food Safety, Ustinsky proyezd 2/14, 109240 Moscow, Russia
3
Federal Research Center of Problems of Chemical Physics and Medicinal Chemistry RAS, Chernogolovka, 142432 Moscow, Russia
4
V. M. Gorbatov Federal Research Center for Food Systems, Talalikhina St. 26, 109316 Moscow, Russia
5
Laser Physics Department, National Research Nuclear University MEPhI, Kashirskoe Sh. 31, 115409 Moscow, Russia
*
Author to whom correspondence should be addressed.
J. Compos. Sci. 2025, 9(7), 315; https://doi.org/10.3390/jcs9070315
Submission received: 23 May 2025 / Revised: 9 June 2025 / Accepted: 18 June 2025 / Published: 20 June 2025

Abstract

:
The aim of combining agents with different antibacterial mechanisms of action is to achieve a combined effect, which could be either the sum of their individual effects or a synergistic effect greater than the sum of these individual contributions. Mathematically, it seems reasonable to use the simple addition of agent efficacy coefficients to simplify calculations. However, this article examines the validity of this simplification in mathematical models by calculating individual and synergistic bactericidal effects using the “black box” model. All agents were characterized according to current laboratory practice. The relative antibacterial efficacy coefficients of silver nanoparticles in a colloid with chitosan succinate (nAg SCC HTZ) and graphene oxide nanoparticles (GO) were determined. In particular, the activity of silver colloid was found to be 0.29 times the bactericidal activity of erythromycin, while the activity of GO was 0.107 times the bactericidal activity of the same antibiotic against Pseudomonas aeruginosa. At the same time, all the agents demonstrated stable bacteriostatic activity and were well described by linear regression. Testing the combined effects of agents did not reveal any drug synergy. Thus, the effect of silver at a given dose, followed by the addition of GO at a bacteriostatic dose, yielded an unreliable response, different from that of the “silver–GO” system at the same simultaneous inhibition doses (p > 0.1). The data obtained can be used to develop novel combined composite materials with bactericidal properties and to predict their characteristics.

1. Introduction

The demand for new functional materials with bactericidal properties is consistently high. Therefore, the study of the effects of silver nanoparticles and graphene oxide on the functional properties of these materials is relevant and of practical interest for predicting their operational characteristics. The bactericidal properties of silver and its nanoparticles (nAg) have been well established [1], as have the antibacterial effects of graphene oxide (GO) [2]. Many combined materials using these materials have been developed or are currently being developed, and they are claimed to possess bactericidal functions [3].
However, the effective contribution of each component and the assessment of their synergistic effect are often beyond the scope of current research, significantly complicating the mathematical modeling and prediction of the operational properties of these new materials.
Despite this, the demand for novel functional materials with bactericidal properties continues to grow. Therefore, it is important to study the effective contribution and synergy between silver nanoparticles and graphene oxide for the development of more accurate mathematical models and a better understanding of the properties of these materials.
Graphene oxide (GO) is a precursor material used in the synthesis of graphene. It has a large number of epoxy and hydroxyl groups on its surface, which give it amphiphilic properties and the ability to interact with hydrogen and other molecules. These interactions make it highly soluble and allow it to mix with other materials and functionalize with metal ions [4,5,6].
There are three main strategies that are generally recognized for combating microorganisms [7,8]:
  • Bactericidal: This process involves releasing an antibacterial substance, also known as “drug release” (DR). The drug is loaded into a carrier and typically released through diffusion.
  • “Contact-killing” (CK): This method uses surfactants to directly destroy bacterial biofilms.
  • “Anti-adhesion” (AA): This strategy aims to prevent the early stages of colonization and the formation of bacterial biofilms by inhibiting their adhesion to surfaces.
Graphene oxide allows for the use of all three strategies [9,10,11]. The first strategy involves the “nano-knife” mechanism, which describes the death of microorganisms due to the mechanical action of the sharp edges of GO on the cell wall of a microorganism, resulting in the rupture of the cell and the release of cellular components into the surrounding environment [12,13]. Additionally, the effects of GO planes and bacterial cell destruction through the extraction of membrane lipids have been discussed [14,15].
Special attention is paid to avoiding the effects on the metabolic pathways of bacterial cells that are characteristic of antibacterial drugs commonly used in medicine and industry. The oxidative stress caused by graphene oxide (GO) occurs due to the chemical reduction of its sheets by microorganisms and their dependence on reactive oxygen species (ROS), which leads to the death of bacterial cells [12,13,16]. In solutions, GO can isolate microorganisms from the external environment, preventing their growth and reproduction [17]. This makes bacterial resistance less likely. However, the effectiveness of GO depends on the configuration of the GO sheets, such as the presence of sharp edges and base surfaces. Therefore, each material made from GO has its own effectiveness [17,18,19]. Thus, the antibacterial and cytotoxic effects of graphene oxide depend on its physical form. This circumstance should be taken into account [11].
The nAg-GO combination is often chosen by researchers because of the unique individual properties of these materials and their proven bactericidal activity. It is believed that the combination of graphene oxide (GO) and colloidal silver (AgNP) demonstrates a number of advantages due to the synergistic interaction of the components. There is evidence that GO and AgNPs exhibit a more pronounced antibacterial effect than each component individually. It is assumed that GO destroys the cell membranes of microorganisms, and AgNPs generate reactive oxygen species (ROS), disrupting bacterial metabolism [20,21]. However, we have not found any works in which the phenomenon of synergy between GO and AgNP is deeply investigated using a sufficiently large statistical sample that excludes artifacts. So, this was the main motivation for our study.

2. Materials and Methods

For this study, we used a suspension of Pseudomonas aeruginosa bacteria that form biofilms. We cultured these bacteria to obtain a suspension with at least 1 × 10⁵ CFU/cm3.
We obtained electron micrographs of the samples using a Zeiss SUPRA 25 scanning electron microscope (Carl Zeiss AG, Jena, Germany) at an electron energy of 3.4 keV and a chamber pressure of 2 × 10⁻⁵ Pa. The samples were prepared by placing the materials we were investigating on a silicon wafer in the form of a powder or liquid.
The analysis of the percentage composition of the elements C, H, N, S, and O was performed using a Vario EL Cube elemental analyzer (Elementar GmbH, Langenselbold, Germany), using the Dumas–Pregl method. This technique involves burning samples in a stream of pure oxygen, reducing nitrogen oxides, and separating the gaseous combustion products using a chromatographic column with thermal conductivity detection. The concentrations of the elements are determined by measuring the levels of CO2, H2O, N2, and SO2 in the combustion products.
Infrared (IR) spectra were obtained using a Perkin Elmer Spectrum Two Fourier spectrometer (PerkinElmer, Inc.,Waltham, Massachusetts, USA) equipped with an ultra-attenuated total reflectance (UATR) accessory. The spectra were collected in the range from 450 to 4000 cm−1. The sample was positioned on a zinc selenide (ZnSe) prism coated with a layer of diamond and compressed with a force equivalent to 100 units on the device scale. The prism was subsequently scanned.
Several materials were synthesized and characterized for this study. Graphene oxide (GO) was prepared according to a method described in reference [22]. To analyze GO, a suspension with a concentration of 1 milligram per milliliter (mg/mL) was prepared and subjected to ultrasonication for one hour. The GO suspension was then serially diluted by a factor of 100, and a droplet of the diluted suspension was deposited onto a silicon wafer and left to air-dry at room temperature.

3. Results

The thickness of graphene oxide layers is usually estimated using atomic force microscopy (AFM) data. According to the literature (for example, [23]), the thickness of a single graphene oxide layer is usually around 1.6 nanometers (nm) with a surface roughness of up to 0.6 nm. The higher the oxygen content in the GO, the thicker the layer.
For the analysis, GO suspension with a concentration of 1 mg/mL was prepared. This suspension was subjected to ultrasound for 1 h, then diluted 100 times and applied onto a silicon wafer. The AFM data showed that almost all GO particles had a similar thickness, estimated to be between 1.00 and 1.60 nanometers. This corresponds to a single layer. Figure 1 displays a series of AFM images and a profile of GO particles. Analysis of the thickness differences along the profile revealed that at least 80% of the particles in suspension were single-layer graphene oxide.
X-ray photoelectron spectroscopy (XPS) [24] is widely used to certify carbon materials, including graphene oxide. The spectra obtained from XPS contain information about the chemical composition of the material, specifically the thin near-surface layer rather than the entire sample. For single-layer graphene oxide nanosheets, it is expected that the composition determined using XPS would be the same as the bulk composition.
Figure 2 presents the characteristic shape of the X-ray photoelectron spectroscopy (XPS) spectrum of a graphene oxide (GO) sample, OG-1, obtained by depositing a GO suspension. In addition to the peaks associated with carbon and oxygen, sulfur lines are also visible in the spectrum. The oxygen concentration ranged from 18 at.% to 25 at.%, as determined from analysis results at four different points that were visually distinct. The sulfur and nitrogen concentrations ranged between 0.6 at.% and 1.3 at.%, and less than 0.3 at.%, respectively. These values correspond to a standard emission angle φ of 45 degrees, where φ represents the angle between the sample surface and the analyzer axis.
To increase the depth of analysis, the angle φ was increased to 75 degrees. At the same time, the oxygen concentration increased by approximately 3 at.%, while the concentrations of impurities remained practically unchanged.
Three peaks were observed in the high-resolution C1s spectrum: peak 1 at 284.5 eV from carbon bound to other carbon atoms in the graphene structure, peak 2 at 286.5 eV from carbon bound by a single bond to oxygen, and peak 3 at 288.5 eV from carbon in carbonyl groups. These peaks are consistent with previous studies [25,26]. According to the literature data for graphene oxide, the first maximum in the C1s spectrum at 284–285 eV refers to the electrons of carbon atoms in the states sp2 (Csp2) and sp3 (Csp3), and carbon bound to hydrogen (C-H). The second peak in the range of 286–287 eV refers to carbon atoms bonded to oxygen, such as COOH (carboxyl group), C-O-C (ether group), or C=O (carbonyl group). The third peak (the high-energy shoulder) at 288–289 eV can be attributed to the electrons of carbon atoms in the carboxyl group (COOH).
With the increase in the angle φ, there was an increase in the relative intensities of peaks 2 and 3. These changes suggest that when the graphene oxide film is stored in air, its surface layers are restored.
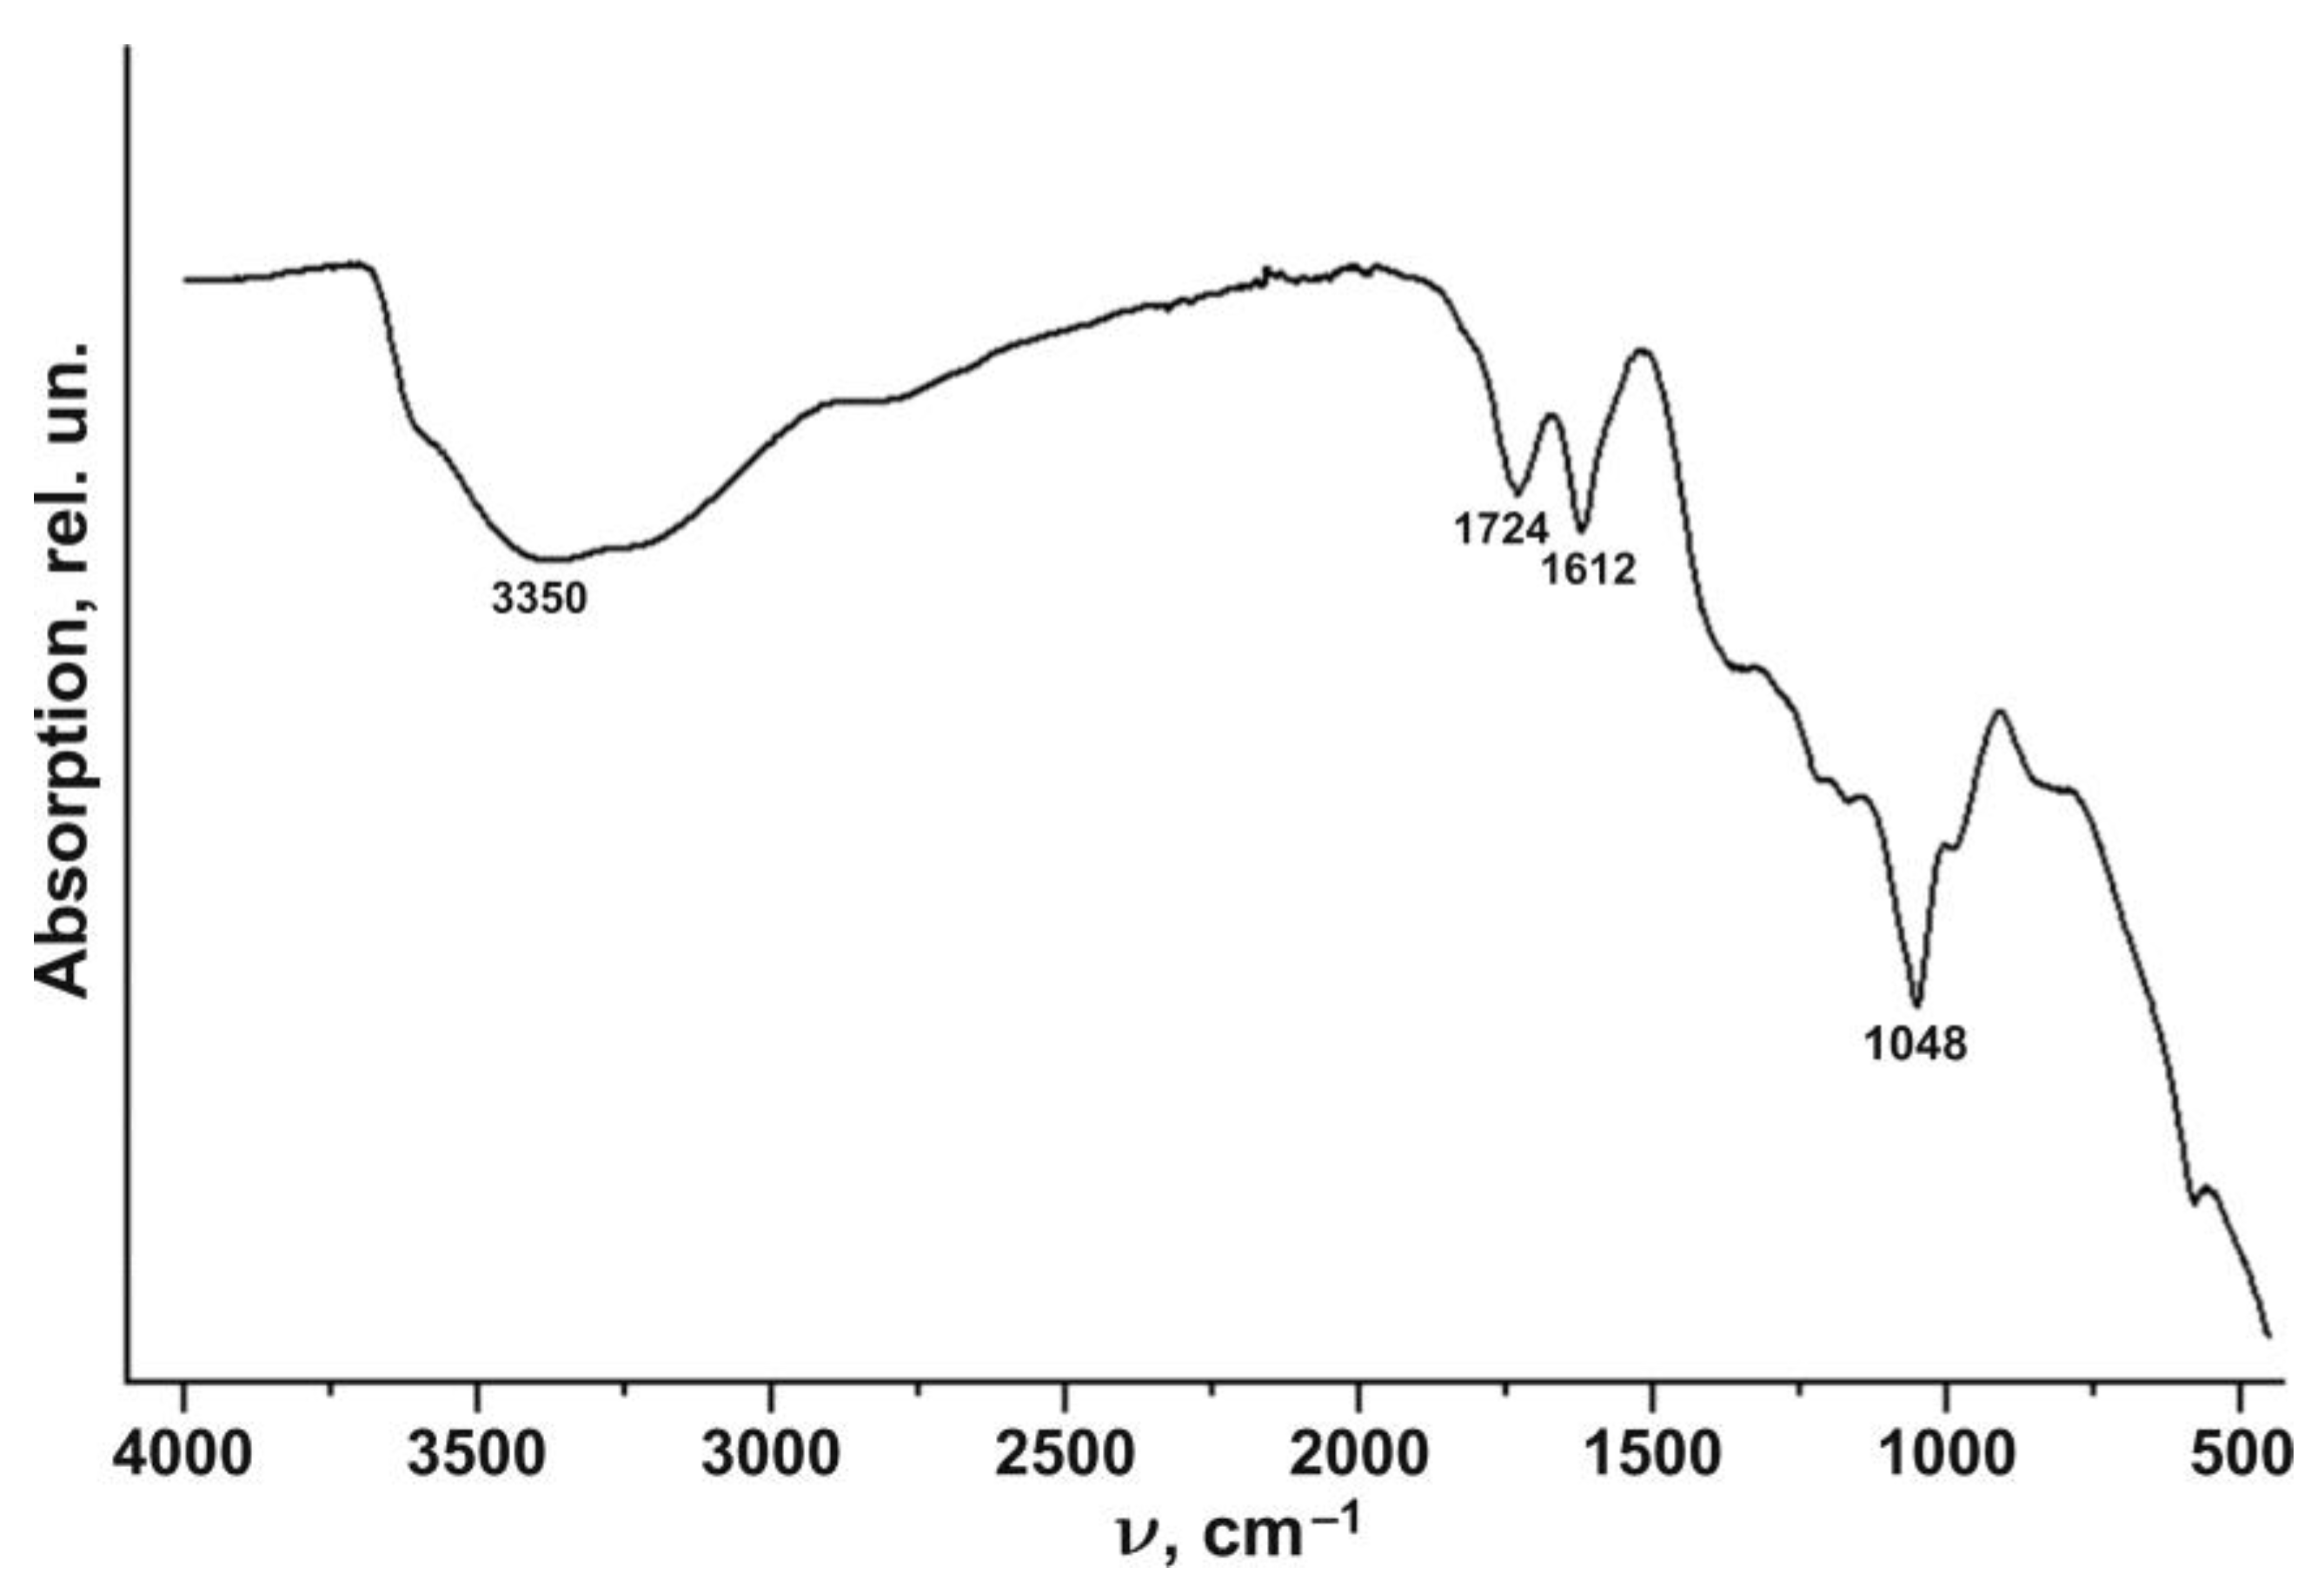
IR spectral analysis, combined with XFS, is a useful method for understanding the chemical structure of graphene oxide and its modifications. The IR spectrum (Figure 3) of GO between 3000 cm−1 and 3700 cm−1 shows a number of overlapping absorption bands.
According to literature data, these bands can be attributed to valence vibrations of OH-H bonds at 1724 cm−1, valence vibrations of carbonyl groups (C=O) or ketones at 1612 cm−1, deformation vibrations of water molecules associated with C-OH bonds at 1360–1380 cm−1 and vibrations in the C-O-C group at 1220 cm−1. Phenyl hydroxyl groups produce vibrations at 1040–1060 cm−1, while epoxy groups show up at 860 cm−1.
Chitosan succinate (SCC HTZ), a salt of chitosan and succinic acid, was used to produce a colloidal form of silver nanoparticles. According to the literature [27], chitosan succinate is known to be hypoallergenic, biocompatible and biodegradable.
Chitosan succinate is highly water-soluble and has deacetylated and substituted groups that acquire a positive charge at a pH below 7. This makes it a polycation that can bind to negatively charged molecules. SCC HTZ contains cationic (NH2) and anionic (COOH) groups, with a molar ratio of 0.25:0.75 (Figure 4a).
Carboxyl groups in the polymer structure determine the ability of a polymer to form complexes with metal ions. These complexes are responsible for the formation of metal clusters and nanoparticles.
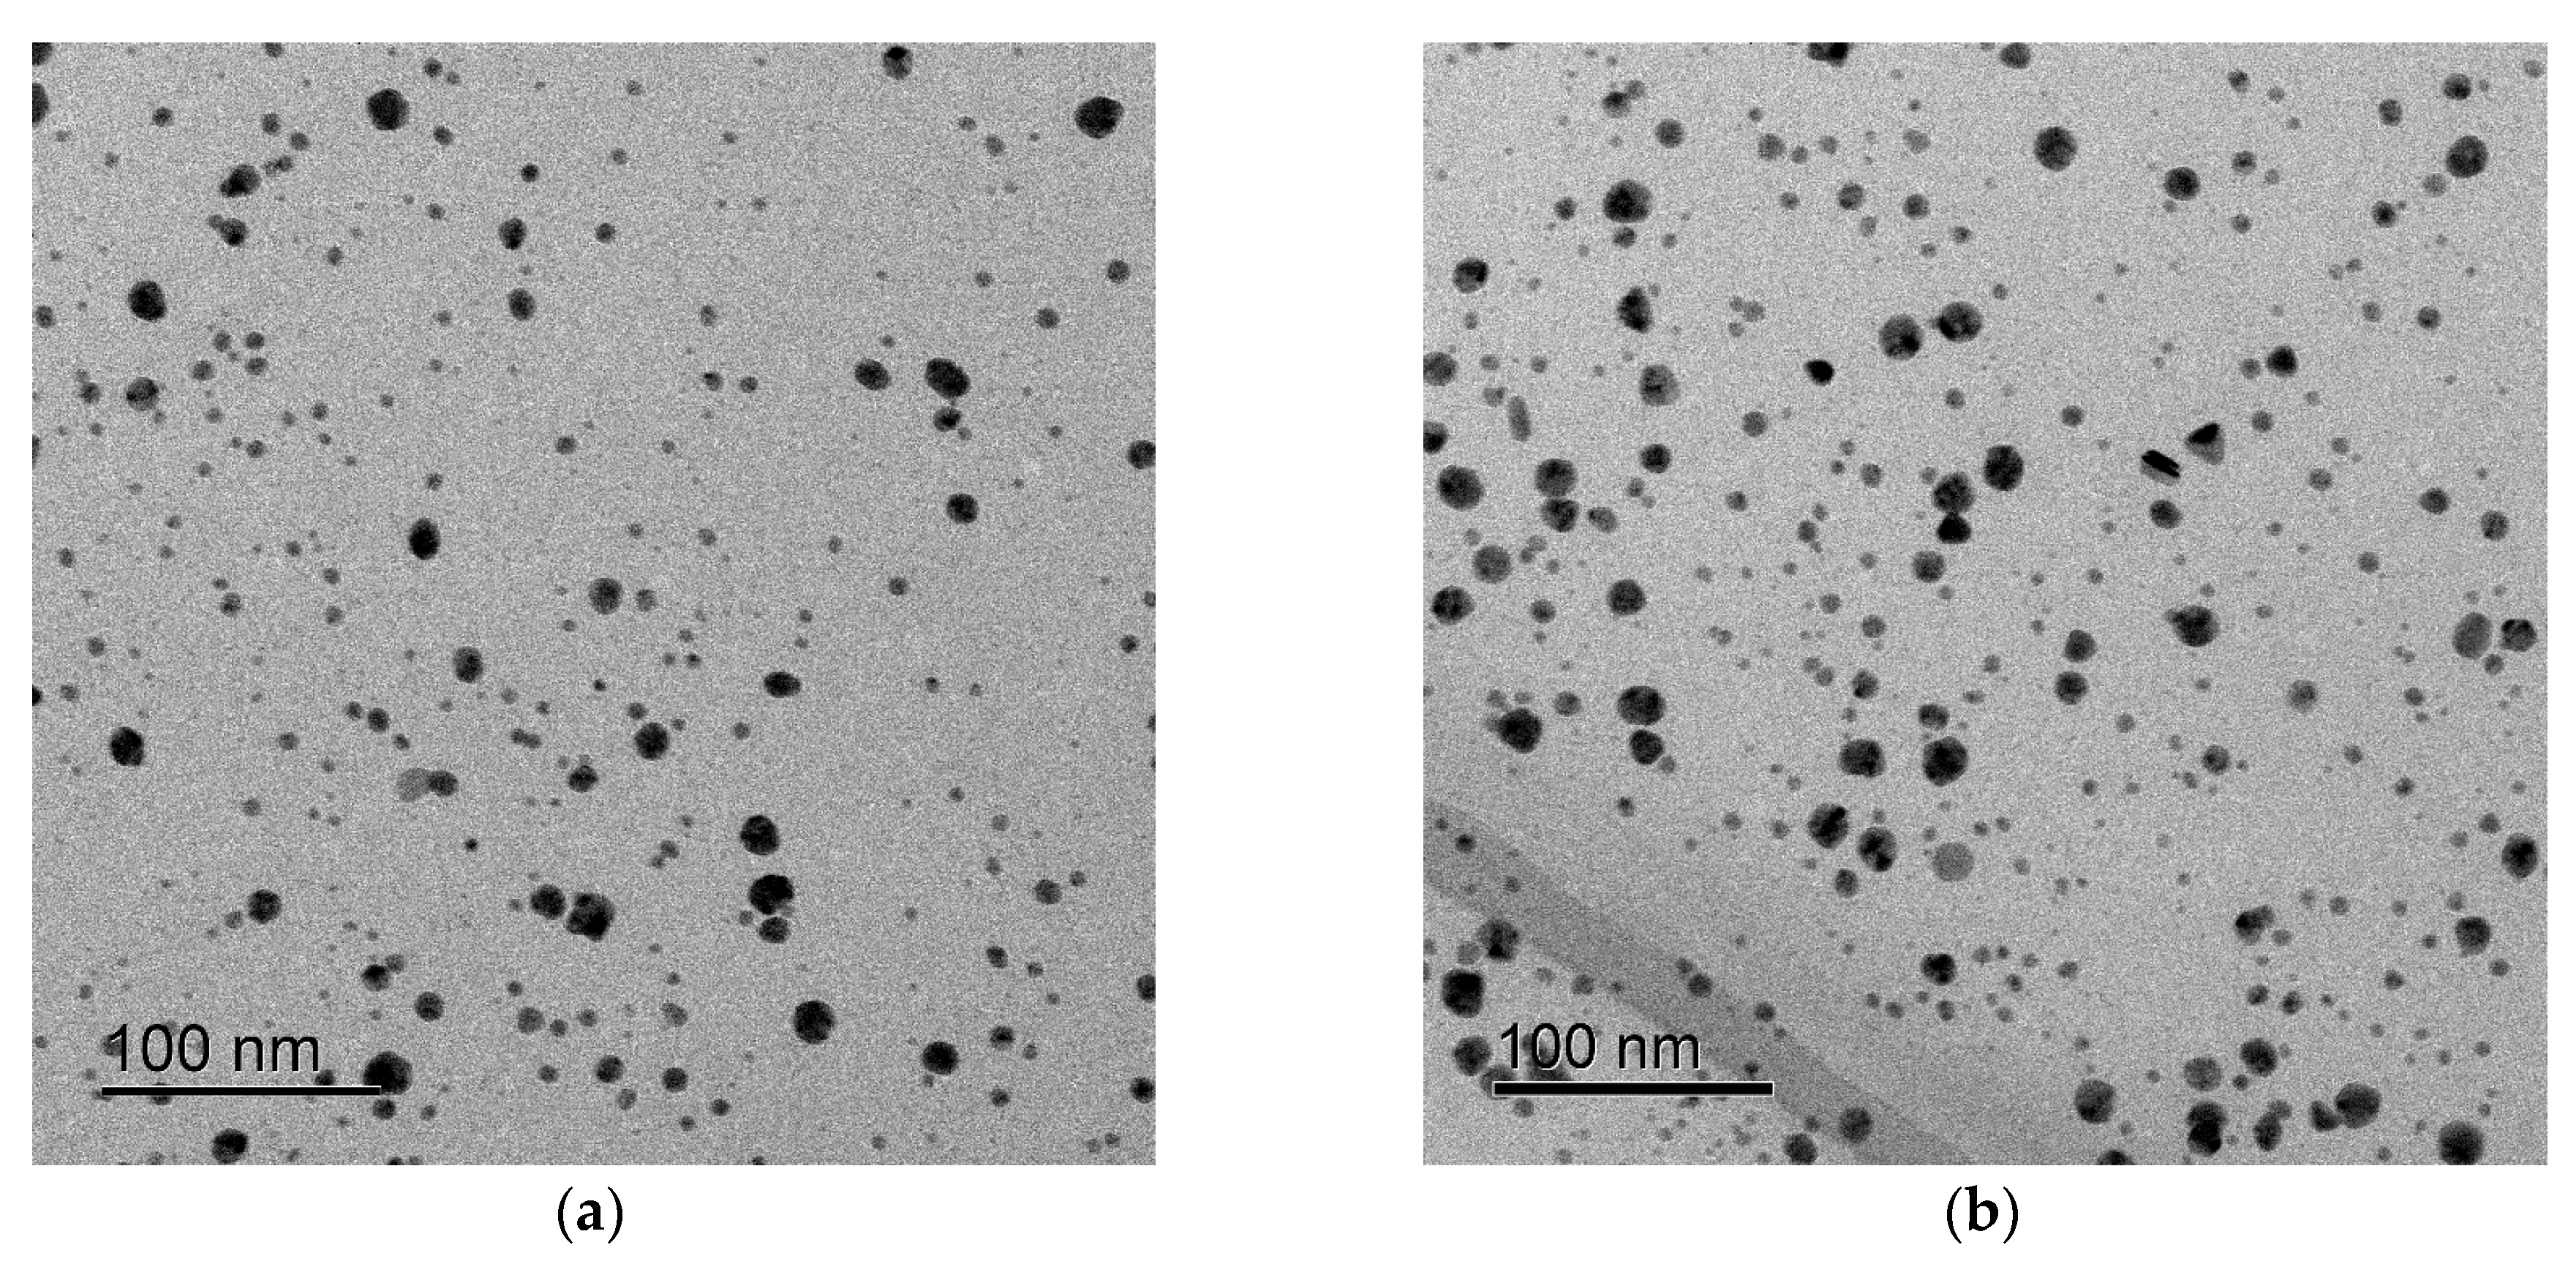
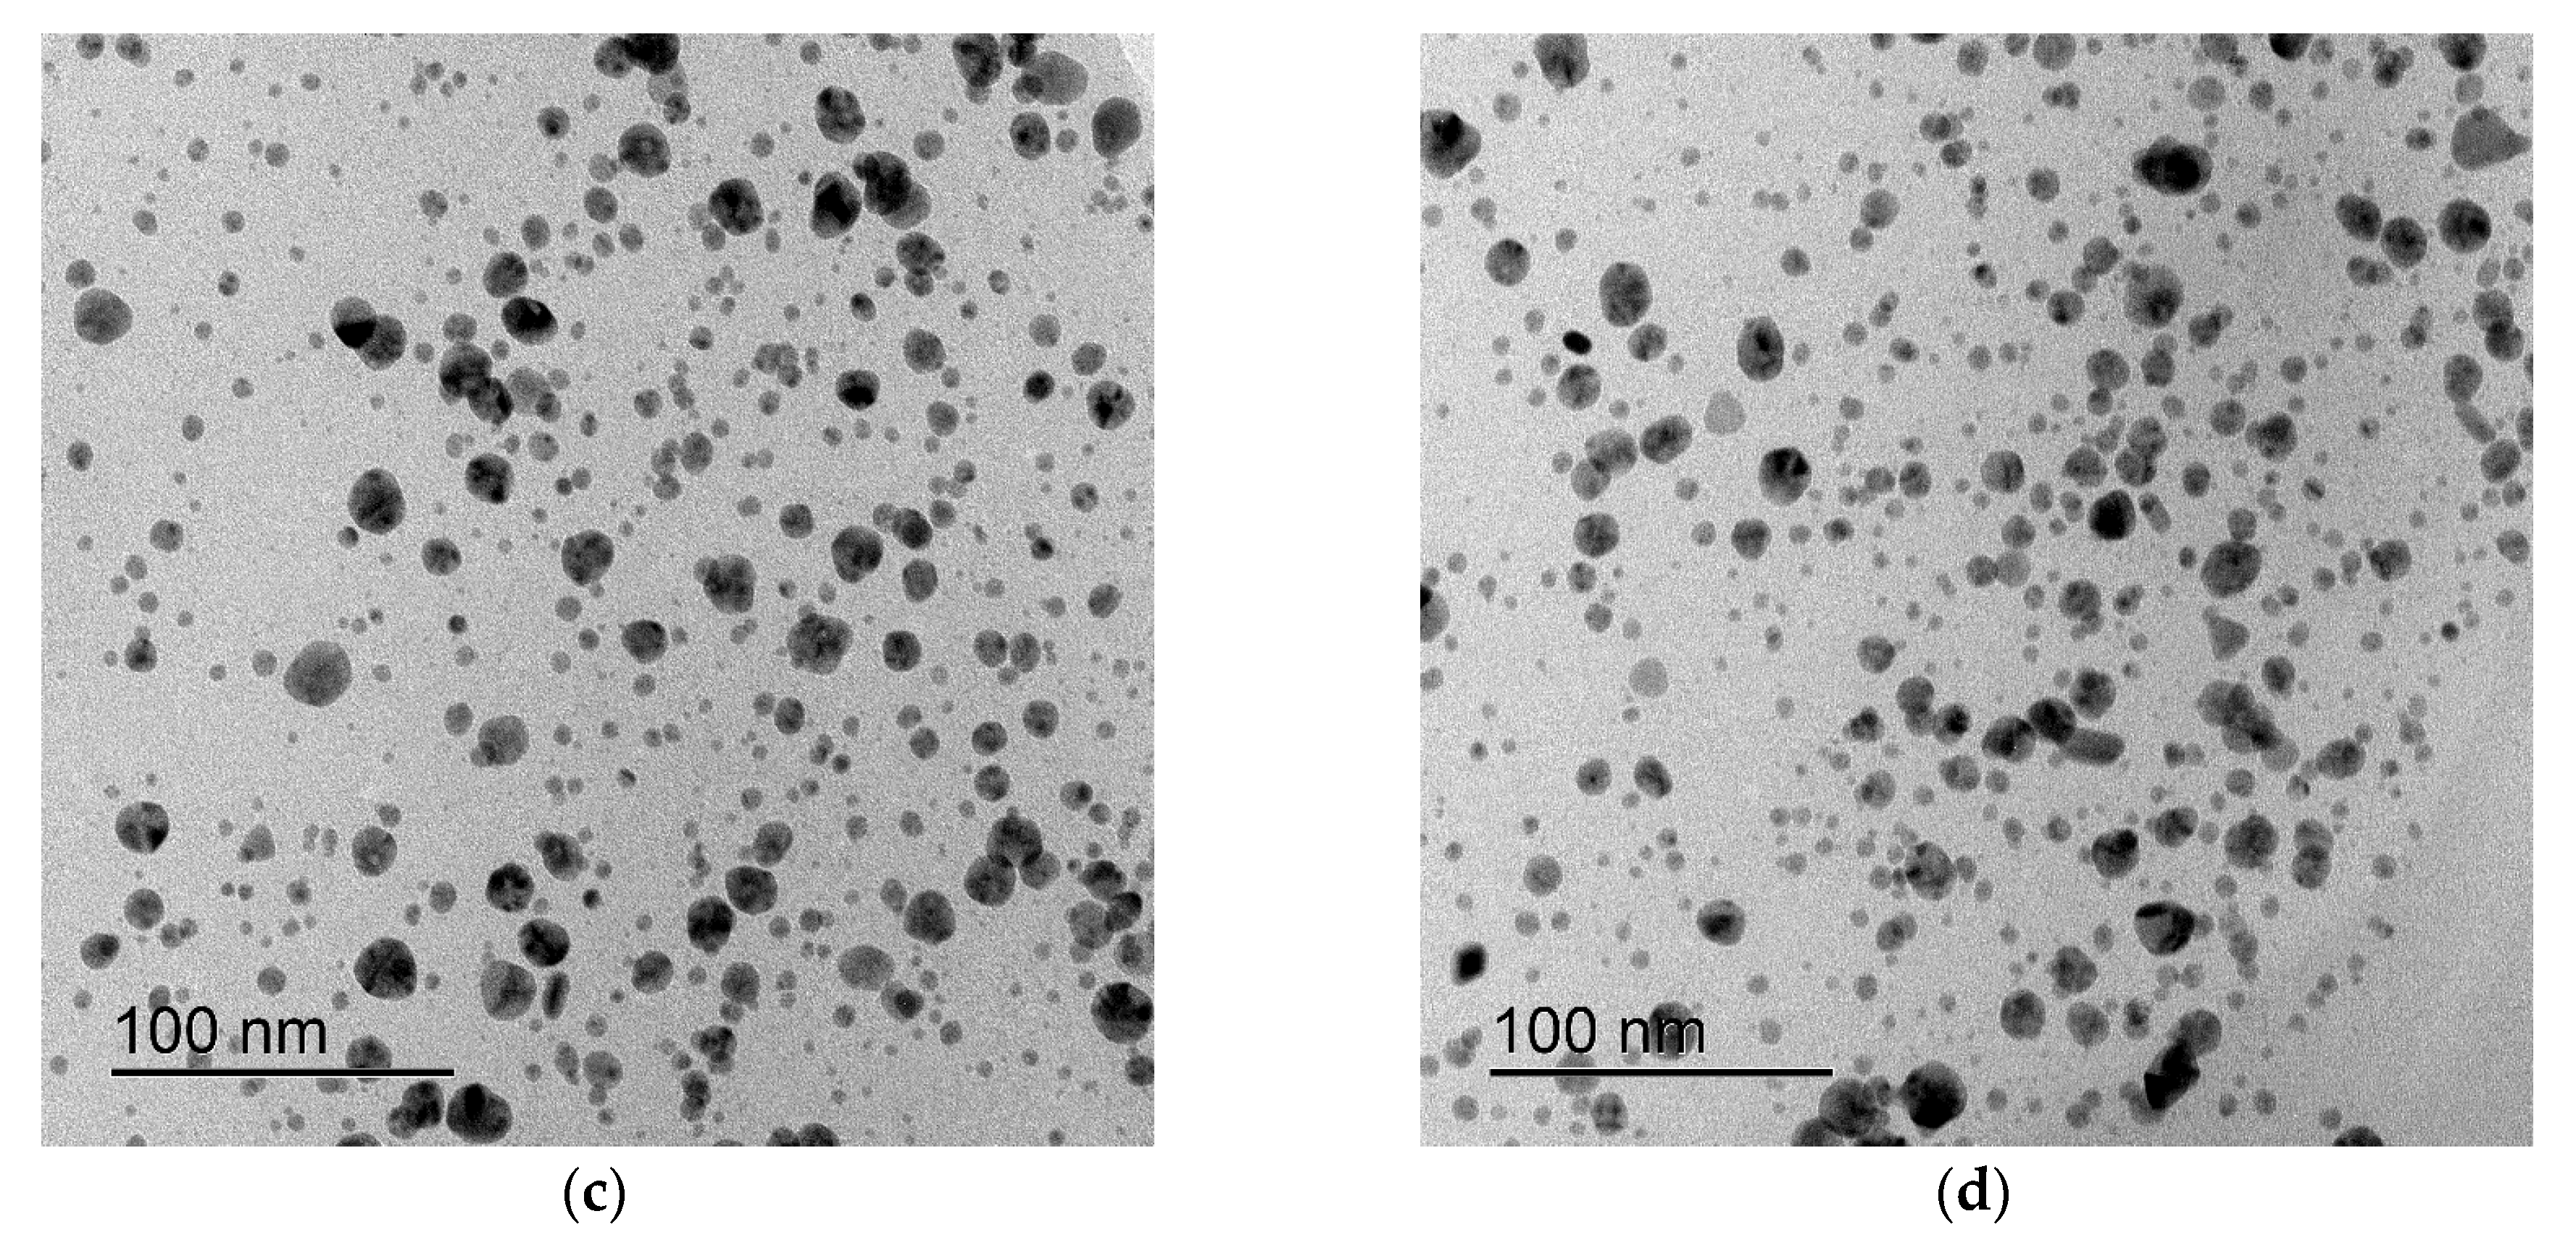
The images of silver nanoparticles shown in Figure 5 were obtained using a transmission electron microscope (TEM). The silver nanoparticles observed were predominantly spherical, with some having facets. They were spatially separated, and no agglomeration was observed. The particle sizes ranged mainly between 3 and 35 nanometers, indicating the high efficiency of SCC HTZ as a stabilizer for nanoparticles.
From the figure, it can be seen that the concentration of silver nanoparticles in nAg SC HTZ 1 is lower than that of nAg SC HTZ 2. This is due to the different initial ratios of silver nitrate and succinic acid used in the synthesis process. Both solutions remained stable for six months without significant sedimentation.
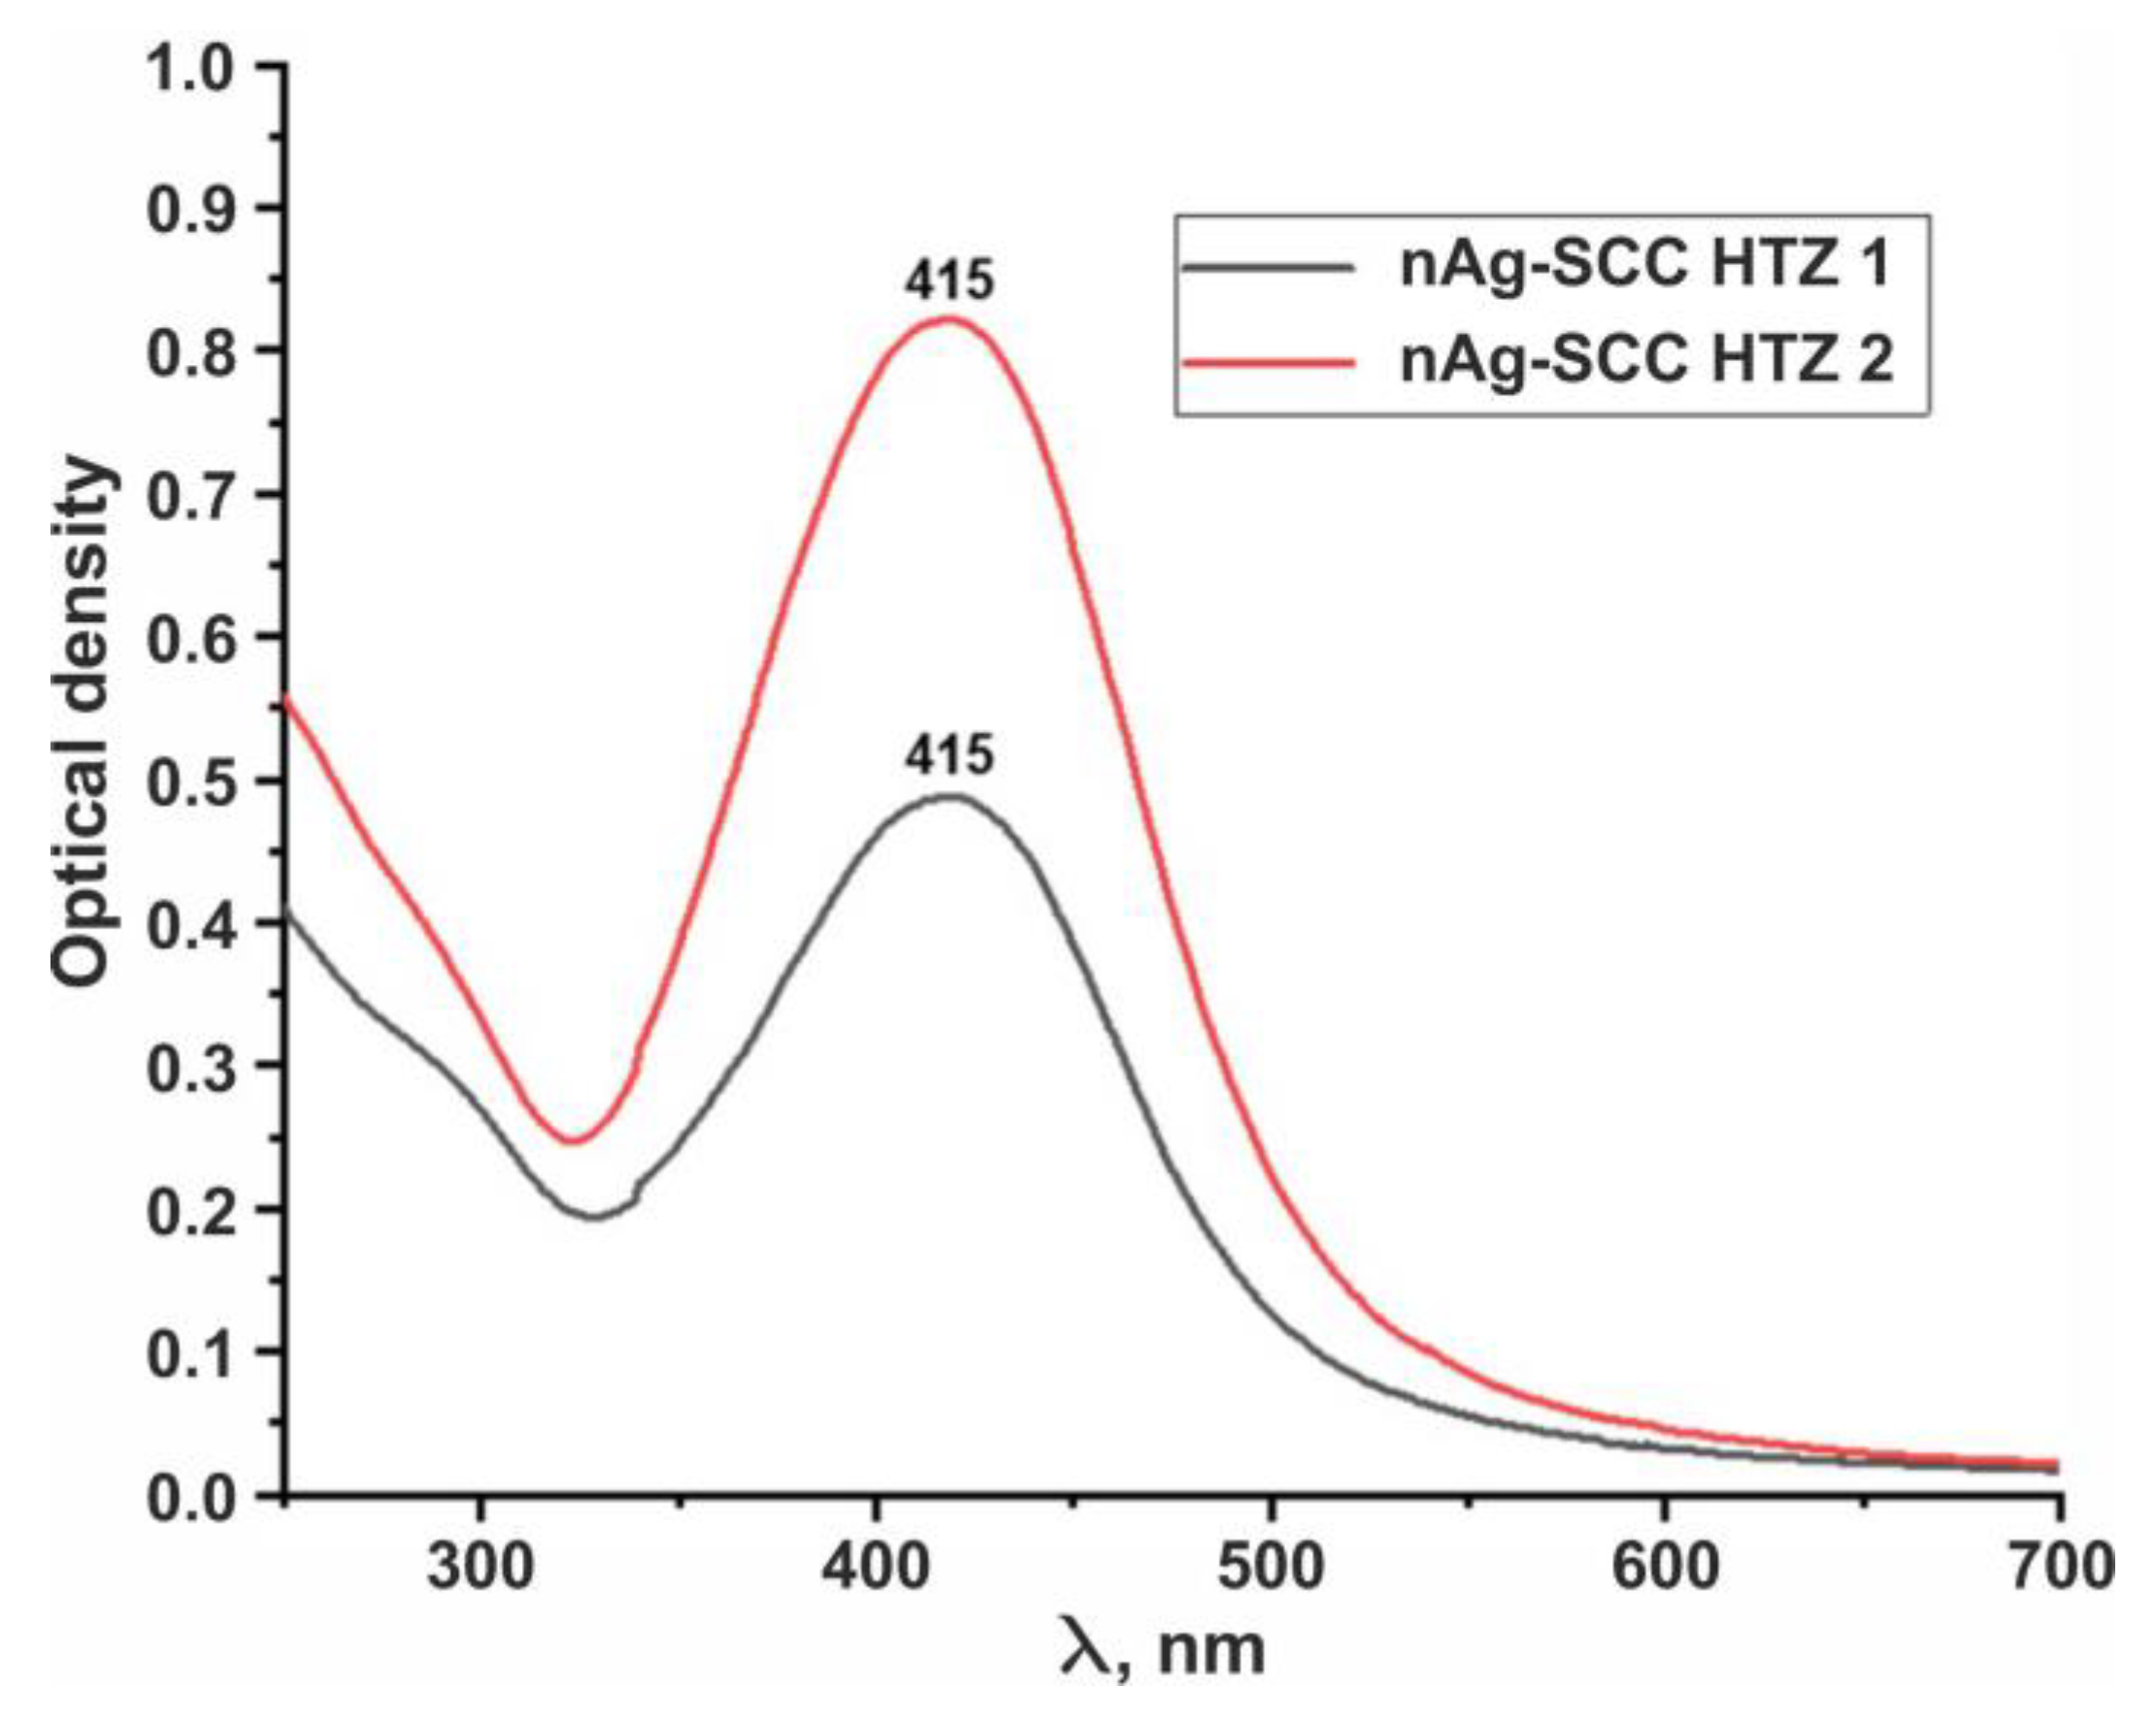
To detect and evaluate the properties of silver nanoparticles, optical methods are often used. This is due to the localized surface plasmon resonance effect. In particular, a specific wavelength of incident light causes collective oscillations of surface electrons in silver nanoparticles. The wavelength of this localized surface plasmon depends on the size, shape, and agglomeration state of the nanoparticles.
Figure 6 shows the plasmon resonance spectrum for different sizes of silver nanoparticles as measured using UV-Vis spectroscopy. As the particle size increases, the absorption peak (λmax) shifts from 400 to 500 nm. For larger nanoparticles, particularly those above 80 nm, a second peak appears at a lower wavelength, resulting from quadrupole resonance in addition to dipole resonance.
From the figure, we can see that the maximum absorption peak occurs at 415 nm, which corresponds to an average particle size of approximately 30–40 nm. This value is slightly larger than the average particle size determined from TEM data. The higher optical density of the SCC XTZ 1 spectrum theoretically indicates a higher concentration of silver in solution. However, in this case, the spectra of the SCC XTZ 1 and SCC XTZ samples are not provided for quantitative analysis of the solutions. So instead, these spectra are used to demonstrate the coincidence of the peak maxima of plasmon resonance, indicating similar particle sizes and their distribution.
The test cultures of microorganisms (Pseudomonas aeruginosa) were grown under aerobic conditions at 37 degrees Celsius on TSB medium. The test cultures consisted of a suspension of bacterial elements—living and dead bacteria and biofilms. Biofilm volumes can be quantified by staining using crystal violet. A UV-2000 spectrophotometer (UNICO, USA) was used to measure the quantity of the biofilms.
The relative quantity of the biofilms was determined using the following method. After the culture had reached the desired density in the growth medium, a sample of the culture was taken and a solution of crystal violet at a concentration of 0.1 M was added to it in a volume of 5 mL. After 5 min of incubation and mixing, the colored solution was centrifuged three times at 1500 rpm for 15 min, with the supernatant being removed each time [28,29,30].
The resulting solution contained the stained microorganisms and biofilms, which were then subjected to spectrophotometric analysis at 595 nm. The optical density value obtained at the absorption maximum serves as a calibration value for comparison with a similar culture solution to which an antibiotic was added at a certain dosage. The standard used in this study was erythromycin, while the agents being studied were OG and nAg SCC HTZ.
The “dose–response” curve was used to calculate the relative efficiency of the agents. If the curve for a standard exhibits a linear relationship with regard to the logarithm of the dose [4],
y = a + b x ,
where x is l o g D . Then, according to the similarity condition, if we replace D with p D we get
y = a * + b D * ,
Then
l o g R = x x * + ( y y * ) / b ,
where R is the coefficient of relative efficiency. To calculate it experimentally, an orthogonal squares method and a 2 × 2 experimental design were used.
L p = T p 1 + T p 2 T c 1 + T c 2 ,
where L p is the contrast of differences between agents. T represents the sum of response values for each level of factors.
L D = T c 1 + T c 2 + T p 1 + T p 2 ,
where L D is the slope contrast of the regression line.
L p x D = T c 1 T c 2 T p 1 + T p 2 ,
where L p x D is the contrast of the deviation from parallelism. The following formula was used to calculate R : R = D c 1 / D c 2 a n t i l o g d L p / L D , d = log D c 2 / D c 1 .
The following formula was used to calculate the lower and upper bounds of the confidence intervals R h ,   R b , based on the use of the F-distribution:
R h = D c 1 / D p 1 a n t i l o g ( 1 / ( F D F t ) · ( ( d L p / L D ) F D d F t ( F p + F D F t ) ) ) ,
R b = D c 1 / D p 1 a n t i l o g ( 1 / ( F D F t ) · ( d L P / L D F D + d F t ( F p + F D F t ) ) ) ,
where FD is the frequency of the agent, F p is the frequency of the placebo, and t is the number of observations. d L p / L D is the ratio d = log D c 2 / D c 1 , L p = T p 1 + T p 2 T c 1 + T c 2 .
F p and F D are the values of the F-ratios for the differences between agents and the slopes of the regression lines. F t is the critical value of F   at a given level of significance and degrees of freedom for intergroup and intragroup comparisons, respectively.
To obtain a linear regression equation for both the standard agent and the tested agents, a method of sequentially increasing the drug dose with a standard step of 96 recording points was used [31]. The standard concentrations of the antibiotic erythromycin for the bactericidal effect were created with an initial concentration of 1 mg/L in increments of 0.2 mg/L. The initial colloidal silver concentration was 0.9 mg/L with increments of 0.18 mg/L. The initial GO concentration was 2% with a step of 0.2%, and the significance level was 0.05.
To improve the accuracy of relative efficacy coefficient estimation, independent variables for the concentrations of studied drugs were converted to intensive units of measurement. For example, the initial concentration of erythromycin was 1 mg/l and corresponded to 0.1 in intensive units. The initial concentration of colloidal silver was 0.9 mg/l, which corresponded to an intensive unit of 0.1. The initial GO concentration corresponded to a 5% intensive unit, which was 0.5.

4. Discussion

A black-box model was chosen due to its ability to establish reliable relationships between the investigated variables. Black-box models are statistical or machine learning models in which the model parameters convey no physical meaning. These models can be compelling due to model flexibility and ease of construction.
At the first stage, a dosimetry of the agents and the standard was conducted. The inhibitory activity (IA) was taken as a reflection. It was the main dependent extensive variable (outputs of a black box).
Agents with potential non-zero inhibitory activity on this dependent variable will be marked as “inhibitors”.
The independent variables (inputs of a black box) were the doses of the investigated agents, which were considered to be inhibitors. In order to unify the research, it was decided to shift from extensive measurement to intensive measurement. To achieve this task, the following algorithm for measuring the dependent variable IA was developed. It is based on the ratio of the optical density of a calibrator and the investigated agents.
The initial bacterial culture was diluted 20 times and added to plates containing culture medium. There were no inhibitors in the calibration wells, but inhibitors were present in the experimental wells. The plates were then incubated at 37 °C for 24 h. Equal volumes of properly mixed solutions from each well were removed and added to a standard solution of crystal violet. These solutions were mixed thoroughly to ensure complete staining of the bacterial elements.
These solutions were then centrifuged at 1500 rpm for 15 min. So, we obtained the following:
  • A supernatant-colored transparent dye solution and a densely colored precipitate at the bottom of the container.
  • The supernatant was removed and an equal volume of water was added to the remaining sediment. This mixture was then shaken until a colored solution formed. The process was repeated three times. As a result, a solution containing bacterial elements, colored with crystal violet, was obtained in both the case without the inhibitor and with the inhibitor at a known dosage.
  • The optical density was measured at the maximum absorption of the two solutions. The inhibitory activity (IA) was believed to be the ratio of the optical density of a calibrator sample to the optical density of an inhibitor sample.
  • Paired regression modeling was performed. The independent variable was the inhibitor dosage and the dependent variable was IA.
After that, the linearization range was determined. The initial concentration of the inhibitors and their multiples at which the linearity of the response was maintained were determined.
The dose multiplicity was determined for each inhibitor in accordance with the necessary and sufficient selection criteria. The dose multiplicity for inhibitors should be the same, as this is the basis for creating a 2 × 2 design when calculating the relative efficacy coefficient in the planning of factorial designs for biological testing and drug standardization.
Thus, this method of transition from extensive to intensive measurement of IA as a dependent variable, with respect to the dose of the inhibitor as an independent variable, made it possible to unify the algorithm for paired regression analysis and reduce the analysis to that of drug administration, within the framework of a 2 × 2 design, and the relative efficiency coefficient was calculated.
The parameters of linear regressions for the standard and test preparations were determined: For the standard preparation, the slope coefficient b was 1.4 with a standard error of 0.06, and the intercept a was 1.8 with a standard error of 0.019. For silver, the slope b was 0.72 with a standard error of 0.26 and the intercept was 1.08 with a standard error of 0.005. For GO, the slope was 0.68 with a standard error of 0.05 and the intercept was 0.8 with a standard error of 0.03. All curves were reliably linearized (p < 0.01). The effect of silver at a given dose, followed by the addition of GO at a bacteriostatic dose, yielded an unreliable response, different from that of the “silver–GO” system at the same simultaneous inhibition doses (p > 0.1). Consequently, the combined action of agents did not reveal any drug synergy.
The next step in analyzing the data was to calculate the relative effectiveness coefficient of the tested drugs compared to the standard one. For this purpose, contrast values were calculated (Table 1).
In accordance with the calculated values of orthogonal contrasts, the relative efficiency coefficients for the erythromycin/silver system were calculated. For silver, R was 0.29 with a confidence range of 0.28 to 0.30; for GO, R was 0.107 with a confidence range of 0.103 to 0.111.

5. Conclusions

The study of the relative antibacterial efficacy coefficients of silver nanoparticles in the form of a colloid with chitosan succinate (nAg SCC HTZ) and graphene oxide nanoparticles (GO) has shown that these preparations are significantly less effective in their antibacterial activity than the antibiotic erythromycin against Pseudomonas aeruginosa. Specifically, the activity of silver colloid exhibits only 0.29% of the bactericidal activity of erythromycin, while the graphene oxide exhibits 0.107% of erythromycin activity. However, a reliable response was observed for Lp and LD contrast according to the 2 × 2 design, indicating significant bactericidal activity for the tested silver colloid and graphene oxide preparations.
The combined action of agents did not reveal any drug synergy. Consequently, the effect of silver at a given dose, followed by the addition of GO at a bacteriostatic dose, yielded an unreliable response, different from that of the “silver–GO” system at the same simultaneous inhibition doses (p > 0.1). These findings can be used to develop new combined materials with bactericidal properties and to predict their properties based on the data obtained.

Author Contributions

Conceptualization, S.E.D. and A.N.T.; methodology, S.E.D. and O.A.K.; validation, A.N.T., S.A.B. and S.E.D.; formal analysis, S.A.B.; investigation, A.N.T.; resources, S.E.D.; data curation, A.V.S.; writing—original draft preparation, S.E.D.; writing—review and editing, A.V.S.; visualization, S.A.B.; supervision, O.A.K.; project administration, S.E.D. All authors have read and agreed to the published version of the manuscript.

Funding

This research received no external funding.

Data Availability Statement

Data is contained within the article.

Acknowledgments

S.A.B. thanks the Ministry of Science and Higher Education of Russian Federation (state registration number 124013000757–0).

Conflicts of Interest

The authors declare no conflicts of interest.

References

  1. Prihandana, G.S.; Sriani, T.; Muthi’ah, A.D.; Machmudah, A.; Mahardika, M.; Miki, N. Study Effect of nAg Particle Size on the Properties and Antibacterial Characteristics of Polysulfone Membranes. Nanomaterials 2022, 12, 388. [Google Scholar] [CrossRef] [PubMed]
  2. Saeed, S.I.; Vivian, L.; Zalati, C.W.S.C.W.; Sani, N.I.M.; Aklilu, E.; Mohamad, M.; Noor, A.A.M.; Muthoosamy, K.; Kamaruzzaman, N.F. Antimicrobial activities of graphene oxide against biofilm and intracellular Staphylococcus aureus isolated from bovine mastitis. BMC Vet. Res. 2023, 19, 10. [Google Scholar] [CrossRef] [PubMed]
  3. Rhazouani, A.; Gamrani, H.; El Achaby, M.; Aziz, K.; Gebrati, L.; Uddin, M.S.; Aziz, F. Synthesis and Toxicity of Graphene Oxide Nanoparticles: A Literature Review of In Vitro and In Vivo Studies. BioMed Res. Int. 2021, 2021, 5518999. [Google Scholar] [CrossRef] [PubMed]
  4. Aljaafari, A.; Ahmed, F.; Husain, F.M. Bio-inspired facile synthesis of graphene-based nanocomposites: Elucidation of anti-microbial and biofilm inhibitory potential against foodborne pathogenic bacteria. Coatings 2020, 10, 1171. [Google Scholar] [CrossRef]
  5. Chen, J.; Peng, H.; Wang, X.; Shao, F.; Yuan, Z.; Han, H. Graphene oxide exhibits broad-spectrum antimicrobial activity against bacterial phytopathogens and fungal conidia by intertwining and membrane perturbation. Nanoscale 2014, 6, 1879. [Google Scholar] [CrossRef]
  6. Ciancico, C.; Braidotti, M.C.; Gentilini, S.; Prizia, R.; Ghofraniha, N.; Angelani, L.; Palmieri, V.; Bugli, F.; De Spirito, M.; Sanguinetti, M. Nonlinear optics, optomechanics, and antibacterial coating by graphene oxide. In Proceedings of the Quantum Sensing and Nano Electronics and Photonics XIV, San Francisco, CA, USA, 2 February 2017; pp. 304–312. [Google Scholar]
  7. Costerton, J.W.; Stewart, P.S.; Greenberg, E.P. Bacterial Biofilms: A Common Cause of Persistent Infections. Science 1999, 284, 1318. [Google Scholar] [CrossRef]
  8. Palmieri, V.; Papi, M.; Conti, C.; Ciasca, G.; Maulucci, G.; De Spirito, M. The future development of bacteria fighting medical devices: The role of graphene oxide. Expert Rev. Med. Devices 2016, 13, 1013. [Google Scholar] [CrossRef]
  9. Zou, X.; Zhang, L.; Wang, Z.; Luo, Y. Mechanisms of the Antimicrobial Activities of Graphene Materials. J. Am. Chem. Soc. 2016, 138, 2064–2077. [Google Scholar] [CrossRef]
  10. Yadav, N.; Dubey, A.; Shukla, S.; Saini, C.P.; Gupta, G.; Priyadarshini, R.; Lochab, B. Graphene oxide-coated surface: Inhibition of bacterial biofilm formation due to specific surface–interface interactions. ACS Omega 2017, 2, 3070–3082. [Google Scholar] [CrossRef]
  11. Zhu, C.; Mahmood, Z.; Zhang, W.; Akram, M.W.; Ainur, D.; Ma, H. In situ investigation of acute exposure of graphene oxide on activated sludge: Biofilm characteristics, microbial activity and cytotoxicity. Ecotoxicol. Environ. Saf. 2020, 199, 110639. [Google Scholar] [CrossRef]
  12. Akhavan, O.; Ghaderi, E.; Esfandiar, A. Wrapping Bacteria by Graphene Nanosheets for Isolation from Environment, Reactivation by Sonication, and Inactivation by Near-Infrared Irradiation. J. Phys. Chem. B 2011, 115, 6279. [Google Scholar] [CrossRef] [PubMed]
  13. Akhavan, O.; Ghaderi, E. Toxicity of Graphene and Graphene Oxide Nanowalls Against Bacteria. ACS Nano 2010, 4, 5731. [Google Scholar] [CrossRef]
  14. Song, C.; Yang, C.-M.; Sun, X.-F.; Xia, P.-F.; Qin, J.; Guo, B.-B.; Wang, S.-G. Influences of graphene oxide on biofilm formation of gram-negative and gram-positive bacteria. Environ. Sci. Pollut. Res. 2018, 25, 2853–2860. [Google Scholar] [CrossRef] [PubMed]
  15. Zhang, M.; Zhao, Y.; Yan, L.; Peltier, R.; Hui, W.; Yao, X.; Cui, Y.; Chen, X.; Sun, H.; Wang, Z. Interfacial engineering of bi-metallic Ag/Pt nanoparticles on reduced graphene oxide matrix for enhanced antimicrobial activity. ACS Appl. Mater. Interfaces 2016, 8, 8834–8840. [Google Scholar] [CrossRef]
  16. Husain, F.M.; Khan, M.S.; Siddiqui, S.; Khan, A.; Arshad, M.; Alyousef, A.A.; Rahman, M.; Al-Shabib, N.A.; Ahmad, I. Nanoparticles as New Emerging Antibacterials: Potentials and Limitations. In Antibacterial Drug Discovery to Combat MDR; Ahmad, I., Ahmad, S., Rumbaugh, K., Eds.; Springer: Singapore, 2019; pp. 561–579. [Google Scholar] [CrossRef]
  17. Perreault, F.; de Faria, A.F.; Nejati, S.; Elimelech, M. Antimicrobial Properties of Graphene Oxide Nanosheets: Why Size Matters. ACS Nano 2015, 9, 7226. [Google Scholar] [CrossRef]
  18. Farid, M.U.; Guo, J.; An, A.K. Bacterial inactivation and in situ monitoring of biofilm development on graphene oxide membrane using optical coherence tomography. J. Membr. Sci. 2018, 564, 22. [Google Scholar] [CrossRef]
  19. Rafieerad, A.R.; Bushroa, A.R.; Amiri, A.; Gopinath, V.; Sookhakian, M.; Baradaran, S.; Rafieerad, M.; Saber-Samandari, S.; Vadivelu, J. Large-scale hybrid silver nanowall-reduced graphene oxide biofilm: A novel morphology by facile electro-chemical deposition. Surf. Coat. Int. 2018, 347, 297–303. [Google Scholar] [CrossRef]
  20. Jaworski, S.; Wierzbicki, M.; Sawosz, E.; Jung, A.; Gielerak, G.; Biernat, J.; Jaremek, H.; Łojkowski, W.; Woźniak, B.; Wojnarowicz, J.; et al. Graphene Oxide-Based Nanocomposites Decorated with Silver Nanoparticles as an Antibacterial Agent. Nanoscale Res. Lett. 2018, 13, 116. [Google Scholar] [CrossRef]
  21. Lozovskis, P.; Jankauskaitė, V.; Guobienė, A.; Kareivienė, V.; Vitkauskienė, A. Effect of Graphene Oxide and Silver Nanoparticles Hybrid Composite on P. aeruginosa Strains with Acquired Resistance Genes. Int. J. Nanomed. 2020, 15, 5147–5163. [Google Scholar] [CrossRef]
  22. Baskakov, S.A.; Baskakova, Y.V.; Dvoretskaya, E.V.; Krasnikova, S.S.; Lesnichaya, V.A.; Shulga, Y.M.; Gutsev, G.L. Mechanical and Water Absorption Properties of Waterborne Polyurethane/Graphene Oxide Composites. Materials 2022, 16, 178. [Google Scholar] [CrossRef]
  23. Mkhoyan, K.A.; Contryman, A.W.; Silcox, J.; Stewart, D.A.; Eda, G.; Mattevi, C.; Miller, S.; Chhowalla, M. Atomic and electronic structure of graphene-oxide. Nano Lett. 2009, 9, 1058–1063. [Google Scholar] [CrossRef] [PubMed]
  24. Briggs, D.; Seah, M.P. Practical Surface Analysis, Auger and X-ray Photoelectron Spectroscopy, 2nd ed.; Wiley: Chichester, UK, 1990; Volume 1. [Google Scholar]
  25. Voylov, D.N.; Agapov, A.L.; Shulga, Y.M.; Sokolov, A.P.; Arbuzov, A.A. Room temperature reduction of multilayer graphene oxide film on a copper substrate: Penetration and participation of copper phase in redox reactions. Carbon 2014, 69, 563. [Google Scholar] [CrossRef]
  26. Shulga, Y.M.; Tien, T.C.; Huang, C.C.; Lo, S.C.; Muradyan, V.E.; Polyakova, N.V.; Ling, Y.C.; Loutfy, R.O.; Moravsky, A.P. XPS study of fluorinated carbon multi-walled nanotubes. J. Electron. Spectros. Relat. Phenom. 2007, 160, 22–28. [Google Scholar] [CrossRef]
  27. Desai, N.; Rana, D.; Salave, S.; Gupta, R.; Patel, P.; Karunakaran, B.; Sharma, A.; Giri, J.; Benival, D.; Kommineni, N. Chitosan: A Potential Biopolymer in Drug Delivery and Biomedical Applications. Pharmaceutics 2023, 15, 1313. [Google Scholar] [CrossRef] [PubMed]
  28. Mardanova, A.M.; Kabanov, D.A.; Rudakova, N.L.; Sharipova, M.R. Biofilms: Basic Research Methods: Teaching Aid; Kazan Federal University: Kazan, Russia, 2016. [Google Scholar]
  29. Menshikova, E.A.; Kurbatova, E.M.; Vodopyanov, S.O.; Pisanov, R.V.; Titova, S.V. Evaluation of the ability of cholera vibrios to form a biofilm on the surface of the chitinous shell of a crayfish by real-time PCR. J. Hyg. Epidemiol. Microbiol. Immunol. 2021, 98, 434–439. [Google Scholar] [CrossRef]
  30. Toc, D.A.; Csapai, A.; Popa, F.; Popa, C.; Pascalau, V.; Tosa, N.; Botan, A.; Mihaila, R.M.; Costache, C.A.; Colosi, I.A.; et al. Easy and Affordable: A New Method for the Studying of Bacterial Biofilm Formation. Cells 2022, 11, 4119. [Google Scholar] [CrossRef]
  31. Tel’pukhov, V.I.; Shepelev, V.A.; Lisenkov, A.N. Use of mathematical methods of experimental planning to choose optimal conditions for preservation of the heart by weak aldehyde solutions. Bull. Exp. Biol. Med. 1982, 93, 679–682. [Google Scholar] [CrossRef]
Figure 1. Atomic force microscopy (AFM) results for graphene oxide particles: (a,b) AFM image and its height profiles along different segments. The samples were prepared from a GO suspension of 1 mg/mL with ultrasonic treatment. After 100-fold dilution, the suspension was applied onto a silicon wafer and dried at room temperature.
Jcs 09 00315 g001
Figure 2. XPS spectrum of C1s OG-1. The squares indicate experimental points. The curves represent the spectral composition. The samples were prepared from a GO suspension of 1 mg/mL with ultrasonic treatment. After 100-fold dilution, the suspension was applied onto a silicon wafer and dried at room temperature.
Jcs 09 00315 g002
Figure 3. IR spectrum of graphene oxide.
Jcs 09 00315 g003
Figure 4. Solution of nAgSCC HTZ: (a) the structural formula of chitosan and SCC HTZ; (b) photograph of nAgSCC HTZ solution.
Jcs 09 00315 g004
Figure 5. TEM images of nanosilver particles stabilized by SCC XTZ: (a,b) sample of nAg from SCC XTZ 1; (c,d) sample of nAg from SCC XTZ 2.
Jcs 09 00315 g005aJcs 09 00315 g005b
Figure 6. UV spectra of solutions of silver nanoparticles stabilized with chitosan succinate at concentrations of 1 and 2 wt.%.
Jcs 09 00315 g006
Table 1. Values 1 of orthogonal contrasts for the 2 × 2 plan when determining the value of the relative efficiency coefficient.
E r y t h r o m y c i n / S i l v e r Erythromycin/OG
L p −9.61−0.51
L D 15.0324.13
L p x D −9.87−0.77
1  L p is the contrast of differences between agents, L D is the slope contrast of the regression line, L p x D is the contrast of the deviation from parallelism.
Disclaimer/Publisher’s Note: The statements, opinions and data contained in all publications are solely those of the individual author(s) and contributor(s) and not of MDPI and/or the editor(s). MDPI and/or the editor(s) disclaim responsibility for any injury to people or property resulting from any ideas, methods, instructions or products referred to in the content.