Modeling and Experimental Evaluation of 1-3 Stacked Piezoelectric Transducers for Energy Harvesting


Abstract
1. Introduction
2. Numerical Analysis, Material Parameters, and Experimental Testing
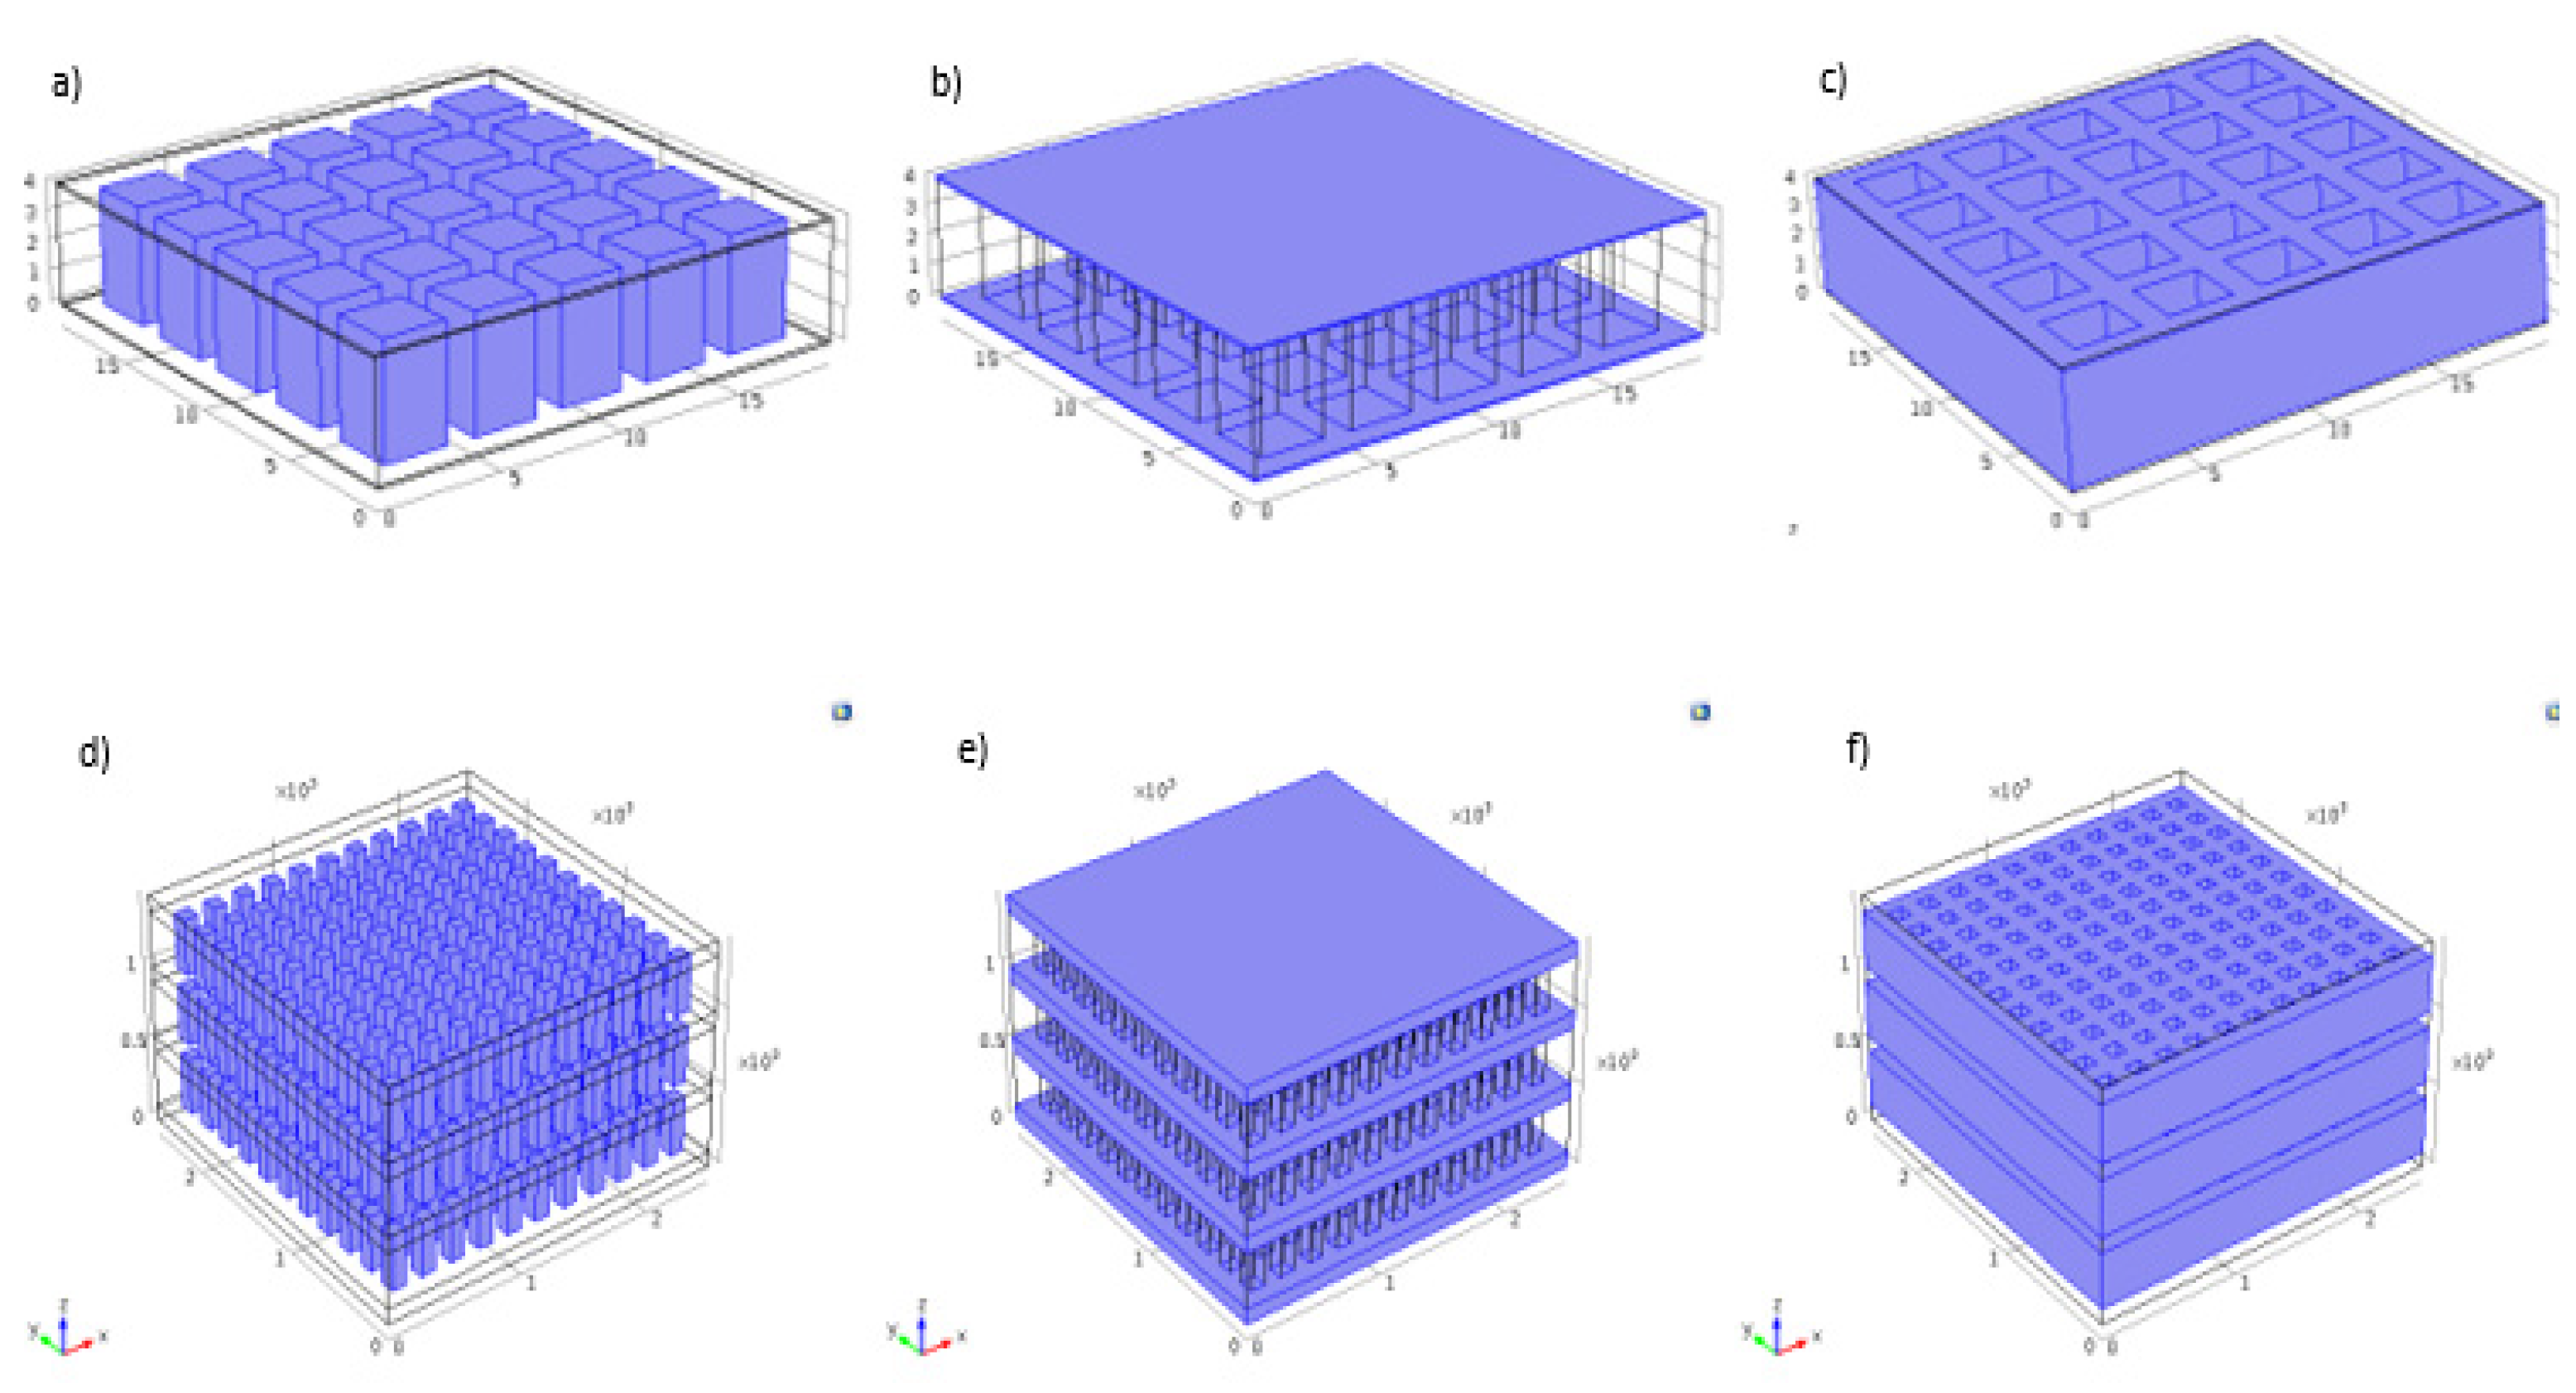
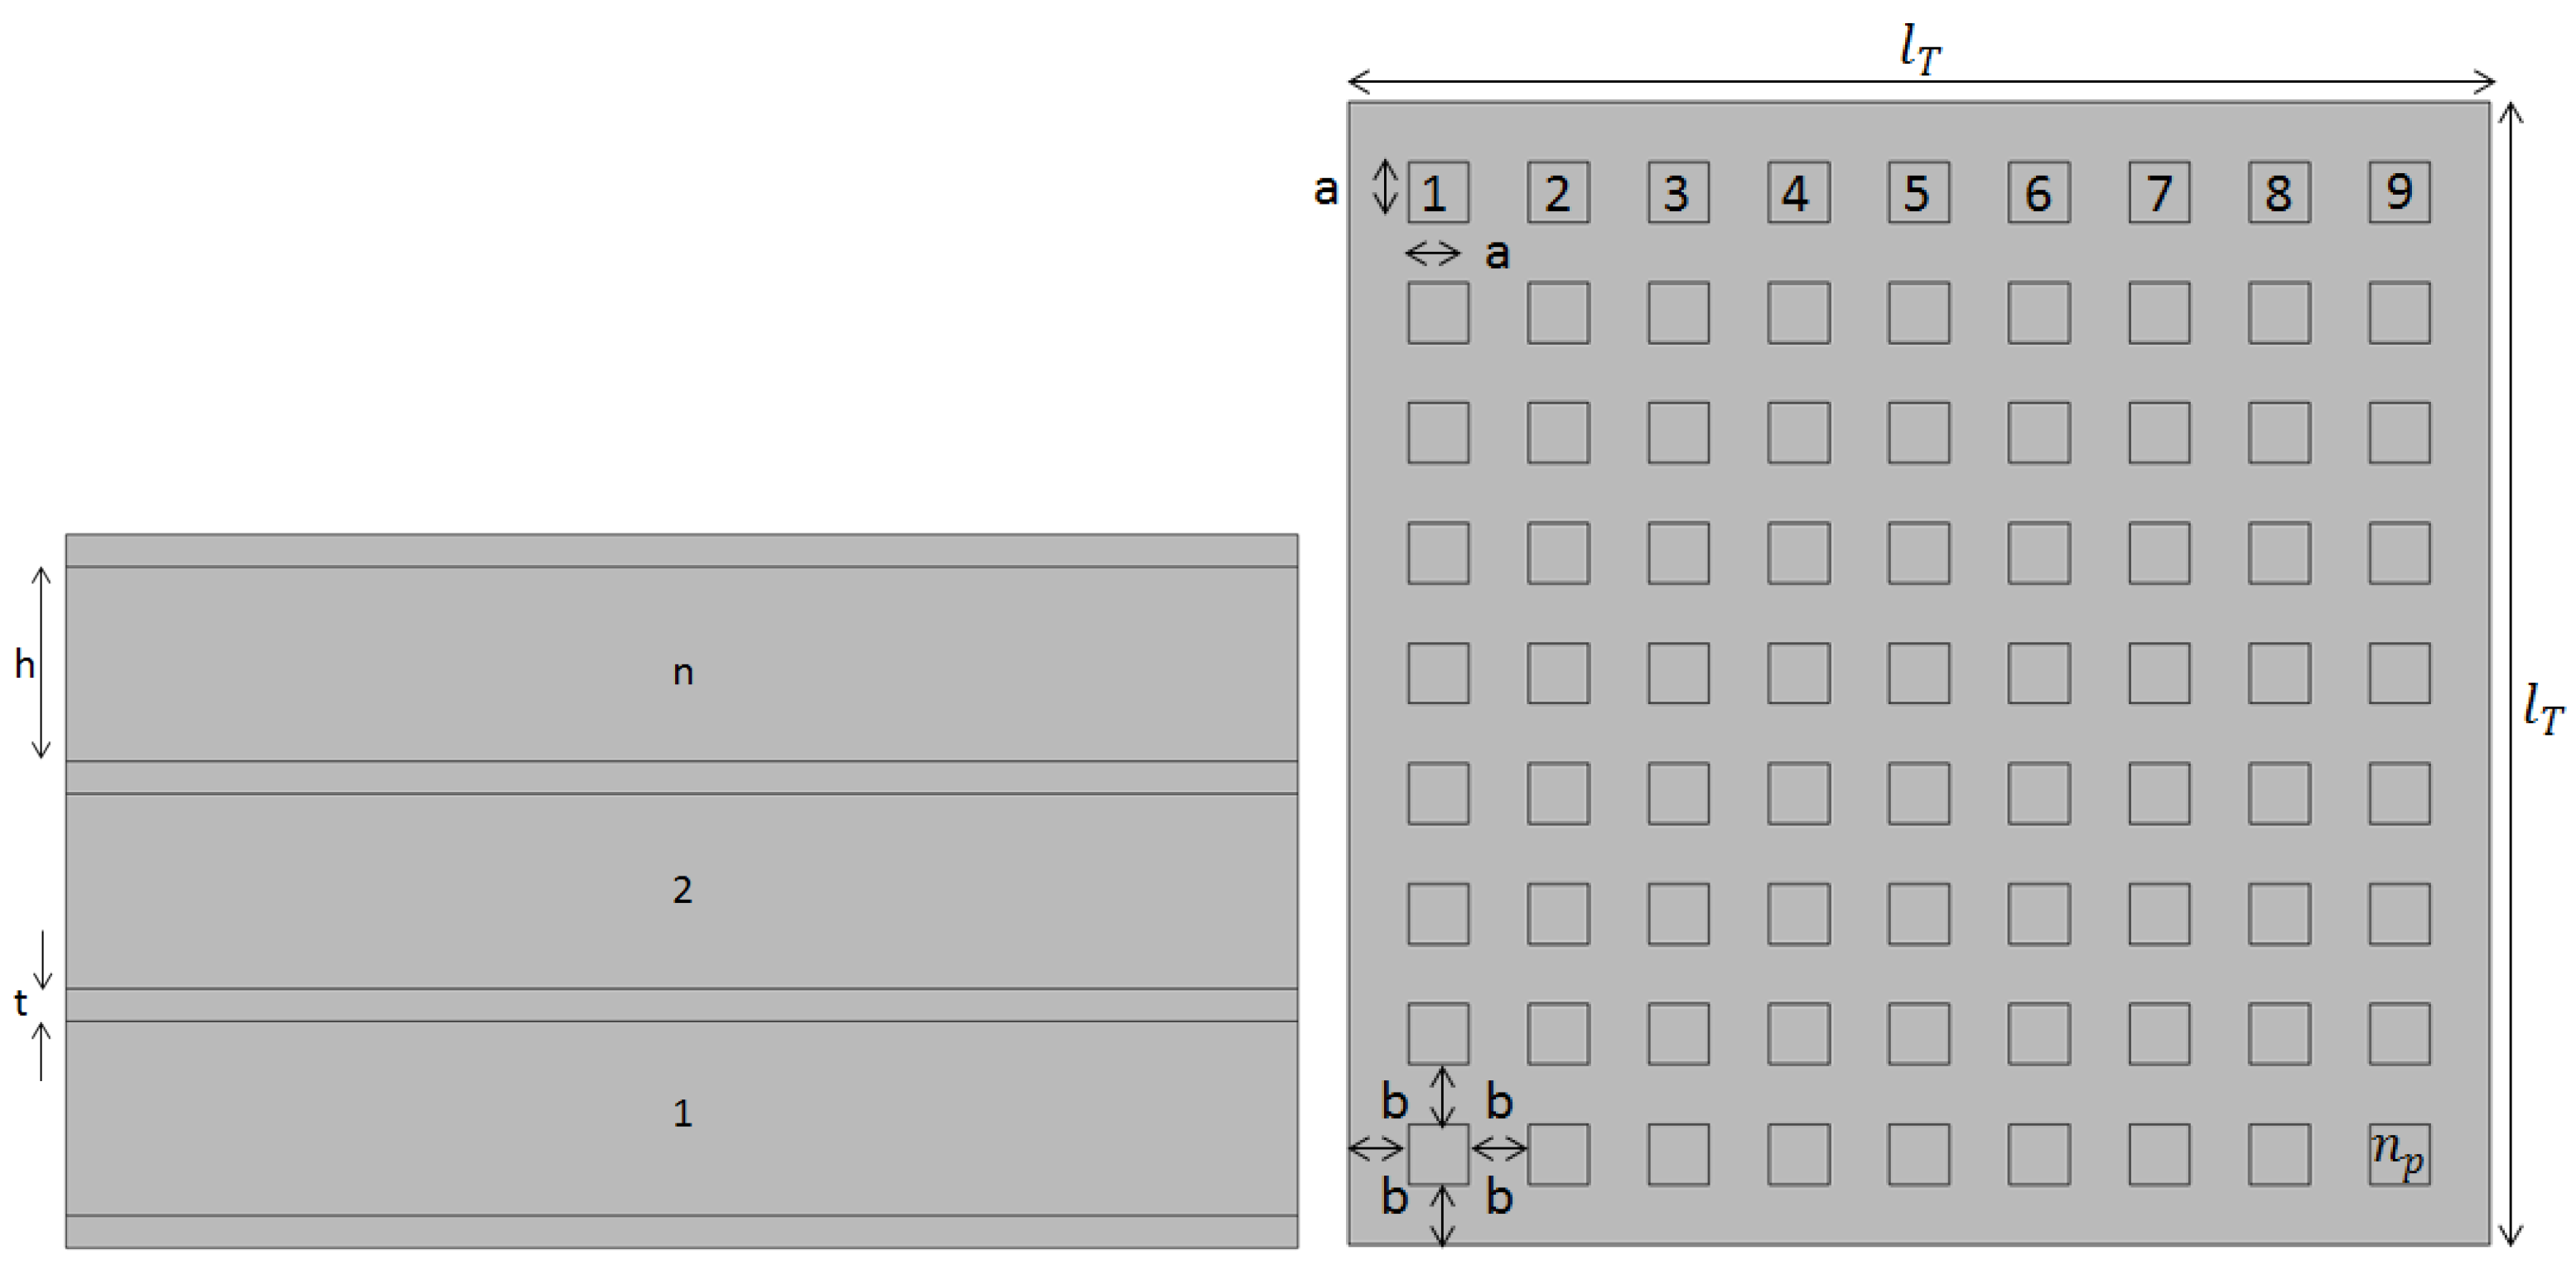
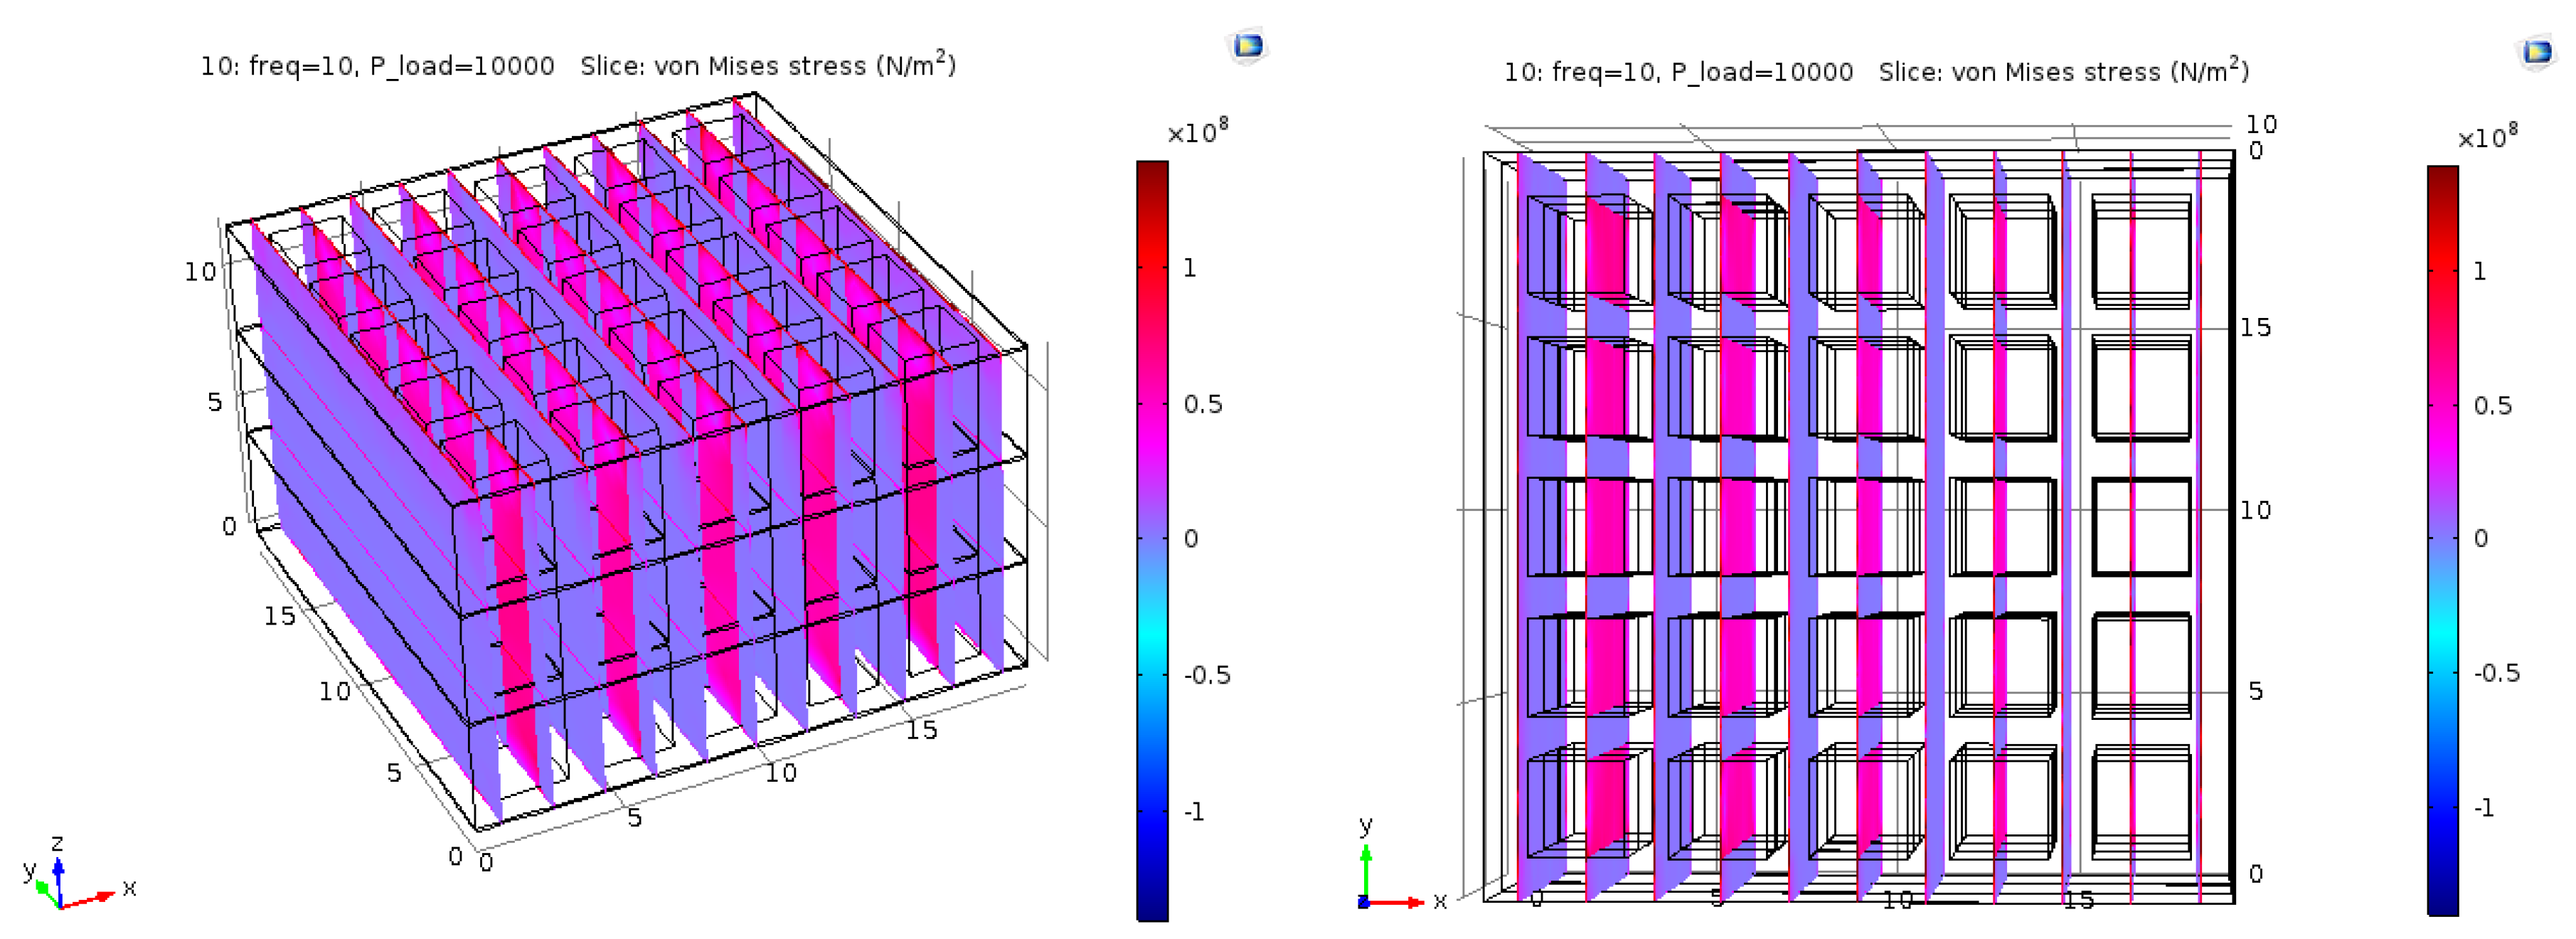
2.1. Finite Element Analysis
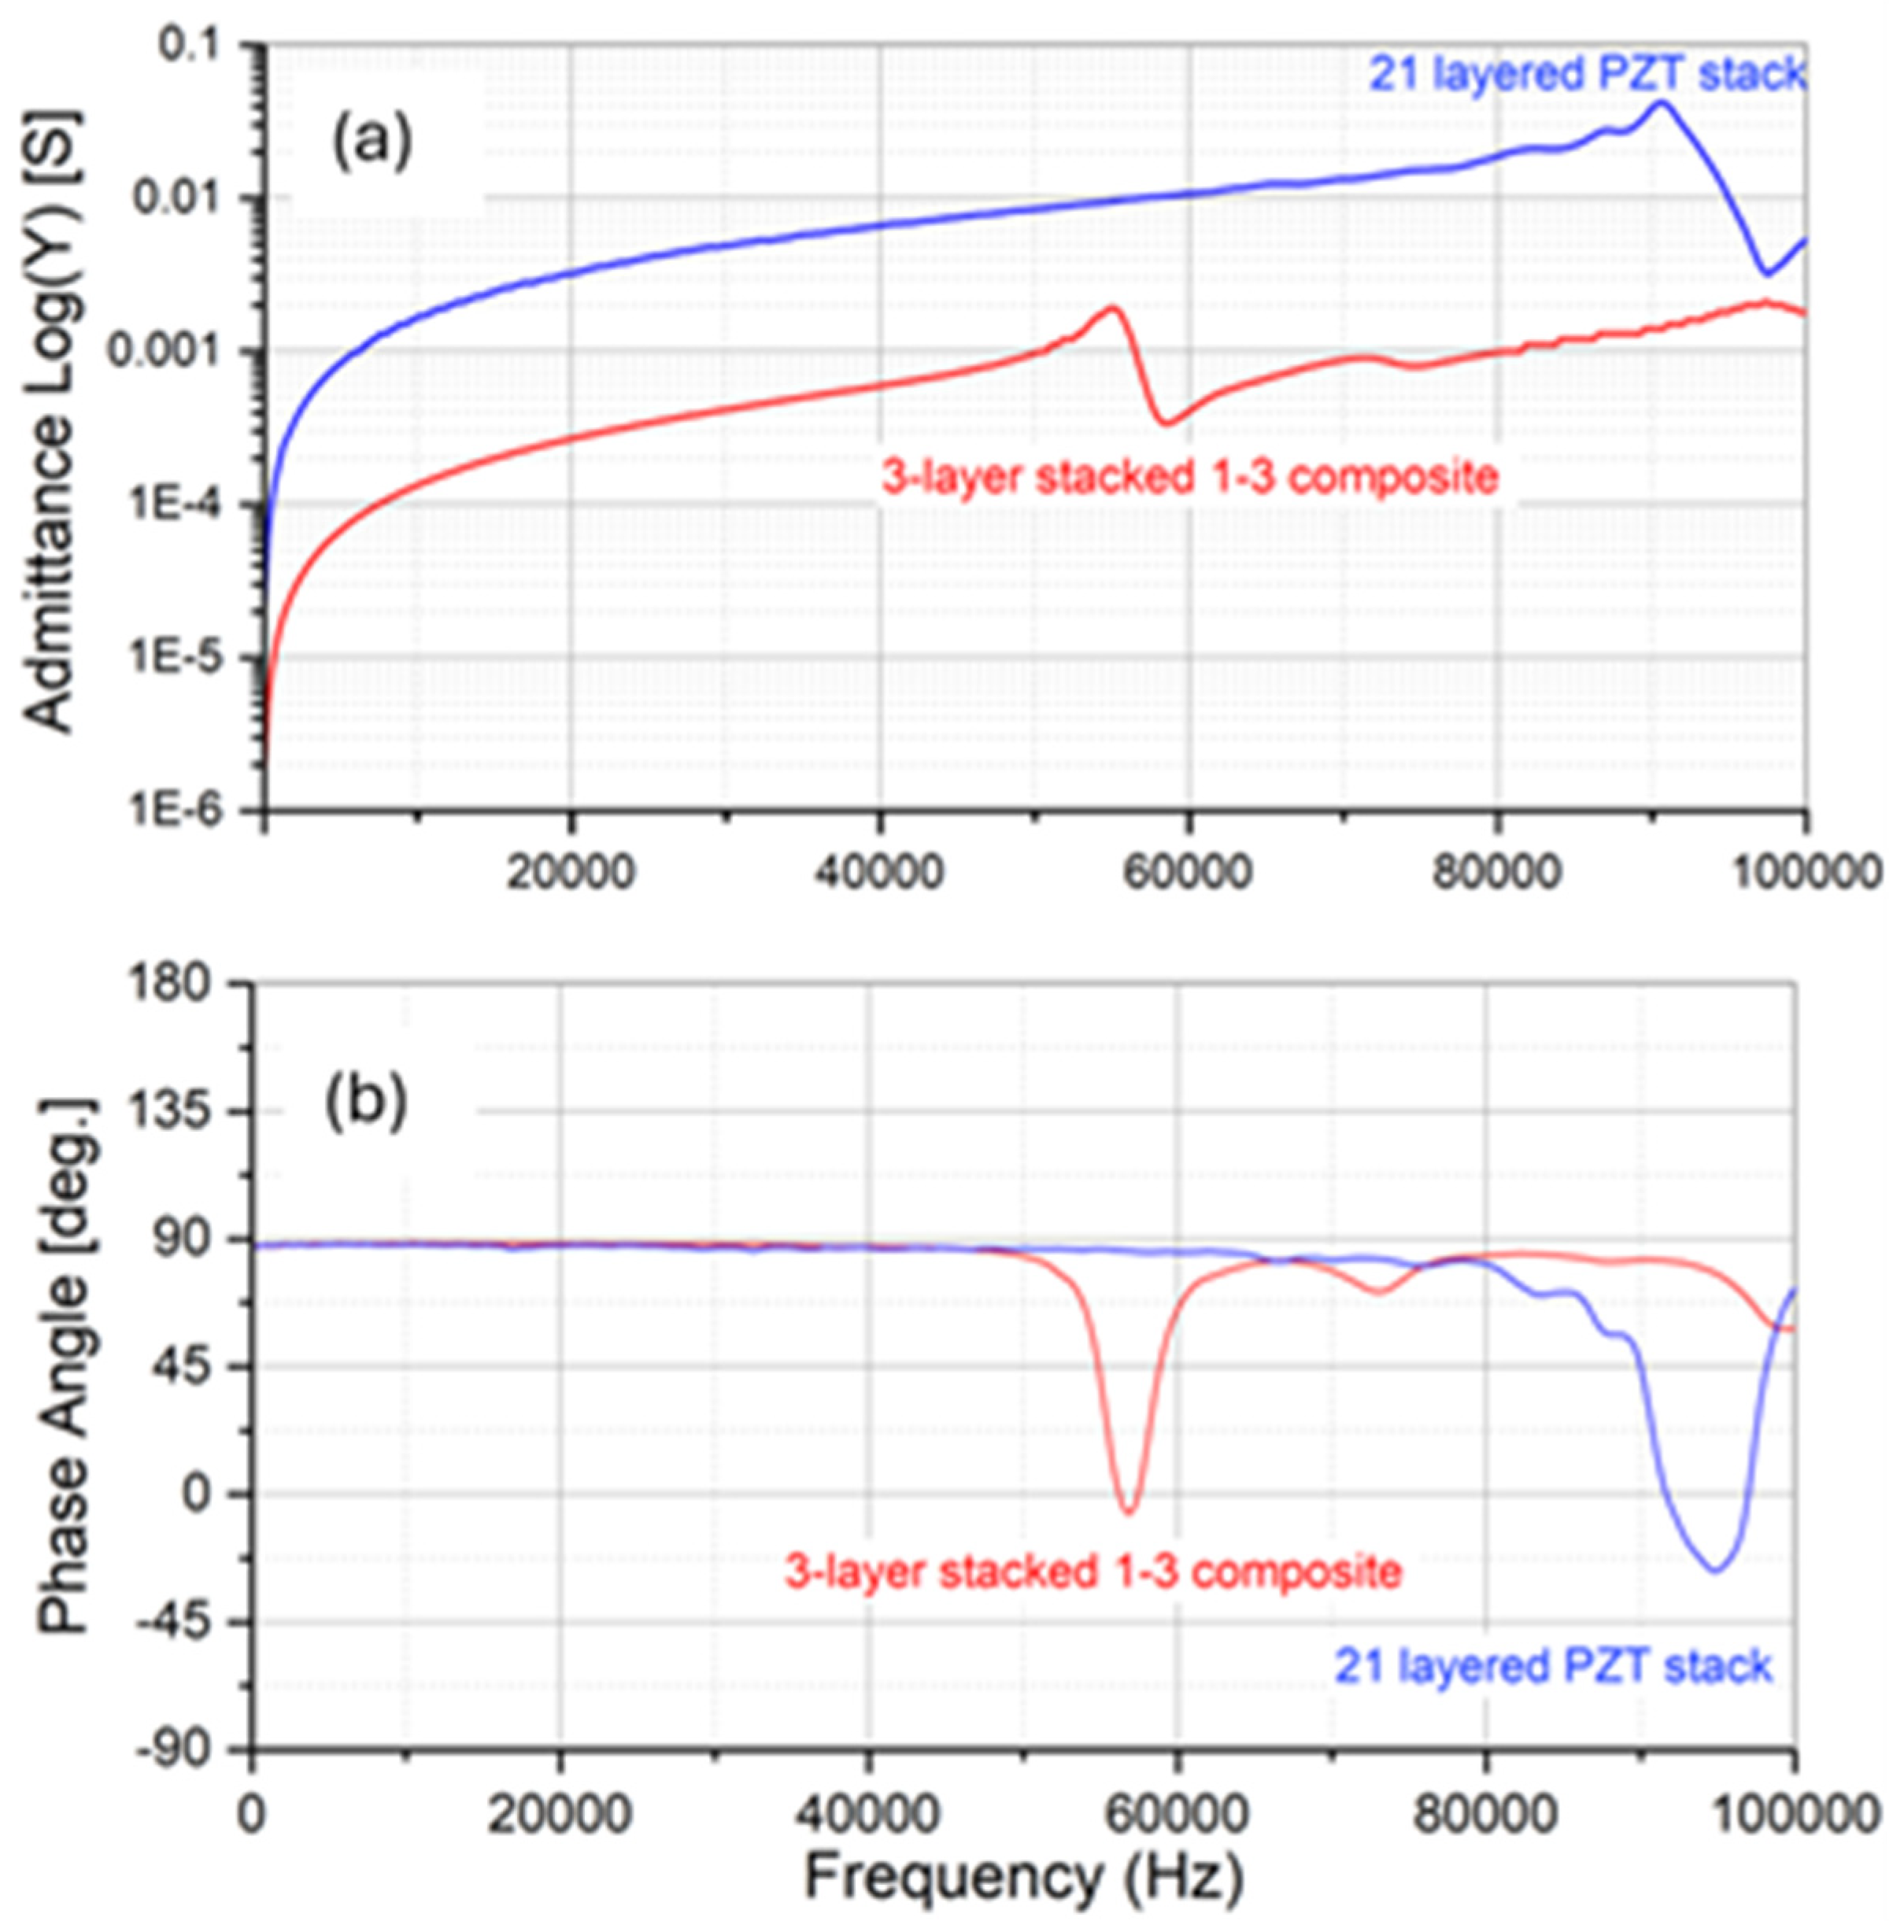
2.2. Experimental Evaluation and Validation
3. Results and Discussion
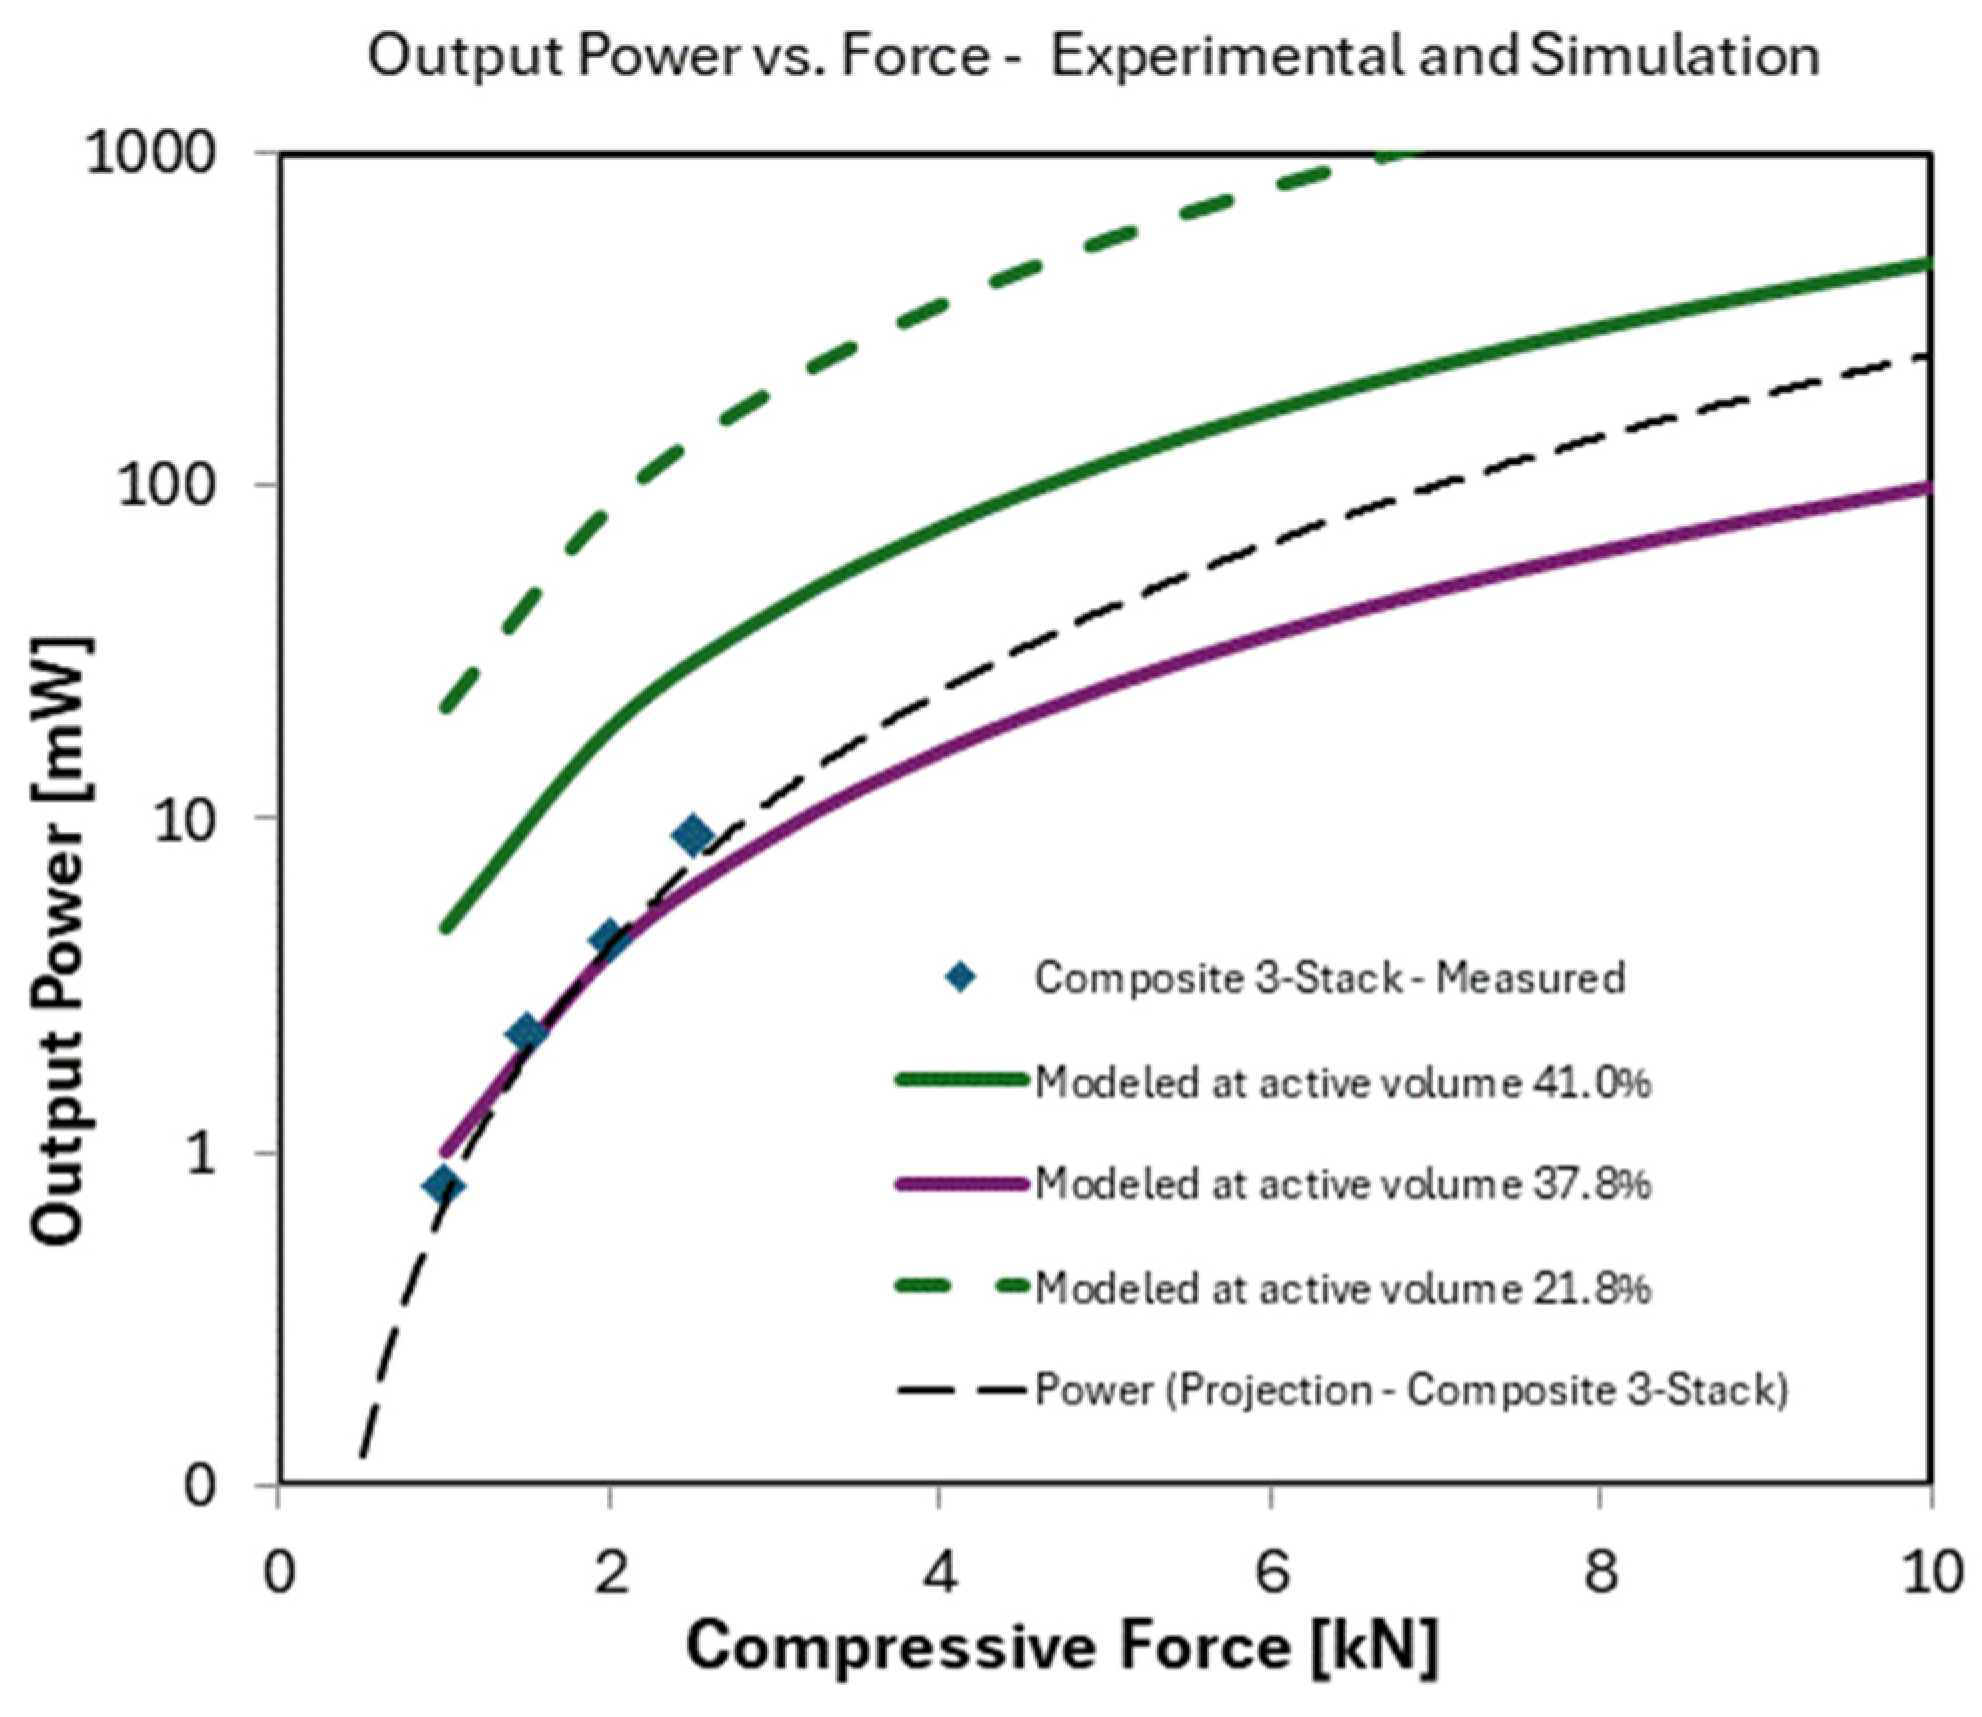
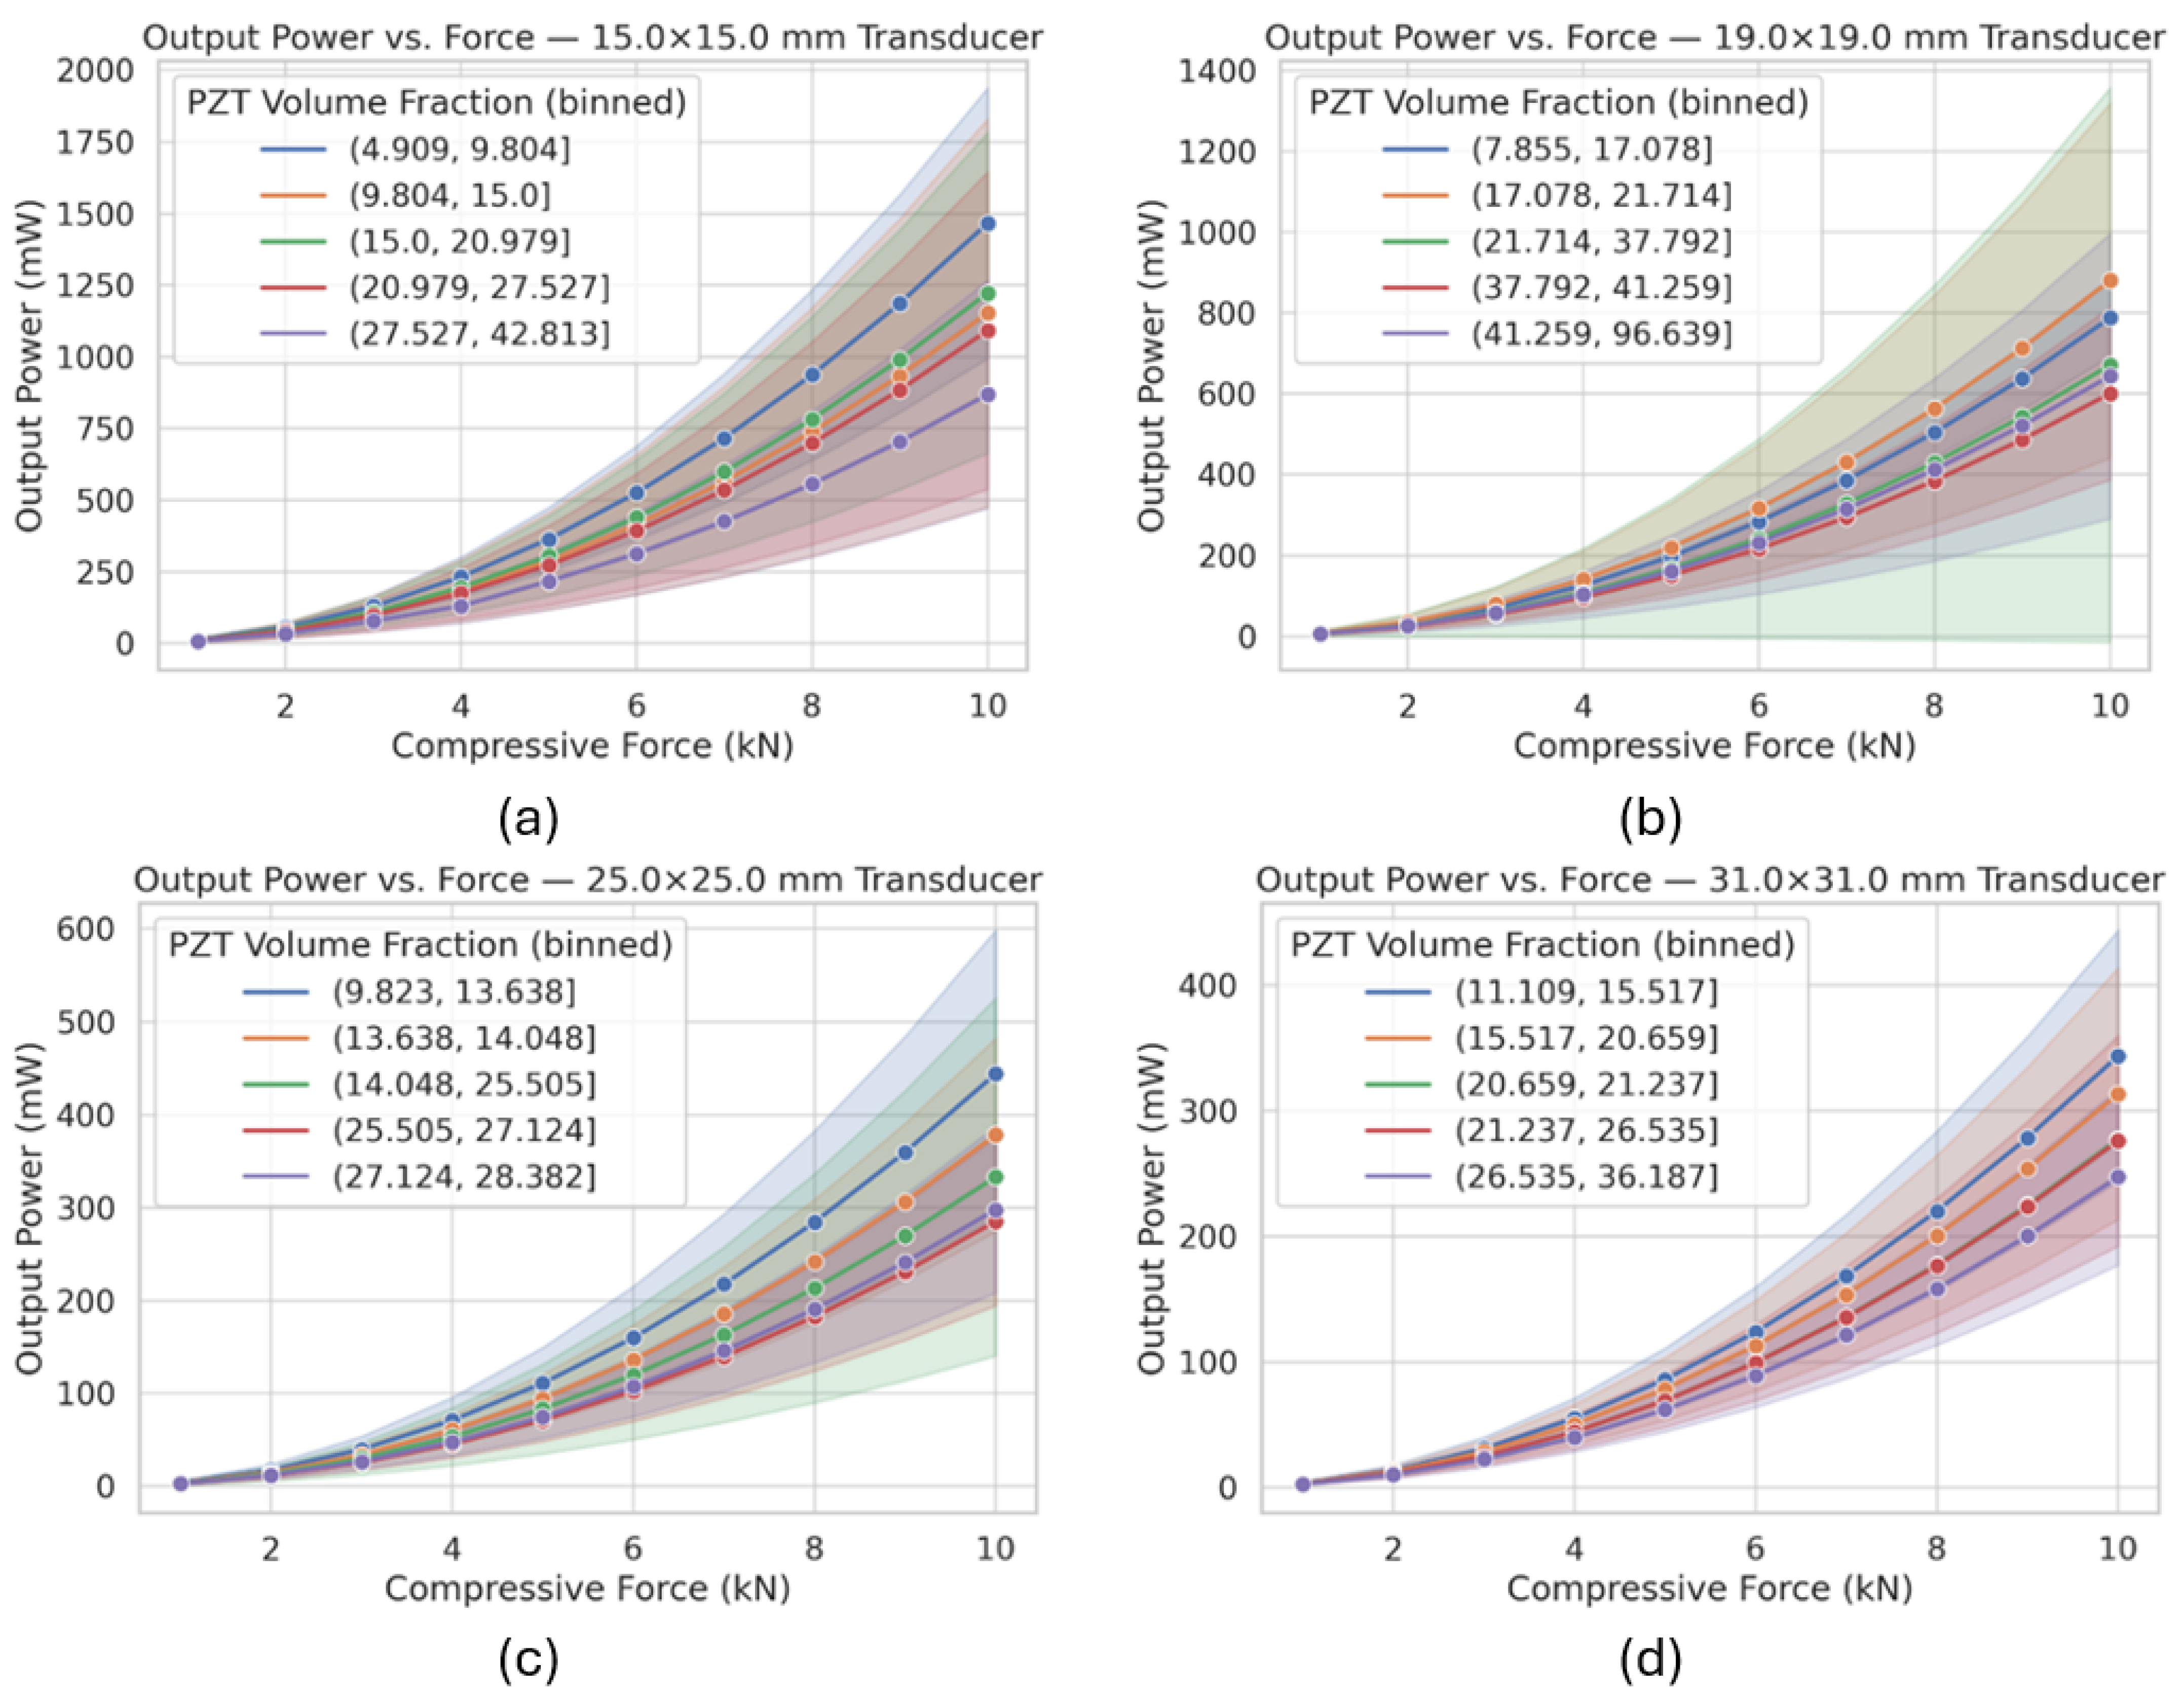
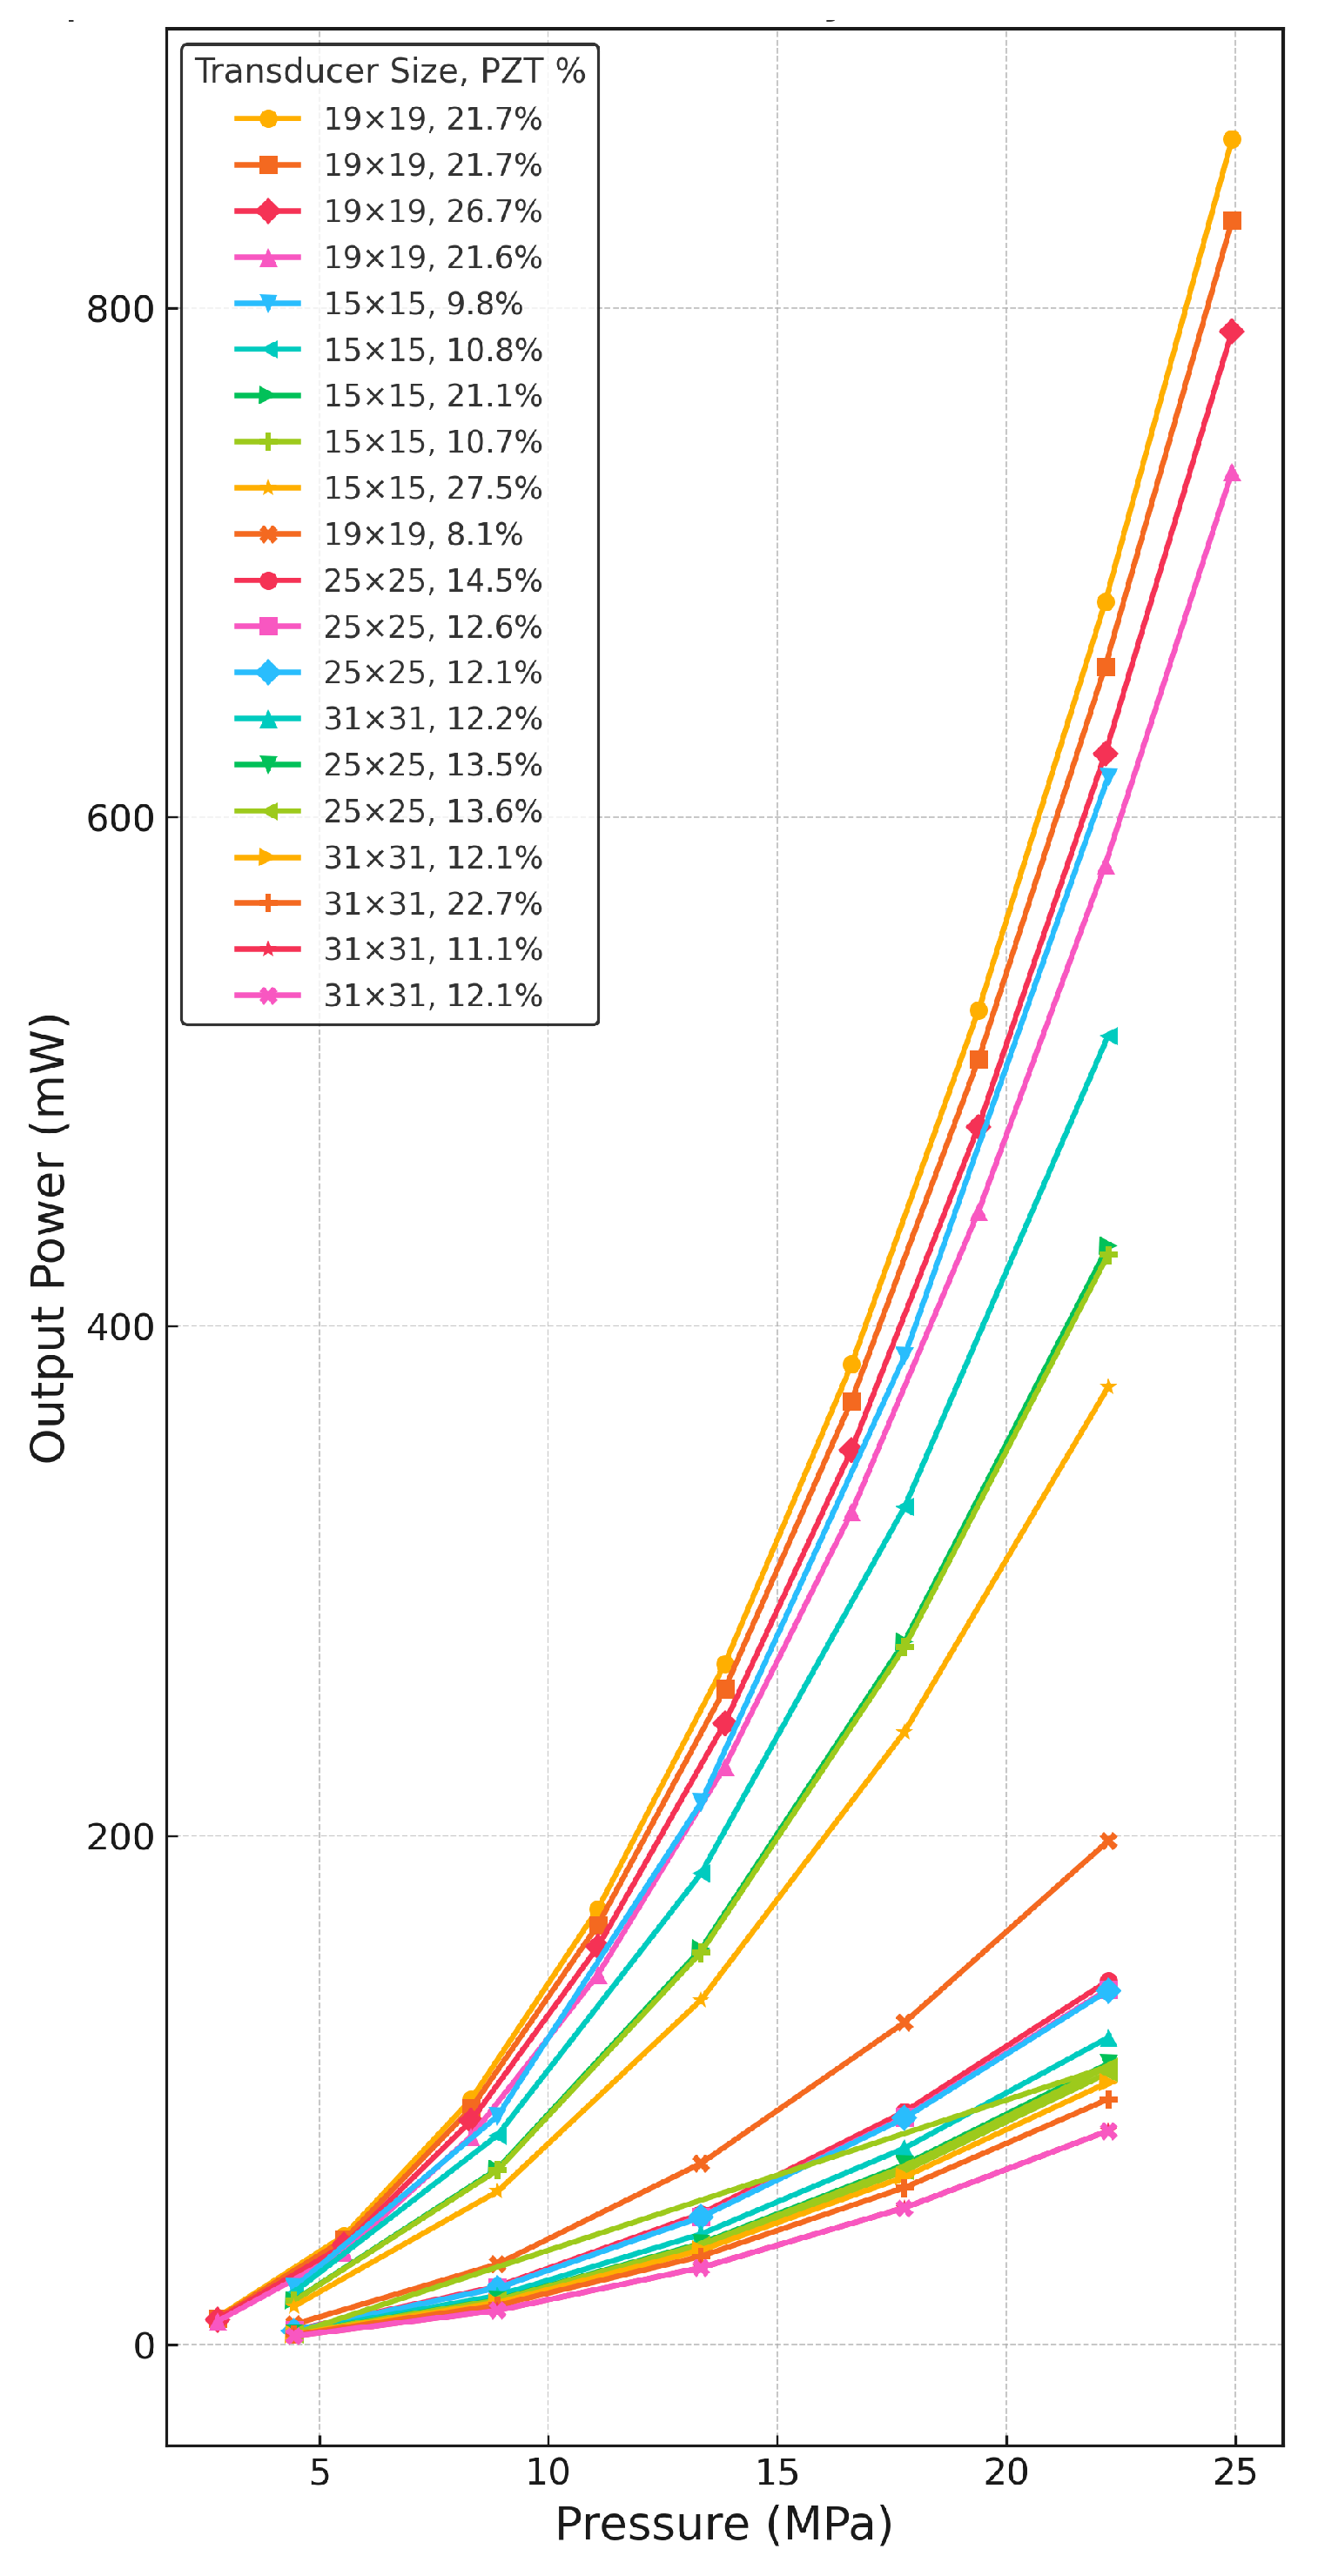
3.1. Effect of PZT Volume Fraction on Output Power Vs. Force for Various Designs
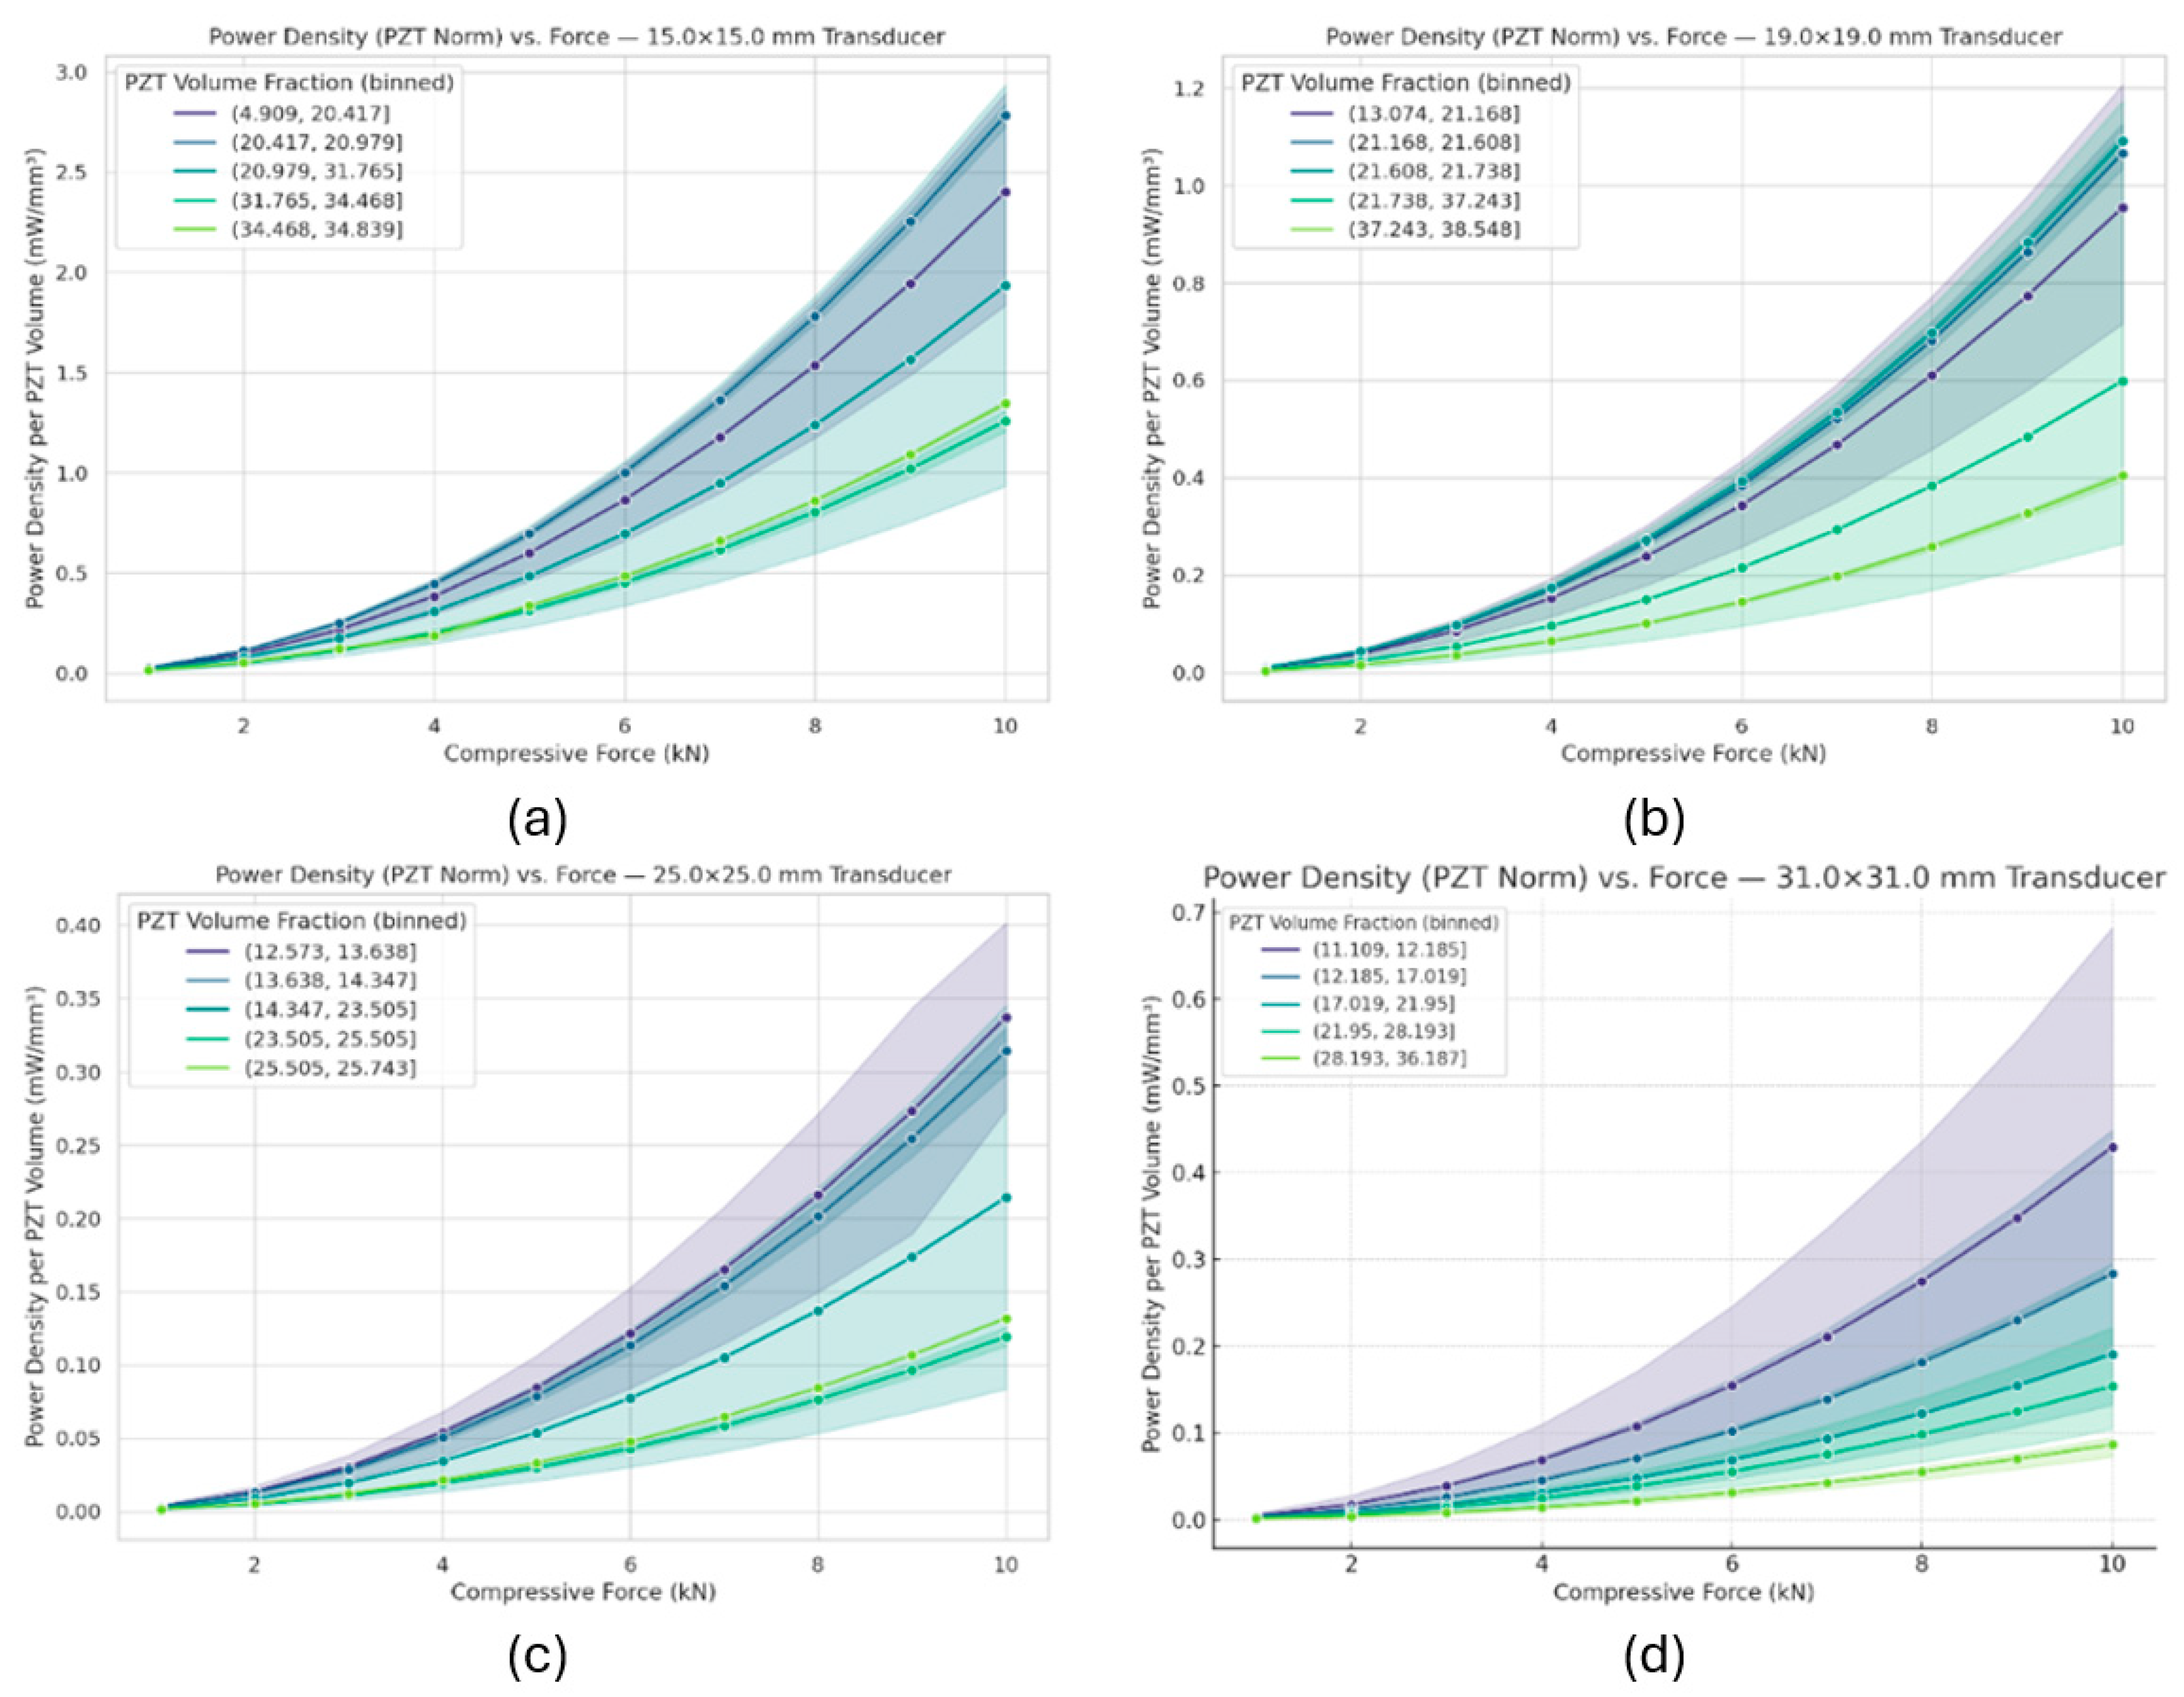
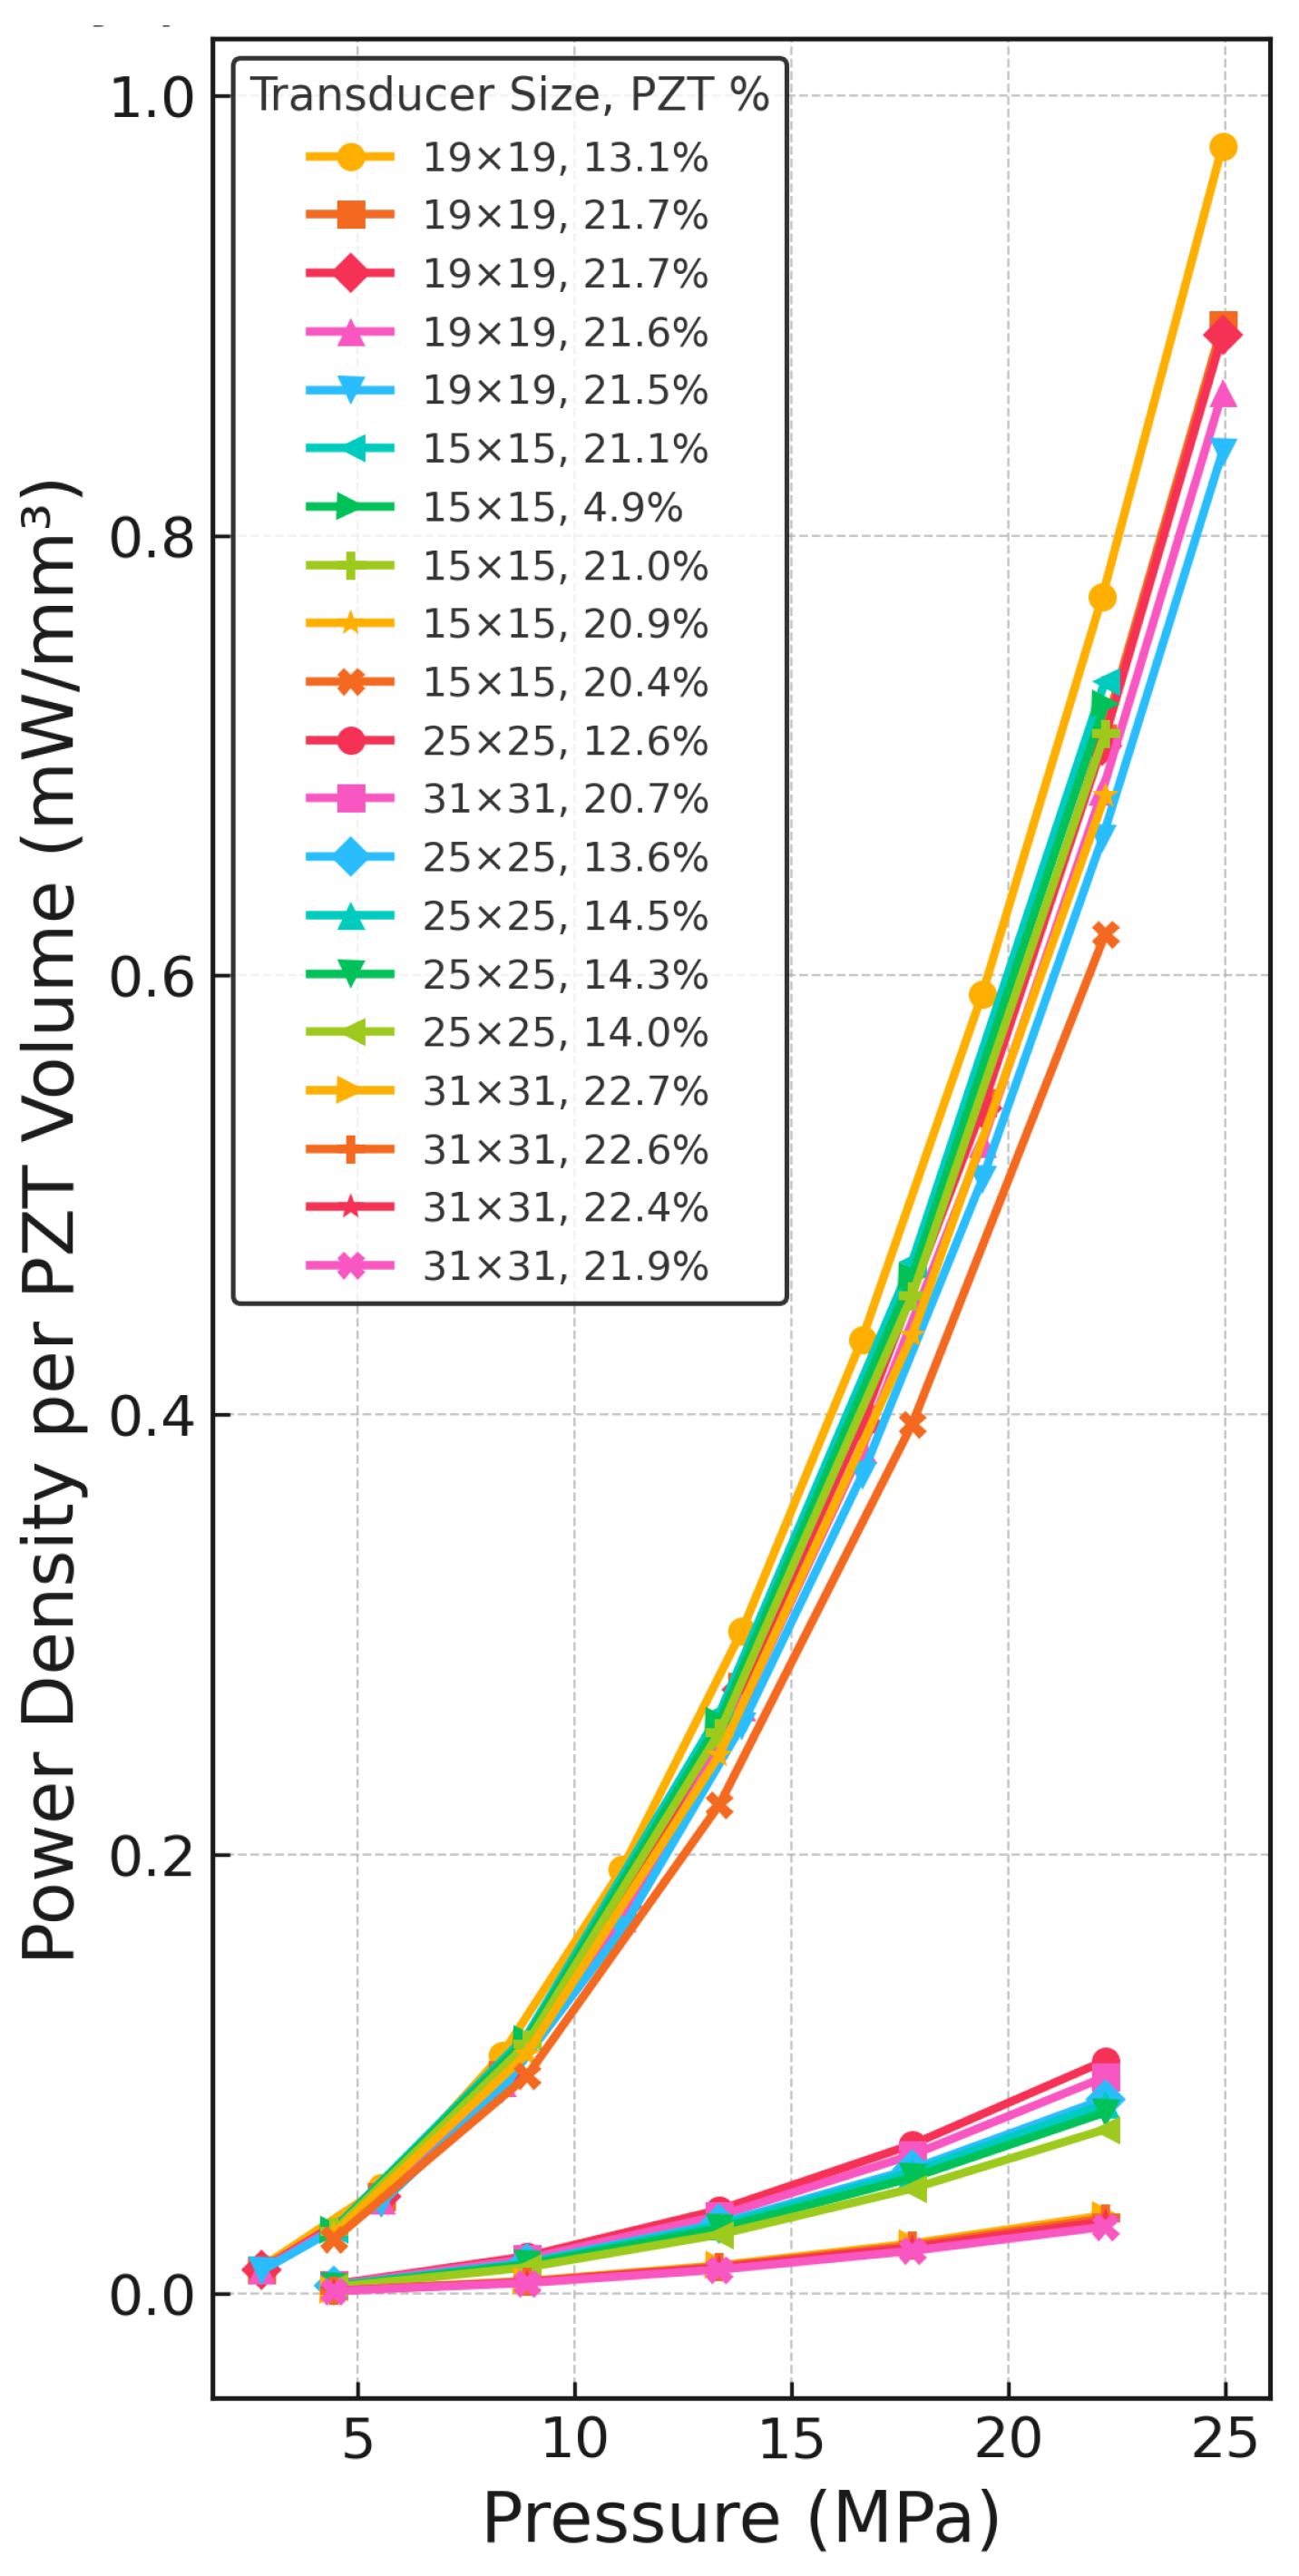
3.2. Effect of PZT Volume Fraction on Active Power Density vs. Force for Various Designs
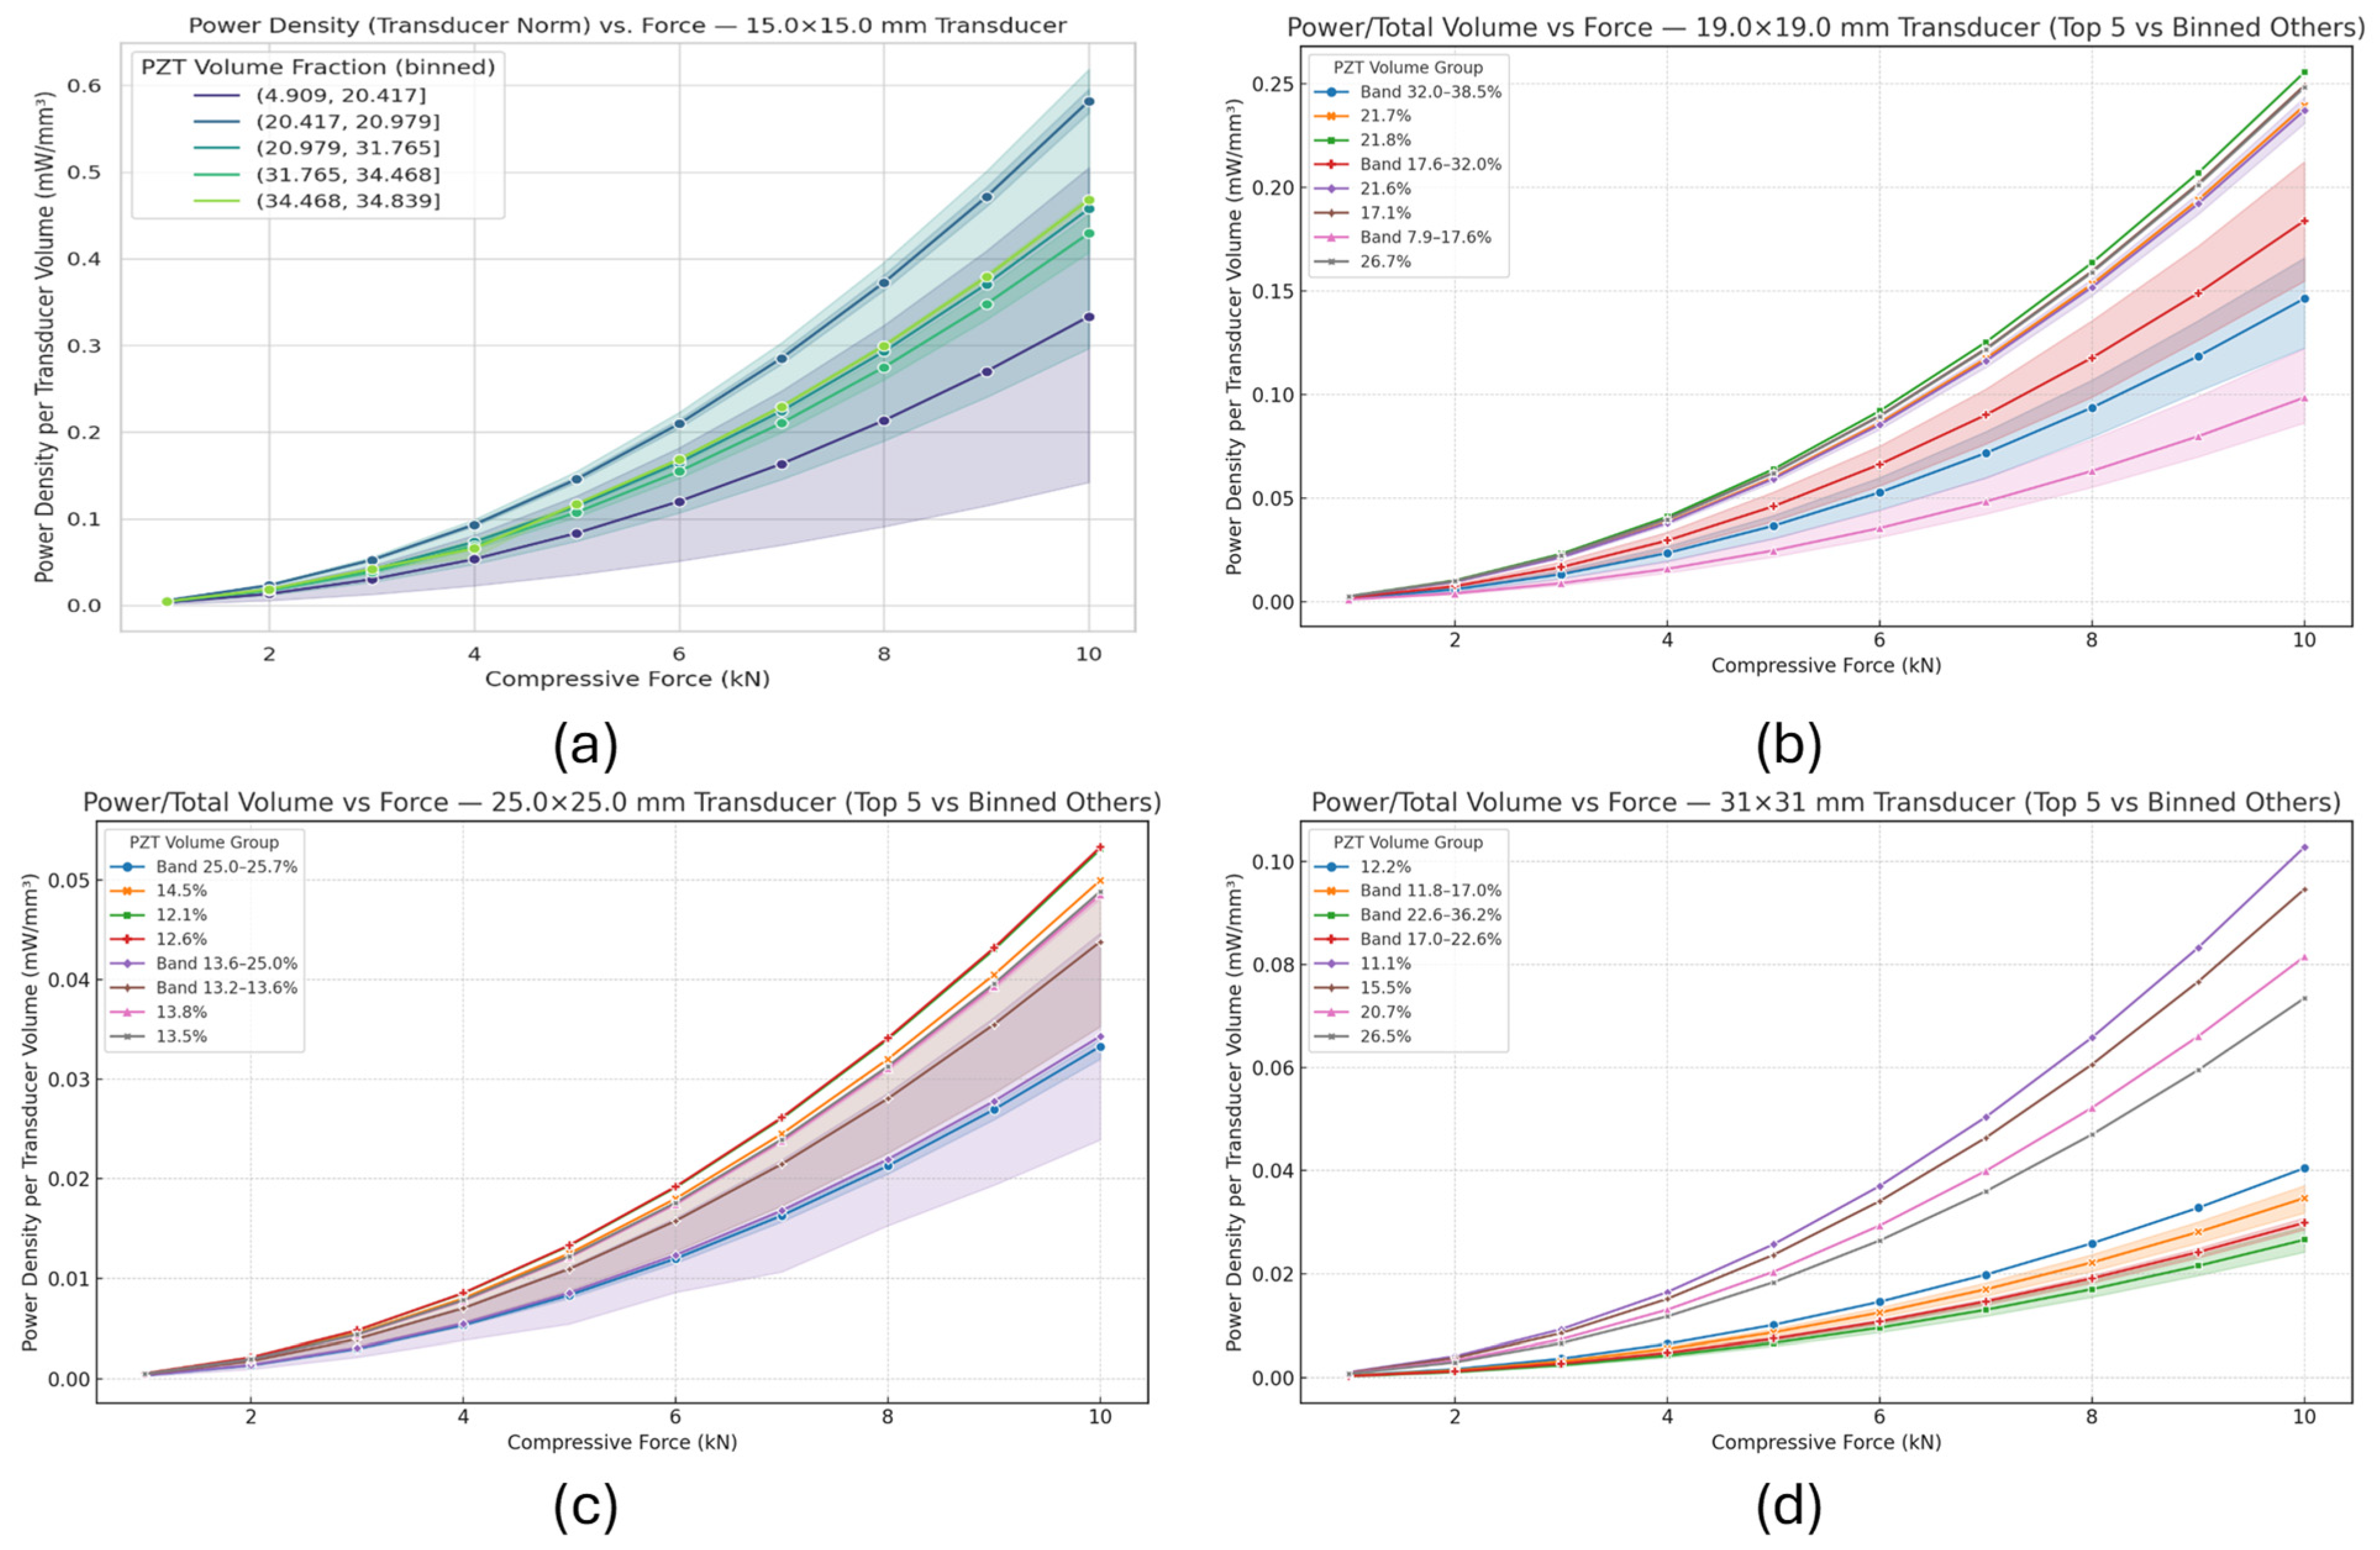
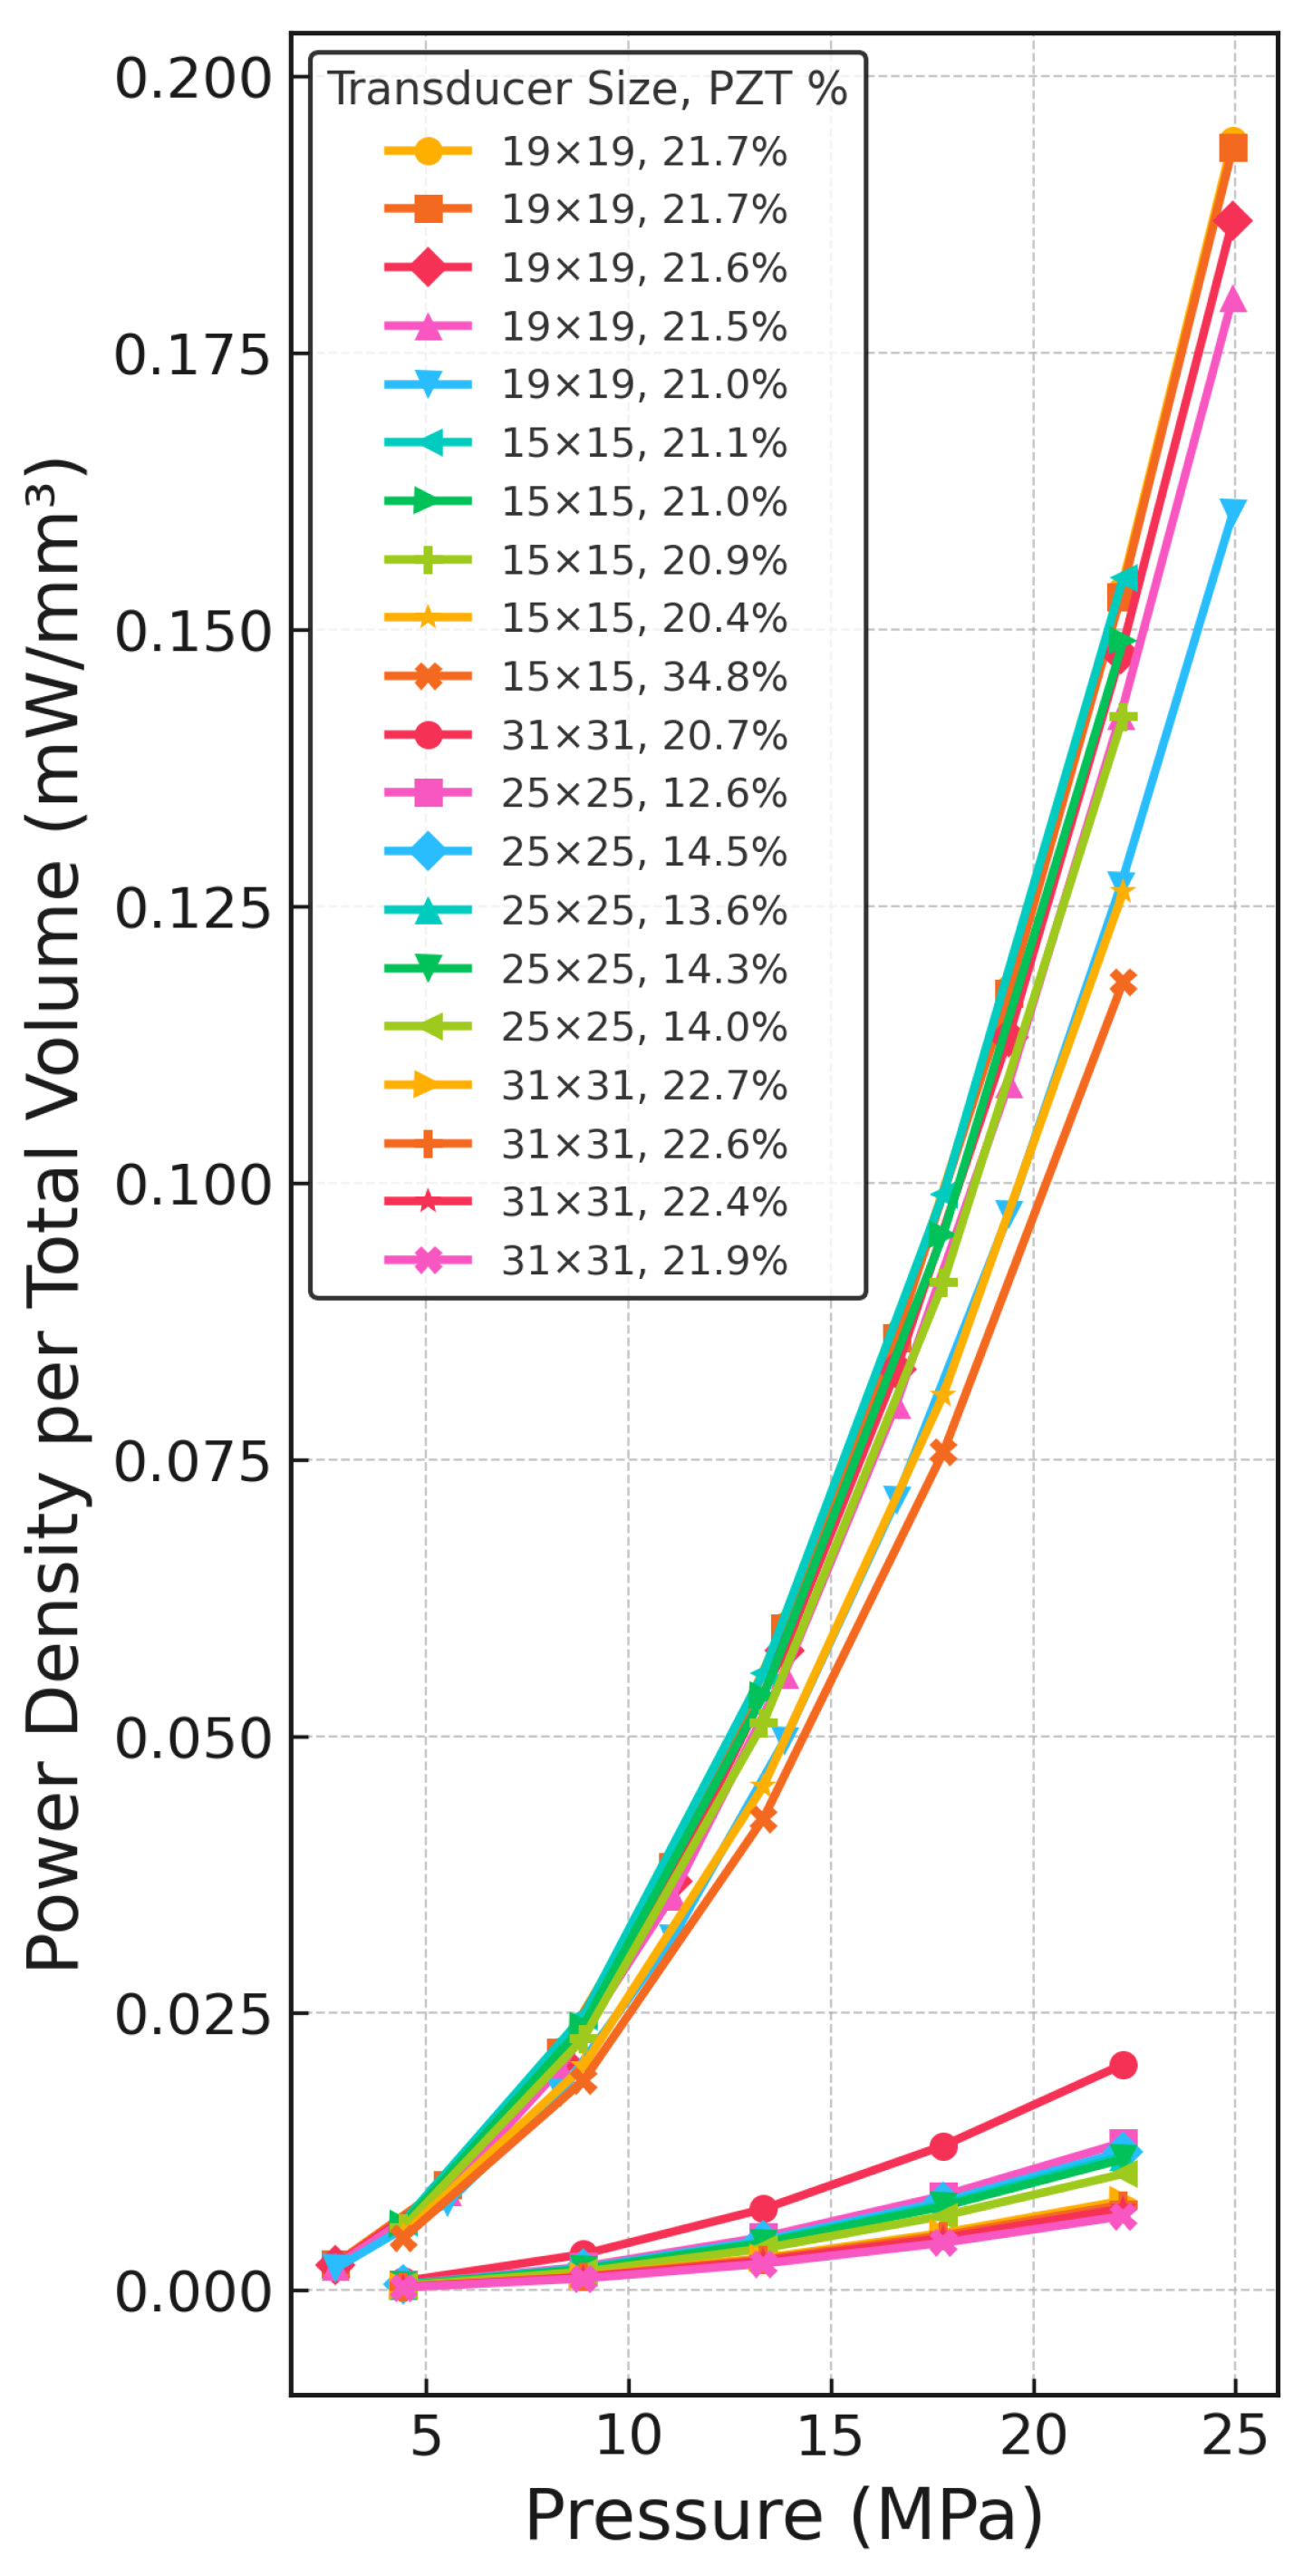
3.3. Normalized Performance—Power Density per Transducer vs. Force
3.4. Overall Comparison—Top Power Density Designs
3.5. Effect of Aspect Ratio
4. Conclusions
Author Contributions
Funding
Data Availability Statement
Acknowledgments
Conflicts of Interest
References
- Hill, D.; Agarwal, A.; Tong, N. Assessment of Piezoelectric Materials for Roadway Energy Harvesting: Cost of Energy and Demonstration Roadmap: Final Project Report; California Energy Commission: Sacramento, CA, USA, 2014. [Google Scholar]
- Kim, S.; Shen, J.; Ahad, M.A. Piezoelectric-Based Energy Harvesting Technology for Roadway Sustainability. Int. J. Appl. Sci. Technol. 2015, 5, 20–25. [Google Scholar]
- Xiong, H. Piezoelectric Energy Harvesting for Public Roadways; Civil Engineering, Virginia Polytechnic Institute and State University: Blacksburg, VA, USA, 2014. [Google Scholar]
- Ding, B.; Li, Y. Hysteresis Compensation and Sliding Mode Control with Perturbation Estimation for Piezoelectric Actuators. Micromachines 2018, 9, 241. [Google Scholar] [CrossRef] [PubMed]
- Newham, R.E.; Bowen, L.J.; Klicker, K.A.; Cross, L.E. Composite Piezoelectric Transducers. Mater. Eng. 1980, 2, 93–106. [Google Scholar]
- Smith, W.A.; Auld, B.A. Modeling 1-3 composite piezoelectrics: Thickness-mode oscillations. IEEE Trans. Ultrason. Ferroelectr. Freq. Control 1991, 38, 40–47. [Google Scholar] [CrossRef] [PubMed]
- Tamez, J.P.; Bhalla, A.; Guo, R. Design and simulation of 100 kHz and 200 kHz tri-phasic PZT piezoelectric transducers. Integr. Ferroelectr. 2015, 166, 99–107. [Google Scholar] [CrossRef]
- Dong, K.; Jiang, L.; Ding, B. Performances Investigation of Multi-Configuration Connections in Piezoelectric Energy Harvester. J. Vib. Eng. Technol. 2025, 13, 16. [Google Scholar] [CrossRef]
- Song, S.; Han, Y.; Li, Y.; Wang, Q. 3D printed piezoelectric porous structure with enhanced output performance and stress-electricity response for road energy harvesting. Addit. Manuf. 2023, 72, 103625. [Google Scholar] [CrossRef]
- Gamboa, B.M.; Guo, R.; Bhalla, A. Piezoelectric stacked transducer evaluation and comparison for optimized energy harvesting. Ferroelectrics 2018, 1, 535. [Google Scholar] [CrossRef]
- Gamboa, B. Piezoelectric Stack Transducer Evaluation and Comparison for Optimized Energy Harvesting. Master’s Thesis, The University of Texas, San Antonio, TX, USA, 2016. [Google Scholar]
- Pole, M.; Gamboa, B.; Bhalla, A.; Guo, R. Degradation of piezoelectric device as an energy harvester under equivalent traffic stress condition. Ferroelectrics 2019, 540, 112–123. [Google Scholar] [CrossRef]
- TxDOT. Texas Department of Transportation: Crash Records Information System (CRIS). Available online: https://www.txdot.gov/data-maps/crash-reports-records/crash-data-analysis-statistics.html (accessed on 31 May 2019).
- Gamboa, B.M.; (The University of Texas at San Antonio, San Antonio, Texs, USA). Doctoral dissertation. 2025; to be published.
- Calderon-Moreno, J. Stress induced domain switching of PZT in compression tests. Mater. Sci. Eng. A 2001, 315, 227–230. [Google Scholar] [CrossRef]

| UTSA-0 | Sample-A | Sample-B |
|---|---|---|
| stack of PZT layers (device of 21 layers shown) | commercial stack PZT | 3-stack of 1-3 composites |
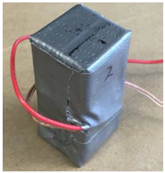 | 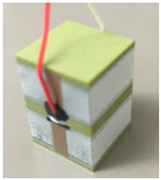 | 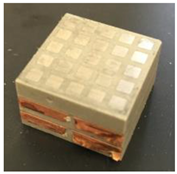 |
| 31 × 31 mm2 | 25 × 25 mm2 | 19 × 19 mm2 | 15 × 15 mm2 | ||||
|---|---|---|---|---|---|---|---|
| Aspect Ratio | Power [mW] | Aspect Ratio | Power [mW] | Aspect Ratio | Power [mW] | Aspect Ratio | Power [mW] |
| 3.09 | 280.62 | 3.85 | 439.93 | 5.00 | 791.07 | 6.38 | 1291.97 |
| 2.88 | 278.85 | 3.57 | 442.07 | 4.69 | 788.25 | 5.88 | 1300.94 |
| 2.68 | 277.96 | 3.33 | 436.76 | 4.35 | 784.60 | 5.56 | 1283.17 |
| 2.48 | 276.00 | 3.09 | 441.45 | 4.05 | 784.97 | 5.08 | 1293.07 |
| 2.27 | 274.10 | 2.80 | 434.88 | 3.70 | 779.23 | 4.62 | 1288.72 |
| 2.05 | 275.22 | 2.56 | 426.78 | 3.37 | 774.61 | 4.23 | 1272.37 |
Disclaimer/Publisher’s Note: The statements, opinions and data contained in all publications are solely those of the individual author(s) and contributor(s) and not of MDPI and/or the editor(s). MDPI and/or the editor(s) disclaim responsibility for any injury to people or property resulting from any ideas, methods, instructions or products referred to in the content. |
© 2025 by the authors. Licensee MDPI, Basel, Switzerland. This article is an open access article distributed under the terms and conditions of the Creative Commons Attribution (CC BY) license (https://creativecommons.org/licenses/by/4.0/).
Share and Cite
Gamboa, B.; Acosta, C.; Dipon, W.H.; Bhalla, A.S.; Guo, R. Modeling and Experimental Evaluation of 1-3 Stacked Piezoelectric Transducers for Energy Harvesting. J. Compos. Sci. 2025, 9, 304. https://doi.org/10.3390/jcs9060304
Gamboa B, Acosta C, Dipon WH, Bhalla AS, Guo R. Modeling and Experimental Evaluation of 1-3 Stacked Piezoelectric Transducers for Energy Harvesting. Journal of Composites Science. 2025; 9(6):304. https://doi.org/10.3390/jcs9060304
Chicago/Turabian StyleGamboa, Bryan, Carlos Acosta, Wasim Hafiz Dipon, Amar S. Bhalla, and Ruyan Guo. 2025. "Modeling and Experimental Evaluation of 1-3 Stacked Piezoelectric Transducers for Energy Harvesting" Journal of Composites Science 9, no. 6: 304. https://doi.org/10.3390/jcs9060304
APA StyleGamboa, B., Acosta, C., Dipon, W. H., Bhalla, A. S., & Guo, R. (2025). Modeling and Experimental Evaluation of 1-3 Stacked Piezoelectric Transducers for Energy Harvesting. Journal of Composites Science, 9(6), 304. https://doi.org/10.3390/jcs9060304