Article

Optimizing Nanosilica-Enhanced Polymer Synthesis for Drilling Fluids via Response Surface Methodology: Enhanced Fluid Performance Analysis

1
College of Petroleum Engineering, Ministry of Education (MOE) Key Laboratory of Petroleum Engineering, China University of Petroleum (Beijing), Beijing 102249, China
2
National Key Laboratory of Petroleum Resources and Engineering, China University of Petroleum (Beijing), Beijing 102249, China
3
School of Mathematics, Northwest University, Xi’an 710127, China
4
School of Petroleum, China University of Petroleum (Beijing), Karamay Campus, Karamay 834000, China
*
Authors to whom correspondence should be addressed.
J. Compos. Sci. 2025, 9(6), 263; https://doi.org/10.3390/jcs9060263
Submission received: 19 April 2025 / Revised: 17 May 2025 / Accepted: 23 May 2025 / Published: 26 May 2025

Abstract

:
In this study, nanosilica-based polymers were synthesized and optimized for water-based drilling fluid applications using response surface methodology (RSM). The synthesis process involved the polymerization of methacryloyloxyethyl trimethyl ammonium chloride (DMC), methacrylic acid (MAA), and silane-modified nanosilica (KH570-SiO2) under varying conditions of temperature, initiator concentration, and pH. Characterization by Fourier transform infrared spectroscopy (FTIR), nuclear magnetic resonance (1H-NMR), thermogravimetric analysis, and optical microscopy confirmed the successful polymerization and incorporation of nanosilica while maintaining structural integrity and thermal stability. The reaction conditions were optimized using RSM with variables including the temperature, pH, and initiator concentration. The optimized conditions (70.9 °C, pH 7, and 0.57 wt.% initiator concentration) resulted in significant enhancements in drilling fluid performance, including a 46.0% reduction in filtration loss, a 28.6% decrease in coefficient of friction (CoF), and improved cutting-carrying capacity (YP/PV ratio). Post-reaction analyses demonstrated the thermal stability and reusability of the synthesized polymers under high-temperature conditions, confirming their applicability in field operations. This work highlights the potential of nanosilica-based polymers in improving drilling fluid performance, offering insights into optimization strategies and enhanced material stability.

Graphical Abstract

1. Introduction

Drilling fluids are essential for efficient resource extraction, providing critical functions such as cooling, lubrication, cutting transport, and maintaining pressure balance [1,2,3]. However, the performance of traditional drilling fluids often deteriorates under high-temperature and high-salinity conditions, which limits their applicability in extreme environments. With the increasing demand for more efficient and environmentally friendly drilling solutions, researchers have turned to nanotechnology and advanced polymers as potential game changers in the oil and gas industry [4,5]. Among various nanomaterials, silica nanoparticles stand out due to their unique chemical, mechanical, and thermal properties [6,7], which can significantly enhance drilling fluid performance by improving filtration loss, rheology, lubrication, and thermal stability [8,9,10].
In recent years, water-based drilling fluids have gained prominence due to their lower environmental impact compared to oil-based alternatives. Despite their advantages, conventional water-based fluids often face challenges related to thermal degradation and salt resistance [11,12]. To address these issues, researchers have focused on modifying polymers with enhanced stability and performance, such as allyl polyethylene oxide (APEG) [13,14,15] and 2-acrylamido-2-methyl-1-propanesulfonic acid (AMPS) [16,17,18,19]. However, there remains a need for the systematic optimization of these materials to fully realize their potential in industrial applications.
The complexity of interactions between synthesis variables and drilling fluid properties necessitates the use of robust statistical tools for optimization. Response surface methodology (RSM) has emerged as a powerful approach for analyzing and optimizing these interactions, allowing researchers to identify the most influential parameters and their combined effects [15,20,21]. While RSM has been applied in various studies to optimize drilling fluid formulations [22,23,24,25,26], its use in tailoring the synthesis of advanced drilling fluid additives, such as nanosilica-based polymers, remains underexplored. For instance, previous studies [27,28] have demonstrated the benefits of RSM in improving polymer performance but have often been limited to specific conditions or lacked comprehensive evaluations under field-relevant scenarios.
Unlike previous studies that focused on single-parameter optimization [29,30], this work employs RSM to systematically analyze the combined effects of temperature, pH, and initiator concentration on drilling fluid performance. This study aims to bridge these gaps by optimizing the synthesis of nanosilica-based polymers (P-GS) for water-based drilling fluids using RSM. The synthesis involved the polymerization of methacryloyloxyethyl trimethyl ammonium chloride (DMC), methacrylic acid (MAA), and silane-modified nanosilica (KH570-SiO2) under varying conditions of temperature, initiator concentration, and pH. Comprehensive characterization techniques, including Fourier transform infrared spectroscopy (FTIR), nuclear magnetic resonance (1H-NMR), thermogravimetric analysis, and optical microscopy, were used to confirm successful polymerization and structural stability. By employing RSM to develop an optimized synthesis model, this work highlights the potential of nanosilica-based polymers in advancing drilling fluid performance and provides a robust framework for future research and practical implementation in challenging operational environments.

2. Materials and Methods

2.1. Materials

Dry-powdered, 200-mesh calcium-based bentonite (Ca-BT) was obtained in Weifang, Shandong. Calcium-based bentonite (Ca-BT) was transformed into sodium-based bentonite (Na-BT) using sodium carbonate (Na2CO3, Sinopharm, Shanghai, China, 99 wt.%). The modification of sodium-based bentonite (M-BT) was carried out using polyammonium (Shandong Hongli Chemical Co., Linyi, China, AR). Methacryloyloxyethyl trimethyl ammonium chloride (DMC, Innochem Products, Beijing, China, 75 wt.%), methacrylic acid (MAA, Innochem Products, Beijing, China, >99 wt.%), and nanosilica modified with silane coupling agent KH570 (KH570-SiO2, Nanjing XFNANO Materials Tech Co., Ltd., Nanjing, China, 99.5 wt.%, 20 nm) were used to synthesize the polymers (P-GS). Additionally, potassium persulfate (KPS; Aladdin; Shanghai, China, AR) is used as a reaction initiator for polymerization. As pH value adjusters, sodium hydroxide (NaOH, Aladdin, Shanghai, China, AR) and hydrochloric acid (HCl, Aladdin, Shanghai, China, AR) were both used.

2.2. Synthesis of P-GS

First, DMC-, MAA-, and KH570-modified silica were weighed and added to a beaker containing deionized water. The pH of the mixture was adjusted to a range of 3 to 9 using HCl and NaOH, and it was stirred magnetically at a controlled temperature of 3 °C to 7 °C. The monomer mixture was then transferred to a three-necked flask equipped with a condenser tube and stirred at 70 °C for 30 min under a nitrogen atmosphere. Following this, a small amount of the potassium persulfate initiator was added, and the reaction continued for 8 h. The resulting product was processed through freeze-drying and dialyzed in a deionized water-filled dialysis bag for 72 h to purify it. The reaction process is illustrated in Figure 1.

2.3. Characterization of P-GS

An infrared spectrometer with a resolution of more than 0.4 cm−1 and a sample scan range of 4000 to 400 cm−1, the Nicoiset-IS10 US Nico Force FTIR (Thermo Fisher, Waltham, MA, USA), was used to analyze P-GS. The samples were heated at a rate of 10 °C/min with a predetermined temperature range of 25 °C to 600 °C to create heat loss maps for P-GS using a Chinet STA449F5 simultaneous thermal analyzer (Mettler-Toledo, Zurich, Switzerland). A Bruker AVANCE III 600M NMR spectrometer (Bruker Corporation, Billerica, MA, USA) was used to analyze the 1H-NMR spectra of P-GS. A Leica DM4M optical microscope (Leica Microsystems, Wetzlar, Germany) was used to examine the morphology of P-GS. The results of this part of the analysis are displayed in Figure S1, and a detailed explanation can be found in the Supplementary file.

2.4. Response Surface Methodology (RSM) Analysis of P-GS Synthesis Conditions

RSM provides precise functional expressions for design variables and response values, enabling the identification of optimal experimental conditions and response outcomes. By analyzing each design variable and its levels, RSM reveals interactions among factors, allowing for a visual assessment of these relationships to select optimal experimental settings. In this study, the Design-Expert V13 software and the response surface methodology were employed to optimize the P-GS synthesis process, with the Box–Behnken design facilitating the efficient exploration of the synthesis parameters’ impact. A second-order polynomial regression model was used to capture the relationships between design variables and responses, enabling a quadratic equation fit to reveal interactions among the synthesis parameters. The general regression model [31] is as follows:
Y = b 0 i = 1 k b i x i + i = 1 k b i i x i 2 + i = 1 k 1 j = 1 k b i j x i x j + e ,
In this work, Y denotes the response value; xi and xj denote the variables (i and j from 1 to k); b0 is the model intercept coefficient of bj, bjj, and bij for the interaction coefficients of the linear, quadratic, and second-order terms, respectively; and k is the number of independent parameters (k = 3), Finally, e stands for the error.
To achieve the best drilling fluid property results at 150 °C after hot rolling, including cutting-carrying capacity (YP/PV), filtration loss (FL), and the coefficient of friction (CoF), RSM is carried out using a three-level (−1, 0, and +1) three-factor central design. This study used 17 experimental runs, 12 axial points, and 5 central points to conduct a selective 3-response optimization analysis. The experimental design level is shown in Table 1.

2.5. Preparation of Drilling Fluid

The formula for water-based drilling fluids is a mass ratio of Na-BT/deionized water/Na2CO3 = 4:400:0.5. At room temperature, it was stirred for 24 h at 3000 rap/min. The base drilling fluid and the GP-S polymer were mixed for 20 min at room temperature with 12,000 rap/min of stirring. The aforementioned drilling fluids were hot rolled for 16 h at 120 °C, 150 °C, 180 °C, and 210 °C, respectively, to assess their properties after hot rolling.

2.6. Filtration Property Tests

According to the American Petroleum Institute (API) filter loss standard, the filtration loss was calculated using ZNZ-D3 at room temperature and a differential pressure of 0.69 Mpa. The time for filter loss was 30 min. With the use of a measuring cylinder, the filtrate was collected and recorded.

2.7. Rheological Property Measurement

Prior to measuring the rheology, the drilling fluid was stirred at 12,000 rap/min for 30 min to ensure that the drilling fluid has the same shear history. Firstly, the rheological properties of the drilling fluid were measured using a rotational viscometer (ZNN-D6B, Qingdao, China) according to the standards recommended by the American Petroleum Institute (API). The apparent viscosity (AV), plastic viscosity (PV), and yield point (YP) of the drilling fluid rheological parameters were calculated from viscometer readings at 600 and 300 rpm using the following equations:
A V = 1 2 φ 600 m P a · s
P V = φ 600 φ 300 m P a · s

2.8. Lubricity Testing of Drilling Fluids

The coefficient of friction (CoF) was measured using an EP extreme pressure lubricator (Fann212) with a fixed torque of 150 lb and a fixed speed of 60 rpm, and the values were read after the dashboard readings had stabilized. Drilling fluids with varying P-GS contents were stirred at a high speed for 20 min before being poured into the measuring plate. Before measuring each sample, the lubricator must be calibrated with water, the reading of the water must be between 34 and 40, and the slider and metal ring must be cleaned with ethanol.

3. Results and Discussion

3.1. RSM and Experimental Design

3.1.1. RSM Optimization of Optimal Synthesis Conditions

The primary parameters for monomer synthesis in this study have been established early on, where mDMC:mMAA = 1:8, the mass of Nano-silica is 1.5 g, and the reaction duration is 8 h. Additionally, it was revealed that 0.5 wt.% of synthetic P-GS was added. The Box–Behnken experimental design and the results are shown in Table S1. The following requirements were combined to execute the model optimization analysis: creating a regression model, examining the impact of different variables on drilling fluid properties, and lastly identifying the most optimal synthesis conditions.

3.1.2. Experimental Results and Error Analysis of the Response Surface

The gathered data were fitted using Design-Expert V13 in accordance with the experimental setup previously mentioned, and multiple models (linear, interactive, quadratic, and cubic models) were used in order to determine the optimal regression equation. Table S2 compares the sufficiency of the models. According to Table S2, when choosing the right response model, both the variance R2 and the significance level of the p-values were taken into consideration. The outcomes of an applied analysis of variance (ANOVA) can show how setting up and processing the variables affect the values of the final responses. We carried out an analysis of variance to ensure that the model was adequate and compatible. The main requirements include the following:
  • p-values below 0.05 indicate that the model is significant and statistically significant [32];
  • R2 and adjusted R2 require values close to one [33];
  • The coefficient of variance (CV) is the ratio of the standard error of the fit to the mean of the response values, which is required to be less than 10% for the common model to indicate the reproducibility of the model [34];
  • A signal-to-noise ratio greater than four indicates that the model has sufficient accuracy [35].
As a result, the best statistical model for the two response values of YP/PV and CoF was determined to be a quadratic second-order model, while the best statistical model for the FL response value was determined to be a cubic third-order model based on the R2 and p-values of the various models. The three models in Table S3 with the chosen response values are denoted by the bolded text.
The final fitted equations between the design variables and the drilling fluid response values are derived in Equations (5)–(7) as follows:
RYP/PV = 0.18 + 3.862e−3A + 4.272 e−3B + 1.526 e−3C + 0.040AB − 0.057AC + 0.079BC − 0.049A2 − 0.022B2 − 0.055C2,
RFL = 9.72 − 1.18A − 0.025B + 0.35C + 0.90AB − 0.45AC + 0.15BC + 1.44A2 − 0.060B2 + 2.86C2 − 0.77A2B + 1.90A2C + 0.18AB2,
RCoF = 0.25 − 6.875e−3A − 0.02B − 9.250e−3C + 0.017AC + 0.034BC + 0.043A2 + 0.021B2 + 0.16C2,
Additionally, Table S2 provides a summary of the analysis of the variance of the responses, and Tables S4–S6 include the analysis of variance tables for the response values. The model-related parameters of the three response values satisfy the requirements of the four aspects of a, b, c, and d when compared with the actual variance discovered. As a result, the model properly reflects the link between the variable components and the response values, and the associated predicted values are quite close to the actual values.

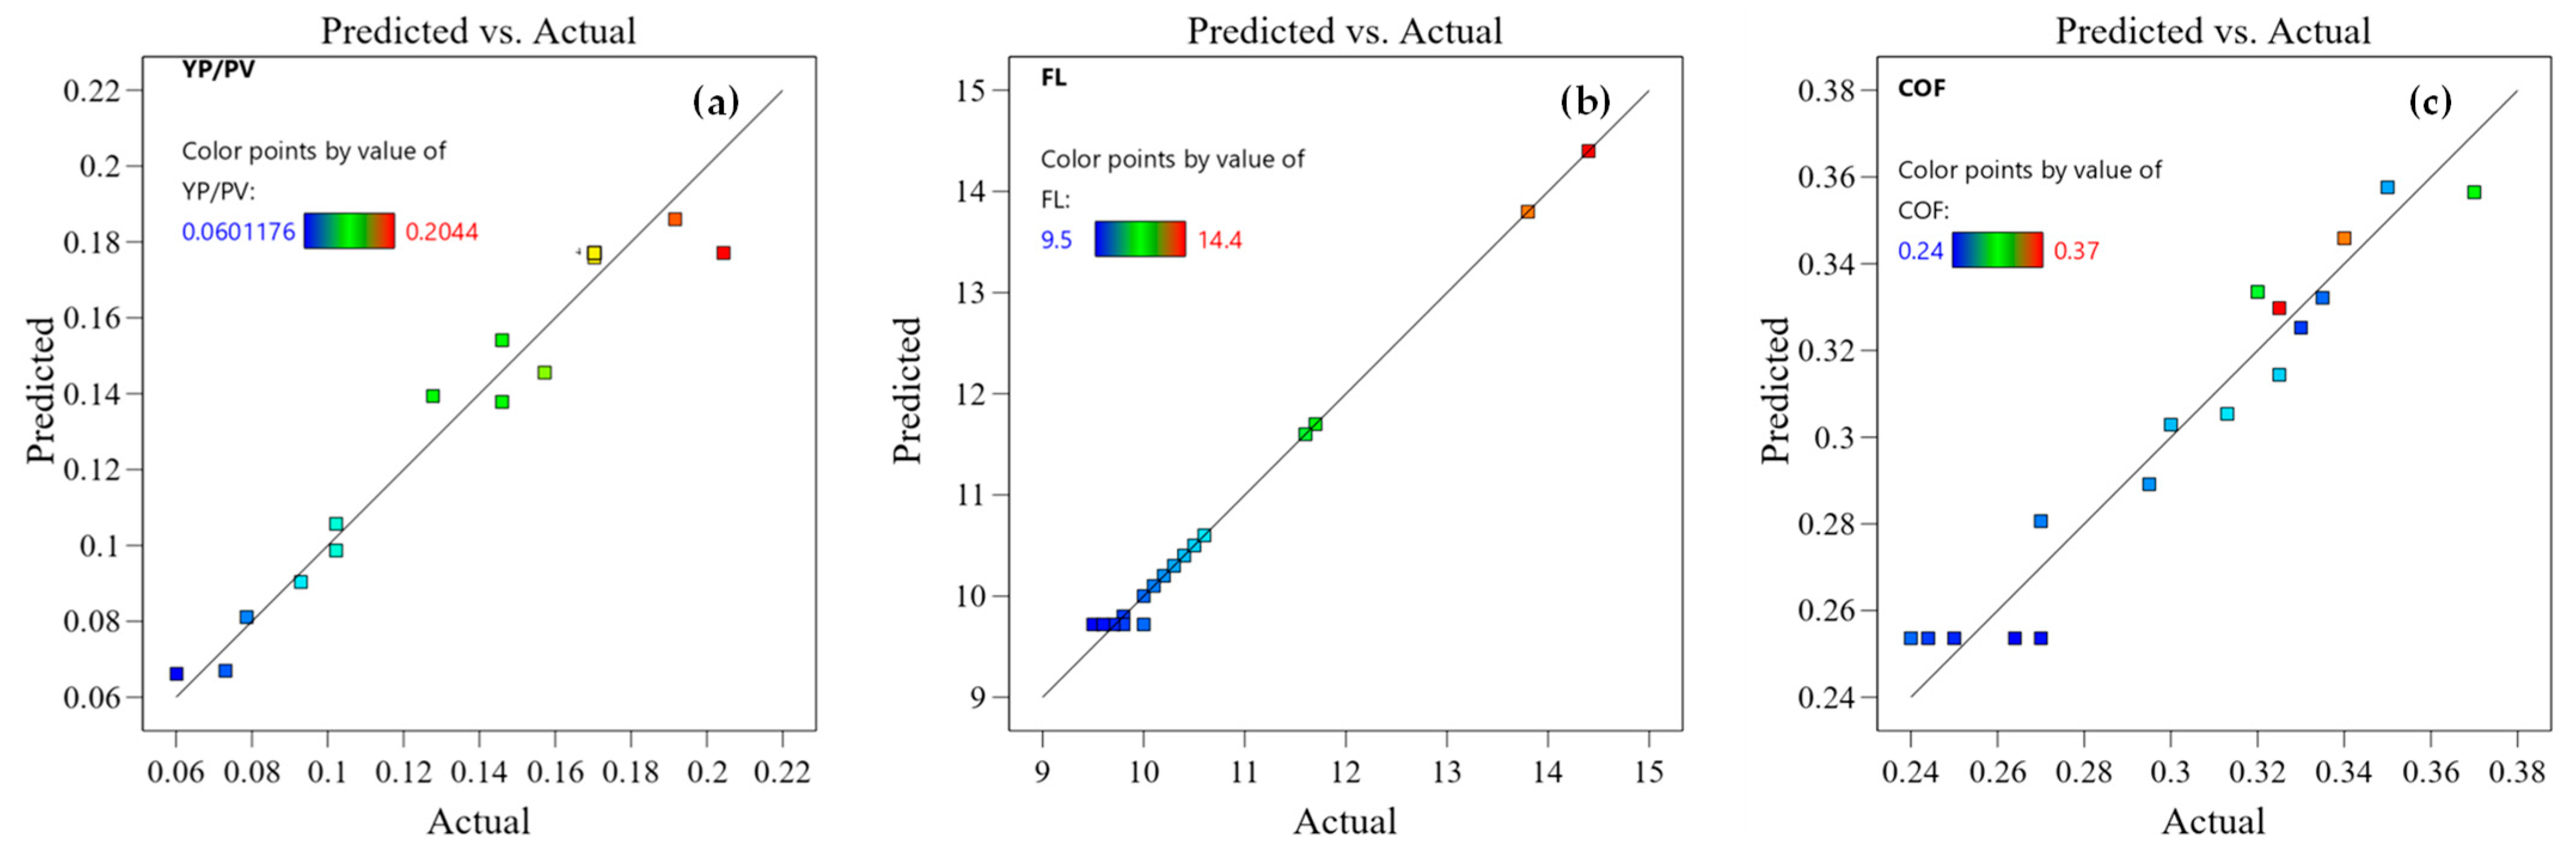
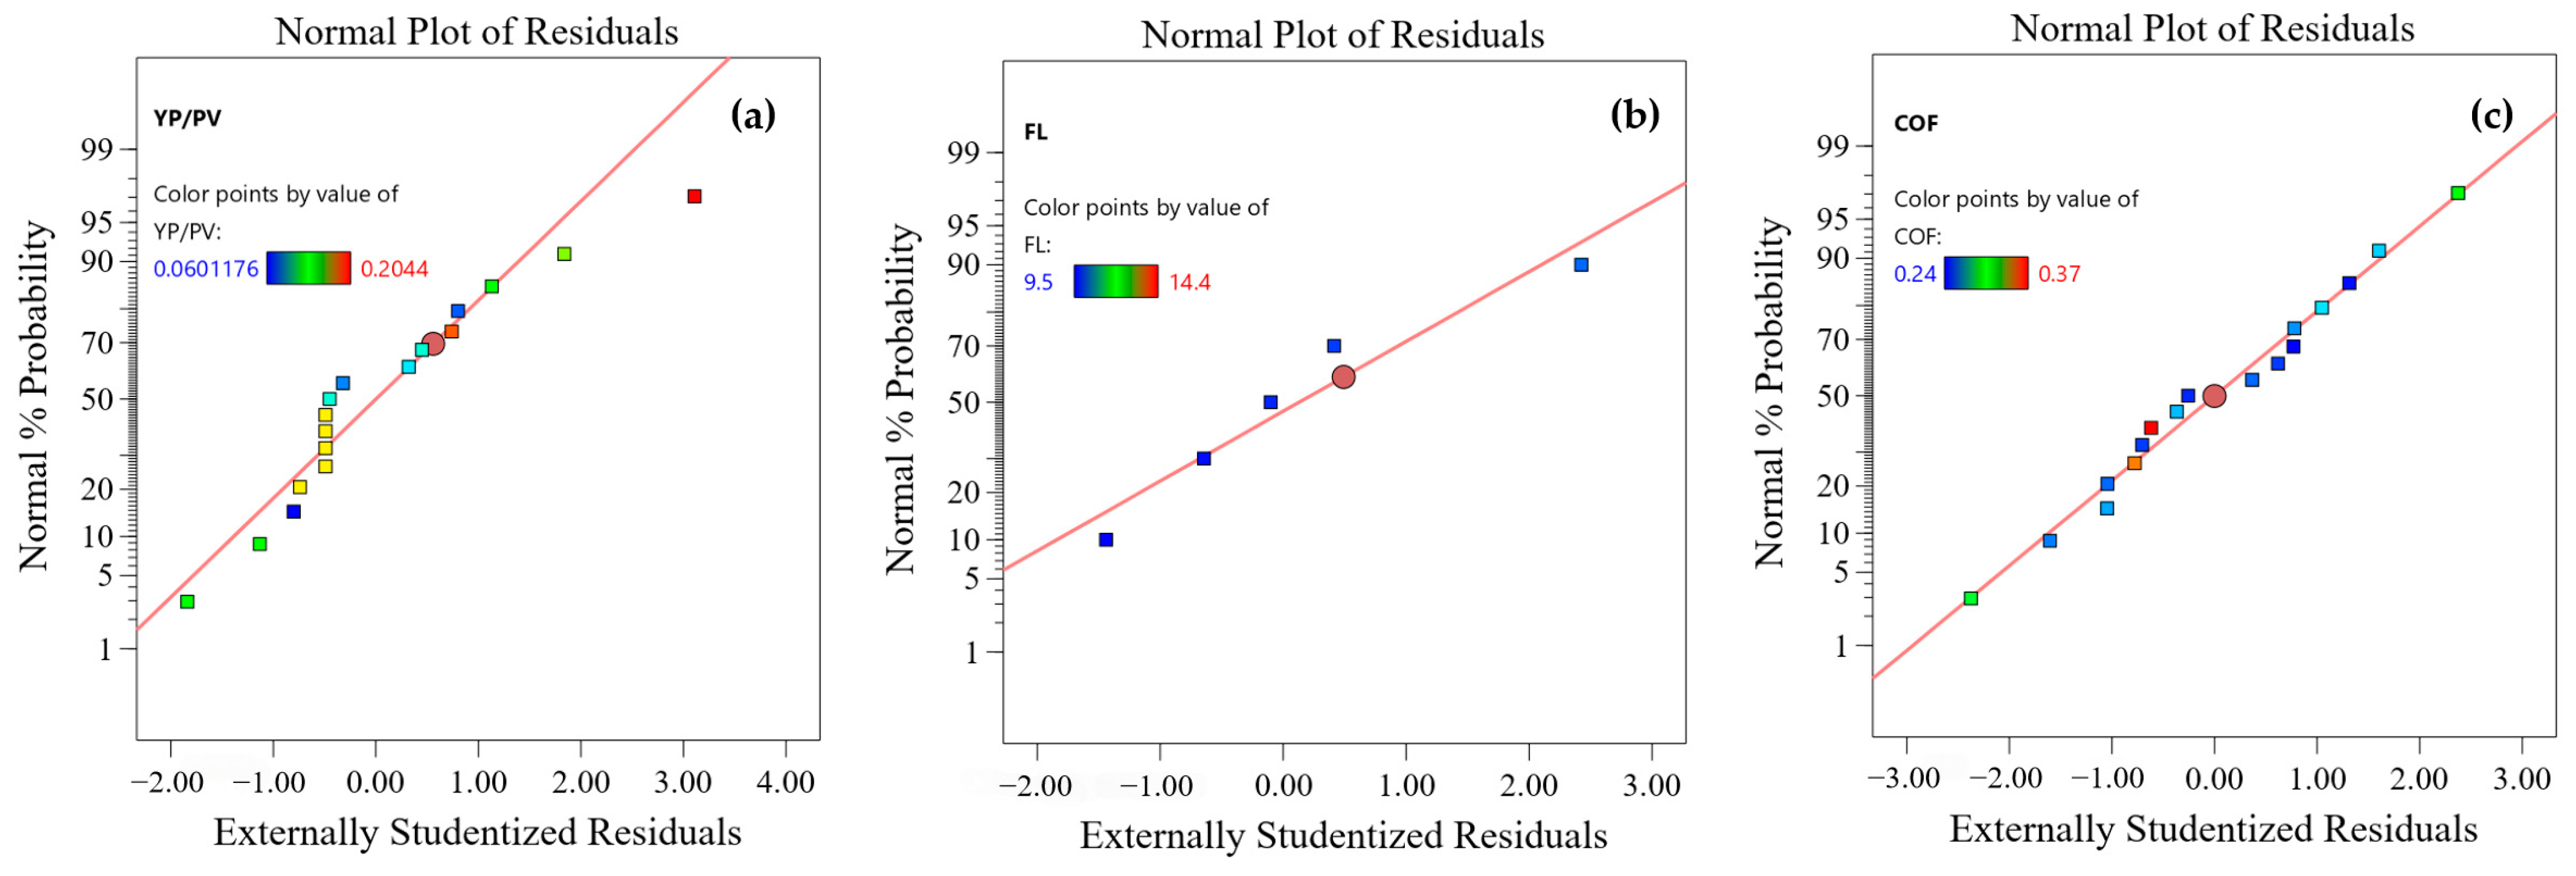
3.1.3. Diagnostic Chart Assessment Model

The correlation between the anticipated and experimental values is presented as a model diagnostic diagram to evaluate the fidelity of the model. The obtained response values were contrasted with the predicted values of the model in Figure 2. The right distribution of data points around the straight line demonstrates the capacity of the model to forecast the response values [36]. Additionally, a normal distribution of the residuals can be found by analyzing the difference between experimentally observed values and model-predicted values using the residuals. The accuracy of the model is increased due to a reduced residual value [37]. Figure 3 shows the normal probability distribution of the residuals. The experimental results agree with the projected values obtained by the regression model, which further supports the adequacy of the regression model. The distribution of the data points on the graph is close to a straight line.

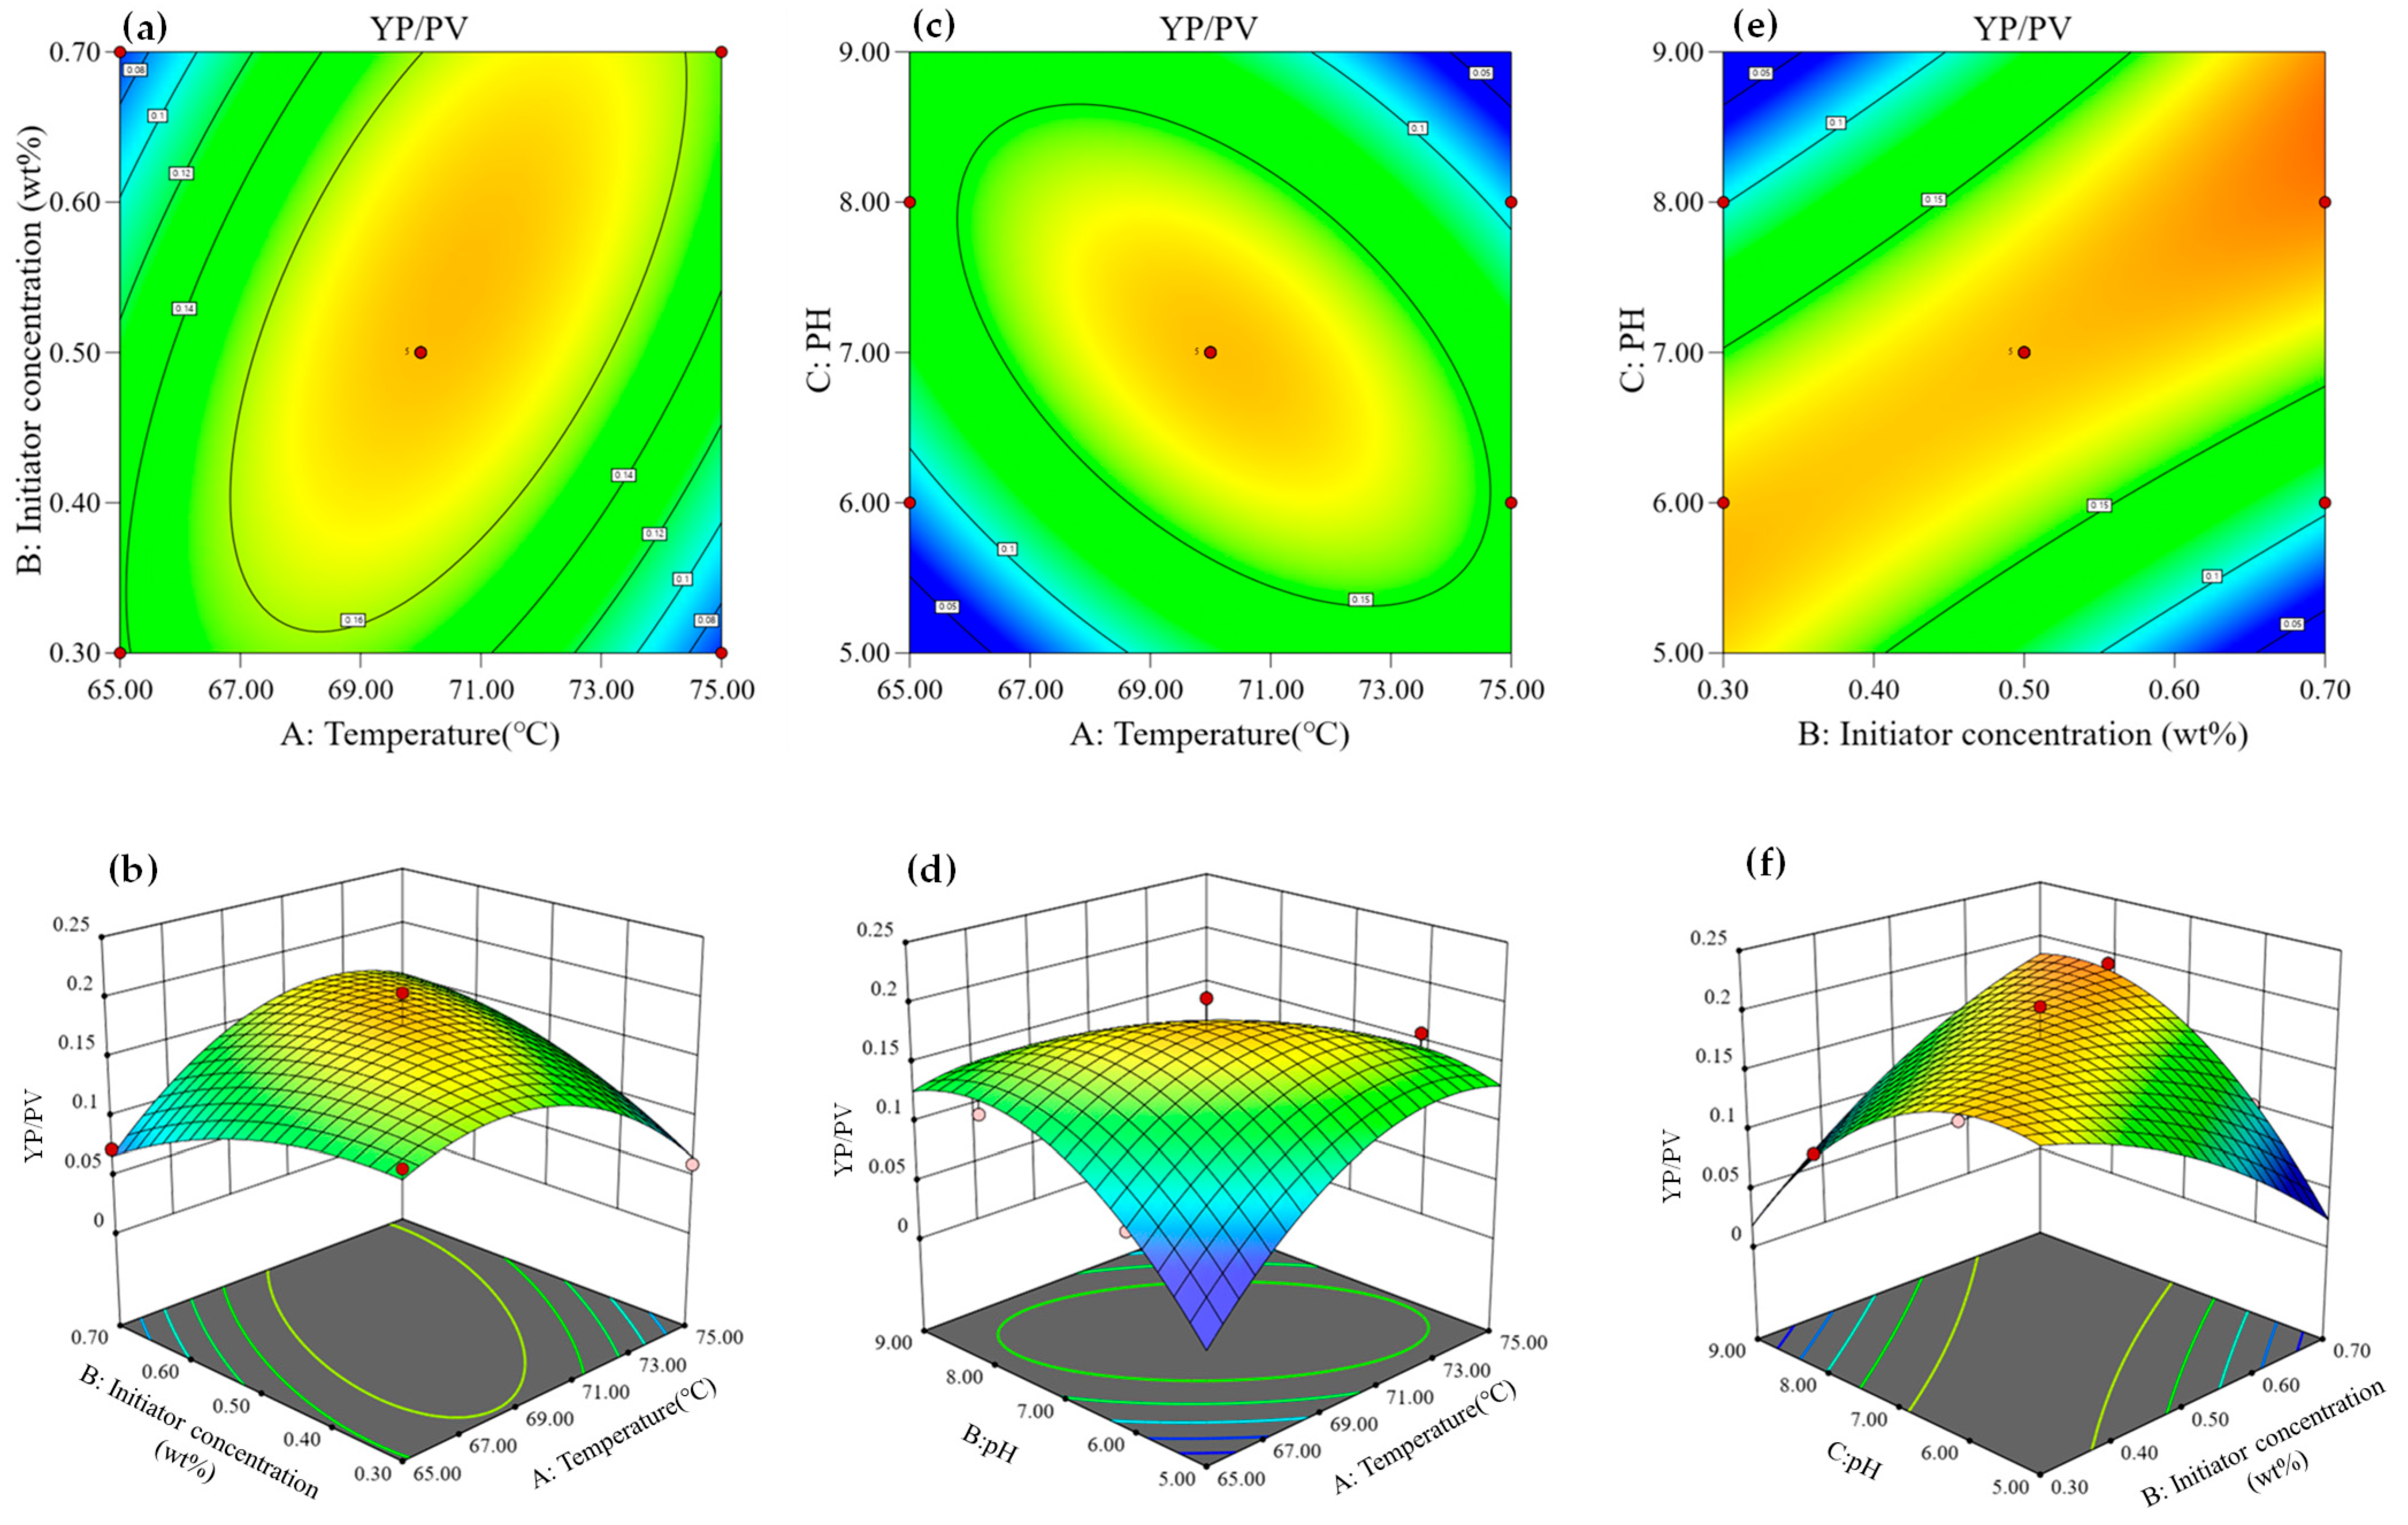
3.1.4. Effect of Variables on Response Values

(1)
Effect of variables on cutting-carrying capacity (YP/PV)
The cutting-carrying capacity of the drilling fluid, represented by the yield point-to-plastic viscosity ratio (YP/PV), is influenced by the interactions between various synthesis conditions [2,37]. Figure 4a,b illustrate the combined effect of the initiator concentration and temperature on YP/PV. The gradient of the variation in YP/PV is similar for both variables, with a significant interaction effect (p-value < 0.05). As seen in the 3D surface plot in Figure 4b, the optimal YP/PV is achieved at an initiator concentration of approximately 0.5 wt.% and a temperature of around 70 °C. Optimizing the temperature is critical: while higher temperatures accelerate molecular collisions, excessive heat degrades the polymer, impairing its cutting-carrying capacity. Separately, the initiator concentration must balance reaction efficiency: low concentrations produce insufficient radicals, whereas high concentrations require adequate heat to avoid slowed decomposition and incomplete polymerization.
Figure 4c,d show the interaction between pH and temperature, with a significant effect on YP/PV (p-value = 0.0061). The cutting-carrying capacity first increases and then decreases as the pH ranges from 6 to 8, and the temperature varies between 68 °C and 73 °C. Low temperatures and low pH values hinder polymer synthesis, while at higher temperatures and pH levels, the chain growth rate slows, leading to reduced polymerization and diminished cutting efficiency.
The interaction between initiator concentration and pH, as shown in Figure 4e,f, also significantly affects YP/PV (p-value = 0.001). The optimal performance is observed at low pH values and high initiator concentrations or conversely at high pH values with low initiator concentrations. The interaction between initiator concentration and pH, as shown in Figure 4e,f, also significantly affects YP/PV (p-value = 0.001). The introduction of silicon significantly improves the temperature resistance and structural stability of the polymers. The high bonding energy of the Si-O-Si skeleton (460 kJ/mol) resists degradation at high temperatures [38], while the dissociation of the silicon hydroxyl groups (-Si-OH → -Si-O-) improves clay dispersion via electrostatic stabilization [26,38,39]. Under these conditions, the synthesized polymer retains superior cutting-carrying capacity, supporting its use in drilling fluids for enhanced performance.
(2)
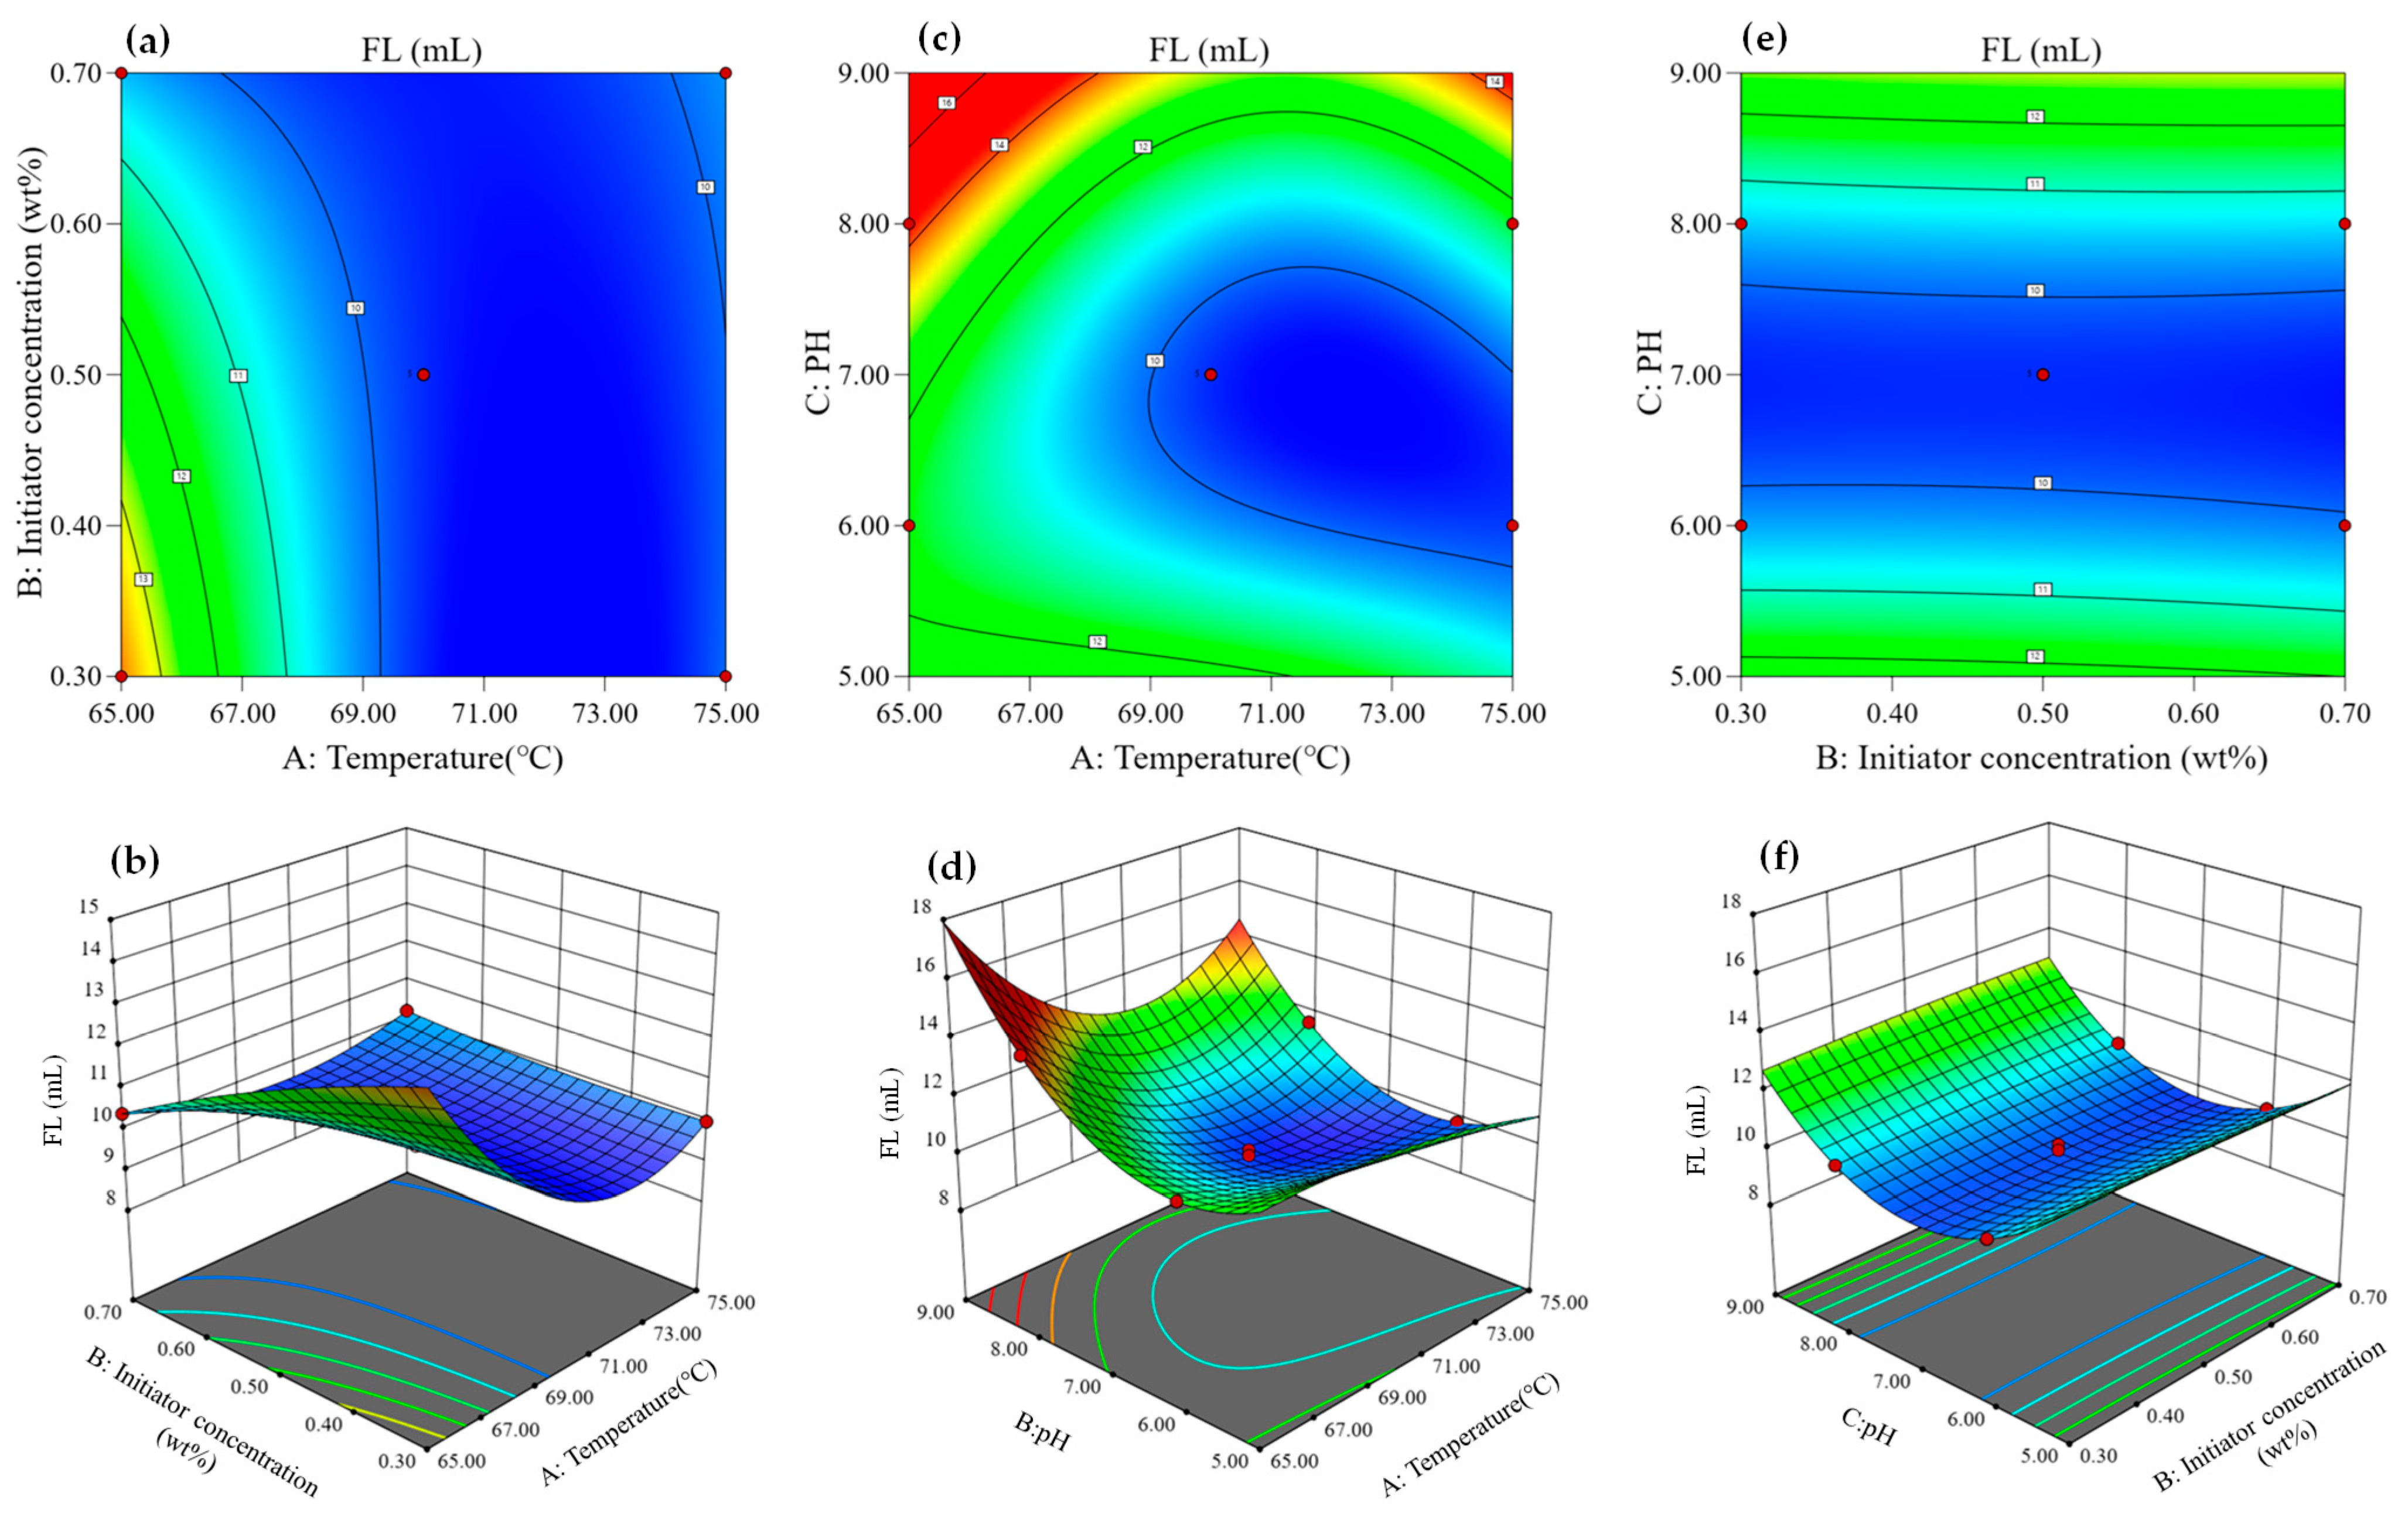
Effect of variables on drilling fluid filtration loss (FL)
As one of the important evaluation standards of drilling fluid properties, the lower the filtration loss of drilling fluids, the easier it is to form a low-permeability, flexible, thin, and dense filter cake, which is conducive to stabilizing the well wall and protecting the oil and gas reservoir [40].
The 3D response surface plots and contour plots in Figure 5 illustrate the interactions between synthesis variables and their effect on drilling fluid filtration loss. Figure 5a,b show the combined influence of initiator concentration and temperature on filtration loss. It is evident that increasing both temperature and initiator concentration reduces filtration loss. Compared to the initiator concentration, temperature has a more pronounced effect on filtration loss, as indicated by the steeper gradient, especially when pH is 7. The significant interaction between temperature and initiator concentration is further confirmed by a p-value of 0.0007, demonstrating a strong correlation.
In contrast, Figure 5e,f depict the interaction between pH and initiator concentration, which shows no significant impact on filtration loss, with a p-value of 0.4795, which is well above 0.05. As the pH increases, the filtration loss initially decreases but then rises again. This pattern aligns with the F-values from the analysis, where temperature has the highest impact on filtration loss with an F-value of 149.26, followed by pH with an F-value of 3.31 and initiator concentration with a minimal impact, as reflected in the lowest F-value of 0.068. Si-O-Al bonding promotes the tight binding of polymers to clay particles and the formation of low-permeability filter cakes [41].
(3)
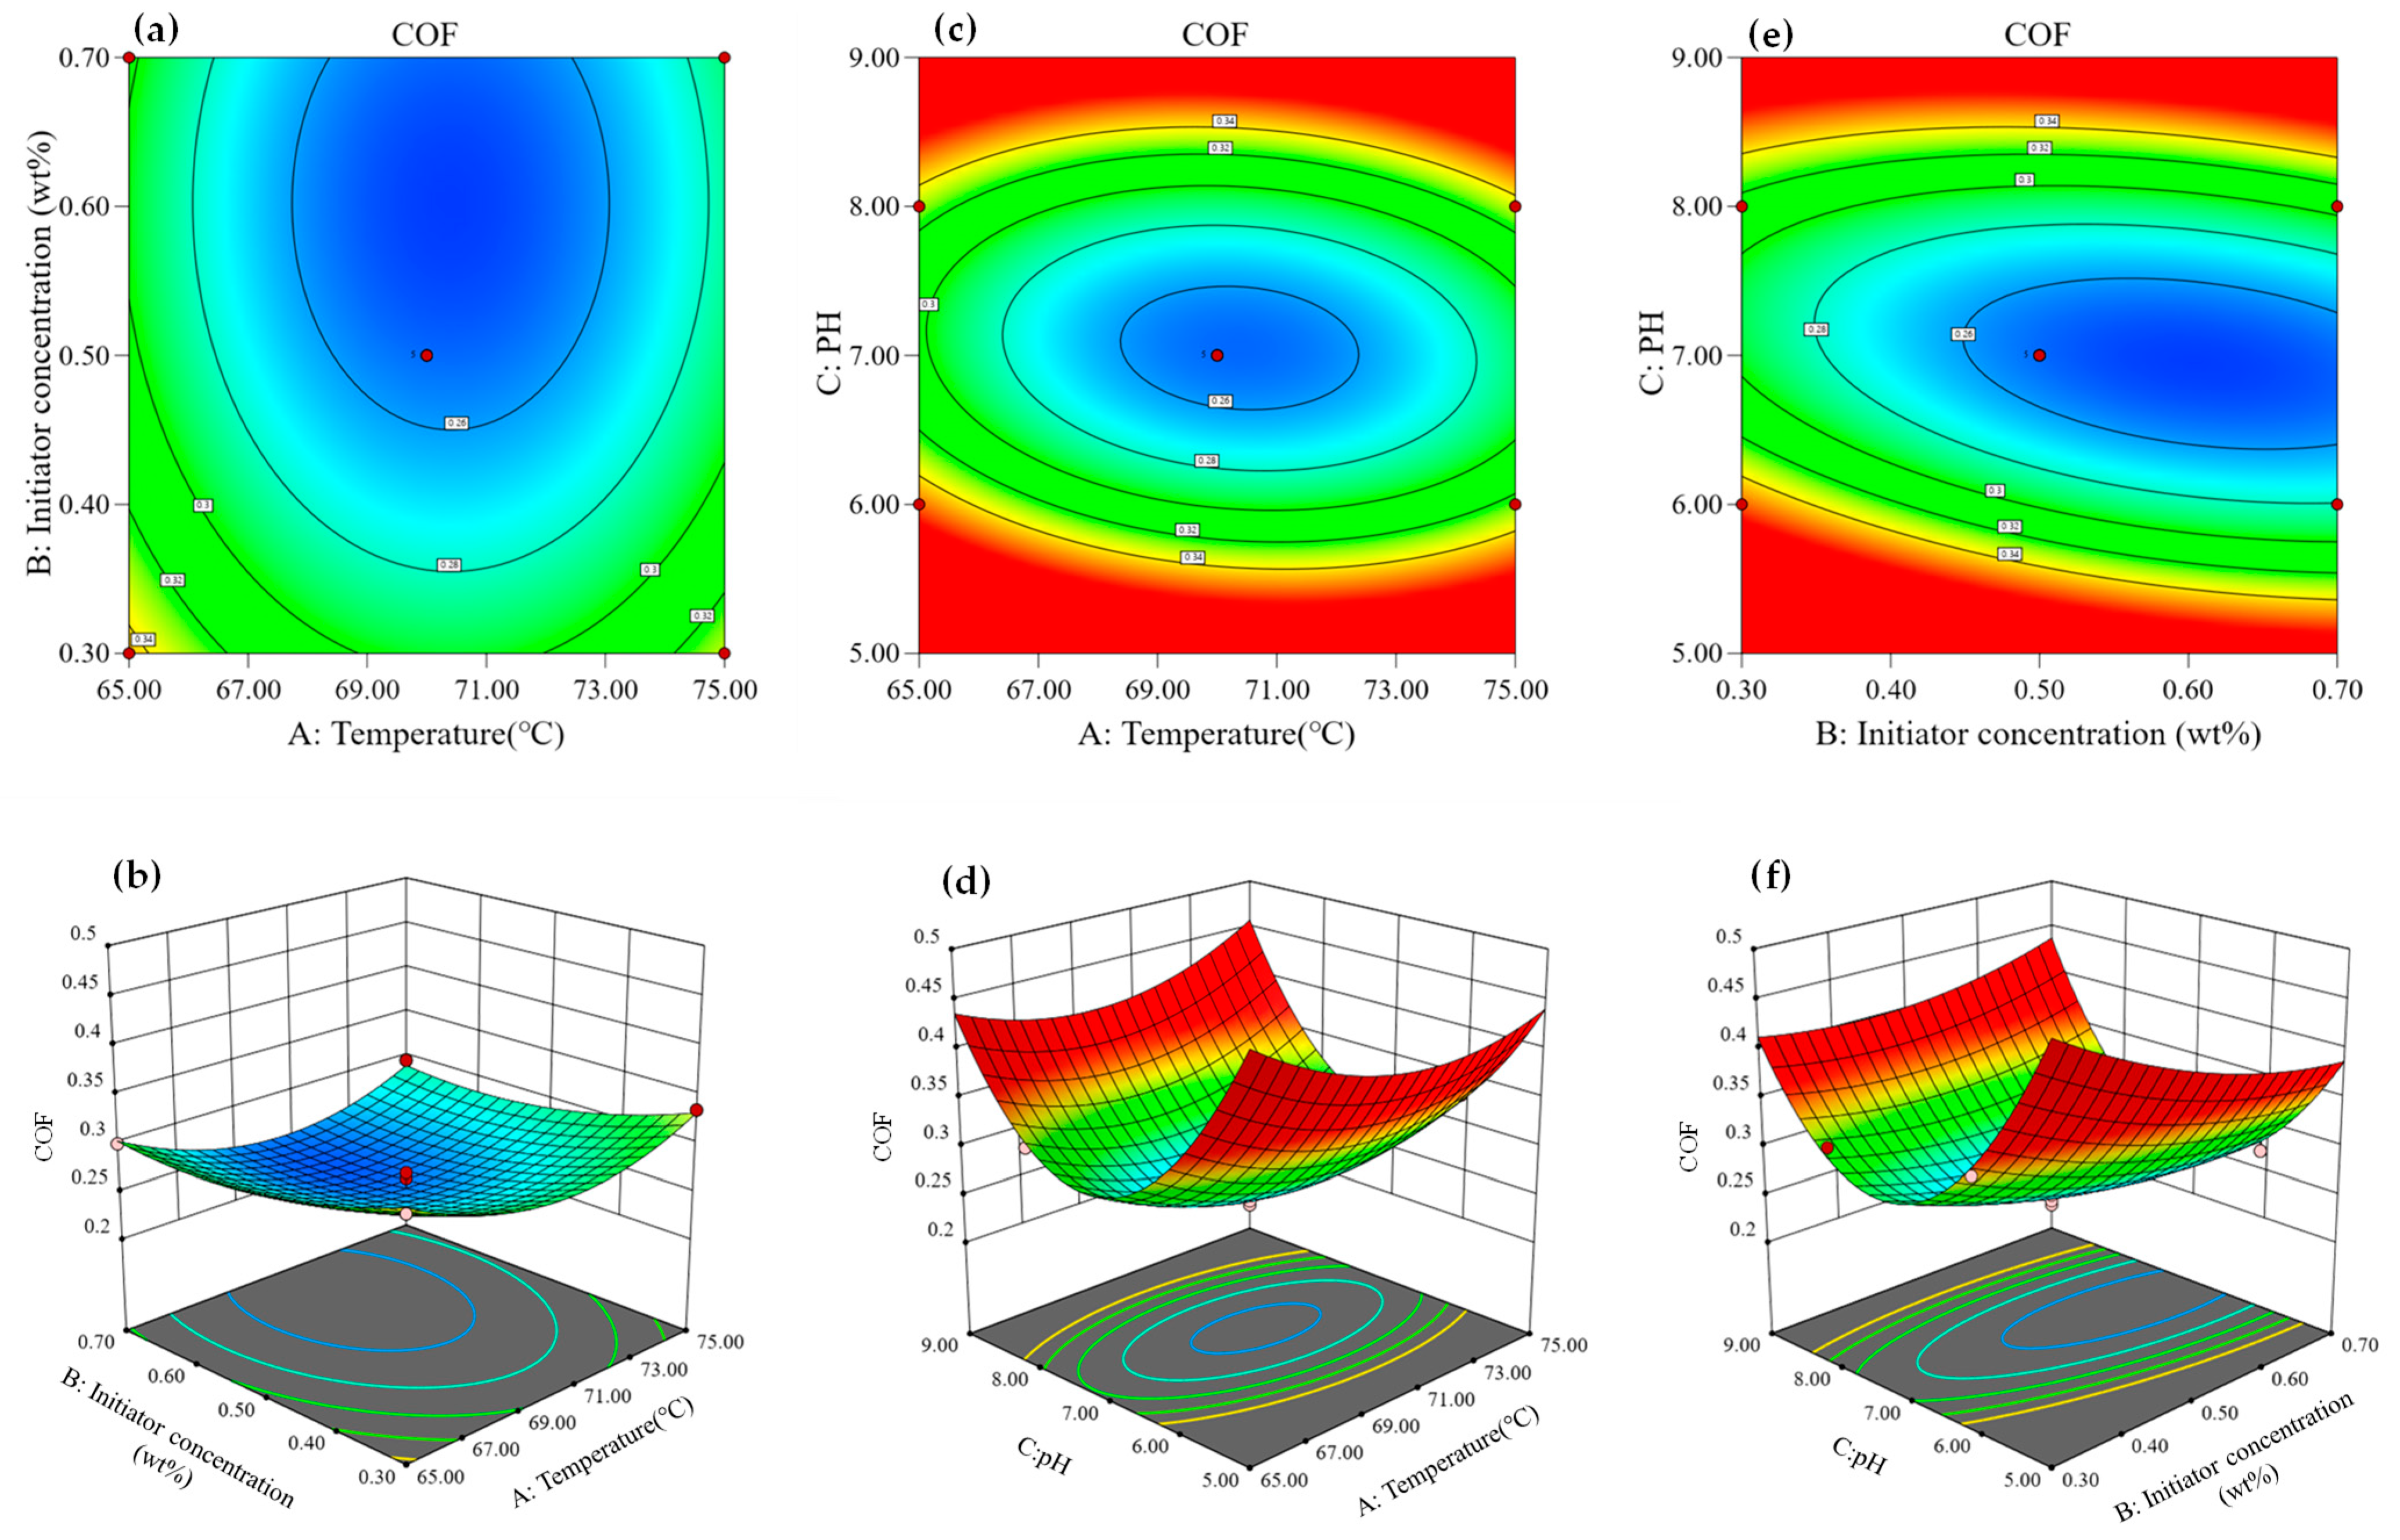
Effect of variables on the coefficient of friction (CoF) of drilling fluids.
Improving the lubrication performance of drilling fluids can effectively solve the problem of high friction during the drilling process [42,43].
The interaction between initiator concentration and temperature on the coefficient of friction (CoF) of the drilling fluid is illustrated in Figure 6a,b. As both temperature and initiator concentration increase, the CoF initially decreases to a minimum value before rising again. In free-radical polymerization, the rate of initiator decomposition plays a crucial role in controlling the monomer’s polymerization rate. Temperature significantly affects both the rate of initiator decomposition and the overall reaction temperature. While higher temperatures improve the efficiency of polymer synthesis by accelerating initiator decomposition, excessive heat can cause the breakdown rate to become too rapid, leading to incomplete reactions and a suboptimal product.
At moderate temperatures and with a sufficient initiator concentration, the polymer is synthesized efficiently, which allows it to successfully adsorb onto the clay layer, thereby enhancing the drilling fluid’s lubricity. Silicone-containing polymers reduce frictional resistance through the ease of rotation of Si-O bonds (surface energy 20.1–22.5 mN/m ≥ 30 mN/m for conventional polymers) [44]. The CoF reduction is attributed to silicon-derived hydrophobic layers that minimize metal-to-clay friction. Optimal initiator concentrations (0.5 wt.%) ensure uniform polymer adsorption, while excessive temperatures degrade this alignment (Figure 6). Under these conditions, the interaction forces between the clay and drilling fluid are minimized, contributing to improved lubricity performance.
In contrast, the interactions between pH and temperature, as well as pH and initiator concentration, have little impact on the CoF, as indicated by p-values greater than 0.05. The gradient of change in pH and temperature has a more pronounced effect on the CoF than initiator concentration. Statistical analysis confirms that the single term B (initiator concentration) and the squared terms A2 (temperature), B2 (initiator concentration), and C2 (pH) are significant (p-values < 0.05), as shown in Table S3.

3.1.5. Optimized Results

Table 2 shows the optimal variables and corresponding response results after optimization. The optimal conditions selected were a temperature of 70.9 °C, a pH of 7, and an initiator concentration of 0.57 wt.%. To assess accuracy, three parallel experiments were conducted, and the results are also included in the table. The error is the absolute value of the difference between the optimized value and the experimental mean value. The optimized response values closely match the experimental results, with an average error of less than 1%, confirming the model’s high accuracy and good fit.

3.2. Evaluation of Drilling Fluid Performance

After aging at various temperatures, the cutting-carrying capacity, filtration loss, and coefficient of friction (CoF) of water-based drilling fluids and drilling fluids containing P-GS were evaluated, as shown in Table 3. The addition of P-GS significantly improved drilling fluid properties by increasing AV/PV, reducing filtration loss, and lowering CoF. Specifically, AV/PV increased from 0 to 0.146; filtration loss decreased from 25 mL to 11.5 mL, and CoF dropped from 0.35 to 0.25, indicating substantial performance enhancements. However, high-temperature aging led to AV/PV rising to 0.511 due to clay particle aggregation, which negatively affected the rheological properties and increased pumping pressure. High temperatures also increased filtration loss and degraded lubricity, posing risks during drilling.
After the addition of P-GS, the filtration loss of drilling fluids decreased to 8.4 mL and 9.4 mL after aging at 120 °C and 150 °C for 16 h, respectively, as compared to the room temperature condition. The CoF of 0.25 remained constant while the YP/PV slightly increased. The hydration of P-GS polymer is weakened; the polymer chain is stretched, and the clay aggregation effect of high temperatures is now apparent [45]. High-temperature aging and a high pressure, however, disrupt the adsorption between the water molecules, the P-GS polymer molecules, and the clay particles, leading to serious clay particle aggregation [46]. After a while, the YP/PV of drilling fluids increased to 0.554; filtration loss significantly increased to 20.3 mL; CoF increased to 0.32, and lubricity performance deteriorated. Despite these challenges, P-GS exhibited excellent cutting-carrying capacity, filtration control, and lubricity properties in water-based drilling fluids, even at 150 °C. These results indicate the potential of P-GS as an effective additive for enhancing drilling fluid performance under extreme conditions.

4. Conclusions

This study optimized the synthesis of a nanosilica-based polymer (GP-S) for water-based drilling fluids using response surface methodology (RSM). The polymer, which was synthesized under ideal conditions (70.9 °C, pH 7, and 0.57 wt.% initiator), demonstrated excellent thermal stability (260.42 °C), low filtration loss (8.4 mL), and improved rheological properties. These enhancements result from nanosilica’s strong Si-O-Si bonding and its ability to stabilize clay dispersion.
The RSM approach provides a predictive framework for designing high-performance drilling fluid additives, reducing reliance on empirical methods. GP-S’s stability under extreme conditions makes it suitable for demanding drilling applications while supporting environmental goals through its water-based formulation. Future work should focus on scaling up its production and testing its long-term performance under field conditions.

Supplementary Materials

The following supporting information can be downloaded at https://www.mdpi.com/article/10.3390/jcs9060263/s1. Figure S1. (a) FTIR spectrum of P-GS, (b) 1H-NMR spectrum of P-GS, (c) TG and DTG curves of P-GS, and (d) the size distribution of P-GS. Table S1. Box–Behnken experimental design and response results. Table S2. Summary of the three models’ analyses of variance (ANOVA). Table S3. Fitting key parameters in the model. Table S4. Response surface regression ANOVA table for YP/PV. Table S5. Response surface regression ANOVA table for FL. Table S6. Response surface regression ANOVA table for CoF [32].

Author Contributions

Conceptualization, X.Z.; methodology, X.J.; software, X.J. and N.L.; validation, X.J.; investigation, X.Z.; data curation, X.J. and N.L.; writing—original draft preparation, X.J.; writing—review and editing, X.Z.; supervision, X.Z. All authors have read and agreed to the published version of the manuscript.

Funding

This research received no external funding.

Data Availability Statement

Data is contained within the article or Supplementary Material.

Acknowledgments

The authors would like to thank the Oilfield Chemistry Laboratory of China University of Petroleum (Beijing) for the use and testing of the instruments provided. And the authors also thank Nanjing Jiangsu XFNANO Materials Tech Co., Ltd. for providing the Nano silica materials.

Conflicts of Interest

The authors declare no conflicts of interest.

References

  1. Caenn, R.; Chillingar, G.V. Drilling Fluids: State of the Art. J. Pet. Sci. Eng. 1996, 14, 221–230. [Google Scholar] [CrossRef]
  2. Caenn, R.; Darley, H.C.H.; Gray, G.R.; Gray, G.R. Composition and Properties of Drilling and Completion Fluids, 6th ed.; Gulf Professional Pub: Amsterdam, The Netherlands; Boston, MA, USA, 2011; ISBN 978-0-12-383858-2. [Google Scholar]
  3. Fink, J.K. Drilling Muds. In Petroleum Engineer’s Guide to Oil Field Chemicals and Fluids; Elsevier: Amsterdam, The Netherlands, 2012; pp. 1–59. ISBN 978-0-12-383844-5. [Google Scholar]
  4. Kim, B.H.; Hackett, M.J.; Park, J.; Hyeon, T. Synthesis, Characterization, and Application of Ultrasmall Nanoparticles. Chem. Mater. 2014, 26, 59–71. [Google Scholar] [CrossRef]
  5. Hassani, S.S.; Daraee, M.; Sobat, Z. Advanced Development in Upstream of Petroleum Industry Using Nanotechnology. Chin. J. Chem. Eng. 2020, 28, 1483–1491. [Google Scholar] [CrossRef]
  6. Cheraghian, G. Nanoparticles in Drilling Fluid: A Review of the State-of-the-Art. J. Mater. Res. Technol. 2021, 13, 737–753. [Google Scholar] [CrossRef]
  7. Hulla, J.; Sahu, S.; Hayes, A. Nanotechnology: History and Future. Hum. Exp. Toxicol. 2015, 34, 1318–1321. [Google Scholar] [CrossRef]
  8. Vryzas, Z.; Kelessidis, V.C. Nano-Based Drilling Fluids: A Review. Energies 2017, 10, 540. [Google Scholar] [CrossRef]
  9. Rafati, R.; Smith, S.R.; Sharifi Haddad, A.; Novara, R.; Hamidi, H. Effect of Nanoparticles on the Modifications of Drilling Fluids Properties: A Review of Recent Advances. J. Pet. Sci. Eng. 2018, 161, 61–76. [Google Scholar] [CrossRef]
  10. Hoelscher, K.P.; De Stefano, G.; Riley, M.; Young, S. Application of Nanotechnology in Drilling Fluids. In Proceedings of the SPE International Oilfield Nanotechnology Conference and Exhibition, Noordwijk, The Netherlands, 12–14 June 2012; SPE: Noordwijk, The Netherlands, 2012; p. SPE-157031-MS. [Google Scholar]
  11. Desidery, L.; Lanotte, M. Polymers and Plastics: Types, Properties, and Manufacturing. In Plastic Waste for Sustainable Asphalt Roads; Elsevier: Amsterdam, The Netherlands, 2022; pp. 3–28. ISBN 978-0-323-85789-5. [Google Scholar]
  12. Fan, W.; Zhuang, G.; Li, Q.; Yuan, P.; Liu, D. Review of Nanoparticles in Water-Based Drilling Fluids: Innovations, Challenges, and Future Directions. Energy Fuels 2025, 39, 8800–8826. [Google Scholar] [CrossRef]
  13. Liu, L.; Pu, X.; Rong, K.; Yang, Y. Comb-Shaped Copolymer as Filtrate Loss Reducer for Water-Based Drilling Fluid. J. Appl. Polym. Sci. 2018, 135, 45989. [Google Scholar] [CrossRef]
  14. Liu, D.; Yan, Y.; Bai, G.; Yuan, Y.; Zhu, T.; Zhang, F.; Shao, M.; Tian, X. Mechanisms for Stabilizing and Supporting Shale Fractures with Nanoparticles in Pickering Emulsion. J. Pet. Sci. Eng. 2018, 164, 103–109. [Google Scholar] [CrossRef]
  15. Elkatatny, S.; Tariq, Z.; Mahmoud, M. Real Time Prediction of Drilling Fluid Rheological Properties Using Artificial Neural Networks Visible Mathematical Model (White Box). J. Pet. Sci. Eng. 2016, 146, 1202–1210. [Google Scholar] [CrossRef]
  16. Jiang, G.; He, Y.; Cui, W.; Yang, L.; Ye, C. A Saturated Saltwater Drilling Fluid Based on Salt-Responsive Polyampholytes. Pet. Explor. Dev. 2019, 46, 401–406. [Google Scholar] [CrossRef]
  17. Huang, X.; Lv, K.; Sun, J.; Lu, Z.; Bai, Y.; Shen, H.; Wang, J. Enhancement of Thermal Stability of Drilling Fluid Using Laponite Nanoparticles under Extreme Temperature Conditions. Mater. Lett. 2019, 248, 146–149. [Google Scholar] [CrossRef]
  18. Mao, H.; Wang, W.; Ma, Y.; Huang, Y. Synthesis, Characterization and Properties of an Anionic Polymer for Water-Based Drilling Fluid as an Anti-High Temperature and Anti-Salt Contamination Fluid Loss Control Additive. Polym. Bull. 2021, 78, 2483–2503. [Google Scholar] [CrossRef]
  19. Jia, X.; Zhao, X.; Chen, B.; Egwu, S.B.; Huang, Z. Polyanionic Cellulose/Hydrophilic Monomer Copolymer Grafted Silica Nanocomposites as HTHP Drilling Fluid-Loss Control Agent for Water-Based Drilling Fluids. Appl. Surf. Sci. 2022, 578, 152089. [Google Scholar] [CrossRef]
  20. Tariq, Z.; Murtaza, M.; Mahmoud, M.; Aljawad, M.S.; Kamal, M.S. Machine Learning Approach to Predict the Dynamic Linear Swelling of Shales Treated with Different Waterbased Drilling Fluids. Fuel 2022, 315, 123282. [Google Scholar] [CrossRef]
  21. Kania, D.; Yunus, R.; Omar, R.; Abdul Rashid, S.; Mohamed Jan, B. Rheological Investigation of Synthetic-Based Drilling Fluid Containing Non-Ionic Surfactant Pentaerythritol Ester Using Full Factorial Design. Colloids Surf. A Physicochem. Eng. Asp. 2021, 625, 126700. [Google Scholar] [CrossRef]
  22. Khashay, M.; Zirak, M.; Sheng, J.J.; Esmaeilnezhad, E. Properties Experimental Investigation of Water-Based Drilling Mud Contained Tragacanth Gum and Synthesized Zinc Oxide Nanoparticles. J. Mol. Liq. 2024, 402, 124794. [Google Scholar] [CrossRef]
  23. Faisal, R.; Kamal, I.; Salih, N.; Préat, A. Optimum Formulation Design and Properties of Drilling Fluids Incorporated with Green Uncoated and Polymer-Coated Magnetite Nanoparticles. Arab. J. Chem. 2024, 17, 105492. [Google Scholar] [CrossRef]
  24. Ali, I.; Ahmad, M.; Lashari, N. Optimizing Filtration Properties of Water Based Drilling Mud Systems Using Dually Modified Starch. J. Clean. Prod. 2024, 454, 142022. [Google Scholar] [CrossRef]
  25. Malika, M.; Pargaonkar, A.; Sonawane, S.S. Experimental and Statistical Analysis of MWCNT Hybrid Nanofluid-Based Multi-Functional Drilling Fluid. Chem. Pap. 2023, 77, 6773–6784. [Google Scholar] [CrossRef]
  26. Gautam, S.; Kumar, S.; Kumar, A.; Rajak, V.K.; Guria, C. Development of Functional Polymer-Based Clay-Free HPHT Drilling Fluid: Effect of Molecular Weight and Its Distribution on Drilling Fluid Performance. Geoenergy Sci. Eng. 2025, 246, 213616. [Google Scholar] [CrossRef]
  27. Gautam, S.; Guria, C. Optimal Synthesis, Characterization, and Performance Evaluation of High-Pressure High-Temperature Polymer-Based Drilling Fluid: The Effect of Viscoelasticity on Cutting Transport, Filtration Loss, and Lubricity. SPE J. 2020, 25, 1333–1350. [Google Scholar] [CrossRef]
  28. Bai, X.; Zhang, X.; Xu, Y.; Yong, X. Synthesis and Characterization of Sodium Carboxymethyl Starch-Graft Acrylamide/1-Vinyl-2-Pyrrolidone Copolymers via Central Composite Design and Using as Filtration Loss Agent in Drilling Muds. Starch—Stärke 2021, 73, 2000151. [Google Scholar] [CrossRef]
  29. Alakbari, F.S.; Mohyaldinn, M.E.; Mahmood, S.M.; Hassan, A.M.; Ashena, R.; Al-Fakih, A. A Statistics-Based Correlation for the Assessment of Water-Based Mud Performance: Yield Point Prediction. Arab. J. Sci. Eng. 2025, 50, 4927–4942. [Google Scholar] [CrossRef]
  30. Khashay, M.; Zirak, M.; Sheng, J.J.; Ganat, T.; Esmaeilnezhad, E. Elevated Temperature and Pressure Performance of Water Based Drilling Mud with Green Synthesized Zinc Oxide Nanoparticles and Biodegradable Polymer. Sci. Rep. 2025, 15, 11930. [Google Scholar] [CrossRef]
  31. Bin Mahfouz, A.; Ali, A.; Mubashir, M.; Hanbazazah, A.S.; Alsaady, M.; Show, P.L. Optimization of Viscosity of Titania Nanotubes Ethylene Glycol/Water-Based Nanofluids Using Response Surface Methodology. Fuel 2023, 347, 128334. [Google Scholar] [CrossRef]
  32. Maran, J.P.; Sivakumar, V.; Sridhar, R.; Thirugnanasambandham, K. Development of Model for Barrier and Optical Properties of Tapioca Starch Based Edible Films. Carbohydr. Polym. 2013, 92, 1335–1347. [Google Scholar] [CrossRef]
  33. Noordin, M.Y.; Venkatesh, V.C.; Sharif, S.; Elting, S.; Abdullah, A. Application of Response Surface Methodology in Describing the Performance of Coated Carbide Tools When Turning AISI 1045 Steel. J. Mater. Process. Technol. 2004, 145, 46–58. [Google Scholar] [CrossRef]
  34. Ghafari, S.; Aziz, H.A.; Isa, M.H.; Zinatizadeh, A.A. Application of Response Surface Methodology (RSM) to Optimize Coagulation–Flocculation Treatment of Leachate Using Poly-Aluminum Chloride (PAC) and Alum. J. Hazard. Mater. 2009, 163, 650–656. [Google Scholar] [CrossRef]
  35. Muthukumar, M.; Mohan, D.; Rajendran, M. Optimization of Mix Proportions of Mineral Aggregates Using Box Behnken Design of Experiments. Cem. Concr. Compos. 2003, 25, 751–758. [Google Scholar] [CrossRef]
  36. Murugesan, K.; Dhamija, A.; Nam, I.-H.; Kim, Y.-M.; Chang, Y.-S. Decolourization of Reactive Black 5 by Laccase: Optimization by Response Surface Methodology. Dye. Pigment. 2007, 75, 176–184. [Google Scholar] [CrossRef]
  37. Mohajeri, L.; Aziz, H.A.; Isa, M.H.; Zahed, M.A. A Statistical Experiment Design Approach for Optimizing Biodegradation of Weathered Crude Oil in Coastal Sediments. Bioresour. Technol. 2010, 101, 893–900. [Google Scholar] [CrossRef]
  38. Li, H.; Sun, J.; Xie, S.; Lv, K.; Huang, X.; Zong, J.; Zhang, Y. Controlling Filtration Loss of Water-Based Drilling Fluids by Anionic Copolymers with Cyclic Side Groups: High Temperature and Salt Contamination Conditions. Colloids Surf. A Physicochem. Eng. Asp. 2023, 676, 132089. [Google Scholar] [CrossRef]
  39. Xie, B.; Chen, J.; Chen, J.; Ma, C.; Zhao, L.; Tchameni, A.P. Novel Thermo-Associating Polymer/Silica Nanocomposite as a Temperature-Resistant Rheology Modifier for Bentonite-Free Water-Based Drilling Fluids. Geoenergy Sci. Eng. 2023, 222, 211426. [Google Scholar] [CrossRef]
  40. Davoodi, S.; Al-Shargabi, M.; Wood, D.A.; Rukavishnikov, V.S.; Minaev, K.M. Thermally Stable and Salt-Resistant Synthetic Polymers as Drilling Fluid Additives for Deployment in Harsh Sub-Surface Conditions: A Review. J. Mol. Liq. 2023, 371, 121117. [Google Scholar] [CrossRef]
  41. Ao, T.; Yang, L.; Xie, C.; Jiang, G.; Wang, G.; Liu, Z.; He, X. Zwitterionic Silica-Based Hybrid Nanoparticles for Filtration Control in Oil Drilling Conditions. ACS Appl. Nano Mater. 2021, 4, 11052–11062. [Google Scholar] [CrossRef]
  42. Kania, D.; Yunus, R.; Omar, R.; Abdul Rashid, S.; Mohamad Jan, B. A Review of Biolubricants in Drilling Fluids: Recent Research, Performance, and Applications. J. Pet. Sci. Eng. 2015, 135, 177–184. [Google Scholar] [CrossRef]
  43. Zheng, Y.; Amiri, A.; Polycarpou, A.A. Enhancements in the Tribological Performance of Environmentally Friendly Water-Based Drilling Fluids Using Additives. Appl. Surf. Sci. 2020, 527, 146822. [Google Scholar] [CrossRef]
  44. Yilgör, E.; Yilgör, I. Silicone Containing Copolymers: Synthesis, Properties and Applications. Prog. Polym. Sci. 2014, 39, 1165–1195. [Google Scholar] [CrossRef]
  45. Liu, J.; Zhang, T.; Sun, Y.; Lin, D.; Feng, X.; Wang, F. Insights into the High Temperature-Induced Failure Mechanism of Bentonite in Drilling Fluid. Chem. Eng. J. 2022, 445, 136680. [Google Scholar] [CrossRef]
  46. Qu, Y.; Lin, L.; Gao, S.; Yang, Y.; Huang, H.; Li, X.; Ren, H.; Luo, W. A Molecular Dynamics Study on Adsorption Mechanisms of Polar, Cationic, and Anionic Polymers on Montmorillonite. RSC Adv. 2023, 13, 2010–2023. [Google Scholar] [CrossRef] [PubMed]
Figure 1. Synthesis route of P-GS.
Jcs 09 00263 g001
Figure 2. Comparison chart of predicted and actual values for YP/PV (a), FL (b), and CoF (c).
Jcs 09 00263 g002
Figure 3. Residual normal distribution of YP/PV (a), FL (b), and CoF (c).
Jcs 09 00263 g003
Figure 4. Contour plots and 3D response surface plots of the interaction between synthesis conditions and their effect on the cutting-carrying capacity (YP/PV) of the drilling fluid. (a) Interaction between initiator concentration and temperature at pH = 7. (b) 3D response surface plot of the interaction between initiator concentration and temperature at pH = 7. (c) Interaction between pH and temperature at an initiator concentration of 0.5 wt.%. (d) 3D response surface plot of the interaction between pH and temperature at an initiator concentration of 0.5 wt.%. (e) Interaction between pH and initiator concentration at a temperature of 70 °C. (f) 3D response surface plot of the interaction between pH and initiator concentration at a temperature of 70 °C. Color scale indicates the magnitude of YP/PV: blue represents lower values, transitioning through green and yellow to red for higher values.
Jcs 09 00263 g004
Figure 5. Contour plots and 3D response surface plots of the interaction between synthesis conditions and their effect on drilling fluid filtration loss (FL). (a) Interaction between initiator concentration and temperature at pH = 7. (b) 3D response surface plot of the interaction between initiator concentration and temperature at pH = 7. (c) Interaction between pH and temperature at an initiator concentration of 0.5 wt.%. (d) 3D response surface plot of the interaction between pH and temperature at an initiator concentration of 0.5 wt.%. (e) Interaction between pH and initiator concentration at a temperature of 70 °C. (f) 3D response surface plot of the interaction between pH and initiator concentration at a temperature of 70 °C. Color scale indicates the magnitude of FL: blue represents lower values, transitioning through green and yellow to red for higher values.
Jcs 09 00263 g005
Figure 6. Contour plots and 3D response surface plots of the interaction between synthesis conditions and their effect on the coefficient of friction (CoF) of drilling fluids. (a) Interaction between initiator concentration and temperature at pH = 7. (b) 3D response surface plot of the interaction between initiator concentration and temperature at pH = 7. (c) Interaction between pH and temperature at an initiator concentration of 0.5 wt.%. (d) 3D response surface plot of the interaction between pH and temperature at an initiator concentration of 0.5 wt.%. (e) Interaction between pH and initiator concentration at a temperature of 70 °C. (f) 3D response surface plot of the interaction between pH and initiator concentration at a temperature of 70 °C. Color scale indicates the magnitude of CoF: blue represents lower values, transitioning through green and yellow to red for higher values.
Jcs 09 00263 g006
Table 1. RSM design-level factor.
Design FactorsDesign VariablesHorizontal Codes
−101
Temperature/°CA657075
Initiator concentration/wt.%B0.30.50.7
pHC579
Table 2. Optimized optimal variables and response results.
ABCYP/PVError (YP/PV) (%)FLError (FL) (%)CoFError (CoF)
(%)
Best-fit optimization70.947.010.570.17767-9.58153-0.248849-
Actual optimization70.970.570.17768-9.59283-0.248815-
Run170.970.570.18252.719.50.970.2500.48
270.970.570.18252.719.60.070.2470.73
370.970.570.17930.919.60.070.2461.13
Average70.970.570.18142.19.530.650.3880.78
Table 3. The properties of drilling fluids with P-GS addition at different aging temperatures.
Aging TemperaturesYP/PVFL/mLCoF
P-GSBaseP-GSBaseP-GSBase
25 °C0.146011.5250.250.35
120 °C0.150290.5118.428.70.240.38
150 °C0.18250.5119.4320.250.425
180 °C0.5110.51114.435.30.280.45
210 °C0.5540.51120.337.80.320.49
Disclaimer/Publisher’s Note: The statements, opinions and data contained in all publications are solely those of the individual author(s) and contributor(s) and not of MDPI and/or the editor(s). MDPI and/or the editor(s) disclaim responsibility for any injury to people or property resulting from any ideas, methods, instructions or products referred to in the content.

