Article

Energy-Absorbing Performance of Metallic Thin-Walled Porous Tubes Filled with Liquid Crystal Elastomers Under Dynamic Crush

1
School of Mechatronical Engineering, Beijing Institute of Technology, Beijing 100081, China
2
Science and Technology on Electromechincal Dynamic Control Laboratory, Beijing 100081, China
3
China Academy of Aerospace Science and Innovation, Beijing 100871, China
*
Authors to whom correspondence should be addressed.
J. Compos. Sci. 2025, 9(4), 190; https://doi.org/10.3390/jcs9040190
Submission received: 5 February 2025 / Revised: 27 March 2025 / Accepted: 14 April 2025 / Published: 16 April 2025
(This article belongs to the Section Composites Applications)

Abstract

:
Metallic thin-walled porous tubes have been widely applied in energy absorption fields due to their unique mechanical properties. Inspired by foam-filled structures, liquid crystal elastomers as a new category of metamaterials were filled in metallic thin-walled porous tubes to obtain a novel composite energy-absorbing structure that can improve energy-absorbing capabilities. By means of experiments and numerical simulations, this paper investigated deformation modes and the energy-absorbing performance of metallic thin-walled porous tubes filled with liquid crystal elastomers under dynamic crush. Moreover, the effects of geometric parameters on deformation modes and the energy-absorbing performance of the metallic thin-walled porous tubes filled with liquid crystal elastomers were analyzed. The results show that liquid crystal elastomers can enhance energy-absorbing capabilities under dynamic crush and geometric parameters can affect deformation modes, further affecting the energy-absorbing performance of metallic thin-walled porous tubes filled with liquid crystal elastomers.

1. Introduction

Metallic thin-walled porous tubes (MPTs) possess remarkable properties such as ultra-light weight, high specific strength, high specific stiffness, and outstanding impact resistance. Notably, the abundant voids within these structures offer the potential for filling with other materials, which significantly facilitates the realization of structure–material composite designs. This exceptional feature has attracted the attention of numerous scholars worldwide. Consequently, MPTs and their filled composite structures have been widely applied in energy-absorbing devices across various fields, including automobile [1], rail transit [2], and aerospace [3].
The energy-absorbing behavior of MPTs has undergone extensive research. Alexander developed an approximate theory for the collapse process of thin-walled cylindrical shells under axial loading and conducted a comparative analysis between the theoretical results and experiments [4]. Andrews et al. carried out an experimental study on the axial collapse of aluminum alloy tubes under quasi-static loading. Their research explored axial extrusion modes, energy absorption characteristics of cylindrical tubes during quasi-static compression, and the influence of factors such as tube length. They also presented a classification chart [5]. Tarlochan et al. utilized finite element simulations to study the energy absorption performance of six thin-walled structures with different cross-sectional shapes under axial and oblique impacts. After a multi-step design optimization process, they discovered that an optimized hexagonal tube structure demonstrated excellent energy absorption capabilities [6]. Nia et al. conducted a comparative study on the energy absorption capabilities of simple and multi-cell thin-walled aluminum tubes with triangular, square, hexagonal, and octagonal cross-sections under quasi-static loading through experiments and numerical simulations [7].
Although conventional thin-walled tubes generally exhibit ideal energy-absorbing performance after an optimized design, their crushing behavior remains highly sensitive to machining errors and initial geometric imperfections [8]. In recent years, holes have been introduced into conventional thin-walled tubes to generate ideal deformation modes and effectively reduce the initial peak crushing force. Moradpour et al. introduced a new type of thin-walled tube structure with holes. Through experimental research and theoretical analysis, they explored the influence of its geometric parameters on the extrusion performance and energy absorption capacity of thin-walled tubes made of aluminum alloy and mild steel and obtained the optimal structural parameters [9]. Yilmaz et al. analyzed the load-bearing capacity of medium-length steel cylindrical shells with circular cutouts under axial compression through numerical simulations and experimental studies and proposed empirical equations for predicting the ultimate load [10]. Montazeri et al. conducted a comparative study on the crushing performance, energy absorption capacity, and specific energy absorption of holed and grooved thin-walled tubes under axial loading through experiments, numerical simulations, and theoretical analyses and evaluated the influence of different materials and structures [11].
In addition to introducing holes into the MPTs mentioned above, filler materials are another effective method to significantly enhance the energy-absorbing performance of MPTs. The most common filler materials proposed in the literature include polymeric foams such as polyurethane and metallic foams such as aluminum foam. Niknejad et al. explored the energy absorption characteristics of polyurethane foam-filled quadrangular tubes during the axial extrusion process through theoretical analysis and experimental research. They considered the interaction effects to predict the relationship between axial force and displacement and compared the theoretical and experimental results [12]. Hussein et al. experimentally investigated the performance of square aluminum tubes filled with polyurethane foam and aluminum honeycomb under axial compression. They analyzed the effects of various factors on deformation modes, crushing forces, energy absorption, etc., and drew conclusions such as the optimal performance of the combined-filled tubes [13]. Altin et al. investigated the effect of different foam filler ratios on the energy absorption capacity of axially compressed, thin-walled, multi-cell, square and circular tubes through experiments and numerical simulations. They analyzed the effects of factors such as wall thickness and concluded that foam-filled square tubes had the best crash performance [14]. Yao et al. investigated the energy absorption behavior of foam-filled holed tubes under axial crushing through experiments and theoretical analyses. They proposed a new theoretical model and analyzed the influence of relevant factors [15].
Liquid crystal elastomers (LCEs), due to their excellent energy-absorbing abilities, have attracted increasing attention from researchers in the field of impact protection. Xiao et al. reviewed the progress of liquid crystal elastomers in preparation methods, design and actuation mechanisms, and application fields and proposed prospects for future research directions [16]. Chen et al. reviewed the 4D printing technology of liquid crystal elastomers, covering the basic properties of LCEs, the principles of 4D printing techniques, the materials of printed LCEs, and their applications, and also explored challenges and future development directions [17]. Wang et al. investigated the mechanical behavior of isotropic genesis, polydomain liquid crystal elastomers (I-PLCEs) at different strain rates through experiments, theoretical analysis, and numerical simulations. They established a compressible visco–hyperelastic constitutive model and analyzed its strain rate sensitivity [18].
In order to present the current research status more clearly and intuitively, Table 1 was created to summarize the key information and limitations of the literature mentioned above.
However, although metallic thin-walled porous tubes (MPTs) and liquid crystal elastomers (LCEs) both exhibit excellent mechanical properties, experimental and numerical studies bringing the advantages of both together for composite structures are still lacking. In this paper, a novel type of composite energy-absorbing structure was proposed, which is composed of the metallic thin-walled porous tubes (MPTs) and liquid crystal elastomers. The MPTs were fabricated using metal 3D printing technology. The LCEs were synthesized through chemical methods and then poured into the MPTs to form the composite energy-absorbing structure. Through drop-weight dynamic impact experiments and numerical simulations, the deformation modes and energy-absorbing characteristics of the MPT–LCE were analyzed. Meanwhile, the influence of geometric parameters on the deformation modes and energy-absorbing performance of the MPT–LCE was investigated. The goal of this paper is to reveal the deformation process and energy-absorbing properties of MPT–LCEs as energy-absorbing components.

2. Design and Fabrications

This section presents the design methods and geometric parameters of metallic thin-walled porous tubes filled with liquid crystal elastomers (MPT–LCEs). The metallic thin-walled porous tubes (MPTs) were prepared using selective laser melting (SLM) technology, and the liquid crystal elastomers (LCEs) were synthesized. LCEs were infused into MPTs to form MPT–LCEs. What is more, in order to obtain the mechanical properties of the base material used for MPT fabrication, quasi-static tensile testing and Split Hopkinson Pressure Bar (SHPB) testing were performed. Finally, the evolution indicators of measuring energy-absorbing performance were described.

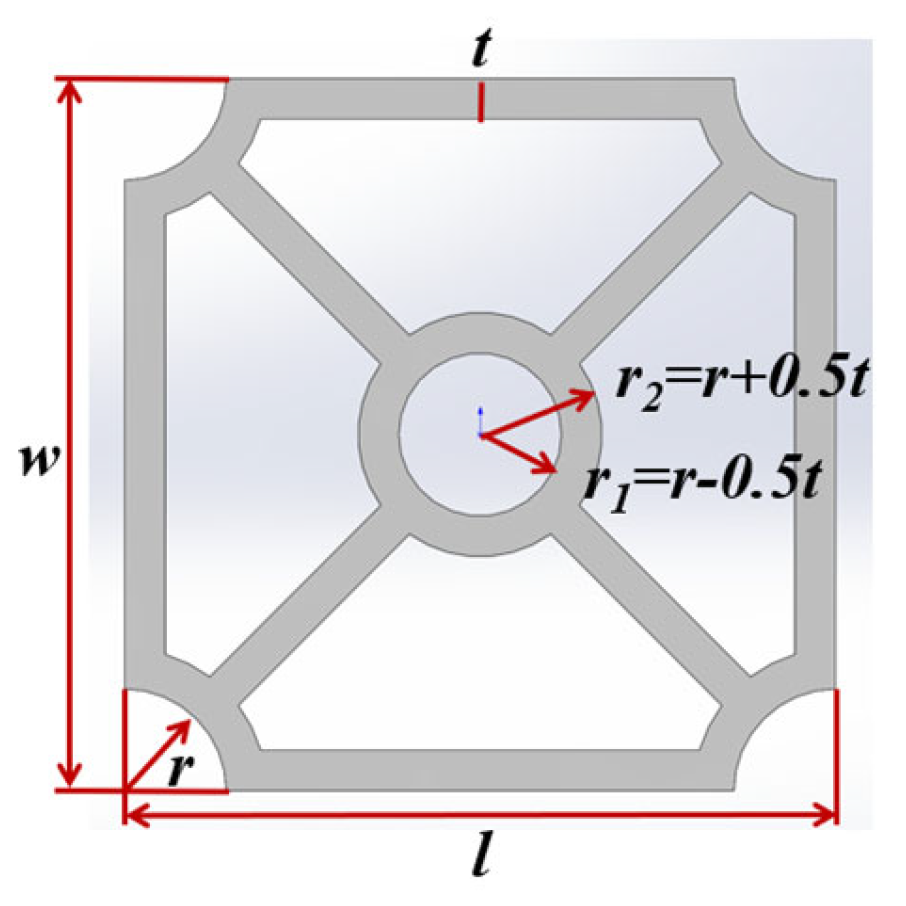
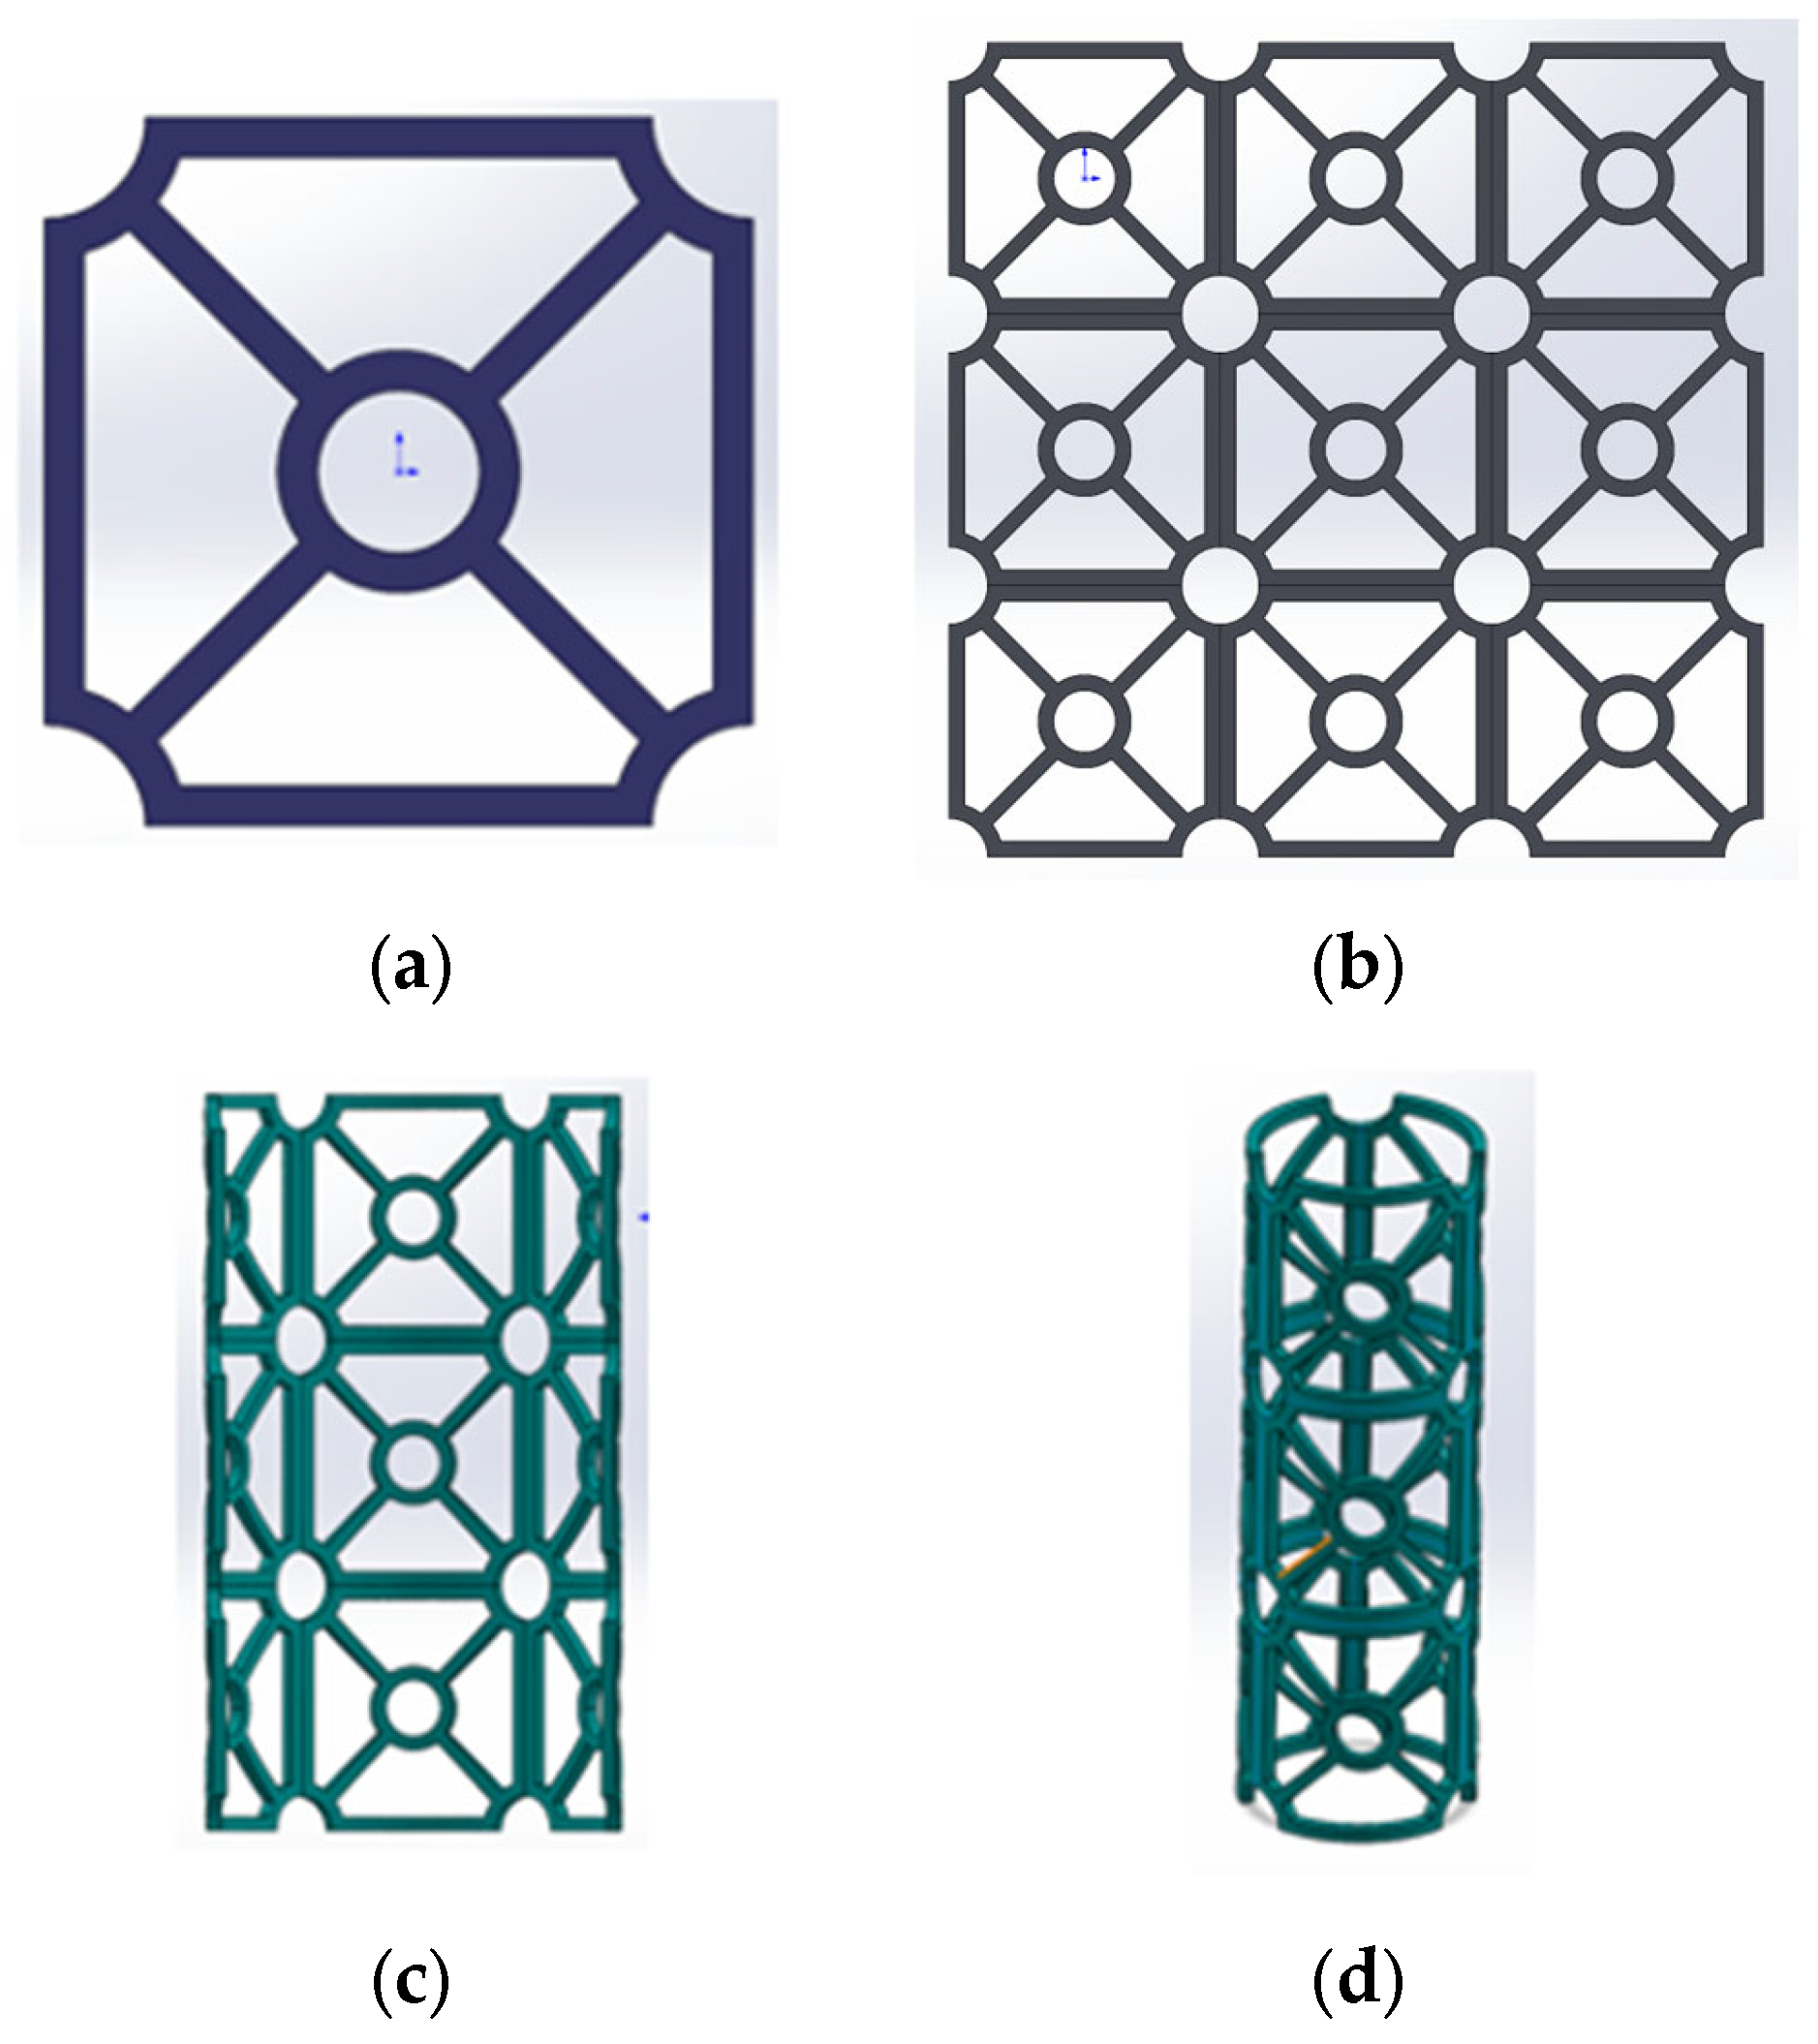
2.1. Structural Design
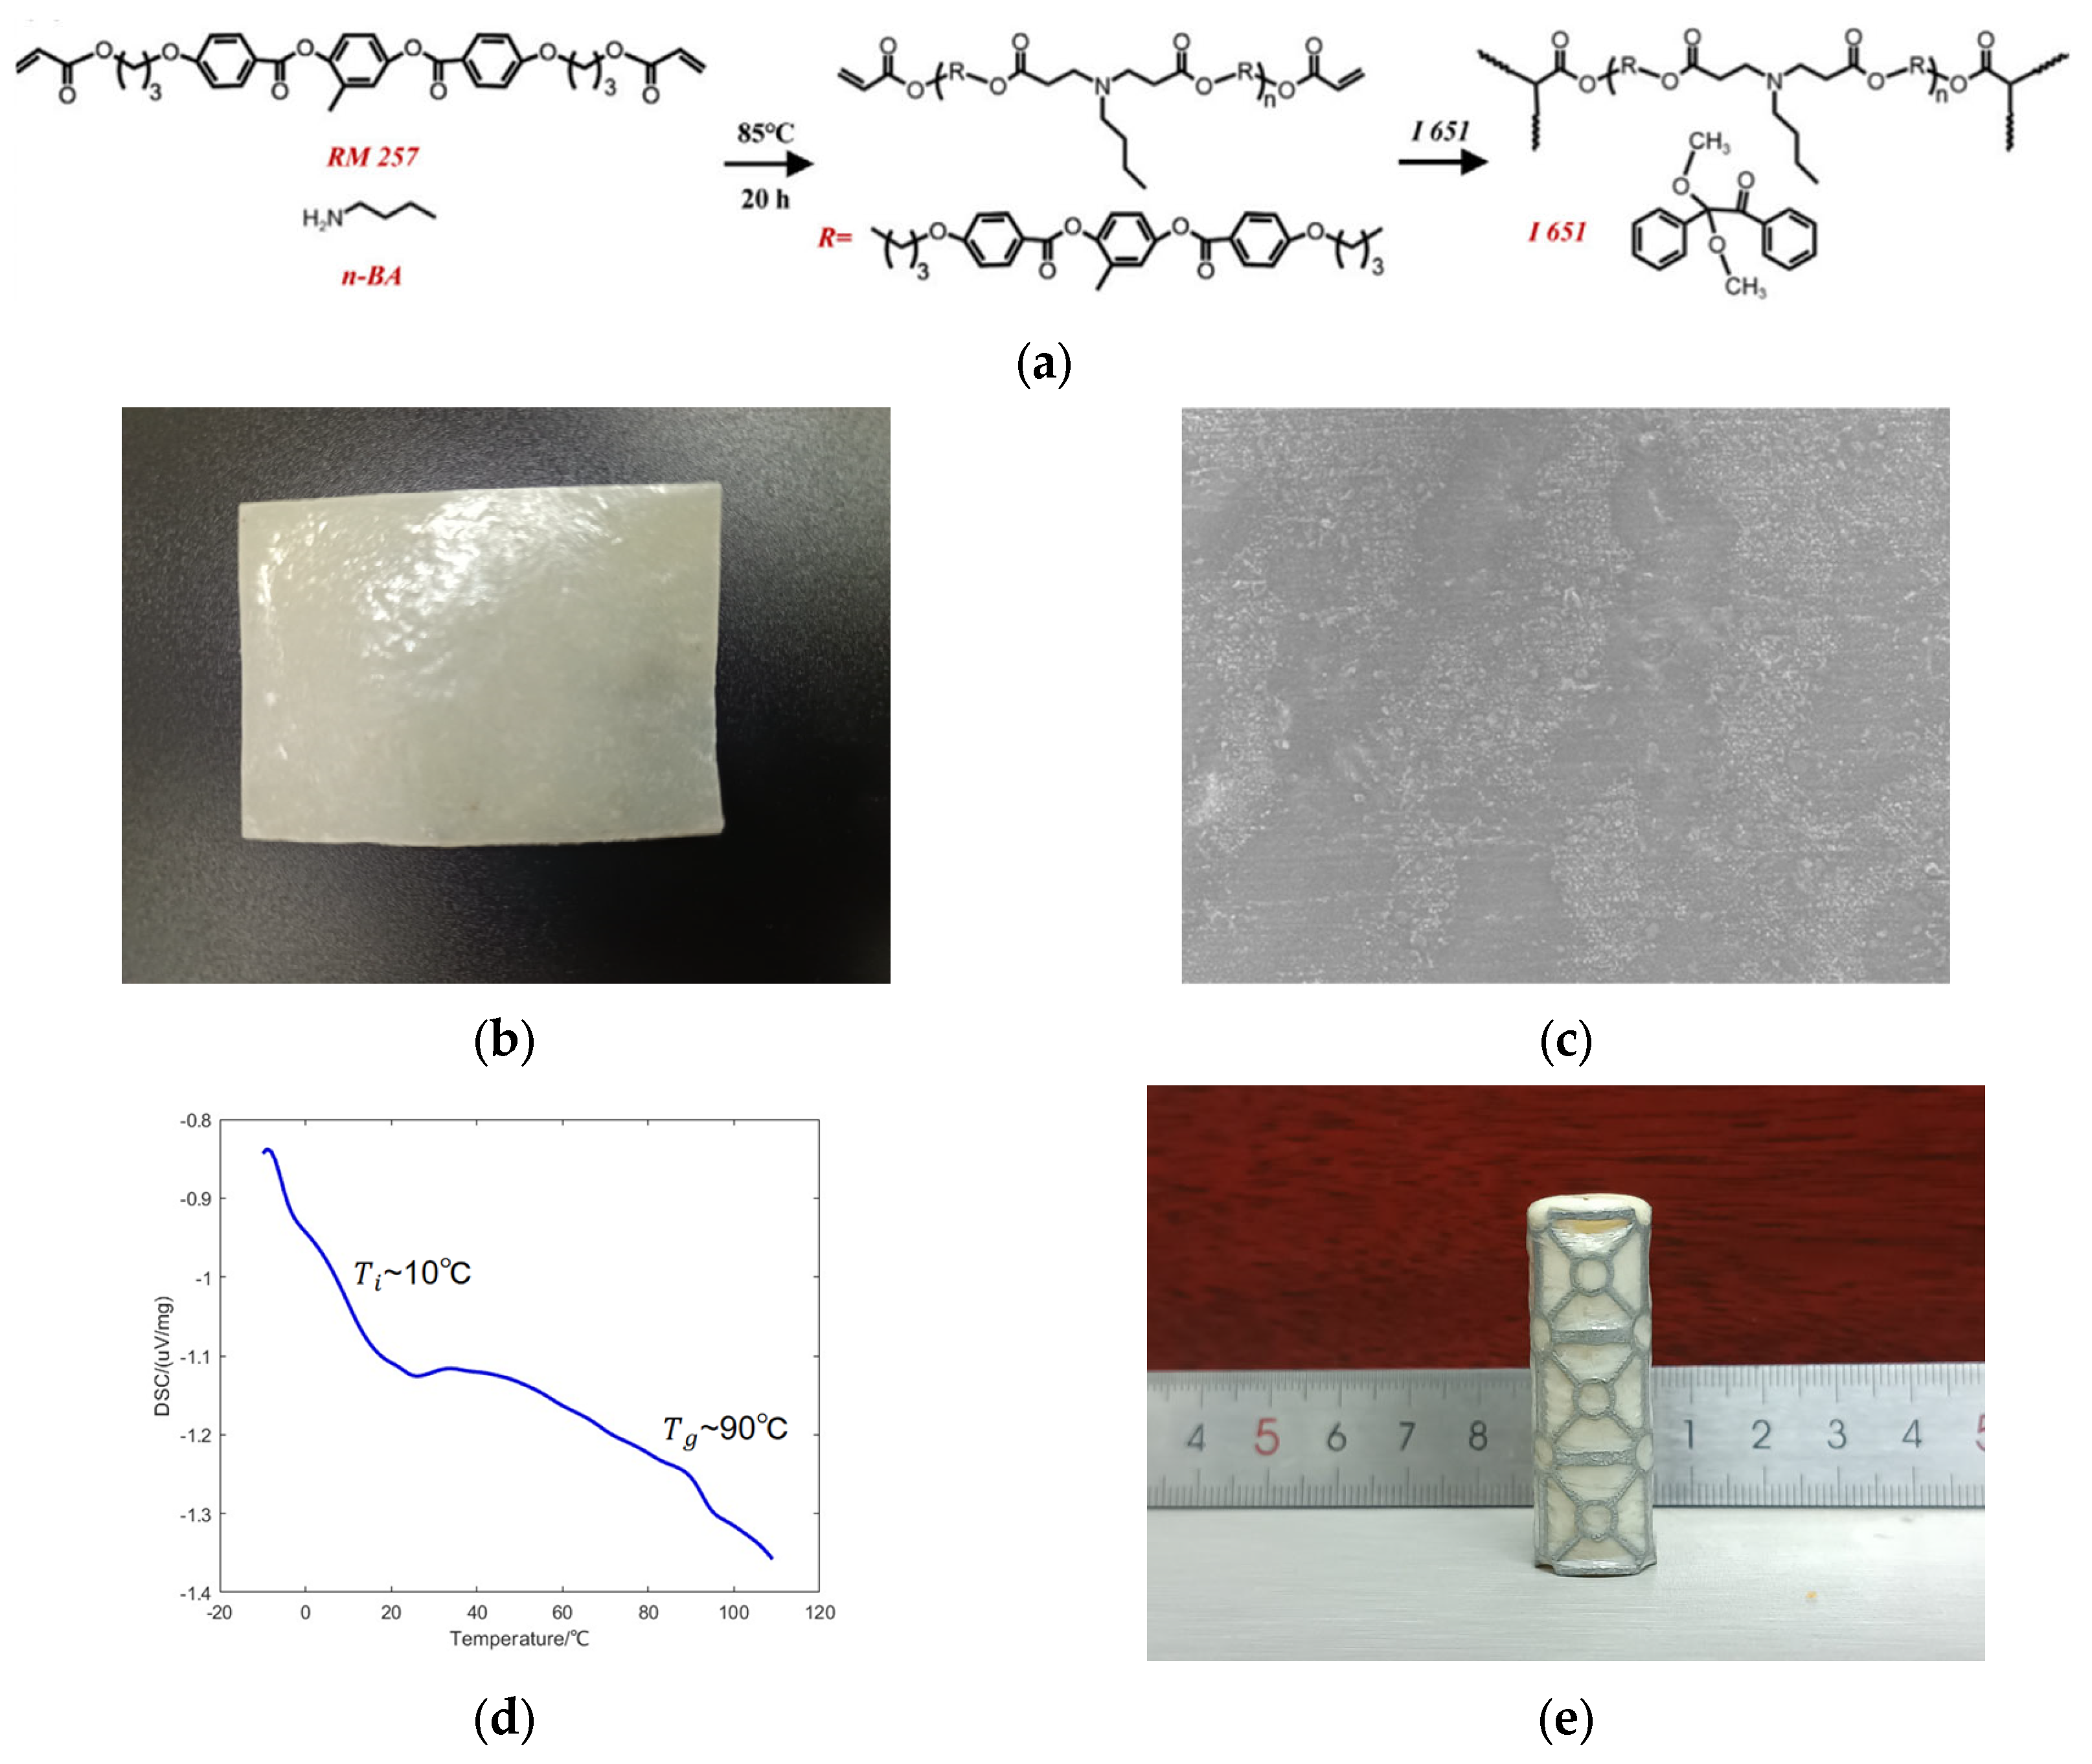
In order to enhance the energy-absorbing capacities of MPTs, a novel composite structure was proposed. This composite structure was named MPT–LCE, as it consists of MPTs and LCEs.
The unit cell of the MPTs is displayed in Figure 1. The geometric shape of the unit cell was defined by four independent variables: l represents the length of the unit cell, w represents the width of the unit cell, r represents the circular radius of the four corners of the unit cell, and t represents the thickness of the unit cell. Moreover, r 1 and r 2 represent the inner and outer radii of the circular arc at the center of the unit cell, respectively. They are both dependent variables and can be obtained through r and t. The parameter values of the unit cell are as follows: l = 14 mm, w = 14 mm, r = 2 mm, t = 0.8 mm, r 1 = 1.6 mm, and r 2 = 2.4 mm.
The deformation modes and mechanical properties of MPTs are related to their relative density. The relative density expression of the MPTs is shown in Equation (1):
ρ r = ρ s ρ b = m V ρ b = S s S b
In the equation, ρ r is the relative density of the MPTs, ρ s is the actual density of the structure, ρ b is the density of the base material, m is the total mass of the MPTs, V is the total volume of the MPTs, S s is the area of the MPTs, and S b is the area of the unit cell base material.
S s = π t 2 + 4 r t 20 t r 12 t 2 4 t r 2 t 2 + 4 2 + 1 t l
S b = l w
The relative density of the MPTs can be obtained from these equations:
ρ r = π t 2 + 4 r t 20 t r 12 t 2 4 t r 2 t 2 + 4 2 + 1 t l l w
The entire design process of the MPT is shown in Figure 2. On the basis of the unit cell (Figure 2a), configuring the unit cell array as 3 × 3, the planar structure of the MPT is obtained (Figure 2b). The length and width of the planar structure are both 42 mm. Then, the planar structure of the MPT is bent at an angle of 180 degrees (Figure 2c). The MPT ultimately forms (Figure 2d). Table 2 presents the geometric parameters of the MPT.

2.2. Fabrications

The fabrication of MPT–LCEs can be divided into three procedures. Firstly, due to the relatively complex structure of the MPTs, it is difficult to fabricate using traditional machining techniques. Therefore, metal 3D printing technology was selected for fabrication. The MPTs were fabricated using an industrial-grade metal 3D printing system, iSLM280 (3D printer, ZRapid Tech, Suzhou, China), based on selective laser melting (SLM) technology, as shown in Figure 3a. Use SOLIDWORKS (SOLIDWORKS 2022, Dassault Systemes, Concord, MA, USA) for drawing, generate the STL file format, and import it into slicing software for slicing processing, and then the printing system starts printing layer-by-layer. During the manufacturing process, the printing system uses a high-power laser to selectively melt and fuse each layer of metal powder and then repeats the SLM process by lowering the platform to lay new metal powder, as shown in Figure 3b. To ensure the strength and accuracy of the MPTs, the base material of AlSi10Mg was selected and used to fabricate the MPT samples according to the geometric parameters shown in Table 2. The physical properties of AlSi10Mg powder are presented in Table 3. After fabrication, it is necessary to perform powder cleaning, annealing, removal of supporting materials, and polishing of the samples. The sample fabricated using SLM technology is shown in Figure 3c.
Moreover, the chemical synthesis process of LCEs is carried out as displayed in Figure 4a. Specifically, a 1:1:1 molar ratio of 1,4-Bis-[4-(3-acryloyloxypropyloxy) benzoyloxy]-2-methylbenzene (RM257, liquid crystal monomer) and n-butylamine (n-BA, chain extender), 0.2 wt% butylated hydroxytoluene, and 2 wt% 2,2-bimethoxy-2-phenylacetophenone (I651) are added into a round-bottomed flask [18]. The mixtures are then heated under stirring at 85 °C for 20 h to obtain liquid crystalline oligomer (LCO). Then, 1 g of the obtained LCO is dissolved in 2.5 mL of tetrahydrofuran with the assistance of ultrasound dispersion. In this way, we obtain an unpolymerized liquid crystal elastomer. 1,4-Bis-[4-(3-acryloyloxypropyloxy) benzoyloxy]-2-methylben-zene (RM 257) was purchased from Sdynano Fine Chemicals in Shijiazhuang, China. 2,2-bimethoxy-2-phenylacetophenone (I651) and n-butylamine (n-BA) were obtained from Aladdin in Shanghai, China. The synthesized liquid crystal elastomers were cut into appropriate sizes for subsequent testing (Figure 4b). The SEM image (Hitachi S-3000N, 200× magnification, Hitachi, Tokyo, Japan) of the LCE sample is shown in Figure 4c, which indicates that the surface of the LCEs is flat, defect-free, and has no directional orientation. Figure 4d shows the differential scanning calorimetry (DSC 404 F3 Pegasus, differential scanning calorimeter, NETZSCH, Selb, Germany) data of the LCEs, with a temperature range of −10 °C to 110 °C and a heating rate of 5 °C/min. As shown in the figure, the glass transition temperature T g is 10 °C and the isotropic transition temperature T i is 90 °C.
Finally, the unpolymerized liquid crystal elastomer was poured into the polycarbonate mold, followed by being exposed to UV light at room temperature for photopolymerization. The MPTs were pre-placed into the polycarbonate mold. After photopolymerization, the obtained MPT–LCEs (Figure 4e) were dried in a vacuum oven at 80 °C for 5 days.

2.3. Mechanical Properties of AlSi10Mg

2.3.1. Quasi-Static Tensile Testing

There are certain differences in the mechanical properties between meta 3D printing materials and those manufactured by traditional processes. Before conducting experimental tests and numerical simulations on the 3D-printed MPTs, it is necessary to perform mechanical property characterization tests on its base material, which is crucial to comprehensively understand the mechanical properties of the base material so as to accurately predict its performance during the structural design and analyze the experimental results.
As an initial step, the quasi-static mechanical properties of 3D-printed AlSi10Mg samples were investigated. Three standard AlSi10Mg tensile testing samples were fabricated using SLM technology, as shown in Figure 5. The quasi-static uniaxial tensile tests on the three standard tensile testing samples were conducted at a speed of 3 mm/min until the standard tensile samples fractured. As shown in Figure 5, the stress–strain curves of the three AlSi10Mg standard tensile testing samples were obtained. It can be seen in Figure 5 that the changing trends of the stress–strain curves are quite similar. To increase the accuracy of the mechanical properties of the base material, the quasi-static tensile tests were conducted three times. The average of three sets of stress–strain data and the calculated material parameters are presented in Table 4.

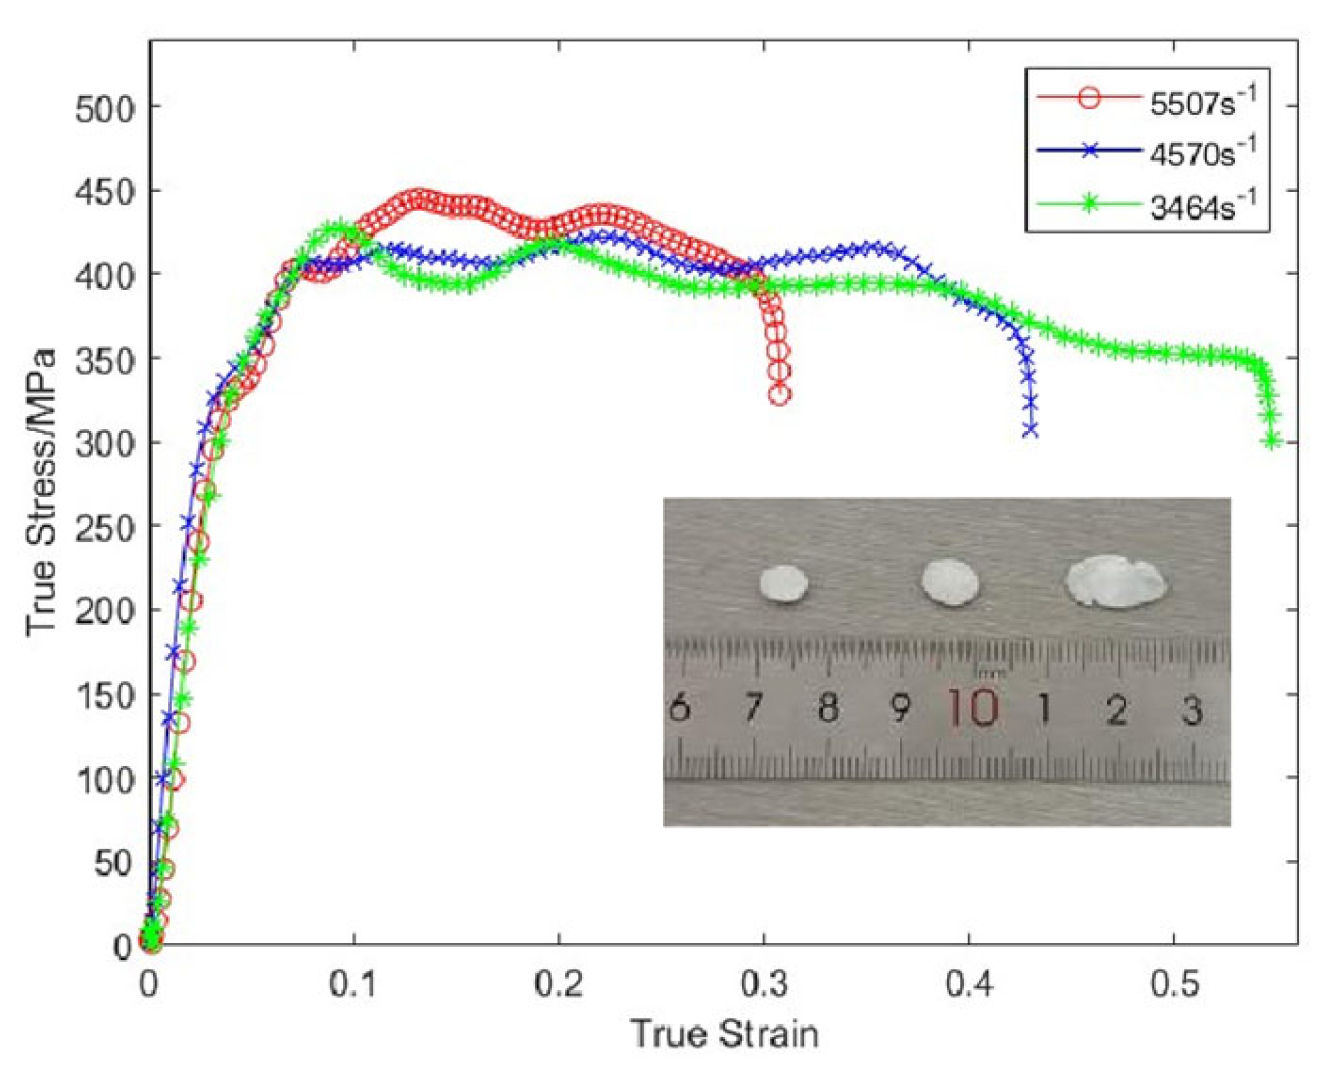
2.3.2. Split Hopkinson Pressure Bar (SHPB) Testing

To investigate the dynamic mechanical properties of the base material, SHPB tests were conducted. Standard AlSi10Mg compressive test samples were fabricated using SLM technology, as shown in Figure 6. The size of the sample is φ 4.00 m m × 4.00 m m . SHPB tests were conducted at three different strain rates: 3464 s 1 , 4570 s 1 , and 5507 s 1 . The stress–strain curves of the AlSi10Mg samples under 3464 s 1 , 4570 s 1 , and 5507 s 1 strain rates obtained from the SHPB tests are as shown in Figure 6. From Figure 6, it can be seen that when the strain reaches 0.07, AlSi10Mg enters the yield stage. When the strain rate is 3464 s 1 , 4570 s 1 , and 5507 s 1 , the yield stresses of AlSi10Mg samples are, respectively, about 400 MPa, 410 MPa, and 430 MPa. Compared with the yield stress at strain rate 3464 s 1 , the yield stresses at strain rates 4570 s 1 and 5507 s 1 increased by 2.5% and 7.5%, respectively. Therefore, the yield stress of the AlSi10Mg samples conducted using SLM technology slowly goes up with the slow increase of the strain rate. The plateau stress of the AlSi10Mg samples under dynamic crush is about 400 MPa, indicating that the dynamic mechanical properties of the base material AlSi10Mg have a certain strain rate sensitivity.

2.3.3. Evaluation Indicators of Energy-Absorbing Performance

The most important thing in quantitatively evaluating the energy-absorbing capacities of a structure is to employ appropriate energy-absorbing evaluation indicators. The energy-absorbing performance of the samples can be evaluated using specific energy absorption (SEA), mean crushing force (MCF), crushing force efficiency (CFE), and peak crushing force (PCF). Specific energy absorption (SEA) is widely used to describe the energy absorbed per unit mass. The SEA of the MPT–LCE is calculated using the following equation:
S E A = E A m = 0 s F x d x m
where EA represents the total energy absorbed, defined as the area enclosed by the force-displacement curve when the MPT–LCE reaches densification. m represents the mass of the structure. s represents the densification displacement of the MPT–LCE. F represents the compression force.
The mean crushing force (MCF) represents the average force level during the plateau phase of the MPT–LCE, which is known as plateau force and serves as an important indicator of evaluating the energy absorption performance of the MPT–LCE. The calculation is as follows:
M C F = 1 s 0 s F x d x = E A s
Crushing force efficiency (CFE) is the key indicator to characterize the force uniformity of the MPT–LCE in the force–displacement curve, which is calculated as follows:
C F E = M C F P C F × 100 %
where peak crushing force (PCF) is directly related to the energy-absorbing performance. Before elastic buckling occurs, most energy-absorbing structures will generate a large initial peak force. The initial peak force is usually the peak crushing force (PCF) during the effective crushing process, which can be directly obtained from the force–displacement curve.

3. Experiments, Finite Element Model, and Verification

In order to analyze the influence of geometric parameters on the energy-absorbing performance of the MPT–LCE, a nonlinear finite element solver LS-DYNA was used for numerical simulations. The finite element results were verified and analyzed through drop hammer tests.

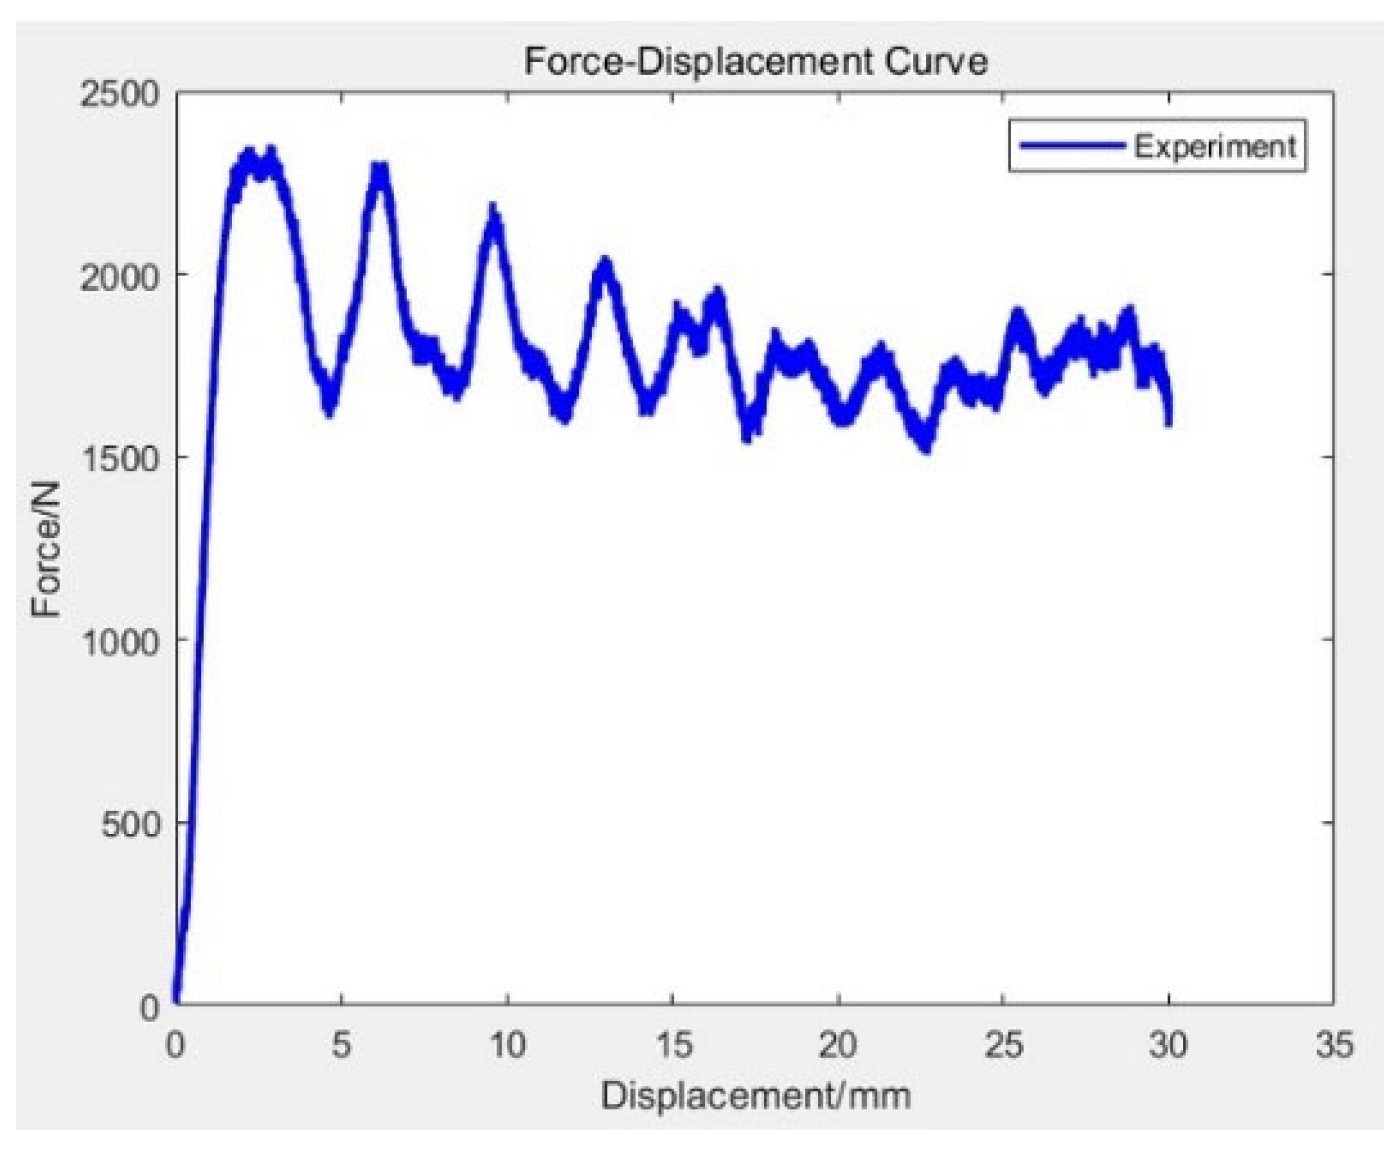
3.1. Drop Hammer Testing

In order to investigate the energy-absorbing performance of MPT–LCEs under impact loading, drop hammer tests were conducted on MPT–LCE samples using an INSTRON CEAST 9350 test system, as shown in Figure 7. The three samples were placed on a fixed lower steel platform and crushed by a drop hammer. The force and displacement data of the whole crushing process were automatically recorded by the testing machine. The deformation process of the samples was captured using a high-speed camera. Drop hammer tests were carried out on the MPT–LCE with a mass of 11.95 kg and velocity of 3 m/s using the INSTRON CEAST 9350 test system to analyze its deformation modes and energy-absorbing performance. The mass of the MPT–LCE sample was 8 g.

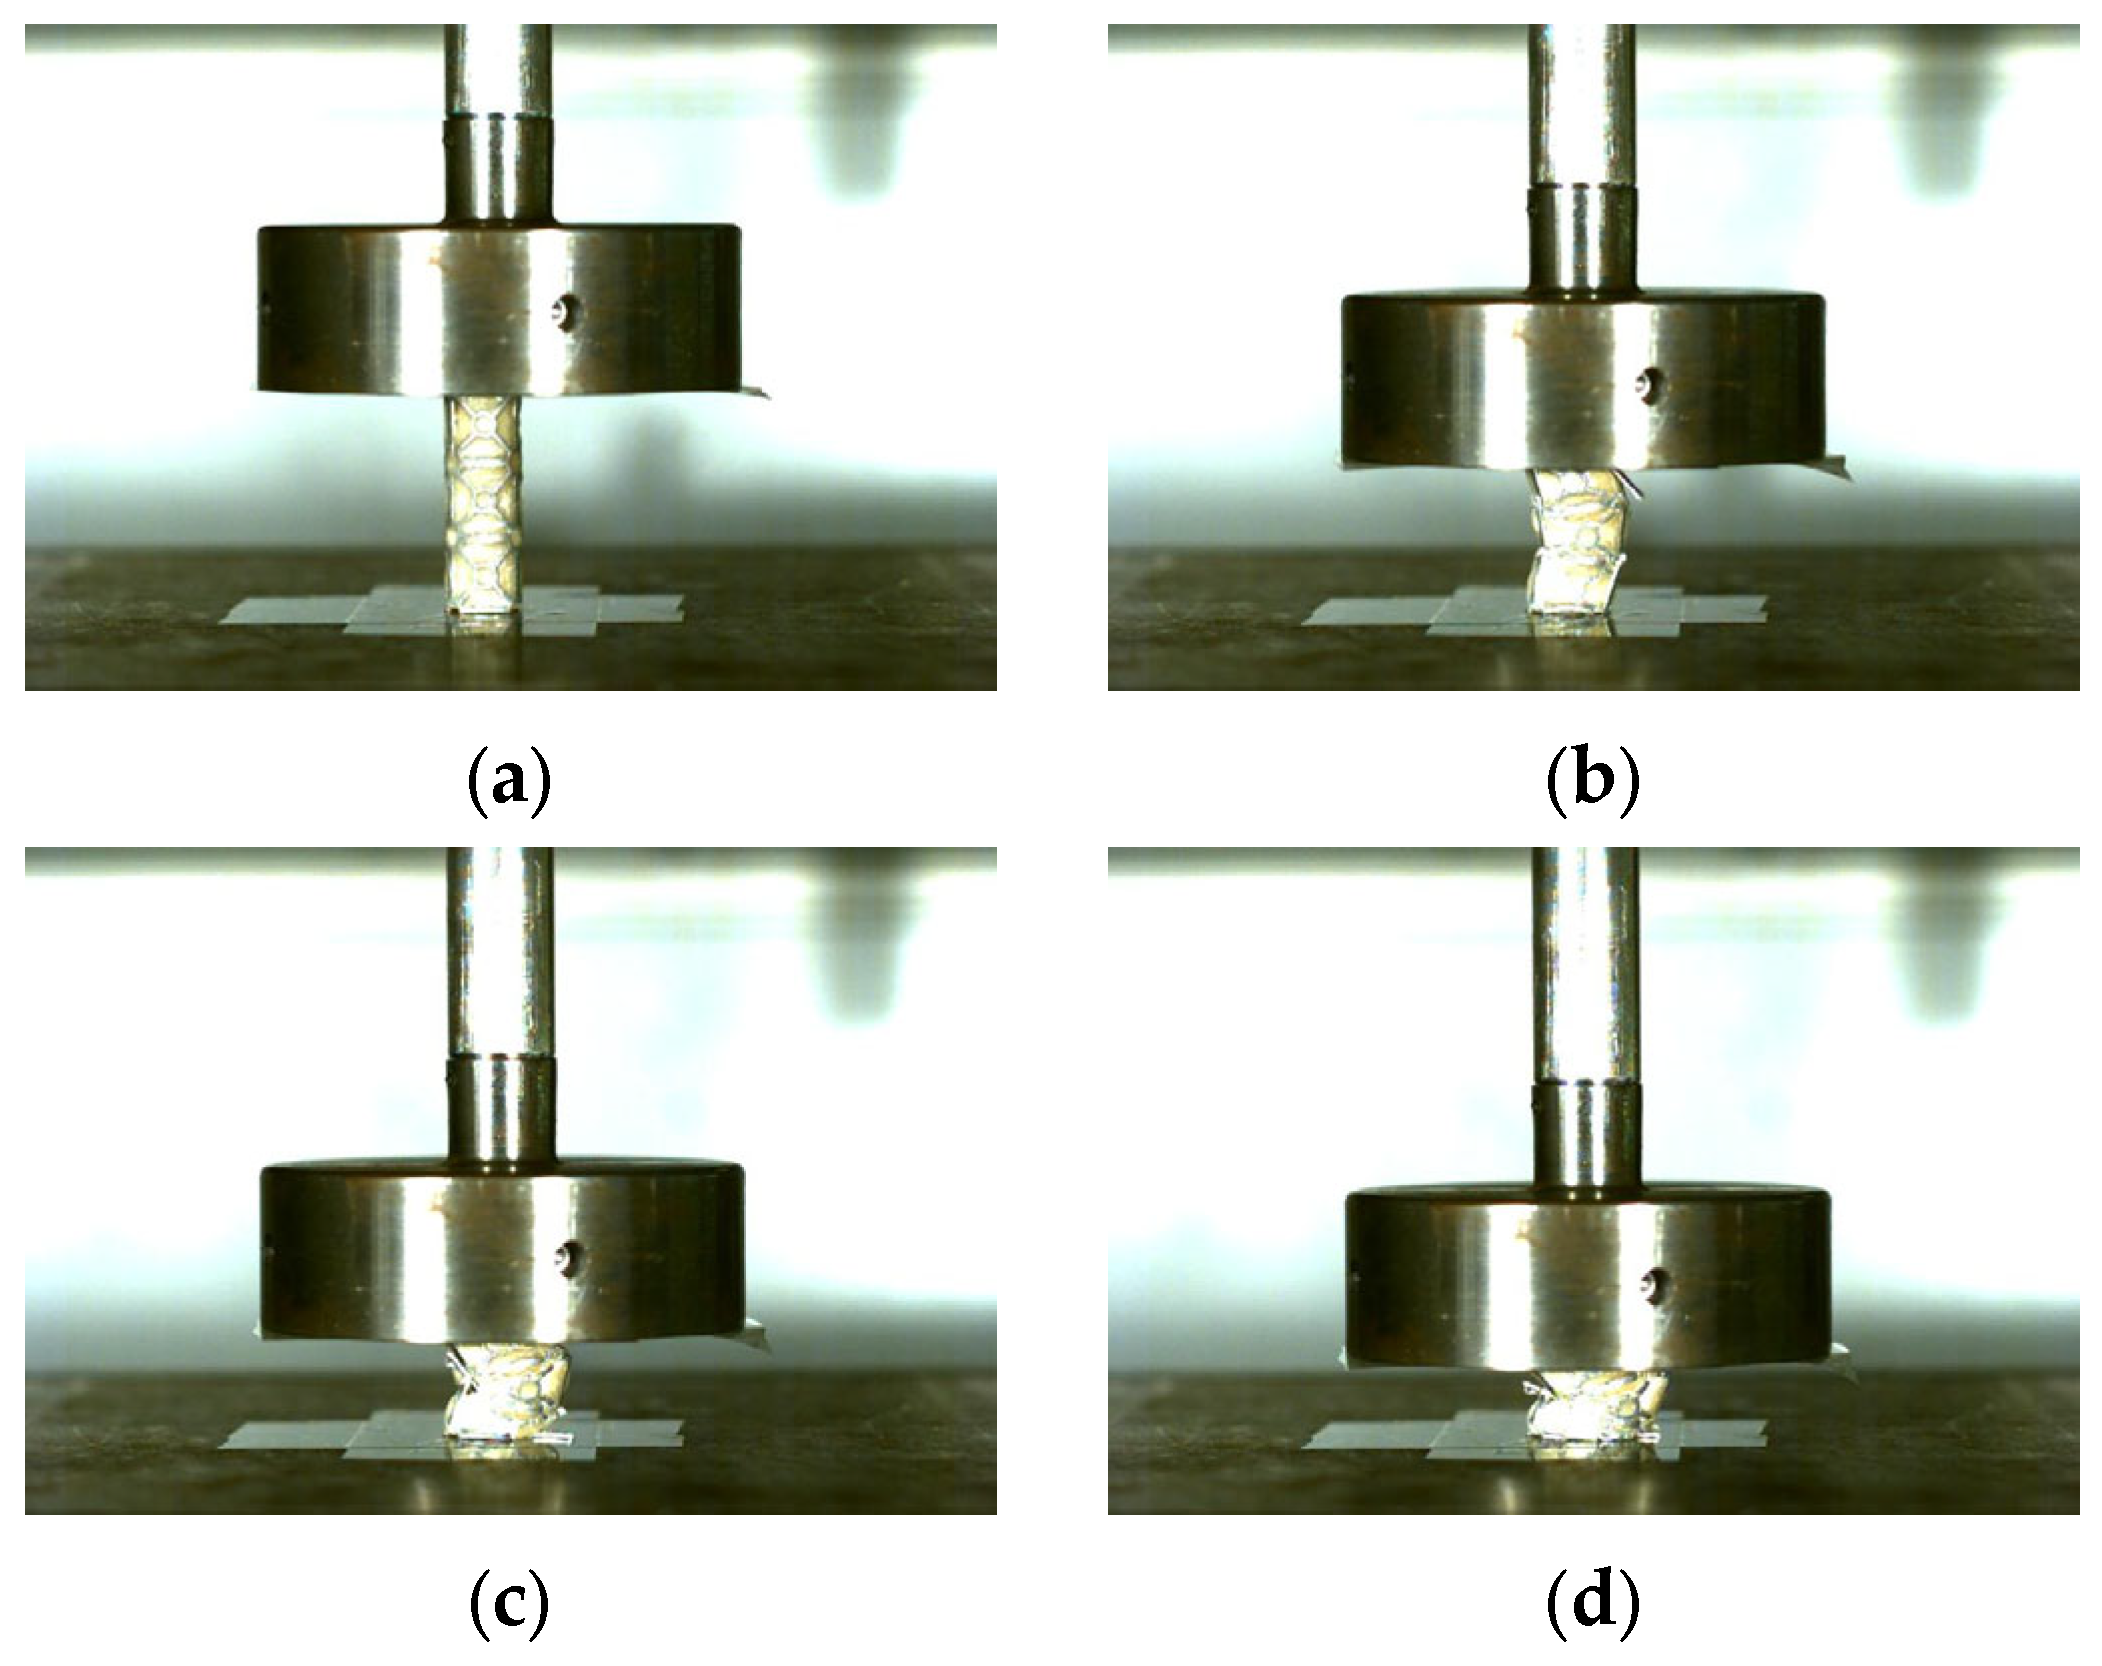
3.1.1. Deformation Modes

The deformation modes of the MPT–LCE under dynamic crush with a mass of 11.95 kg and velocity of 3 m/s are shown in Figure 8. Figure 8a presents the initial state of the MPT–LCE under dynamic crush with the drop hammer. As demonstrated in Figure 8b, when the strain reaches 0.2, fractures initiate at the circular arcs where the unit cells of the MPTs are joined. Meanwhile, the rods connected to these arcs also break. This breakage of the rods leads to an uneven distribution of force on the MPTs by the LCEs, causing the entire structure to incline towards the fractured side.
When the strain reaches 0.5, as shown in Figure 8c, the first layer of the unit cells of MPTs experiences a 45° shear failure, slanting towards the lower right along the fracture of the circular arc. Thanks to the supporting role of the LCEs, the whole structure does not fail instantaneously and remains capable of continuously bearing loads and absorbing energy.
With the continuous downward crush of the drop hammer, MPTs gradually fracture and lose their functionality. Nevertheless, due to the support provided by LCEs, the whole structure still maintains the ability to absorb energy.
When the strain reaches 0.7, as depicted in Figure 8d, the first and second layers of the unit cells of MPTs are completely fractured. Only a few unit cells in the third layer and LCEs can persist in resisting deformation and absorbing energy, at which point the structure enters the densification stage.

3.1.2. Energy Absorption

Figure 9 shows the force–displacement curve of the MPT–LCE under dynamic crushing with a mass of 11.95 kg and velocity of 3 m/s. As can be seen from Figure 9, under dynamic crushing, the deformation process of the MPT–LCE roughly goes through two stages, namely the linear elastic stage (before the peak crush force) and the plateau stage (from the peak crush force to a compression displacement of 30 mm). The force–displacement curve of the MPT–LCE shows a multi-peak oscillation pattern. This phenomenon can be attributed to the fact that the MPT–LCE undergoes layer-by-layer crushing under the dynamic impact. The first three peak loads correspond one-to-one to the three layers of unit cells in the MPT–LCE. The subsequent oscillations may be caused by the vibration of the lower platform during the downward crush of the drop hammer.
According to the calculation method of the energy-absorbing performance evaluation indicators in Section 2.3.3 and combined with the experimental data obtained from the drop hammer test, the energy-absorbing performance evaluation indicators of the MPT–LCE under dynamic crush are calculated as shown in Table 5.

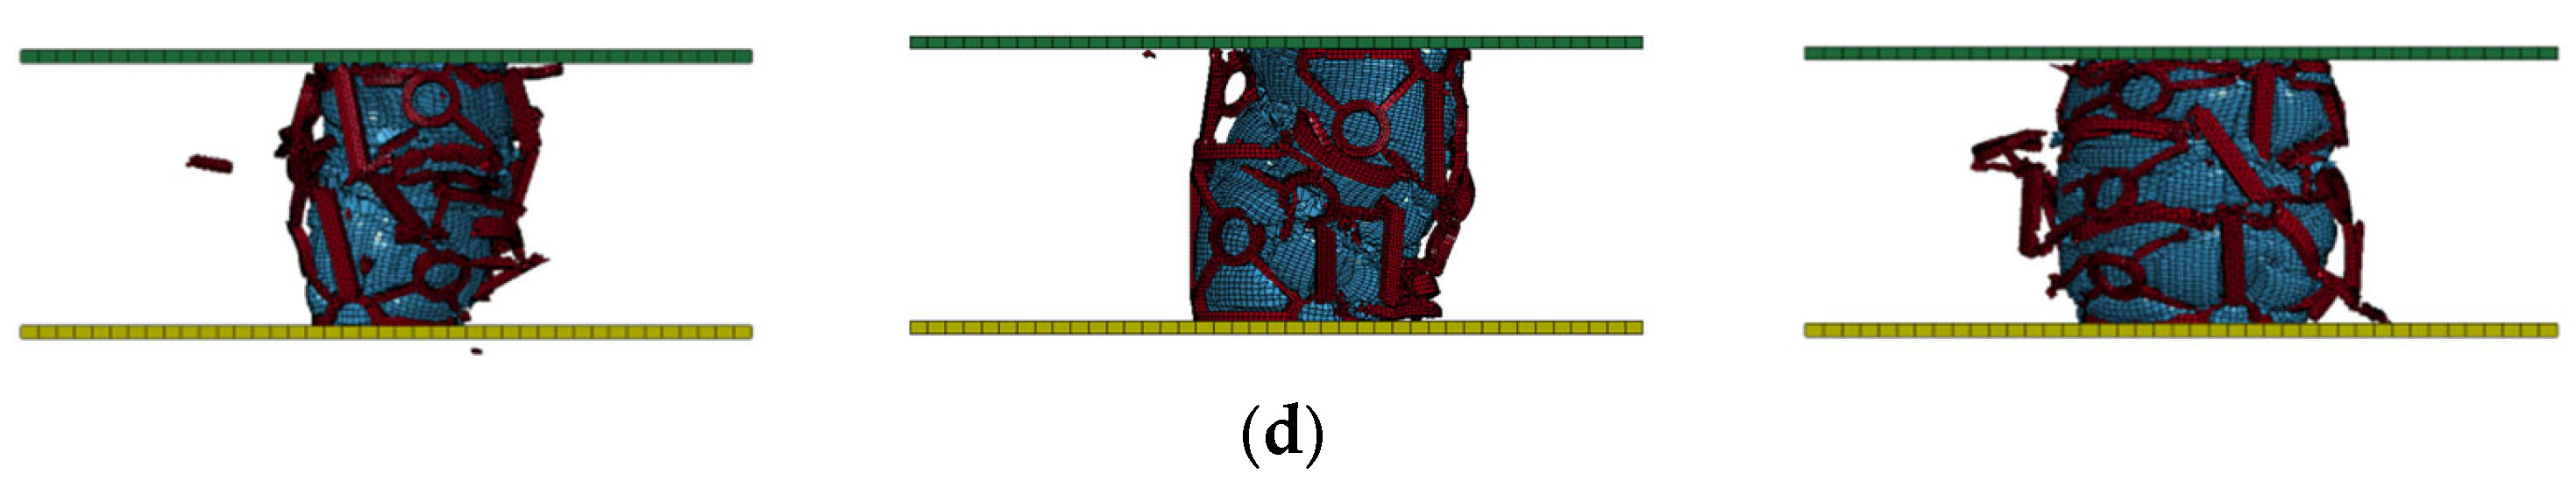
3.2. Establishment of Finite Element Model

The geometric modeling used in the finite element analysis was in line with the parameters of the corresponding experimental samples. The finite element model of the MPT–LCE, which was acquired by modeling the structure with solid elements, is presented in Figure 10. With the consideration of achieving a balance between simulation efficiency and accuracy, a mesh size of 1 mm was utilized in our finite element model.
The MPT–LCE consists of four parts, including the upper rigid platen, MPTs, LCEs, and the lower rigid platen. *MAT_RIGID was used for the upper rigid platen and the lower rigid platen. The lower platen was stationary and the upper platen moved downward with a velocity equal to 3 m/s along the negative Z-axis direction. *MAT_PIECEWISE_LINEAR_PLASTICITY was applied in the constitutive model of MPTs and LCEs. The true stress–strain curve (Figure 6) obtained from SHPB tests and the material parameters in Table 4 were introduced into the constitutive model of the MPTs. With reference to the literature [18], the true stress–strain data were also introduced in the constitutive model of the LCEs. The material parameters of the model *MAT_RIGID and *MAT_PIECEWISE_LINEAR_PLASTICITY are shown in Table 6 and Table 7, respectively.
*CONTACT_AUTOMATIC_SURFACE_TO_SURFACE was used to describe the contact between the MPT–LCE and the upper platen, as well as the contact between the MPTs and LCEs. The static and dynamic friction coefficients between the contacts were set to 0.3 and 0.2, respectively. To prevent slippage of the samples and be close to the drop hammer experiments, the lower surface of the MPT–LCE was stuck to the lower platen using the *CONTACT_TIED_NODES_TO_SURFACE.

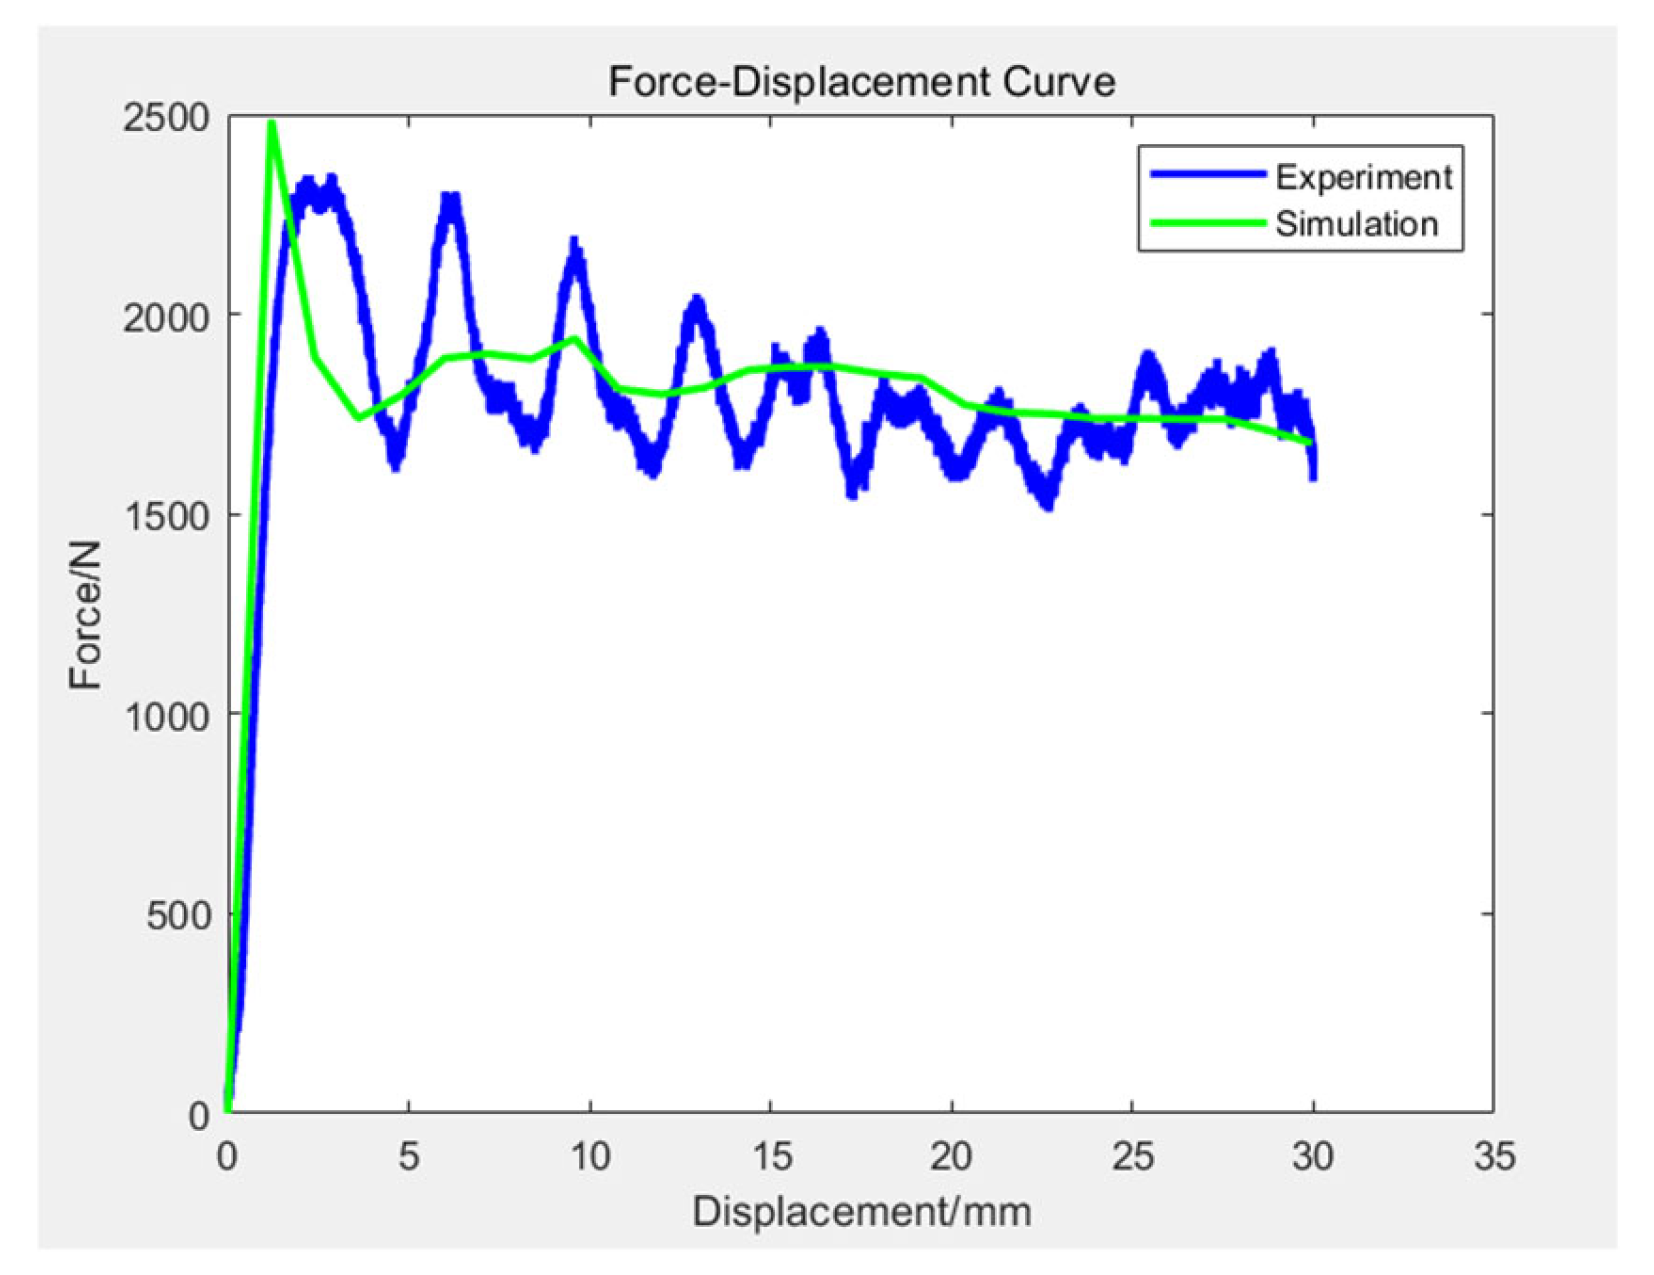
3.3. Model Verification

In order to validate the accuracy of the finite element model, a comparison between the finite element model and the experimental results was conducted based on deformation modes and the force–displacement curve. Figure 11 shows the deformation modes of the MPT–LCE samples under dynamic crush, which were obtained from drop hammer experiments and finite element simulations. Figure 12 compares the energy-absorbing performance evaluation indicators of the MPT–LCE samples from drop hammer experimental results and finite element calculations.
It can be obviously seen from Figure 11 that the deformation processes of the experiment and the simulation are similar. Not only in the experiment but also in the simulation do the fractures first appear at the circular arcs where the unit cells of the MPTs are joined. The rods that are linked to the circular arcs also experience fracture. Owing to the uneven distribution of the force, the MPT–LCE deviates towards the side where fractures have occurred. With a continuous dynamic crush, the MPT–LCE experiences progressive layer-by-layer failure. Thanks to the support provided by the LCEs, the whole structure still maintains the ability to absorb energy, up to the point when the MPT–LCE reaches the densification stage. There is a good consistency between the simulated deformation process and the experimental deformation process of the MPT–LCE.
Figure 12 shows the force–displacement curves of the experiment and the simulation under dynamic crush. As can be seen from the figure, the trends of the force–displacement curves of the experiment and the simulation are the same, both showing an oscillatory pattern. It is attributable to the fact that the MPT–LCE undergoes layer-by-layer crushing under the dynamic impact. The curve obtained from the simulation oscillates more gently compared with the curve obtained from the experiment. This is due to the fact that the simulation represents a relatively ideal situation, and the vibration of the lower plane that occurs in the experiment does not appear.
According to the calculation method of the energy-absorbing performance evaluation indicators in Section 2.3.3, the energy-absorbing performance evaluation indicators of the MPT–LCE under dynamic crush are calculated as shown in Table 8.
By comprehensively analyzing Figure 12 and Table 8, it can be seen that the simulation results of the MPT–LCE under dynamic crush are in good agreement with the experimental results. In the comparison between the simulation results and the experimental results, the error of PCF is 5.6%, the error of SEA is 0.7%, the error of MCF is 1.0%, and the error of CFE is 5.3%. Overall, the error is within an acceptable range.
In conclusion, the finite element model can effectively demonstrate the deformation processes and evaluation indicators of the experiment, which proves the effectiveness and reliability of the finite element model. Therefore, it can be used for the subsequent simulation analysis of the MPT–LCE.

4. Results and Discussions

By means of the validated finite element model, the effects of three geometric parameters, namely the length of the unit cell l, the width of the unit cell w, and the circular radius of the four corners of the unit cell r, on the MPT–LCE under dynamic crush were analyzed from the perspectives of deformation modes and energy-absorbing performance evaluation indicators.
The simulations were divided into three groups. Each group of MPT–LCEs was generated by varying one geometric parameter of the unit cell, keeping the other two geometric parameters constant. Table 9 presents the geometric parameters of each MPT, where t = 0.8 mm for the fixed values.

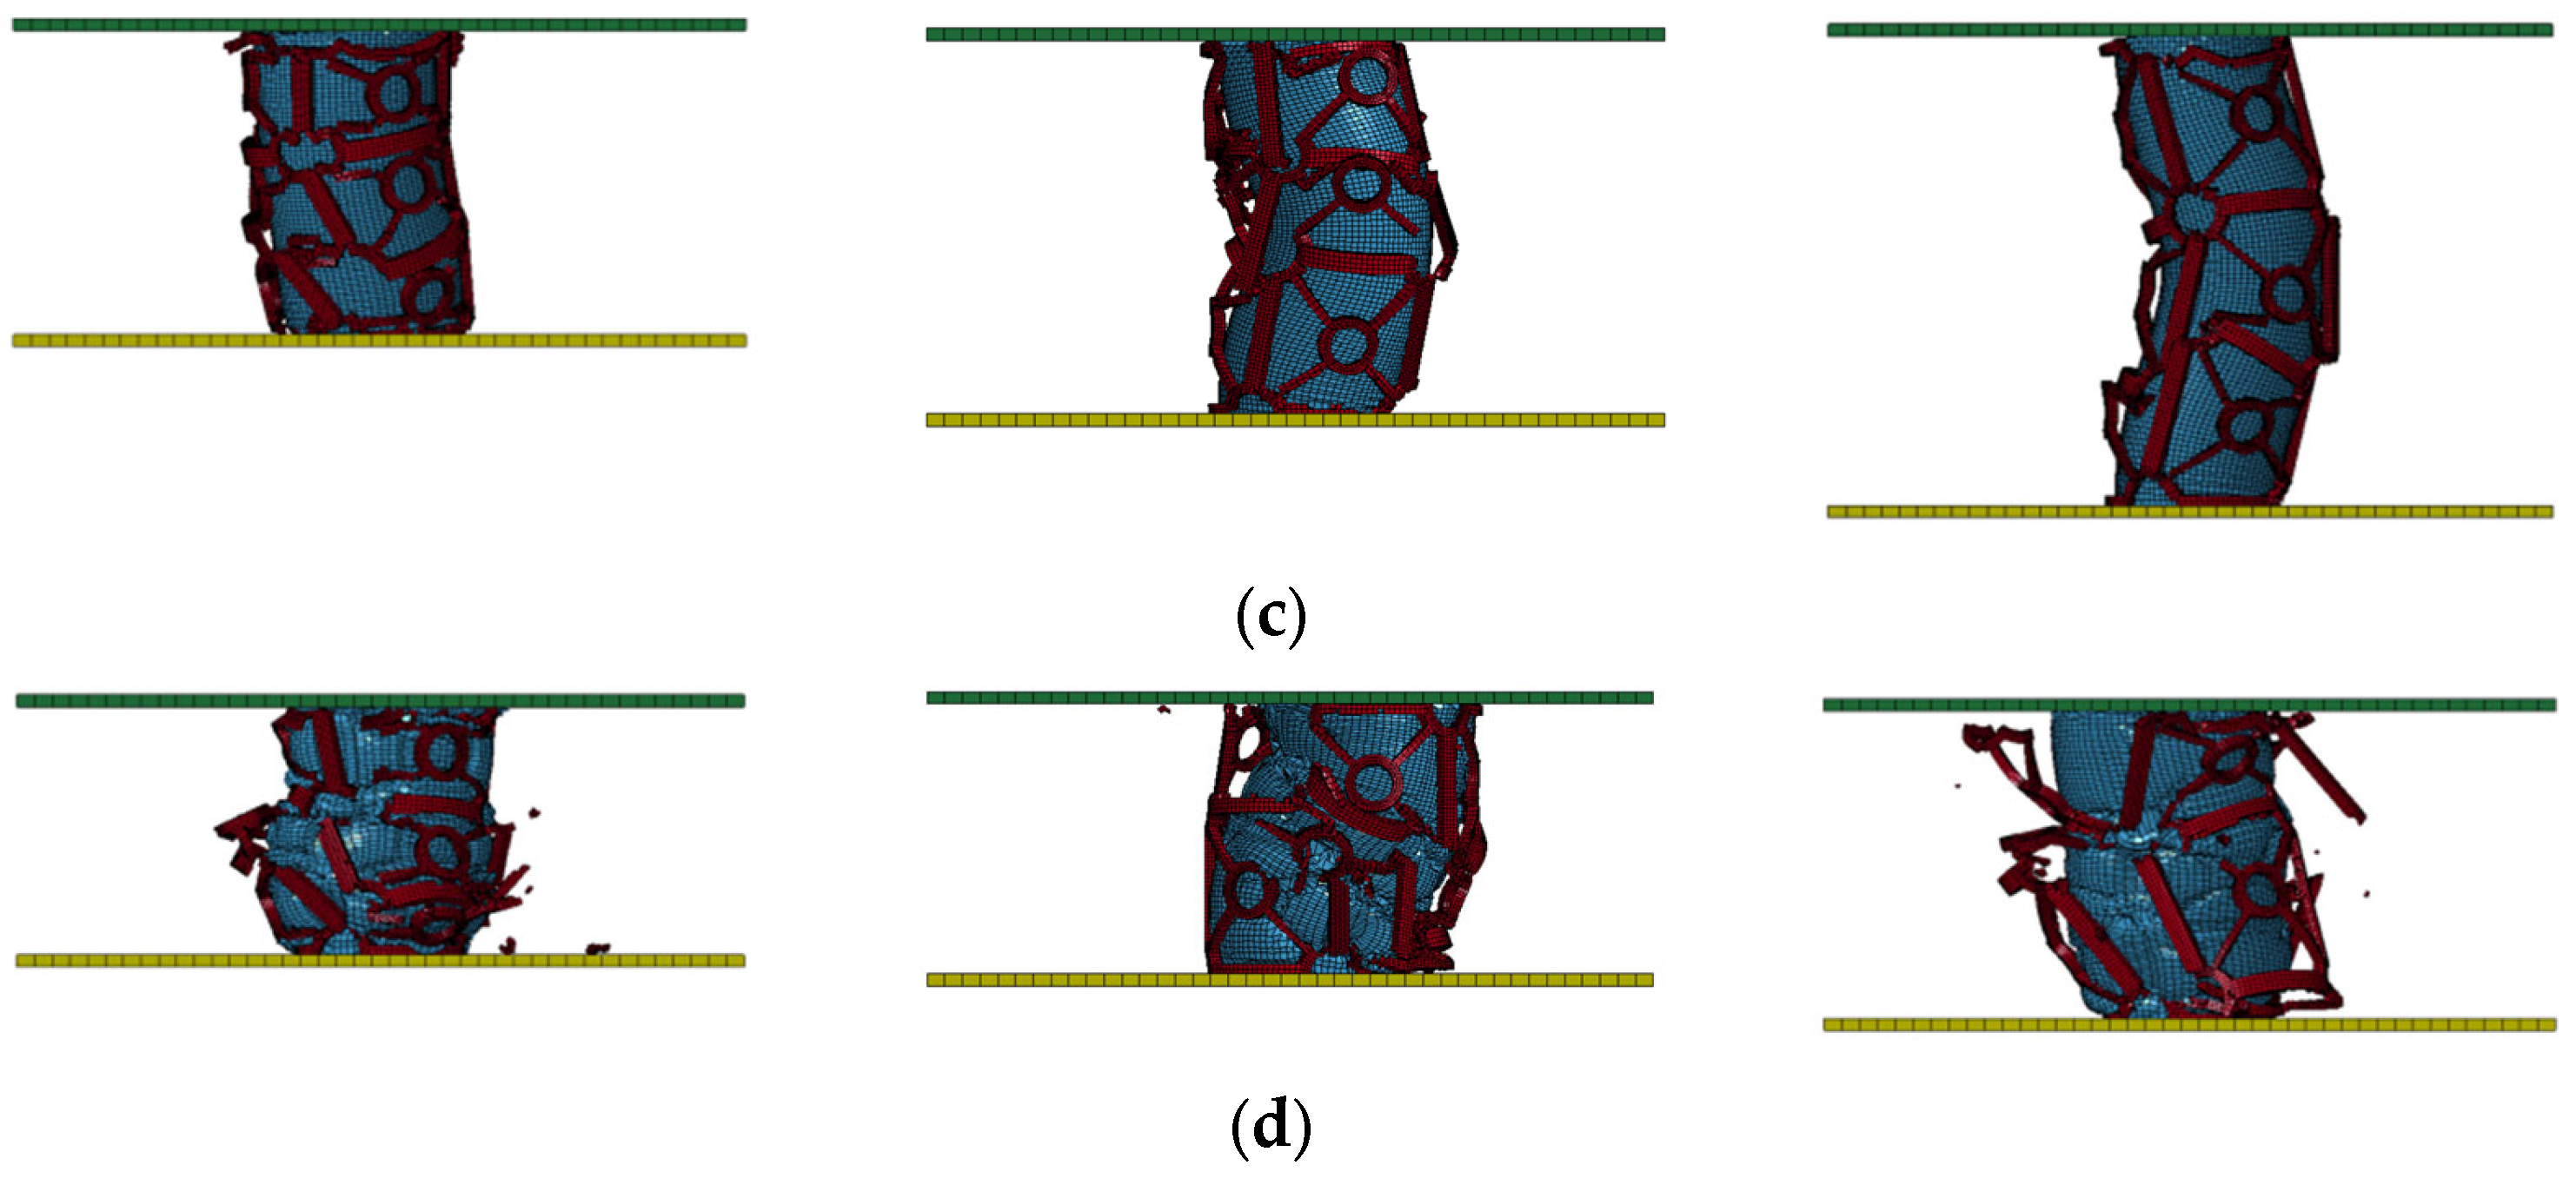
4.1. Deformation Modes

In order to investigate the influence of the unit cell length l on the deformation modes of the MPT–LCE under dynamic crush, a verified and reliable finite element model was used to simulate the deformation processes of the MPT–LCE with unit cell lengths of 12 mm, 14 mm, and 16 mm. The geometric parameters of the MPT–LCE are shown in Table 9, Group 1. Then, a comparative analysis was conducted on the differences in the deformation modes of the MPT–LCE with different unit cell lengths.
Figure 13 shows the deformation processes of the MPT–LCE with unit cell lengths of 12 mm, 14 mm, and 16 mm, respectively, under dynamic crush. As is shown in Figure 13, the fractures first appear at the circular arcs where the unit cells of the MPTs are joined. The rods that are linked to the circular arcs also experience fracture. Subsequently, due to the non-uniform distribution of the force, the MPT–LCE inclines towards the side where fractures have taken place. The distinction is that the MPT–LCEs with unit cell lengths of 12 mm and 16 mm incline to the left, while the MPT–LCE with a unit cell length of 14 mm inclines to the right. Moreover, as the crush continues, the inclination angles of the MPT–LCEs with unit cell lengths of 12 mm and 14 mm are far greater than that of the MPT–LCE with a unit cell length of 16 mm. An excessively large inclination angle leads to a reduction in the contact area between the MPTs and the LCEs. This is not only unfavorable for the stable deformation of the MPT–LCE but also reduces the energy absorbed by the MPT–LCE.
In conclusion, compared with the MPT–LCE with unit cell lengths of 12 mm and 14 mm, the MPT–LCE with a unit cell length of 16 mm only exhibits a slight twisting phenomenon, and its deformation mode is more stable.
In order to investigate the influence of the unit cell width w on the deformation modes of the MPT–LCE under dynamic crush, a verified and reliable finite element model was used to simulate the deformation processes of the MPT–LCEs with unit cell widths of 12 mm, 14 mm, and 16 mm. The geometric parameters of the MPT–LCE are shown in Table, 9 Group 2. Then, a comparative analysis was conducted on the differences in the deformation modes of the MPT–LCEs with different unit cell widths.
Figure 14 shows the deformation processes of MPT–LCEs with unit cell widths of 12 mm, 14 mm, and 16 mm, respectively, under dynamic crush. As shown in Figure 14, the fractures first appear at the circular arcs where the unit cells of the MPTs are joined. The rods that are linked to the circular arcs also experience fracture. Later, on account of the uneven force distribution, the MPT–LCE inclines towards the side where fractures have taken place. The difference is that MPT–LCEs with unit cell widths of 14 mm and 16 mm incline to the right, while the MPT–LCE with a unit cell width of 12 mm inclines to the left. As the crush continues, the inclination angles of MPT–LCEs with unit cell widths of 14 mm and 16 mm are far greater than that of the MPT–LCE with a unit cell width of 12 mm. An excessively large inclination angle leads to a reduction in the contact area between the MPTs and the LCEs. This not only has a negative impact on the stable deformation of the MPT–LCE but also reduces the energy absorbed by the MPT–LCE.
In conclusion, compared with MPT–LCEs with unit cell widths of 14 mm and 16 mm, the MPT–LCE with a unit cell width of 12 mm demonstrates more stable deformation modes, which is beneficial for energy absorption.
In order to investigate the influence of the unit cell radius r on the deformation modes of MPT–LCEs under dynamic crush, a verified and reliable finite element model was used to simulate the deformation processes of the MPT–LCEs with unit cell radii of 1.5 mm, 2 mm, and 2.5 mm. The geometric parameters of the MPT–LCEs are shown in Table 9, Group 3. Then, a comparative analysis was conducted on the differences in the deformation modes of the MPT–LCEs with different unit cell radii.
Figure 15 shows the deformation processes of the MPT–LCEs with unit cell radii of 1.5 mm, 2 mm, and 2.5 mm, respectively, under dynamic crush. As shown in Figure 15, the fractures first appear at the circular arcs where the unit cells of the MPTs are joined. The rods that are to the circular arcs also experience fracture. Then, as a result of the unevenly distributed force, the MPT–LCE inclines towards the side where fractures have taken place. The MPT–LCEs with unit cell radii of 1.5 mm, 2 mm, and 2.5 mm all incline to the right. Compared with the MPT–LCEs with unit cell radii of 1.5 mm and 2.5 mm, the MPT–LCE with a unit cell radius of 2 mm has the largest inclination angle and the most unstable deformation mode. It is unfavorable for energy absorption.
In conclusion, compared with the MPT–LCEs with unit cell radii of 1.5 mm and 2.5 mm, the MPT–LCE with a unit cell radius of 2 mm demonstrates more unstable deformation modes, which should be avoided as much as possible.

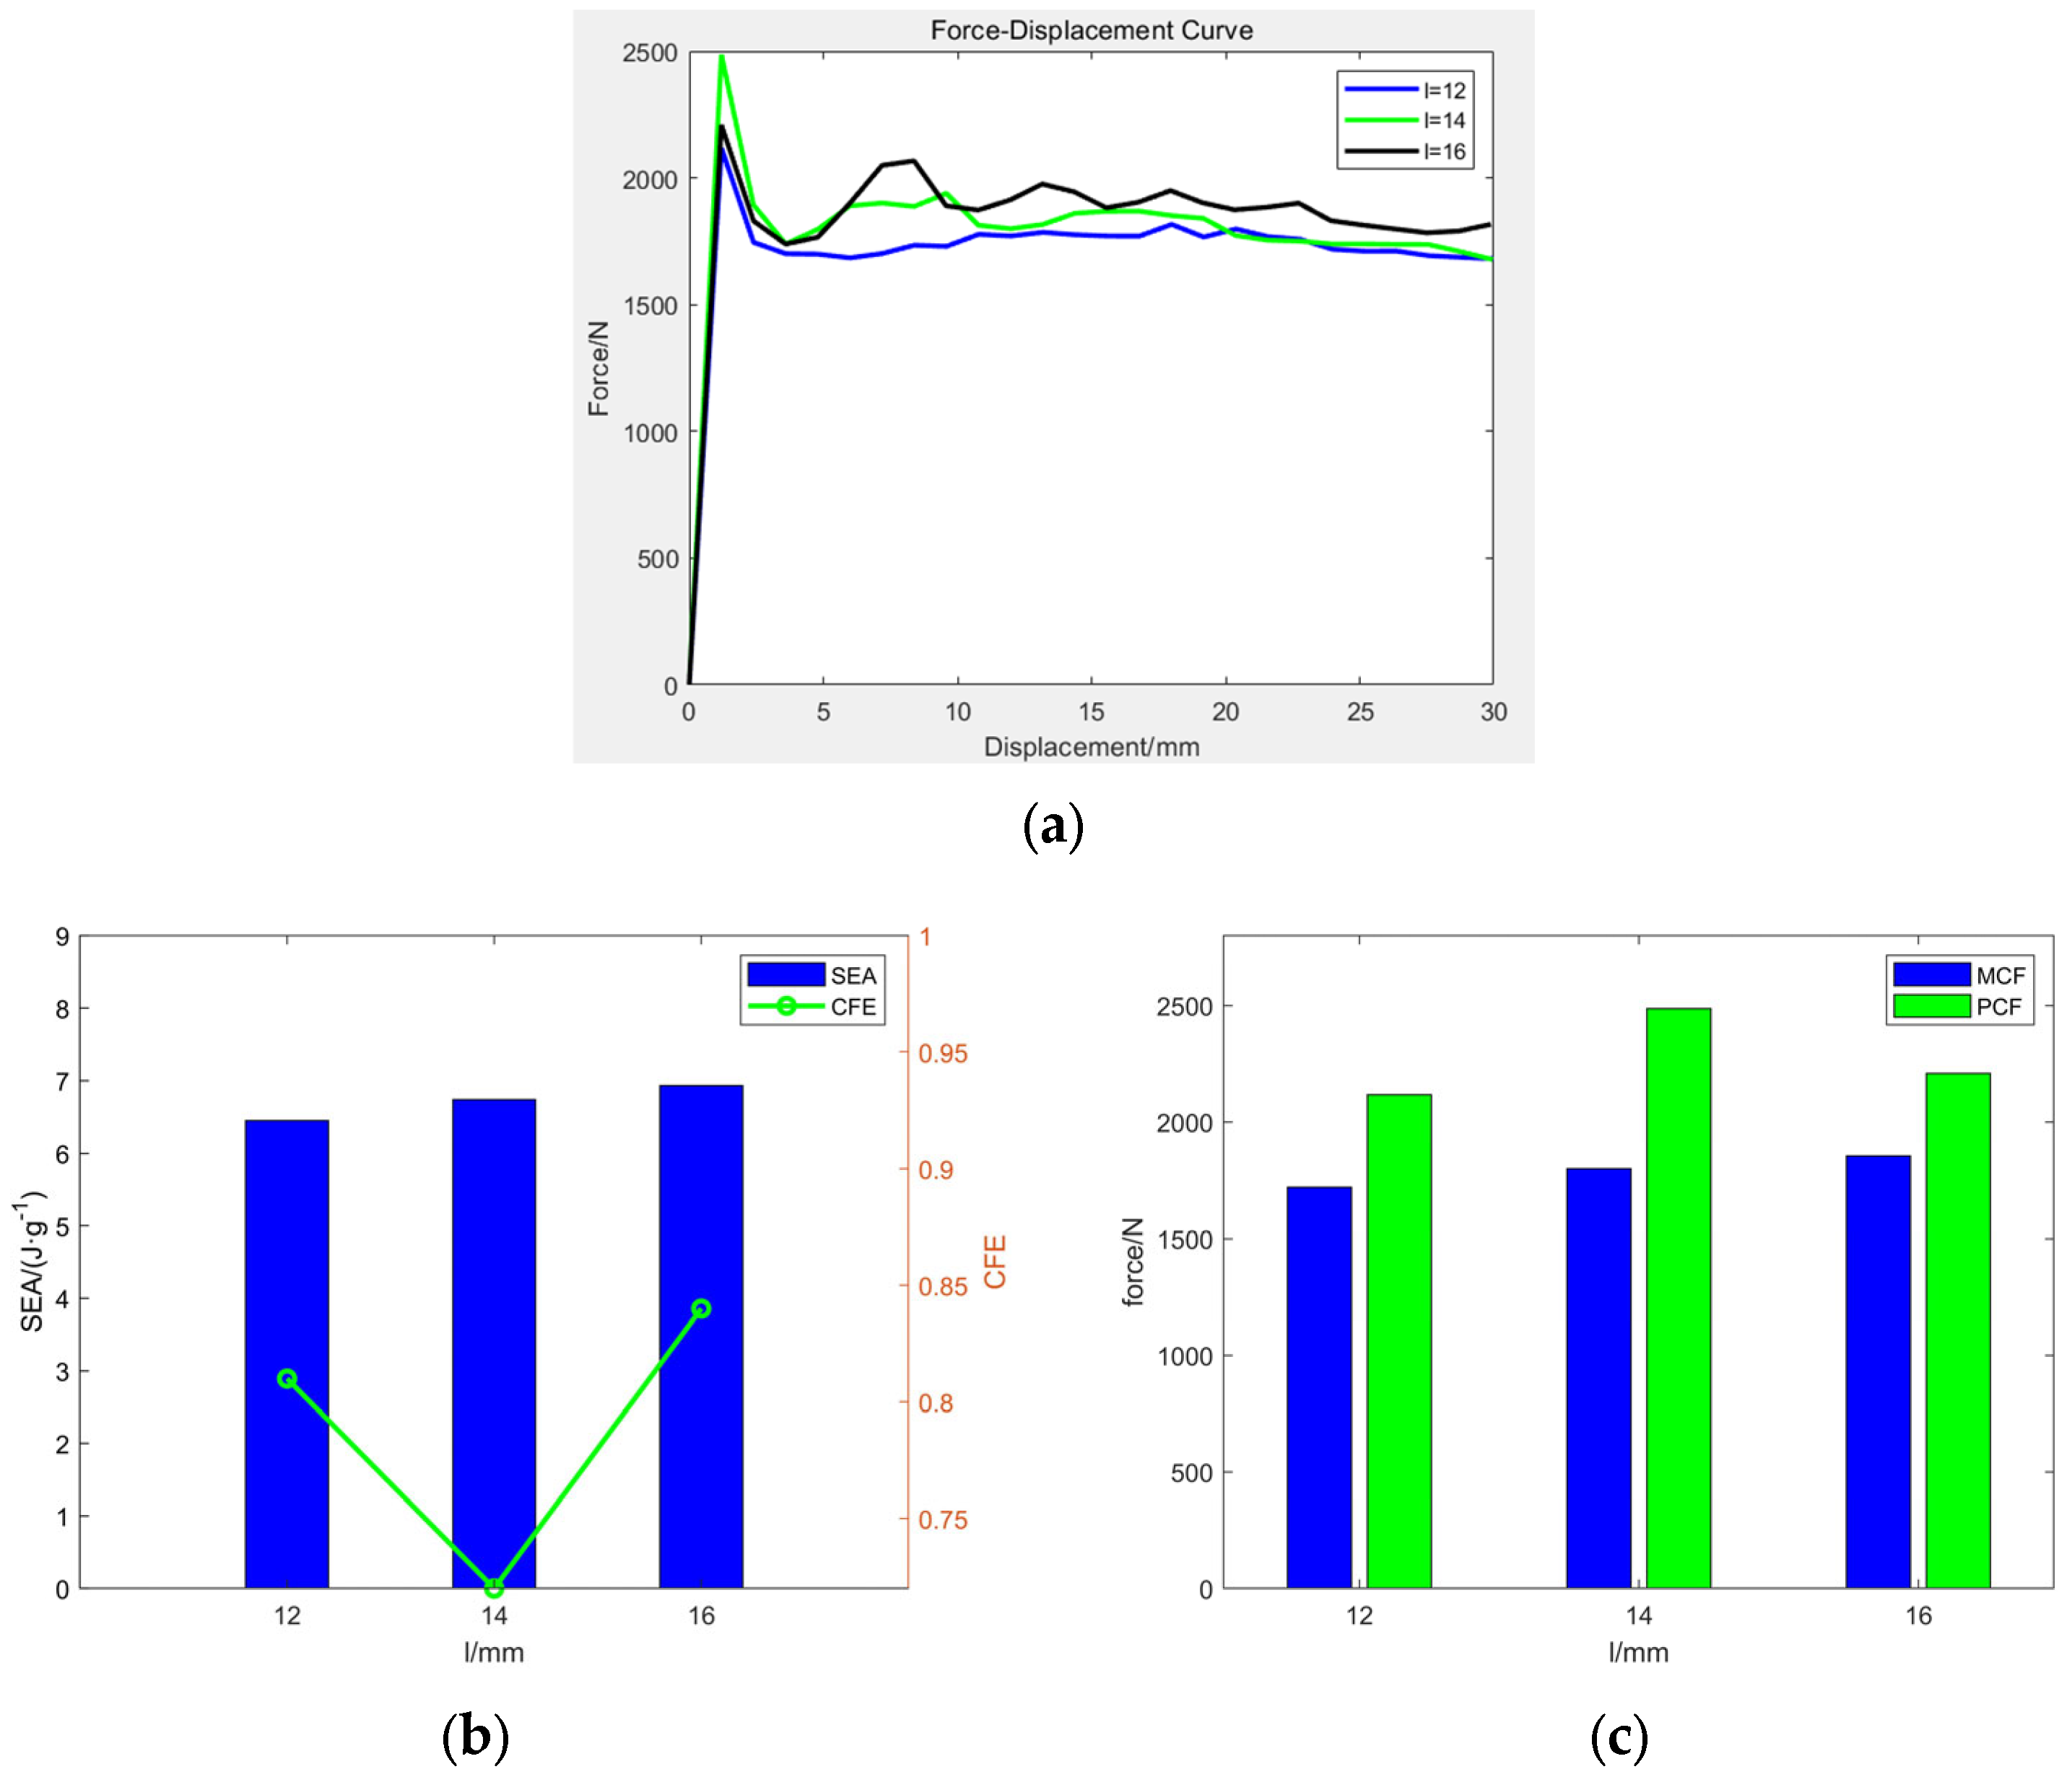
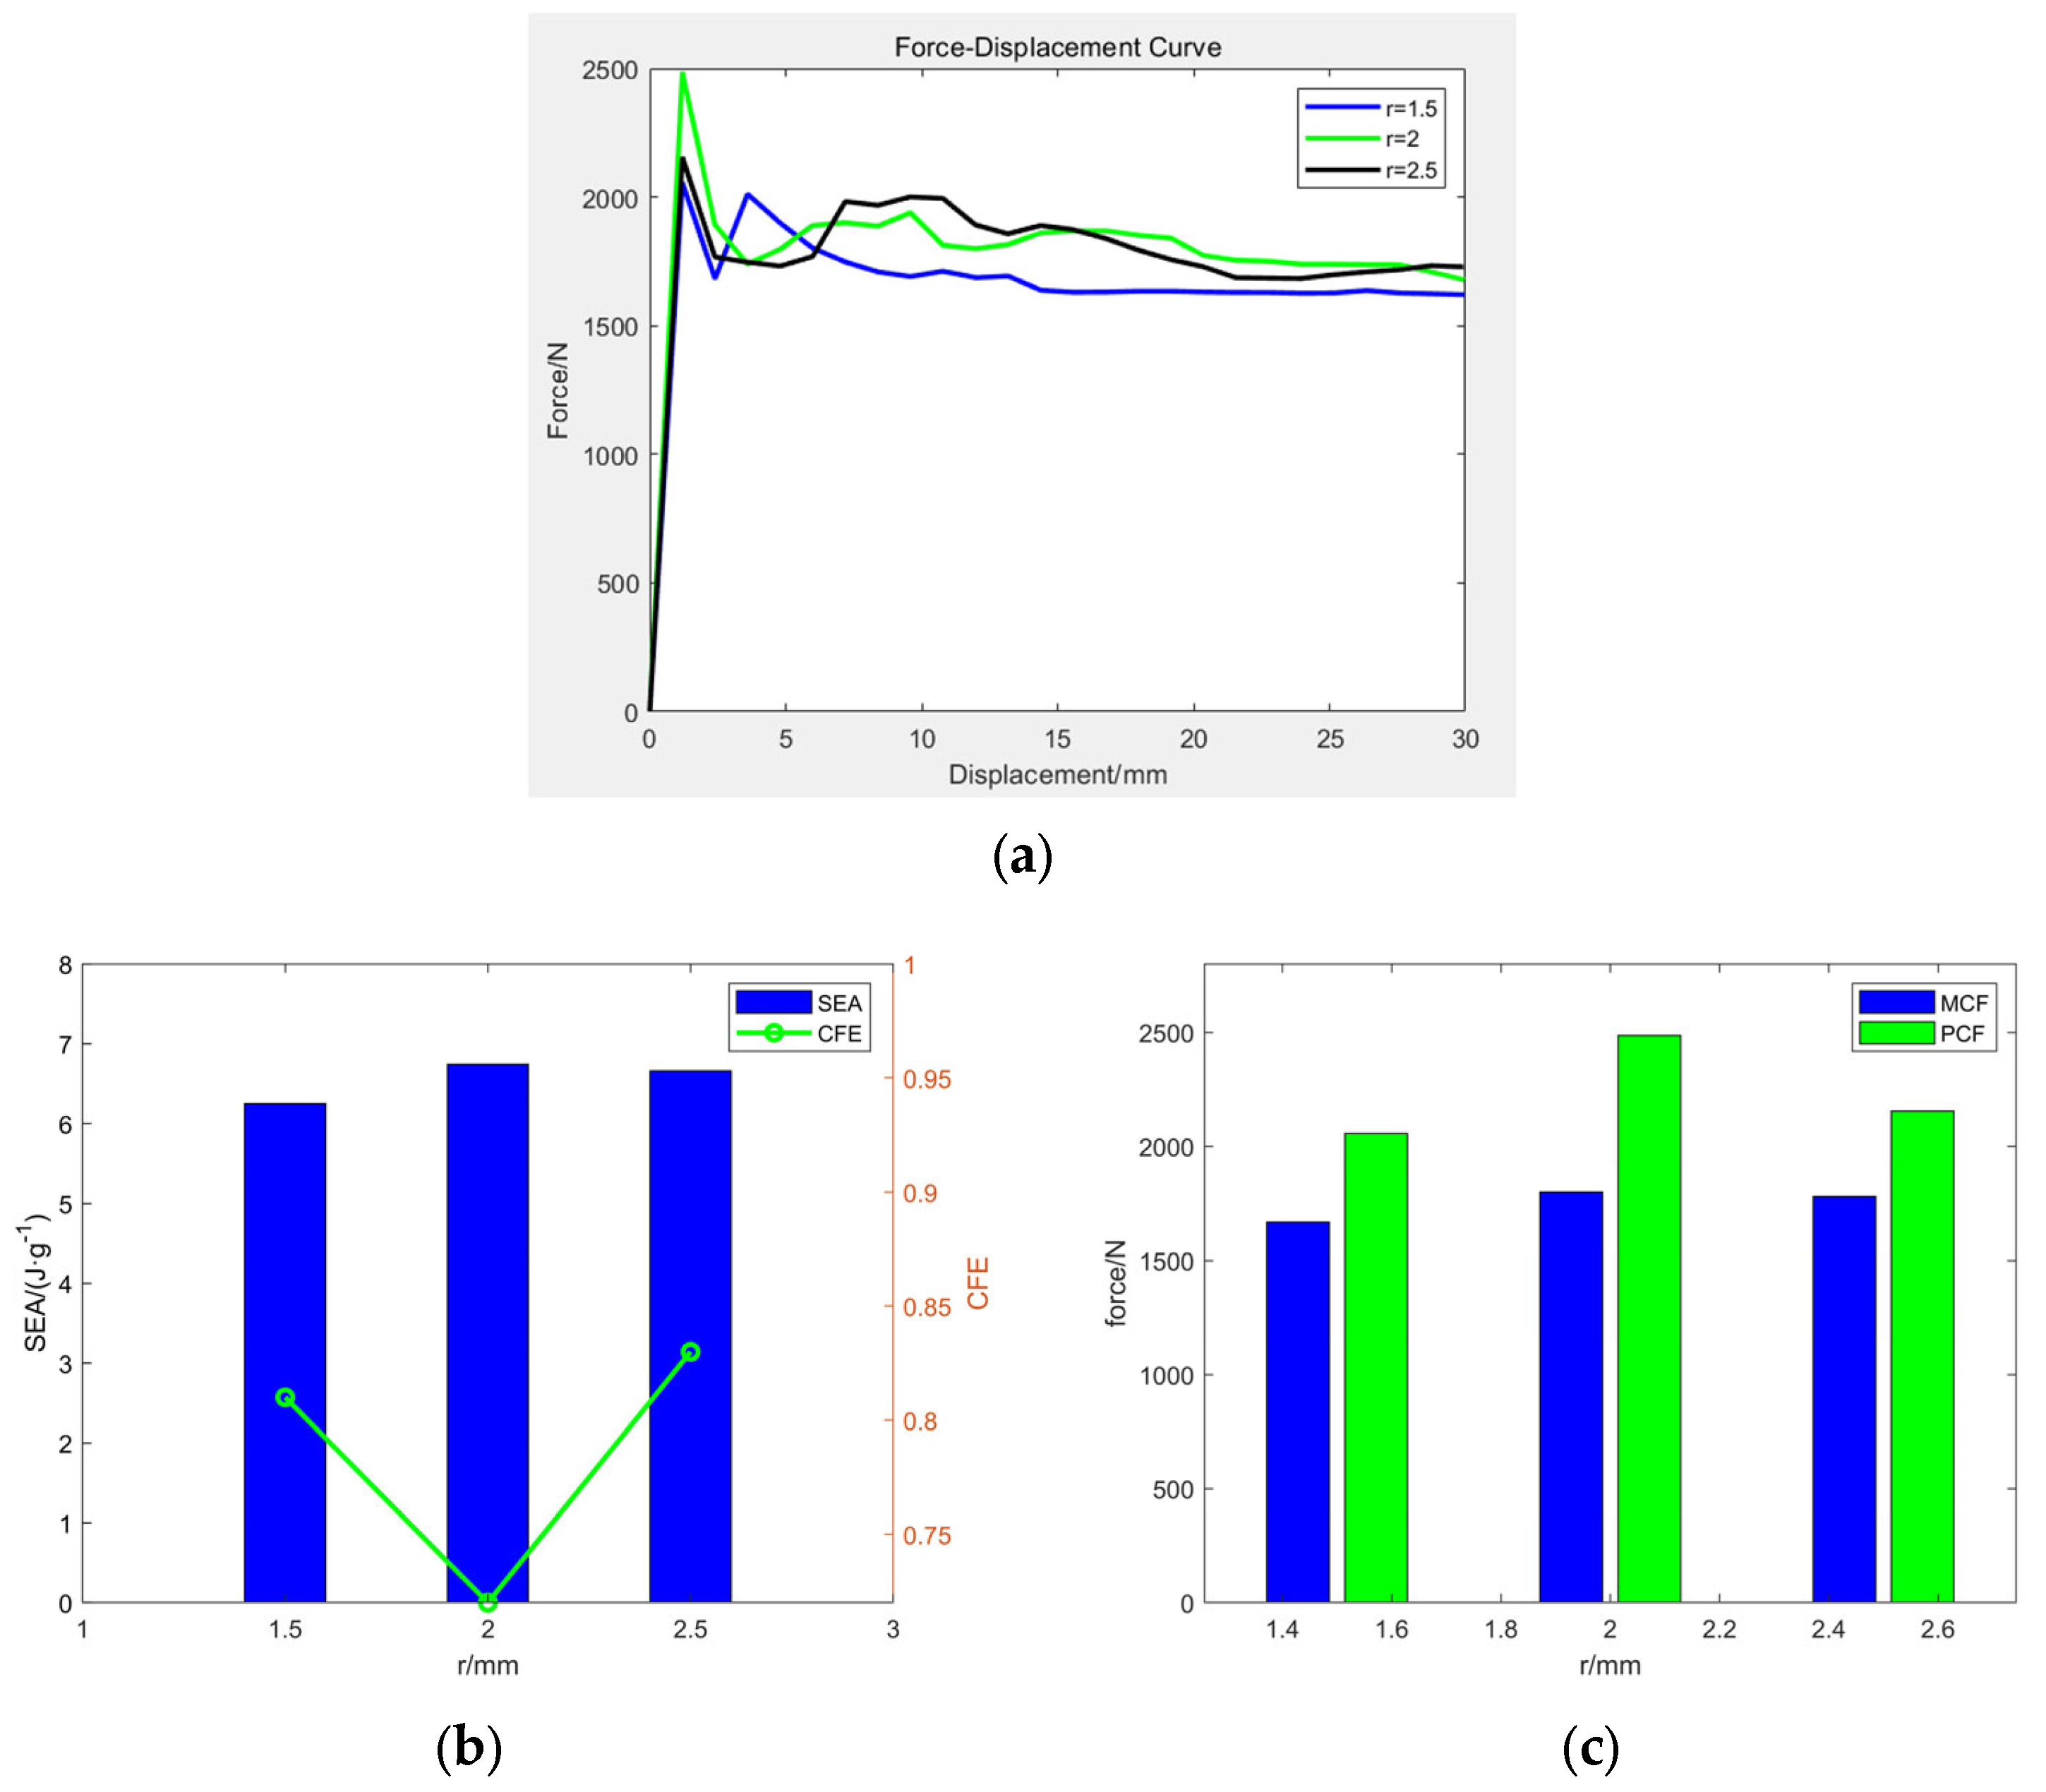
4.2. Energy Absorption Characteristics

Figure 16 shows the energy-absorbing performance of the MPT–LCE with different unit cell lengths l under dynamic crush. The force–displacement curves with different unit cell lengths of the MPT–LCE are shown in Figure 16a. As can be seen from Table 10 and Figure 16b,c, the MPT–LCE with a unit cell length of 16 mm has the maximum SEA, MCF, and CFE, exhibiting the best energy-absorbing performance. This is consistent with the analysis of the influence of the unit cell length on the deformation modes in Section 4.1. Since the MPT–LCE with a unit cell length of 14 mm has the maximum PCF, it results in the lowest CFE. The CFE of the MPT–LCE with a unit cell length of 12 mm is in the middle. As the unit cell length increases, both SEA and MCF show an upward trend.
Figure 17 shows the energy-absorbing performance of the MPT–LCE with different unit cell widths w under dynamic crush. The force–displacement curves with different unit cell widths of MPT–LCEs are shown in Figure 17a. As can be seen from Table 11 and Figure 17b,c, the MPT–LCE with a unit cell width of 12 mm has the maximum SEA, MCF, and CFE, exhibiting the best energy absorption performance. This is consistent with the analysis of the influence of the unit cell width on the deformation modes in Section 4.1. Since the MPT–LCE with a unit cell width of 14 mm has the maximum PCF, and it results in the lowest CFE. The CFE of the MPT–LCE with a unit cell width of 16 mm is in the middle. The MPT–LCE with a unit cell width of 12 mm has the minimum PCF. The PCF of the MPT–LCE with a unit cell width of 16 mm is in the middle. As the unit cell width increases, the SEA of the MPT–LCE gradually decreases. However, the CFE shows a decrease followed by an increase.
Figure 18 shows the energy-absorbing performance of the MPT–LCE with different unit cell radii under dynamic crush. The force–displacement curves with different unit cell radii of the MPT–LCE are shown in Figure 18a. As can be seen from Table 12 and Figure 18b,c, the MPT–LCE with a unit cell radius of 2 mm has the maximum SEA and PCF. The MPT–LCE with a unit cell radius of 2.5 mm has the maximum CFE and MCF. Since the MPT–LCE with a unit cell radius of 2 mm has the maximum PCF, it results in the lowest CFE. As the unit cell radius increases, the SEA and PCF of the MPT–LCEs show an increase followed by a decrease. However, the trend of the CFE is opposite to that of the SEA and the PCF. Moreover, as the unit cell radius increases, the MCF shows an upward trend.
Niknejad et al. [12] and Hussein et al. [13] studied the influence of different filling materials (polyurethane foam, aluminum honeycomb, and their combination) on the axial crushing behavior of square aluminum tubes. Their results showed that the deformation mode of hollow tubes, aluminum honeycomb-filled tubes, and foam-filled tubes was the progressive folding mode. The tube filled with foam and aluminum honeycomb was deformed in a way that the tube corner was split first and then folded outward to form a four-petal shape. However, in our study of MPT–LCEs, due to the unique properties of liquid crystal elastomers, the structure first fractured at the circular arcs where the unit cells were joined, which was different from the behavior of foam-filled tubes, aluminum tubes, and tubes filled with a combination of foam and aluminum. Regarding the energy-absorbing performance, the force–displacement curve of MPT–LCEs is smoother and has less fluctuation than that of their tubes. In addition, the MPT–LCE has a lower peak crushing force and its crushing force efficiency is higher than that of their tubes under dynamic crush conditions. In summary, compared with previous studies on metallic thin-walled tubes filled with other materials, the MPT–LCE designed in this paper has several advantages.

5. Conclusions

In this paper, a novel metallic thin-walled porous tube was designed, and metallic thin-walled porous tubes filled with liquid crystal elastomers (MPT–LCEs) were obtained. Through experiments and numerical simulations, the deformation modes and energy-absorbing performance of the novel MPT–LCEs under dynamic crush were studied. The main conclusions were drawn, as follows:
(1) Under dynamic crush, the MPT–LCE first fractures at the circular arcs where the unit cells of the MPTs are joined. Due to the uneven distribution of the force, the structure inclines towards the fractured side. As the crush continues, the MPTs collapse layer by layer. However, due to the supporting effect of LCEs on MPTs, the entire structure can still continue to resist deformation and absorb energy continuously until it enters the densification stage.
(2) A verified and reliable finite element model is used to simulate the deformation processes of the MPT–LCE with different unit cell lengths, widths, and radii. By comparing and analyzing the effects of unit cell length, width, and radius on the deformation modes and energy-absorbing performance, we find that changing the geometric parameters can affect the deformation modes of the MPT–LCE, which in turn affects the energy-absorbing performance of the MPT–LCE.
The conclusions obtained from this paper can provide a reference to the study of the energy absorption of metallic thin-walled porous tubes filled with liquid crystal elastomers under dynamic crush.

Author Contributions

Conceptualization, X.H. and S.N.; methodology, S.N. and Y.W.; software, X.H.; validation, X.H., J.W. and Z.L.; formal analysis, X.H.; investigation, Z.L.; resources, B.L.; data curation, B.L.; writing—original draft preparation, X.H.; writing—review and editing, X.H. and J.W.; visualization, J.W.; supervision, S.N.; project administration, S.N.; funding acquisition, Y.W. All authors have read and agreed to the published version of the manuscript.

Funding

This research was funded by the Science and Technology on Electromechanical Dynamic Control Laboratory, China, grant number 6142601022308.

Data Availability Statement

Data are contained within the article.

Conflicts of Interest

The authors declare no conflicts of interest.

Abbreviations

The following abbreviations are used in this manuscript:
MPTsMetallic thin-walled porous tubes
LCEsLiquid crystal elastomers
MPT–LCEMetallic thin-walled porous tubes filled with liquid crystal elastomers
SLMSelective laser melting
SHPBSplit Hopkinson Pressure Bar
SEASpecific energy absorption
MCFMean crushing force
CFECrushing force efficiency
PCFPeak crushing force

References

  1. Moreno, C.; Winnett, J.; Williams, T. On the effect of anisotropy on the performance and simulation of shrinking tubes used as energy absorbers for railway vehicles. Thin-Walled Struct. 2021, 161, 107513. [Google Scholar] [CrossRef]
  2. Peng, Y.; Li, T.; Bao, C.; Zhang, J.; Xie, G.; Zhang, H. Performance analysis and multi-objective optimization of bionic dendritic furcal energy-absorbing structures for trains. Int. J. Mech. Sci. 2023, 246, 108145. [Google Scholar] [CrossRef]
  3. Selivanov, V.V.; Silnikov, M.V.; Markov, V.A.; Popov, Y.V.; Pusev, V.I. Using highly porous aluminum alloys and honeycomb structures in spacecraft landing gear. Acta Astronaut. 2021, 180, 105–109. [Google Scholar] [CrossRef]
  4. Alexander, J.M. An approximate analysis of the collapse of thin cylindrical shells under axial loading. Q. J. Mech. Appl. Math. 1960, 13, 10–15. [Google Scholar] [CrossRef]
  5. Andrews, K.R.F.; England, G.L.; Ghani, E. Classification of the axial collapse of cylindrical tubes under quasi-static loading. Int. J. Mech. Sci. 1983, 25, 687–696. [Google Scholar] [CrossRef]
  6. Tarlochan, F.; Samer, F.; Hamouda, A.M.S.; Ramesh, S.; Khalid, K. Design of thin wall structures for energy absorption applications: Enhancement of crashworthiness due to axial and oblique impact forces. Thin-Walled Struct. 2013, 71, 7–17. [Google Scholar] [CrossRef]
  7. Nia, A.A.; Parsapour, M. Comparative analysis of energy absorption capacity of simple and multi-cell thin-walled tubes with triangular, square, hexagonal and octagonal sections. Thin-Walled Struct. 2014, 74, 155–165. [Google Scholar]
  8. Baroutaji, A.; Sajjia, M.; Olabi, A.G. On the crashworthiness performance of thin-walled energy absorbers: Recent advances and future developments. Thin-Walled Struct. 2017, 118, 137–163. [Google Scholar] [CrossRef]
  9. Moradpour, A.; Elyasi, M.; Montazeri, S. Developing a New Thin-Walled Tube Structure and Analyzing its Crushing Performance for AA 60601 and Mild Steel Under Axial Loading. Trans. Indian Inst. Met. 2016, 69, 1107–1117. [Google Scholar] [CrossRef]
  10. Ylmaz, H.; Kocaba, B.; Zyurt, E. Empirical equations to estimate non-linear collapse of medium-length cylindrical shells with circular cutouts. Thin-Walled Struct. 2017, 119, 868–878. [Google Scholar] [CrossRef]
  11. Montazeri, S.; Elyasi, M.; Moradpour, A. Investigating the energy absorption, SEA and crushing performance of holed and grooved thin-walled tubes under axial loading with different materials. Thin-Walled Struct. 2018, 131, 646–653. [Google Scholar] [CrossRef]
  12. Niknejad, A.; Abedi, M.M.; Liaghat, G.H.; Nejad, M.Z. Absorbed energy by foam-filled quadrangle tubes during the crushing process by considering the interaction effects. Arch. Civ. Mech. Eng. 2015, 15, 376–391. [Google Scholar] [CrossRef]
  13. Hussein, R.D.; Ruan, D.; Lu, G.; Stephen, G.; Yoon, J.W. Crushing response of square aluminum tubes filled with polyurethane foam and aluminum honeycomb. Thin-Walled Struct. 2017, 110, 140–154. [Google Scholar] [CrossRef]
  14. Altin, M.; Güler, M.A.; Mert, S.K. The effect of percent foam fill ratio on the energy absorption capacity of axially compressed thin-walled multi-cell square and circular tubes. Int. J. Mech. Sci. 2017, 131–132, 368–379. [Google Scholar] [CrossRef]
  15. Yao, R.; Zhang, B.; Yin, G.; Zhao, Z. Energy absorption behaviors of foam-filled holed tube subjected to axial crushing: Experimental and theoretical investigations. Mech. Adv. Mater. Struct. 2021, 28, 2501–2514. [Google Scholar] [CrossRef]
  16. Xiao, Y.; Wu, J.; Zhang, Y. Recent advances in the design, fabrication, actuation mechanisms and applications of liquid crystal elastomers. Soft Sci. 2023, 3, 11. [Google Scholar] [CrossRef]
  17. Chen, M.; Gao, M.; Bai, L.; Zheng, H.; Qi, H.J.; Zhou, K. Recent Advances in 4D Printing of Liquid Crystal Elastomers. Adv. Mater. 2023, 35, e2209566. [Google Scholar] [CrossRef] [PubMed]
  18. Wang, X.; Han, J.; Xu, H.; Ji, H.; Yue, Z.; Zhang, R.; Li, B.; Ji, Y.; Li, Z.; Wang, P.; et al. Nonlinear mechanical behaviour and visco-hyperelastic constitutive description of isotropic-genesis, polydomain liquid crystal elastomers at high strain rates. J. Mech. Phys. Solids 2024, 193, 105882. [Google Scholar] [CrossRef]
Figure 1. The unit cell.
Jcs 09 00190 g001
Figure 2. The entire design process of the MPT. (a) The unit cell; (b) the planar structure; (c) bending at an angle of 180 degrees; (d) the MPT.
Jcs 09 00190 g002
Figure 3. The fabrication process of MPTs. (a) iSLM280 printing system; (b) the printing process; (c) the MPT sample.
Jcs 09 00190 g003
Figure 4. The fabrication and characterization of the LCE and the MPT–LCE samples. (a) Synthesis procedures of LCEs; (b) the LCE sample; (c) SEM image; (d) DSC curve; (e) the MPT–LCE sample.
Jcs 09 00190 g004
Figure 5. The true stress–strain curves of AlSi10Mg.
Jcs 09 00190 g005
Figure 6. The dynamic stress–strain curves of AlSi10Mg samples at 3464 s 1 , 4570 s 1 , and 5507 s 1 strain rates.
Jcs 09 00190 g006
Figure 7. INSTRON CEAST 9350 drop hammer test system.
Jcs 09 00190 g007
Figure 8. Deformation modes of the MPT–LCE. (a) The strain is equal to 0; (b) the strain is equal to 0.2; (c) the strain is equal 0.4; (d) the strain is equal to 0.7.
Jcs 09 00190 g008
Figure 9. Force–displacement of the MPT–LCE under dynamic crush.
Jcs 09 00190 g009
Figure 10. The finite element model.
Jcs 09 00190 g010
Figure 11. Comparison of deformation process between experiments (on the left) and simulations (on the right). (a) The strain is equal to 0; (b) the strain is equal to 0.2; (c) the strain is equal to 0.4; (d) the strain is equal to 0.7.
Jcs 09 00190 g011
Figure 12. Comparison of force–displacement curves between experiments and simulations.
Jcs 09 00190 g012
Figure 13. Deformation modes with different unit cell lengths. On the left is the length of 12 mm, the middle is the length of 14 mm, and on the right is the length of 16 mm. (a) The strain is equal to 0; (b) the strain is equal to 0.2; (c) the strain is equal to 0.4; (d) the strain is equal to 0.7.
Jcs 09 00190 g013aJcs 09 00190 g013b
Figure 14. Deformation modes with different unit cell widths. On the left is the width of 12 mm, the middle is the width of 14 mm, and on the right is the width of 16 mm. (a) The strain is equal to 0; (b) the strain is equal to 0.2; (c) the strain is equal to 0.4; (d) the strain is equal to 0.7.
Jcs 09 00190 g014aJcs 09 00190 g014b
Figure 15. Deformation modes with different unit cell radii. On the left is the radius of 1.5 mm, the middle is the radius of 2 mm, and on the right is the radius of 2.5 mm. (a) The strain is equal to 0; (b) the strain is equal to 0.2; (c) the strain is equal to 0.4; (d) the strain is equal to 0.7.
Jcs 09 00190 g015aJcs 09 00190 g015b
Figure 16. Energy-absorbing performance of the MPT–LCEs with different unit cell lengths. (a) The force–displacement curves with different unit cell lengths; (b) SEA–CFE; (c) MCF–PCF.
Jcs 09 00190 g016
Figure 17. Energy-absorbing performance of the MPT–LCE with different unit cell widths. (a) The force-displacement curves with different unit cell widths; (b) SEA-CFE; (c) MCF-PCF.
Jcs 09 00190 g017
Figure 18. Energy-absorbing performance of the MPT–LCEs with different unit cell radii. (a) The force–displacement curves with different unit cell radii; (b) SEA–CFE; (c) MCF–PCF.
Jcs 09 00190 g018
Table 1. Summary of literature mentioned above.
AuthorsResearch ObjectResearch MethodsMain FindingsLimitations
Alexander [4]thin-walled cylindrical shell theoretical analysis and experimental comparisonPropose an approximate theory for the collapse process of thin-walled cylindrical shells under axial loads.The ideal model is overly simplified and differs from the actual situation.
Andrews et al. [5]aluminum alloy tubesexperimentsStudy the axial compression mode and energy absorption characteristics, explore the influence of tube length, and provide classification charts.Idealization of experimental conditions and limit to quasi-static loading conditions.
Tarlochan et al. [6]six different cross-sectional shapes of thin-walled structuressimulationsOptimized hexagonal tube structure with excellent energy absorption capacity.Lack of experimental verification.
Nia et al. [7]simple and multi-cell thin-walled tubes with different sectionsexperiments and simulationsMulti-cell cross-section has stronger energy absorption capacity than simple cross-section.Under quasi-static loading conditions, without considering dynamic loading.
Moradpour et al. [9]a new thin-walled tube structure with holestheoretical analysis and experimentsThe thin-walled tube with five rows, 12 holes per row, and a diameter of 6 mm has ideal extrusion performance.Only considers quasi-static loading conditions without considering dynamic loading situations.
Ylmaz et al. [10]medium-length cylindrical shells with circular cutoutstheoretical analysis, experiments, and simulationsCircular notches significantly reduce the ultimate load of cylindrical shells.Only considers axial compression loading conditions without involving other complex loading conditions.
Montazeri et al. [11]holed and grooved thin-walled tubestheoretical analysis, experiments, and simulationsCompared to steel perforated pipes and slotted pipes, perforated pipes absorb more energy and have a higher mass-to-energy ratio.Only considers axial compression loading conditions without involving other complex loading conditions.
Niknejad et al. [12]polyurethane foam-filled quadrilateral tubestheoretical analysis and experimental comparisonThe quadrilateral tube filled with hard foam absorbs more energy than that filled with soft foam.The quantification method of interaction is not precise enough.
Hussein at al. [13]square aluminum tubes with different filler structures experimentsThe square aluminum tube filled with polyurethane foam and aluminum honeycomb has the best crashworthiness.Only considers quasi-static loading conditions without considering dynamic loading conditions.
Altin et al. [14]thin-walled multi-cell square and circular tubes filled with foamexperiments and simulationsThe square tube filled with foam performs best in crashworthiness.Only considers quasi-static loading conditions without considering dynamic loading conditions.
Yao et al. [15]foam-filled holed tubetheoretical analysis and experimentsFilling aluminum foam can significantly improve the total energy absorption and average extrusion pressure of empty perforated tubes.Insufficient exploration of the effect of other parameter changes on energy absorption performance.
Xiao et al. [16]the design, fabrication, actuation mechanisms, and applications of LCEsliterature reviewThis literature summarized the fabrication methods, actuation mechanisms, and diverse applications of LCEs.Limitations in fabrication technology, insufficient actuation performance, and difficulties in 3D printing.
Chen et al. [17]4D printing of LCEsliterature reviewThis literature introduced the properties and fabrications of LCEs, 4D printing technology, and application fields.Limitations in material systems, insufficient theoretical modeling, and pour printing technology.
Wang et al. [18]isotropic genesis, polydomain LCEstheoretical analysis, experiments, and simulationsI-PLCEs exhibit significant nonlinearity and strain rate correlation. A visco–hyperelastic constitutive model for the material is established.There are certain limitations to the applicability of model parameters under different loading conditions.
Table 2. The geometric parameters of the MPTs.
ParametersSymbolValue
height h M P T s 42 mm
the inner radius r M P T s i n n e r 6.28 mm
the outer radius r M P T s o u t e r 7.08 mm
thickness t M P T s 0.8 mm
Table 3. The physical properties of AlSi10Mg powder.
Granularity Range/μmFlowability/s Apparent   Density / ( g · c m 3 ) Tap   Density / ( g · c m 3 )
15–53<100>1.2>1.5
Table 4. Mechanical properties of AlSi10Mg.
ParametersSymbolValueStandard Deviations
density ρ 2.6 g / c m 3 0.17
Young’s modulusE9.92 GPa0.39
Poisson’s ratio ν 0.300.04
0.2% offset yield stress σ y 210 MPa15
ultimate stress σ u 283 MPa24
fracture strain ε f 0.110.03
Table 5. The energy-absorbing performance evaluation indicators of the MPT–LCE.
IndicatorsValueStandard Deviations
SEA6.89 J/g0.22
PCF2353.4 N94
MCF1383.7 N42
CFE0.760.06
Table 6. Material parameters for *MAT_RIGID.
ROEPRCMOCON1CON2
7.8 g / c m 3 200 GPa0.3147
Table 7. Material parameters for *MAT_PIECEWISE_LINEAR_PLASTICITY.
MaterialROEPRSIGYETAN
MPTs 2.6   g / c m 3 9.92 GPa0.3210 MPa0
LCEs 1.08   g / c m 3 1MPa0.330.25 MPa0
Table 8. The evaluation indicators of the experiment and the simulation.
PCF/N SEA / J · g 1 MCF/NCFE
experiment2353.46.691783.70.76
experimental standard deviations940.22420.06
simulation2485.96.741800.90.72
error5.6%0.7%1.0%5.3%
Table 9. The geometric parameters of each MPT–LCE.
Group l u n i t /mm w u n i t /mm r u n i t /mm h M P S /mm r i n n e r M P S /mm r o u t e r M P S /mm
12142425.336.13
114142426.287.08
16142427.248.04
14122366.287.08
214142426.287.08
14162486.287.08
14141.5426.287.08
314142426.287.08
14142.5426.287.08
Table 10. The evaluation indicators of the MPT–LCE with different unit cell lengths.
PCF/N SEA / J · g 1 MCF/NCFE
l = 12 mm2117.96.451721.10.81
l = 14 mm2485.96.741800.90.72
l = 16 mm2208.76.931854.90.84
Table 11. The evaluation indicators of the MPT–LCE with different unit cell widths.
PCF/N SEA / J · g 1 MCF/NCFE
w = 12 mm2079.66.911848.70.89
w = 14 mm2485.96.741800.90.72
w = 16 mm2261.36.601763.20.78
Table 12. The evaluation indicators of the MPT–LCEs with different unit cell radii.
PCF/N SEA / J · g 1 MCF/NCFE
r = 1.5 mm2056.96.251667.90.81
r = 2 mm2485.96.741800.90.72
r = 2.5 mm2155.66.661780.80.83
Disclaimer/Publisher’s Note: The statements, opinions and data contained in all publications are solely those of the individual author(s) and contributor(s) and not of MDPI and/or the editor(s). MDPI and/or the editor(s) disclaim responsibility for any injury to people or property resulting from any ideas, methods, instructions or products referred to in the content.

