Article

Auxetic Composite Sandwich for Vibration Damping Through Axisymmetric Deformation

1
School of Mechanical and Aerospace Engineering, Nanyang Technological University, 50 Nanyang Avenue, Singapore 639798, Singapore
2
Akribis Systems, 56 Serangoon North Ave 4, Singapore 555851, Singapore
3
Newcastle University in Singapore, 172A, Ang Mo Kio Avenue 8, #05-01, Singapore 567739, Singapore
4
Newcastle University, Newcastle upon Tyne NE1 7RU, UK
*
Authors to whom correspondence should be addressed.
J. Compos. Sci. 2025, 9(4), 162; https://doi.org/10.3390/jcs9040162
Submission received: 19 December 2024 / Revised: 6 February 2025 / Accepted: 14 February 2025 / Published: 27 March 2025
(This article belongs to the Section Composites Applications)

Abstract

:
External undesirable vibrations from the environment can affect the performance of vibration-sensitive equipment. Passive isolators are simpler, lighter, and cheaper, and constrained layer damping is a low-cost yet effective method of vibration dampening. Traditional methods of improving constrained layer damping include increasing the number of layers or directly connecting one end of the constraining layers to the base structure. The drawback of these methods is the requirement to increase the overall thickness. Also, like most passive isolators, it has a limitation on stability, which is usually solved by external mechanical limiters. The novel concept of an auxetic composite sandwich addresses both issues of having an external limiter by using the constraining layer for load bearing and enhancing damping performance without increasing the overall thickness, achieved through an auxetic interlayer and deforming axis-symmetrically. The rotating triangle auxetic interlayer is selected based on biomimicry of animals that endure impact and pressure, such as cranial sutures, beaks, ammonoid and turtle shells. Finite element analysis shows significantly higher damping ratio at the beginning of free vibration, and experiment results show an eightfold increase in damping ratio (from 0.04 to 0.29). Additionally, settling time to 0.25 g is reduced from 70.7 ms to 60.9 ms as acceleration is increased from 0.5 g to 4 g. Power spectrum density shows better attenuation, three to four times better than the plain model. The successful demonstration of the concept motivates further study to understand the performance of auxetic patterns in enhancing constrained layer damping.

1. Introduction

Machines and equipment with moving mechanical objects tend to generate vibrations. These vibrations transmit through both the structure and the air, generating micro displacements within the structure, resulting in unwanted vibrations and acoustic issues. The best approach to tackle a vibration problem is to eliminate it at its source, which can be achieved through performing maintenance, such as balancing off-centered masses, preloading bearings, replacing worn bearings or bushings, adding shock absorbers or dampers, activating vibration cancelation systems, etc. Despite these measures, vibrations cannot be fully eliminated.
To protect vibration-sensitive payloads, active and/or passive methods can be employed. Although active platforms are versatile and can be employed in a wide range of applications, the use of actuators, sensors and controllers can add additional weight and make implementation costly. An example of it is an active vibration isolation system, developed by Qian [1] to protect sensitive space payloads, such as protecting an optical clock from micro vibrations from 0.5 Hz up to 200 Hz, keeping accelerations below 8.9 × 10⁻⁸ g. The model is designed for a payload of 25 kg. Exteroceptive accelerometers gather information about vibrations in specific directions and proprioceptive sensors for positional feedback of the voice coils. The model comprises eight voice coils with an accelerometer attached between the end of each voice coil, as shown in Figure 1. Four voice coils carry the load platform vertically, and the remaining four voice coils rotate the load platform in the transverse direction.
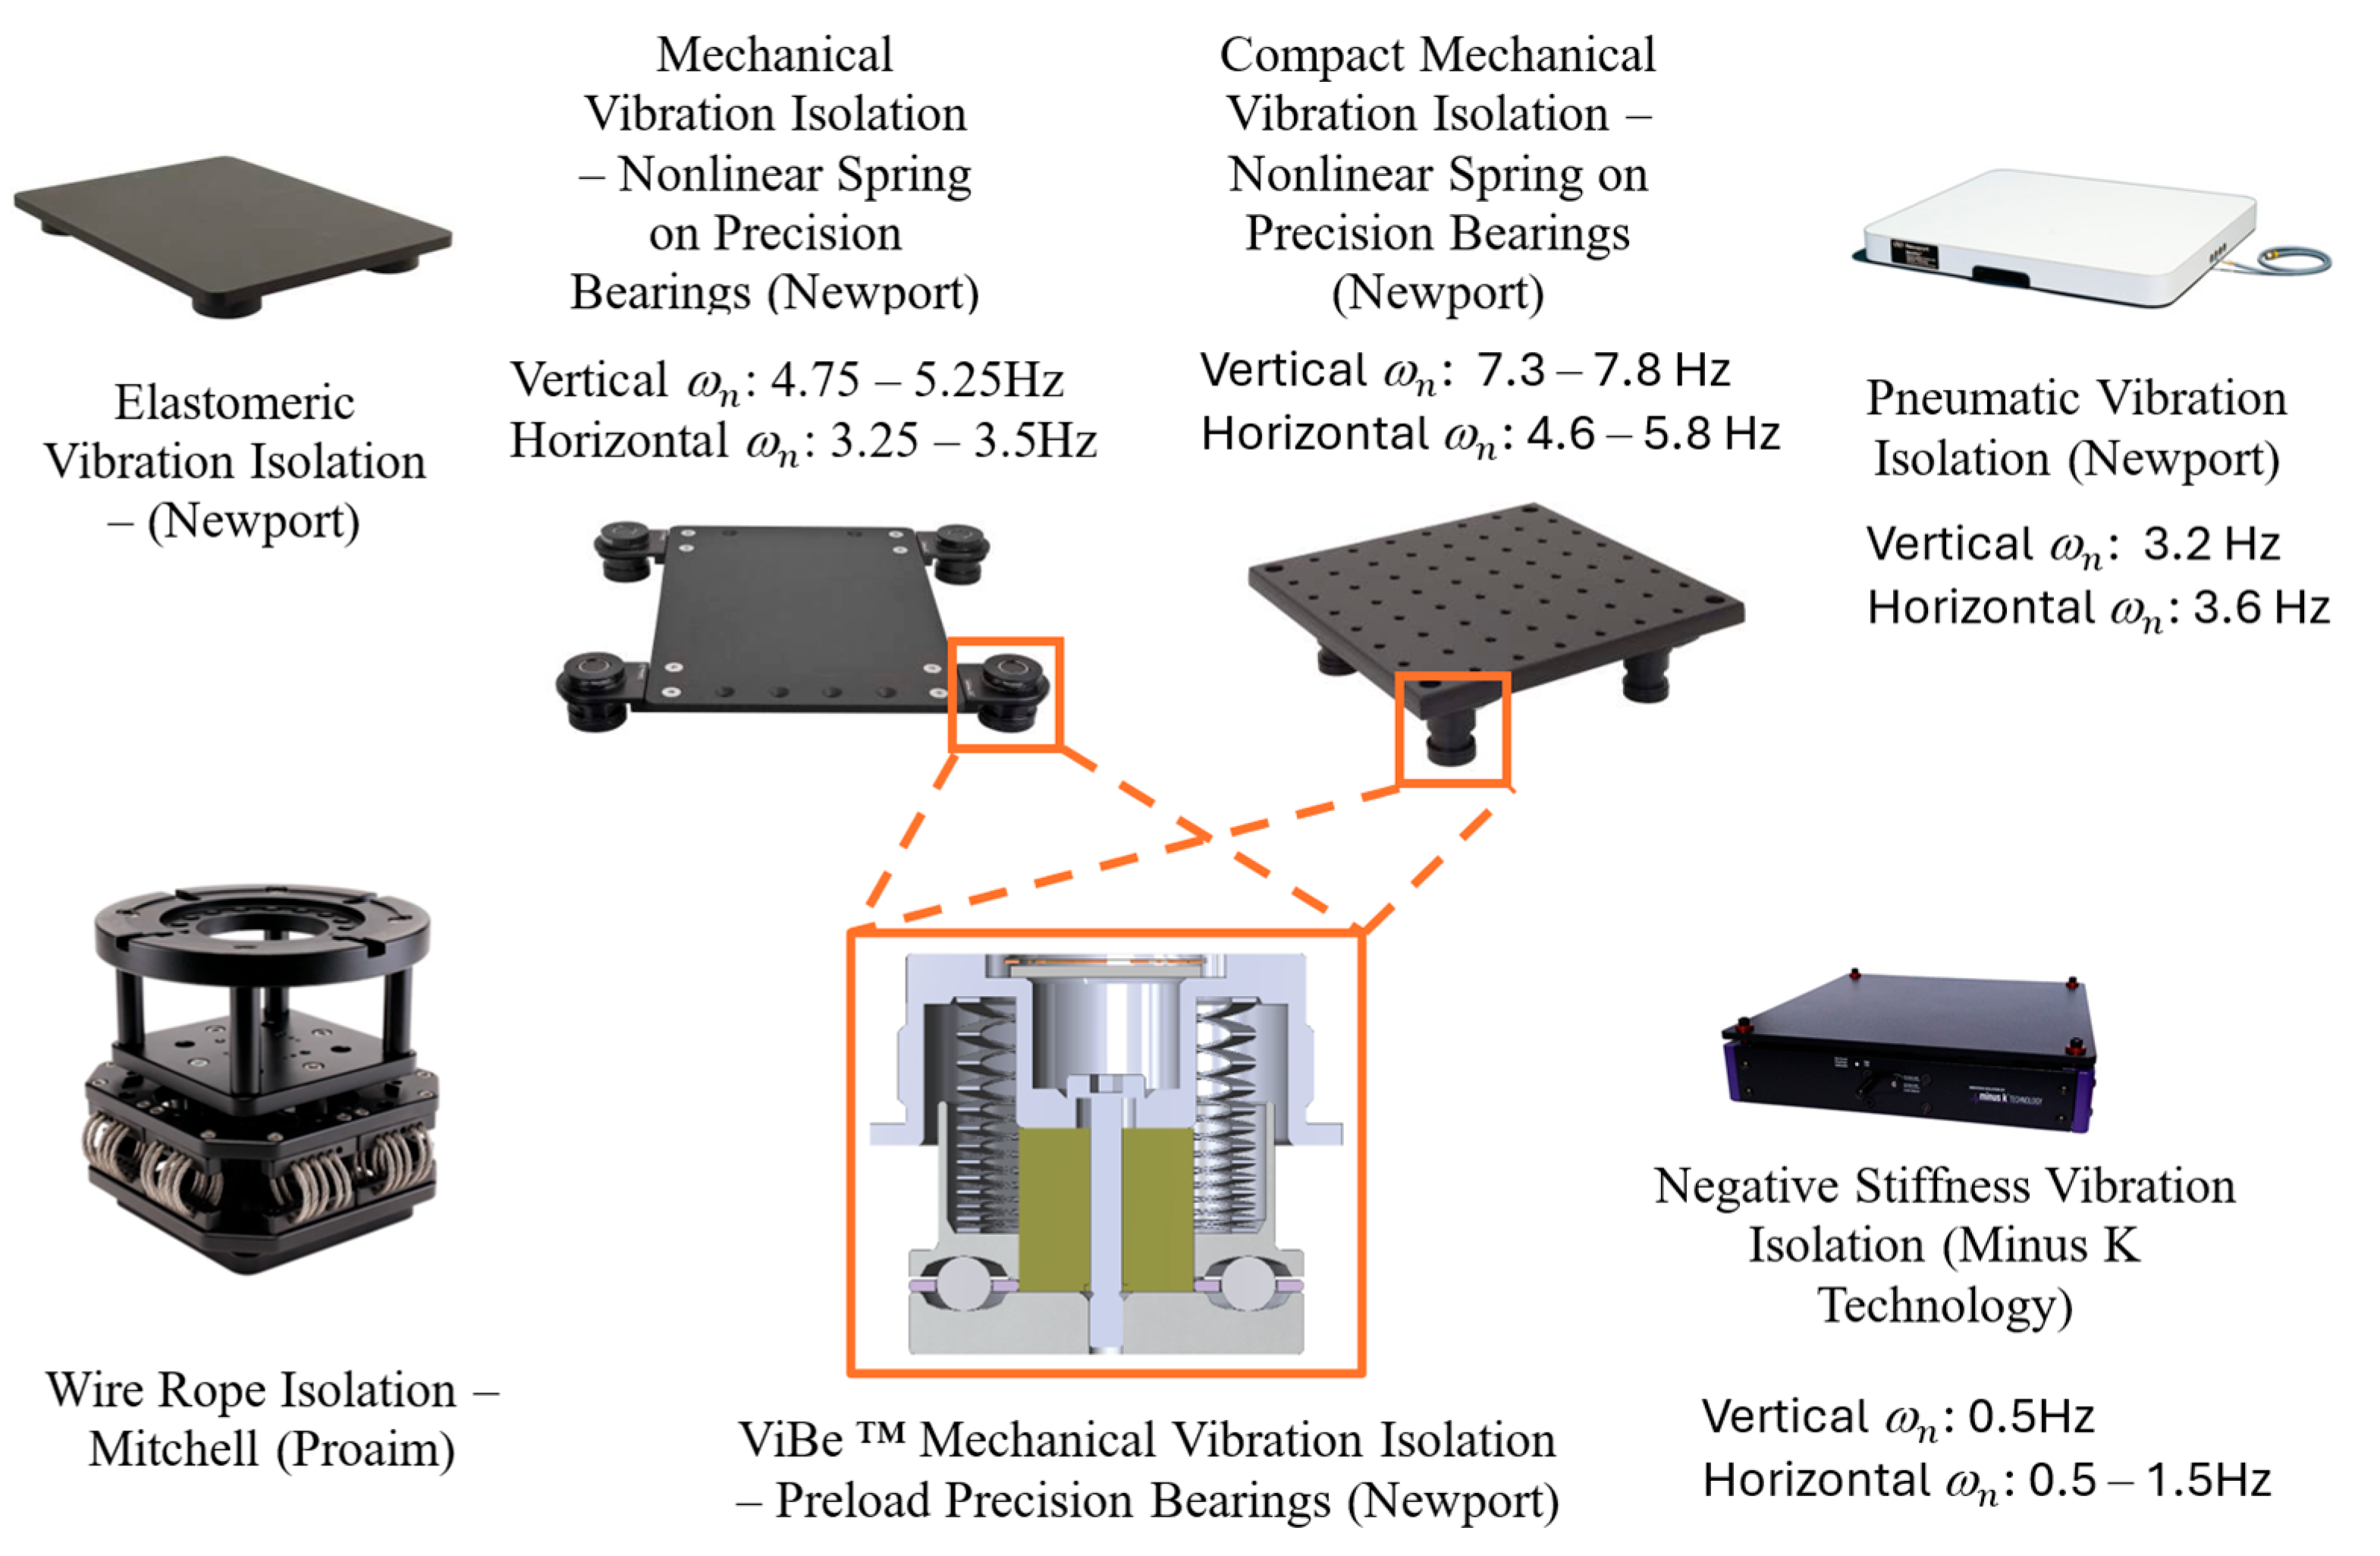
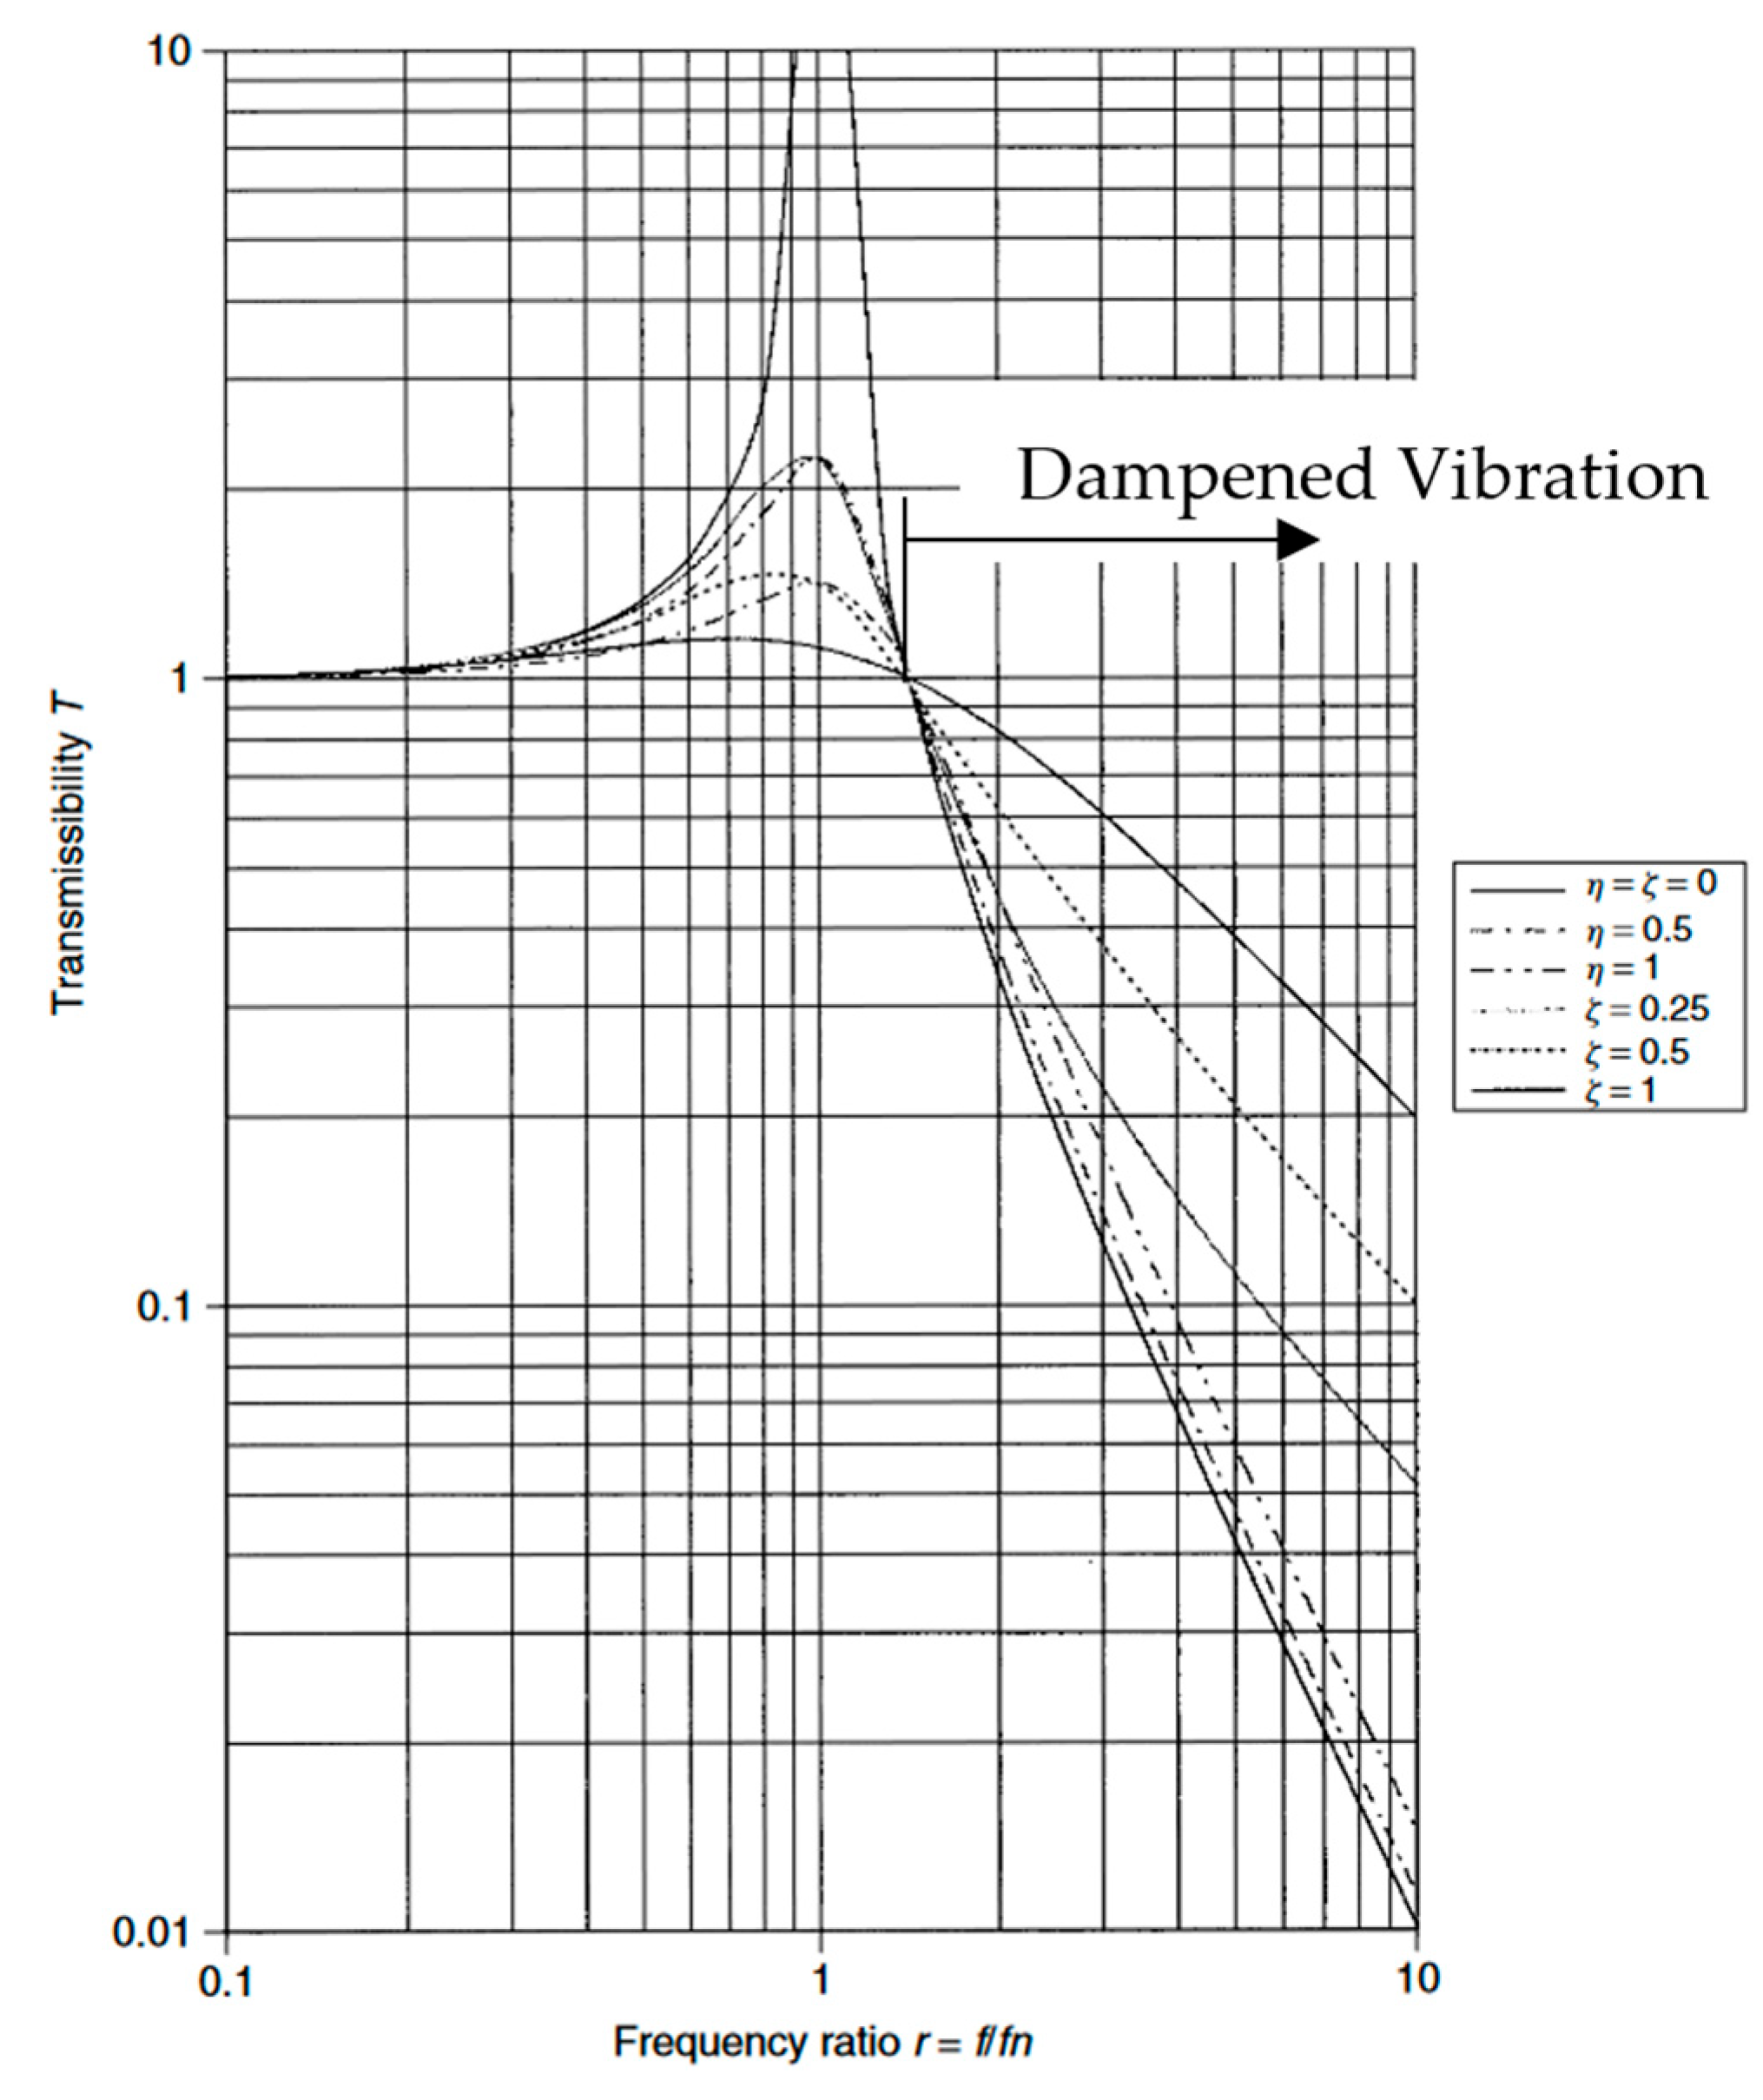
Passive platforms are simpler, lighter, and cheaper to construct. Commercially available vibration isolation platforms are widely used for vibration-sensitive equipment, such as microscopes, cameras, or electron microscopes, as shown in Figure 2. These platforms use either precision bearings, pneumatic or elastomeric mountings (Newport™), or wire ropes (Proaim) to perform isolation. Passive isolators dissipate energy through friction (wire rope, pneumatic), friction within viscoelastic material (elastomeric) or by deformation through buckling (negative stiffness). The effective frequency range of passive dampers is dependent on the resonance frequency of the system resting on the isolators. Dampening would occur at √2 times above the resonance frequency, as illustrated by Eric E et al. in Figure 3 [2], using the expression of transmissibility, in terms of damping ratio “ ζ ”and the ratio between vibration frequency and natural frequency “r”.
T = 1 + 2 ζ r 2 / 1 r 2 2 + 2 ζ r 2 .
Hence, having a lower resonance frequency would mean that the effective attenuation range would be widened. An example is the use of negative stiffness isolators (Minus K Technology®), which is effective from as low as 1 Hz.
Constrained layer damping is another method of passive vibration isolation, where the main body or support is sandwiched by alternating viscoelastic and constraining layers. Relative displacement between the constraining layers and the main body results in shear strain within the viscoelastic layer and stored strain energy. An example of a passive vibration attenuation platform using constrained layer damping is that developed by Park, as shown in Figure 4 [3]. Four units were used for a 40 kg class satellite, attenuating frequencies above approximately 300 Hz in the transverse direction and above approximately 100 Hz in the vertical direction. The platform utilized composite sandwiches made from smart memory alloy, sandwiched by glass fiber composite (FR4) layers and held together with viscoelastic tapes, significantly reducing vibration by 76% in the transverse direction, with damping ratio between 0.032 and 0.044, and 52% in the vertical direction, with damping ratio between 0.087 and 0.095, for its Z axis. The study on the dampening of a pitot static tube using a single polyurethane layer by Pan et al. achieved a damping ratio of 0.049 [4].
There are two issues with the use of passive vibration isolators and constrained layer damping. Firstly, with passive vibration isolators in general, to attain a low resonance frequency, as shown in Equation (2), the stiffness of passive isolation platforms “k” can be lower, or the overall mass “m” can be increased. However, it would usually be more sensible to reduce stiffness for smaller equipment.
f n = 1 / 2 π k / m
This leads to a major drawback regarding the stability of the platform. Mechanical limiters, as shown in Figure 4a, are required to prevent over-travel and to maintain stability. Although increasing the stiffness of limiters results in better stability, if the stiffness becomes too large, excessive shock load can result in increased acceleration, which can damage the equipment [5]. Secondly, the effectiveness of constrained layer damping is improved by increasing the distance between the constraining layer and neutral axis or by increasing the number or alternating viscoelastic and constraining layers. However, it requires the overall thickness to be increased or a complex attachment of an end of the constraining layer to the structural layer [6]. To solve this problem, the concept of the skin of a drum is used to support the load while limiting displacement and ensuring stability, and to improve vibration damping compared to conventional constrained layer damping, an auxetic layer is used to interface with regular layers.
The word auxetic derives from the Greek word auxetikos (αὐξητικός), which means ’that which tends to increase’. Auxetic material began with the proposal of a framework structure containing a negative Poisson ratio [7]. Auxetic materials have a negative Poisson’s ratio; as it is stretched, material perpendicular to the force direction expands instead of shrinking. Commonly developed auxetic structures are re-entrant, rotating, chiral, foldable types [8], and due to the non-convex structure of each unit, it buckles when compressed and extends when tensioned [9]. Auxetic materials possess high shear modulus [10]. The shear modulus of a material can be described as in Equation (3) below:
G = E 2 1 + υ
where “E” is the Young’s modulus and “ υ ” is the Poisson’s ratio. Hence, as the Poisson’s ratio approaches negative one, the shear modulus would increase towards infinity, which suggests that these structures exhibit high shear strength. Other properties that were studied include impact resistance [8,11,12], vibration isolation [13,14,15,16,17], vibration damping/reduced transmissibility [15,18,19], variable porosity [20], enhancement of indentation and compressive stiffness [11,18,21], thermal shock resistance [22,23], fracture toughness [24], increased strain [25], synclastic behavior [26,27,28], and electromechanical energy generation [29,30,31,32,33], which has useful applications in aerospace, automobile, medical, and military fields. Studies on electromechanical energy generation with auxetic structures involve the enhancement of stress and stress distributions within piezoelectric materials, improving piezoelectric effects. The unique mechanical properties of auxetic material and wide application make this structure popular for research. Similarly, an auxetic structure can be used to enhance constrained layer damping by increasing overall shear strain within viscoelastic layers.
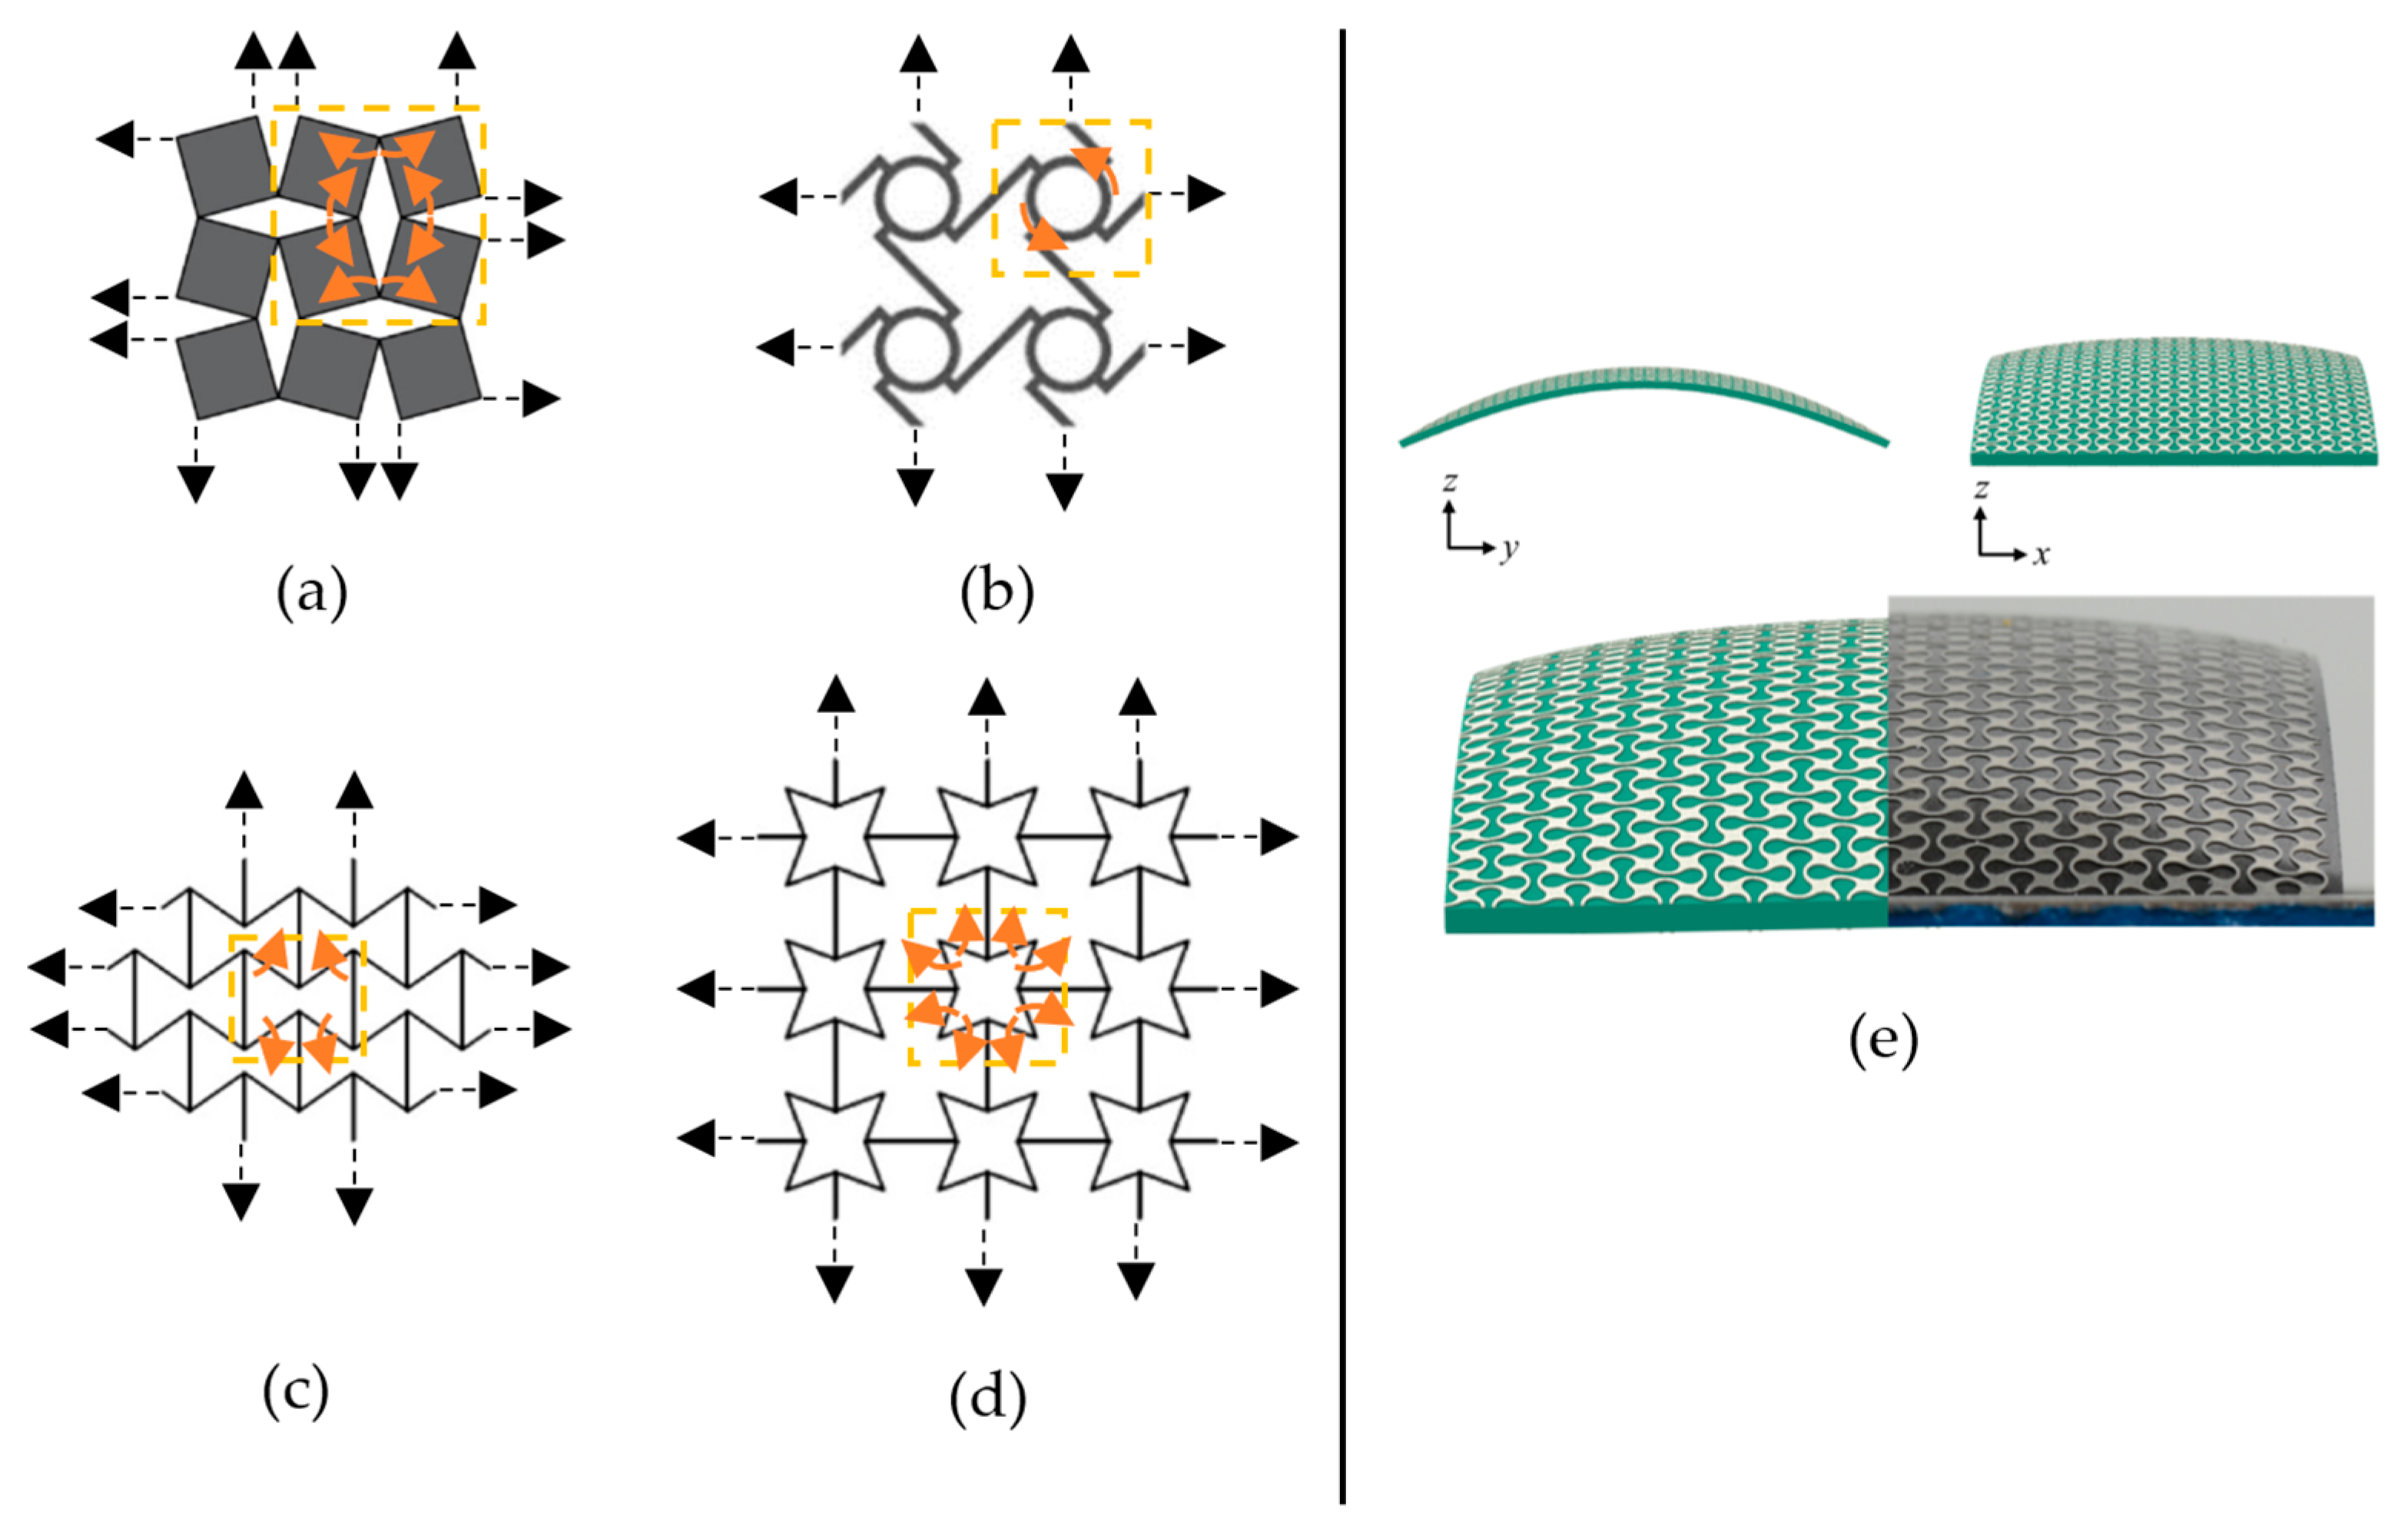
In this paper, to address the stability of passive dampers while maintaining a thin constrained layer damped sandwich, we report on the novel concept of the auxetic composite sandwich, developed to address the stability issue using the concept of a drum skin/trampoline to support the load in tension as it deforms axis-symmetrically, limiting displacement provided by tensile force from the constraining layers. As for damping, to increase relative displacement with the constraining layers, an auxetic layer is placed in the middle of the sandwich. The concept is based on individual units buckling or rotating as an auxetic structure is stretched along the plane of the auxetic structure, as illustrated in Figure 5a–d. As the structure is stretched out of plane along an axis, as illustrated in Figure 5e, due to having a negative Poisson’s ratio, the orthogonal axis would stretch in the same direction too, resulting in synclastic behavior. Hence, when combined with a regular surface, with a viscoelastic interface, the rotation of individual cells of the auxetic layer enhances shear deformation of the viscoelastic layer, enhancing energy absorption.
The sandwich structure has three parts: the constraining layer, auxetic layer and viscoelastic layer, each with different functions. The constraining sheets are used to bear the load of the payload, the auxetic sheet provides in-plane displacements, and the viscoelastic layer dissipates strain energy. As the edges of the constraining layer are held fixed, load to the constraining layer would result in an axisymmetric deformation.
The hypothesis of the concept is that, although the auxetic layer is fully adhered by the constraining layer, the relatively higher overall displacement of the sandwich, as compared to the individual facet, would generate sufficient force to generate shear deformation of the viscoelastic layer. The second hypothesis is that the overall axisymmetric deformation of the sandwich would result in small radial shear displacements in the viscoelastic layer from the rotation of the auxetic facets, which enhances damping performance.

2. Materials and Methods

2.1. Materials

The selection of the auxetic structure is based on biomimicry of structures of animals that are designed by nature to withstand impact and pressure, in a similar manner to the auxetic composite sandwich, such as cranial sutures, beaks, ammonoid and turtle shells. Suture joints are commonly found in biology, ranging from the micro to macro scale [36], as shown in Figure 6a–d. These bony structures are connected by collagen fibers and covered by a soft flexible skin. Cartilage in sutures of skulls of woodpeckers has the effect of buffering and absorbing vibration [37]. The waviness of sutures in woodpeckers and other birds such as chickens and toucans has been shown to reduce elastic wave propagation, and collagen in the beak significantly attenuates wave amplitudes [38]. Additionally, sliding keratin scales in beaks are designed for energy absorption [39]. Studies on cranial bone interfaces show that dynamic stress within bones rapidly reaches uniformity with higher strain energy when they are interdigitated, suggesting more uniform stress distribution and enhancing overall strength along the place of the sutures [40]. These sutures commonly form a trilinear intersection with three lines, allowing for compliance in the direction orthogonal to the plane, resembling the kirigami-type rotating triangle pattern, as shown in Figure 6e. Hence, through biomimicry, the rotating triangle auxetic structure mimics the cranial structure with a viscoelastic adhesive layer as a cartridge, and constrained with a constraining layer acting as a skin.
An illustration of the assembled auxetic composite sandwich is shown in Figure 7. It shows the layers of the sandwich and how the constraining layers are restrained to support the load. As the tensile modulus and stiffness of the viscoelastic layer and auxetic layers are relatively lower, it can be assumed that the majority of the load is borne by the constraining layers. Hence, the designed load for the sandwich can be based on the material modulus, thickness and width of the sandwich. On the auxetic layer, the Poisson’s ratio for rotating triangle is to be determined for its size or relative angles and how the auxetic composite sandwich can be evaluated for its effectiveness in dampening vibration.
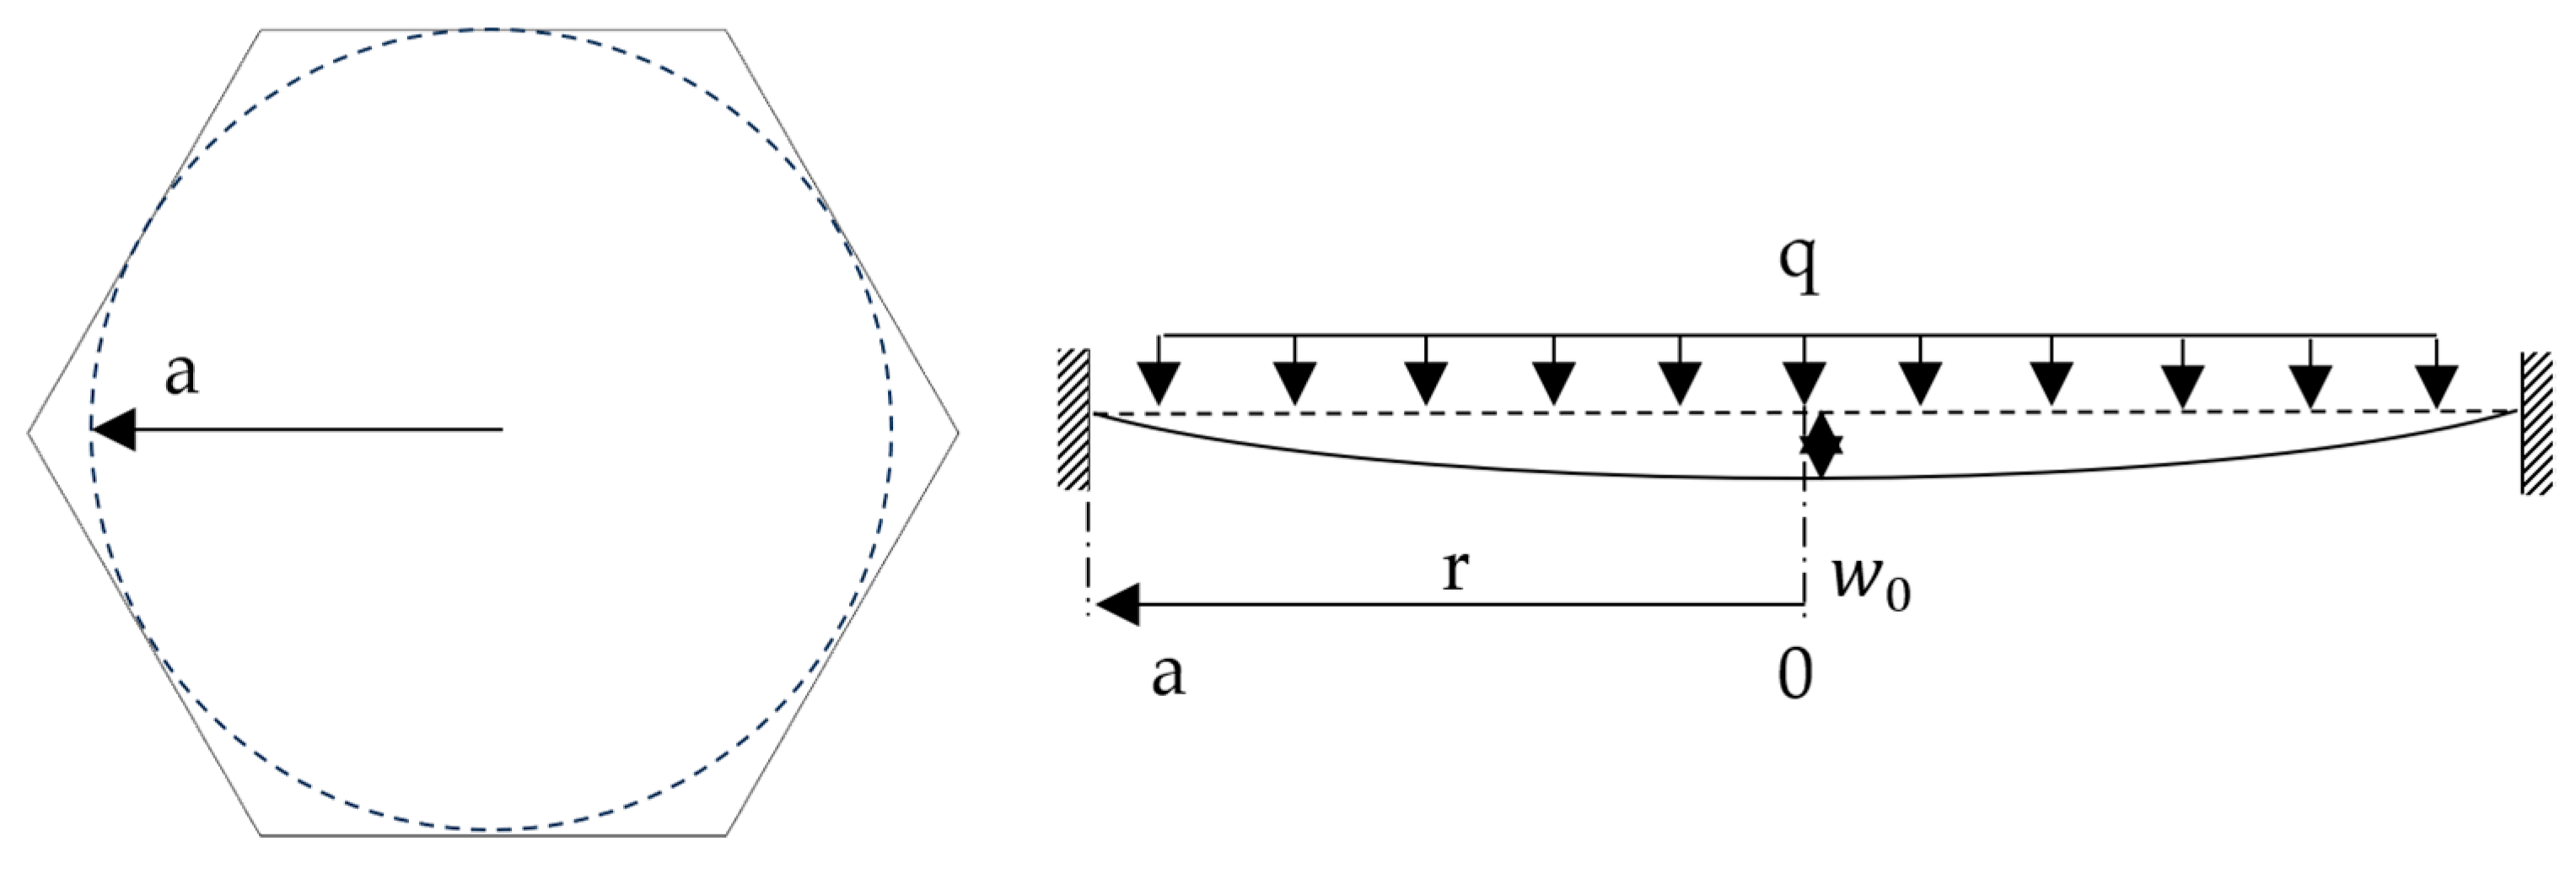
To determine the modulus and thickness of the constraining layers, a maximum displacement based on a plain circular disc of diameter equivalent to the distance across the flat hexagon, as illustrated in Figure 8, is used, and deflection of a clamped circular plate is predicted with reference to Ventsel and Krauthammer, 2001 [41].
Deflection of the plate can be represented by:
w = q 64 D a 2 r 2 2
The maximum deflection at the center “ w 0 ” of the plate of radius “ a ”, along the radius “r”, subjected to a uniformly distributed load “q”, with plate flexural stiffness,
D = E h 3 / 12 1 υ 2
where “E” is the Young’s modulus, “h” is the thickness and “ υ ” is the Poisson’s ratio. The modulus and thickness of the plate is determined based on the overall size of the sandwich and the desired deflection.
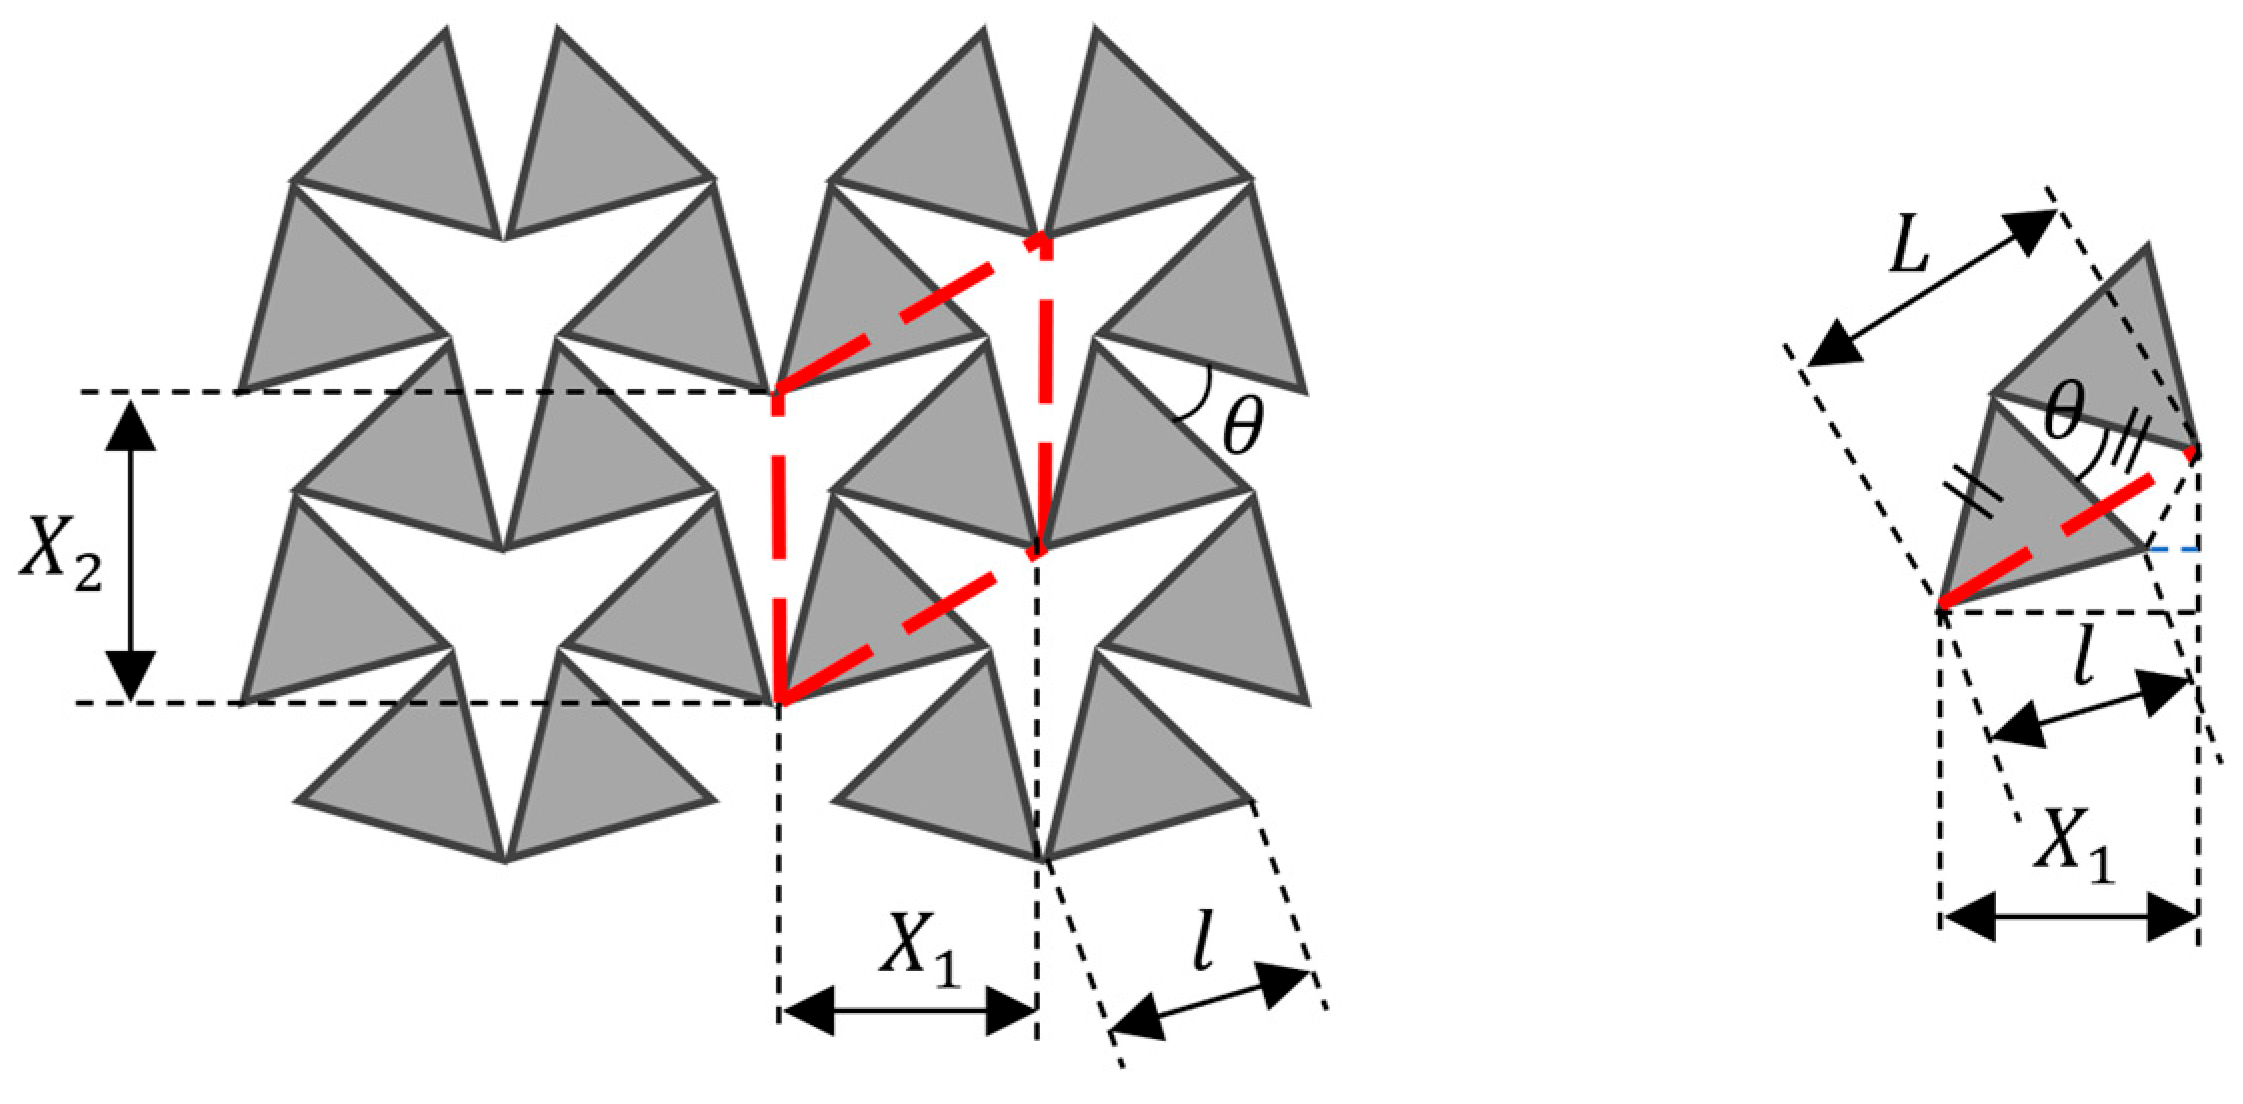
To determine if the size and angle of an auxetic composite would affect the Poisson’s ratio, referencing numerical studies conducted by Grima and Evans on auxetic behavior of rotating triangles [42], using an infinitesimal displacement, on a quadrilateral unit cell as shown in Figure 9, it can be shown that its Poisson’s ratio is independent of facet size and angle, with a consistent Poisson’s ratio of negative one.
Poisson’s ratio is given by:
ν 12 = d ε 2 d ε 1   a n d   ν 21 = d ε 1 d ε 2
where d ε 1 and d ε 2 are infinitesimally small strains in a unit cell.
d ε 1 = d X 1 X 1       a n d       d ε 2 = d X 2 X 2
Introducing strain and displacement with respect to θ :
d ε 1 d θ = 1 X 1 d X 1 d θ           a n d         d ε 2 d θ = 1 X 2 d X 2 d θ
Therefore, the horizontal and vertical strains with respect to the rotation are as follows:
d ε 1 = 1 X 1 d X 1 d θ d θ
and
d ε 2 = 1 X 2 d X 2 d θ   d θ
Consider the projection of X 1 and X 2 of the unit cell.
Let X 2 = L ; hence, X 1 can be expressed as:
X 1 = L   s i n π 3 = L 3 2
Hence, substituting Equation (10) into (8) and (9), where L = d L / d θ :
d ε 1 = L 3 2 1 3 2 L   d θ = L L d θ
and
d ε 2 = 1 L L   d θ = L L d θ
Since d ε 1 = d ε 2 , the Poisson’s ratio of the rotating equilateral triangles is as follows:
ν 12 = ν 21 1 = 1

2.2. Analytical Methods

To quantify the performance of the composite sandwiches, the overall shear strain and total strain energy generated during maximum displacement at the center of the sandwich is obtained from Ansys Mechanical for comparison. Loss factor “ η s ” is tabulated with the energy stored per cycle “ U s ” taken from the strain energy and the energy dissipated per cycle taken from damping energy “ D s ”:
η s = D s 2 π U s .
Shear displacement between the auxetic sheet and constraining sheet can be indirectly quantified and the dynamic property of the composite sandwich determined by the transmissibility and damping ratio.
Transmissibility is evaluated by the ratio of the response amplitude to the excitation amplitude, which is evaluated using the following formula expressed in dB:
T i = 20 l o g 10 a r a e
where “ a r ” is the response amplitude and “ a e ” is the excited amplitude in the z direction, perpendicular to the excited plane.
To further study the damping performance of the prototypes during free vibration, the logarithmic decay of the harmonic response is used to determine the reduction in successive peaks and troughs during the free vibration period given by:
δ i = l n x i x i + 1
where “ x i ” is an arbitrarily selected peak or trough and “ x i + 1 ” is the next peak or trough.
The average logarithmic decay can also be determined with the number of successive pairs n :
δ a v g = Σ δ i n 1
The average damping ratio “ ζ a v g ” of the composite can then be evaluated using the following:
ζ a v g = δ a v g δ a v g 2 + 2 π 2
The determined damping coefficient in terms of damping ratio “ ζ ” and critical damping coefficient c c is given by:
c = ζ c c = ζ 2 ω n m
where
n a t u r a l   f r e q u e n c y   ω n = ω d 1 ζ 2
d a m p e d   n a t u r a l   f r e q u e n c y   ω d = 2 π f = 2 π 1 T d

2.3. Finite Element Analysis

Models are designed using SolidWorks and FEA is performed using Ansys. The model is constrained at the edge of each top and bottom constraining layer, as shown in Figure 7b; a mass is applied to the middle to represent the accelerometer attached to the middle of the model and force is applied through an acceleration to the model. Tetrahedron elements are used for the viscoelastic layers to address its Poisson’s ratio of 0.499 and other mesh parameters are shown in Table 1.
For comparison, three models were modeled based on the size of a single auxetic unit; each model has a different middle layer, as shown in Figure 10. The three models are a plain model for conventional constrained layer damping, a non-auxetic model with all hinges at the outer corner and an auxetic model. The non-auxetic model is selected for its axisymmetric design and the plain model represents a conventional constrained layer damping design.
The width of the models is 49.75 mm (across flat), with 0.5 mm thick acrylonitrile butadiene styrene (ABS) auxetic sheet, 0.1 mm thick high-density polyethylene (HDPE) constraining layer and 0.25 mm thick 3M VHB5908 acrylic foam permanent bonding tape for the viscoelastic layer. Both 3M VHB 5908 and VHB G23F are acrylic foam structural tape, and due to the similarity, the viscoelastic property is modeled with Prony series, as shown in Figure 11 [43]. Relative moduli refer to the ratio of instantaneous modulus to modulus at time infinity. ABS and HDPE material properties of the sandwich, listed in Table 2, are taken from average values from MatWeb, and the ABS mid-interlayer is printed with a Flashforge adventure 5M pro.
The thickness of the auxetic sandwich was varied from 0.125 mm to 4 mm to study the quality of displacement in the radial and tangential direction. A single sandwich unit was subjected to a ramped acceleration of 10 g, over a duration of 0.05 ms, and the radial and tangential displacements of the top and bottom of open and close slits are studied. The location of the slits and the expected tangential displacements are shown in Figure 12, as the top face is deformed into a convex shape.
The modeling considered the attachment of an accelerometer, and the edges of both constraining layers as fixed. Accelerations for static analysis were applied with a ramp profile of 0.05 ms and dynamic analysis was performed with a modified sinusoidal acceleration, as shown in Table 2. The impulse acceleration, as shown in Figure 13, was applied, where A is the applied acceleration and Τ is the duration of the impulse. When subjected to a 10 g acceleration, with a larger accelerometer Kistler—8786A5, a force of 0.4 N would be applied to the constraining layer. A thickness of 0.15 mm is desirable for the HDPE constraining layer with a maximum displacement of 1.1 mm subjected to a 1.8 N force, as shown in Figure 14; however, due to the availability of HDPE sheets of 0.1 mm thickness, 0.1 mm is selected for the constraining layer.

2.4. Experimental Study

Three models were studied for comparison: a plain model, a non-auxetic model and an auxetic model. Three tests are performed for each condition and data with the least noise are used. Prototypes are mounted to a voice coil setup and accelerated aggressively downwards to determine the damping performance and settling time. Details of the accelerometer are shown in Table 3. The middle layers of all 3 models were 3D-printed ABS, and HDPE sheets were adhered together using a viscoelastic 3M VHB 5908 Permanent Bonding Tape. The HDPE sheet was first laid flat on a table and the VHB tape 3M 5908 was applied to the HDPE sheet. The middle layer was then adhered to the other side of the bonding tape and the edges of the HDPE sheet were then trimmed along the boundary of the middle layer. The same was repeated to the other side to complete the prototype. After pressing the layers together, an average thickness of 1.55 mm, measured with a Vernier caliper, was obtained for all models. Fabricated pictures of the models are shown in Figure 15. Measured weights of the prototypes are 2.85 g, 2.70 g and 2.80 g for the plain, non-auxetic and auxetic models, respectively, giving a combined mass of model and accelerometer as shown in Table 4.
Each prototype was held in a 3D-printed ABS holder, with a lid tightened over the prototype using screws at each of the six corners. The base of the holder adheres to the end of a voice coil using wax. Prior to placing the prototype into the holder, an accelerometer was adhered to the top surface of the prototype along the axis of symmetry according to iso-10846-2, as shown in Figure 15d.
Two experiments were performed, and the schematic of the first experiment is shown in Figure 16. It consists of an aluminum frame structure resting on four pieces of 2.5 mm shore 70 Sorbothane shock absorbing pads, and the aluminum frame structure is placed on top of a steel table supported by legs with elastomer pads. The heavier Kistler accelerometer (8786A5), weighing 21.18 g, and fixture assembly are then adhered to the voice coil using wax. Motion of thevoice coil was controlled by an ACS motion controller (SPiiPlusEC) and ACS drive module (UDMmc), and parameters were entered and monitored through an ACS SPiiPlus MMI interface.
The voice coil was set up with an aggressive motion through manual tuning of the PID for an abrupt deceleration at the end of stroke. The motion profiles for various accelerations from 0.5 g to 4 g are listed in Table 5. To minimize free vibration from the motor, readings were taken at the retracted position. Measurements of the voice coil are conducted through a PC interface (SPiiPlus MMI interface, ACS, Israel) and the accelerometer uses a digital oscilloscope (Tektronix TBS 1102B, USA). The data readings were acquired using a PC interface (Tektronicx OpenChoice Desktop, USA). A power supply/coupler Kistler Type 5134B was also used, with its gain set to 1.
In the second experiment, the fixture was adhered onto a large granite table using wax, shown in the schematic of the setup in Figure 17. A nylon mallet is used to generate an impulse. Two accelerometers (Kistler 8640A5) were used, weighing 3.5 g each, with a sensitivity of 1071 mV/g attached to the center of the prototype and the other accelerometer with a sensitivity of 943 mV/g attached to the granite table beside the fixture. Impulse accelerations between 1.1 and 1.85 g were applied to the granite table using a nylon head mallet. Signals from the accelerometers were fed into a DAQ (data acquisition) unit (USB2405(G)-0060), ADLINK, Taiwan) and data were collected using a software (U-Test version 18.11.1105.0, ADLINK, Taiwan). The DAQ is set to single shot, acquiring at a sampling rate of 4000 Hz and a total of 128,000 scans, giving an acquisition window of 2 s, capturing frequencies up to 2000 Hz. Data from both tests were studied, using MATLAB (R2023a—9.14.0.2286388) to obtain their settling times, damping ratios, and FFT plots.

3. Results and Discussion

3.1. Numerical Simulation

The selection of the auxetic thickness is based on the expectation that the convex surface should exhibit overall positive displacements at the open slit and negative displacements at the closed slit. The concave surface should exhibit negative displacement at the open slit and positive displacement of the closed slit. As the thickness is reduced to 0.5 mm and below, tangential displacements of the open slits at both top and bottom surfaces are negative, as shown in Figure 18 for the convex surface and Figure 19 for the concave surface. This suggests that when the thickness is too low, the auxetic structure contracts, like how a cone has a smaller circumferential distance as compared to a flat disk. The averaged displacements of the slits in the circumferential direction and radial direction are shown in Table 6 and Table 7, respectively, with the maximum absolute values in bold, showing that a thickness of 1 mm would allow for maximum radial and tangential displacements. However, 0.5 mm was selected to avoid having stiffness too high in the plain and non-auxetic models.
The results of modal frequencies show displacement of the model with transverse displacements. The first mode of each model shows the deformation of the auxetic sheet, flexing in a concave/convex manner, as shown in Figure 20(a1–c1), and the results are shown in Table 8. The lower frequencies of the non-auxetic and auxetic models are due to their lower stiffness.
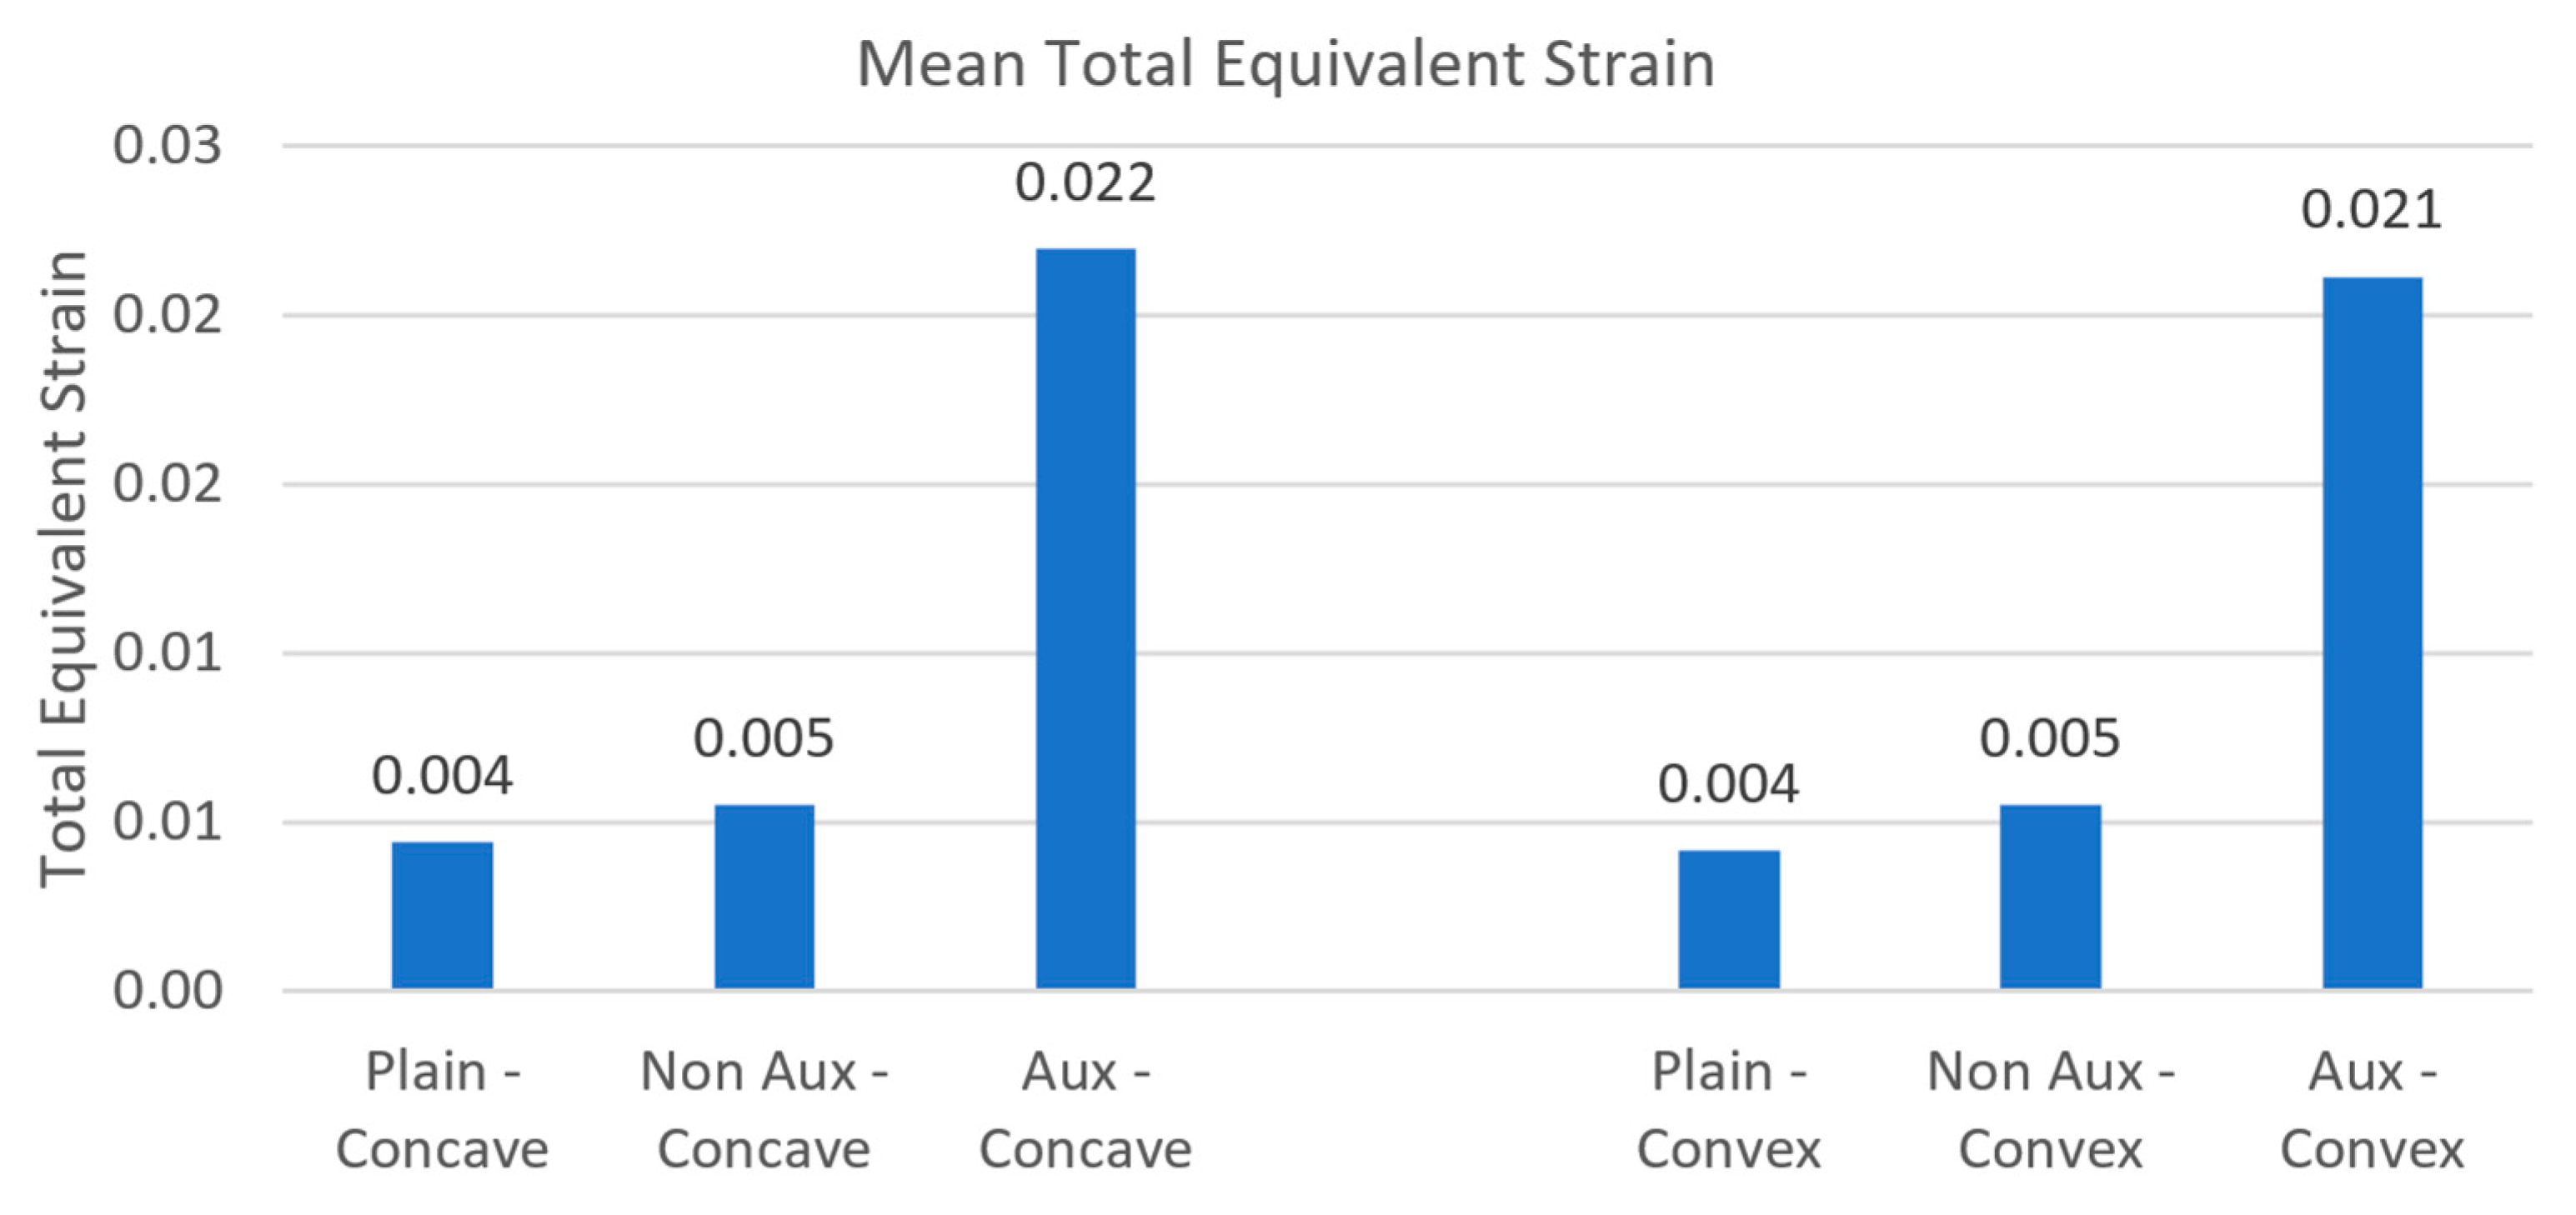
Comparing the three models, the overall shear displacement of the auxetic model is larger as compared to the plain and non-auxetic models. A larger outward radial displacement of about 8 μm and inward displacement of about 5 μm is achieved on the auxetic models, shown in Figure 21(c1), which was slightly more than twice the non-auxetic model, as shown in Figure 21(a1,b1). tangential displacements of the auxetic layer are also larger, with 5 μm in the clockwise direction and anticlockwise direction, as shown in Figure 21(c2), an order larger than the plain model. The equivalent total strain of the viscoelastic layers reflects the results of the radial and tangential displacement by the mid-interlayer. The average total strain of the auxetic model, as shown in Figure 22(c1), was an order higher than the plain and non-auxetic models, shown in Figure 22(a1) and (b1), respectively, suggesting a better distribution of strain in the viscoelastic layers. The graphical comparison of the mean total equivalent strain shown in Figure 23 shows a significant 4.2 to 5.5 times higher average strain within the viscoelastic layer in the auxetic model, as shown in Figure 23. The maximum total equivalent strain is also 11.7 to 4.3 times higher, as shown in Figure 24.
A slightly higher overall strain energy of the total viscoelastic layer in Figure 22(c2) as compared to the plain and non-auxetic model in Figure 22(a2,a3) is evidence of better energy absorption with an auxetic interlayer from this static study.
To better understand the strains experienced by the viscoelastic layer from the relative displacement between the min-interlayer and constraining layer, shear strain in the r-θ (radial and circumferential displacement) and θ-z (circumferential and vertical displacement) are evaluated. Both viscoelastic layers are observed separately, where the convex side refers to the entire viscoelastic layer facing the convex deformation of the sandwich and vice versa. The higher r-θ shear strain across all models shows that relative displacement on the convex side shows better relative displacement with the constraining layer on the concave side of all models. We can also see that the average r-θ shear strain of the auxetic model is the highest, two orders higher than the plain model, one order higher than the non-auxetic model on the convex side, as shown in Figure 25(c1), and on the concave side, one order higher than both plain and non-auxetic models for the viscoelastic layer, as shown in Figure 25(c2). Between the convex and concave sides, the difference is smaller as compared to the other models. Shear strain in the r-θ on the viscoelastic layers of the auxetic model is generally negative, which means that the angle between the line along the radius pointing outwards and tangential to the tangential line in the clockwise direction becomes smaller from the rotation of the auxetic layer. Visually, it can be seen from Figure 25(c1,c2) that the distribution of r-θ shear strain is better distributed across each facet (triangular) as compared to the non-auxetic and plain models. The higher r-θ shear strain in the auxetic model is evidence of an effective rotation displacement of the mid auxetic interlayer over the other models.
As for shear strain in the θ-z direction, the auxetic model generates an average strain of an order of magnitude higher than the plain and non-auxetic models, as shown in Figure 25(c3). The higher θ-z shear in the auxetic and non-auxetic models is due to the slits in their mid-interlayer and bending of the facets, which generates shear strain in the viscoelastic layers in the circumferential direction. On the concave side, the auxetic model has 6 and 5 times higher θ-z strain as compared to the plain models in Figure 25(a3) and non-auxetic models in Figure 25(b3).
To quantify the strain distribution within the viscoelastic layers, the cumulative distributed function plot of the viscoelastic layers of the three models is shown Figure 26. For comparison across all models, the ratio of the maximum total equivalent strains of the viscoelastic layers on the convex and concave sides is used. The plots of the viscoelastic layers of the auxetic model have the fastest approach to a cumulative probability of one, where the concave side has the best distribution. The non-auxetic model has a slightly poorer distribution, with a comparatively better distribution on the convex side, and the plain model has the worst distribution. Better strain distribution across the viscoelastic layers not only reduces localized strain of the viscoelastic layer, but also better energy distribution, which is beneficial to improving damping performance.
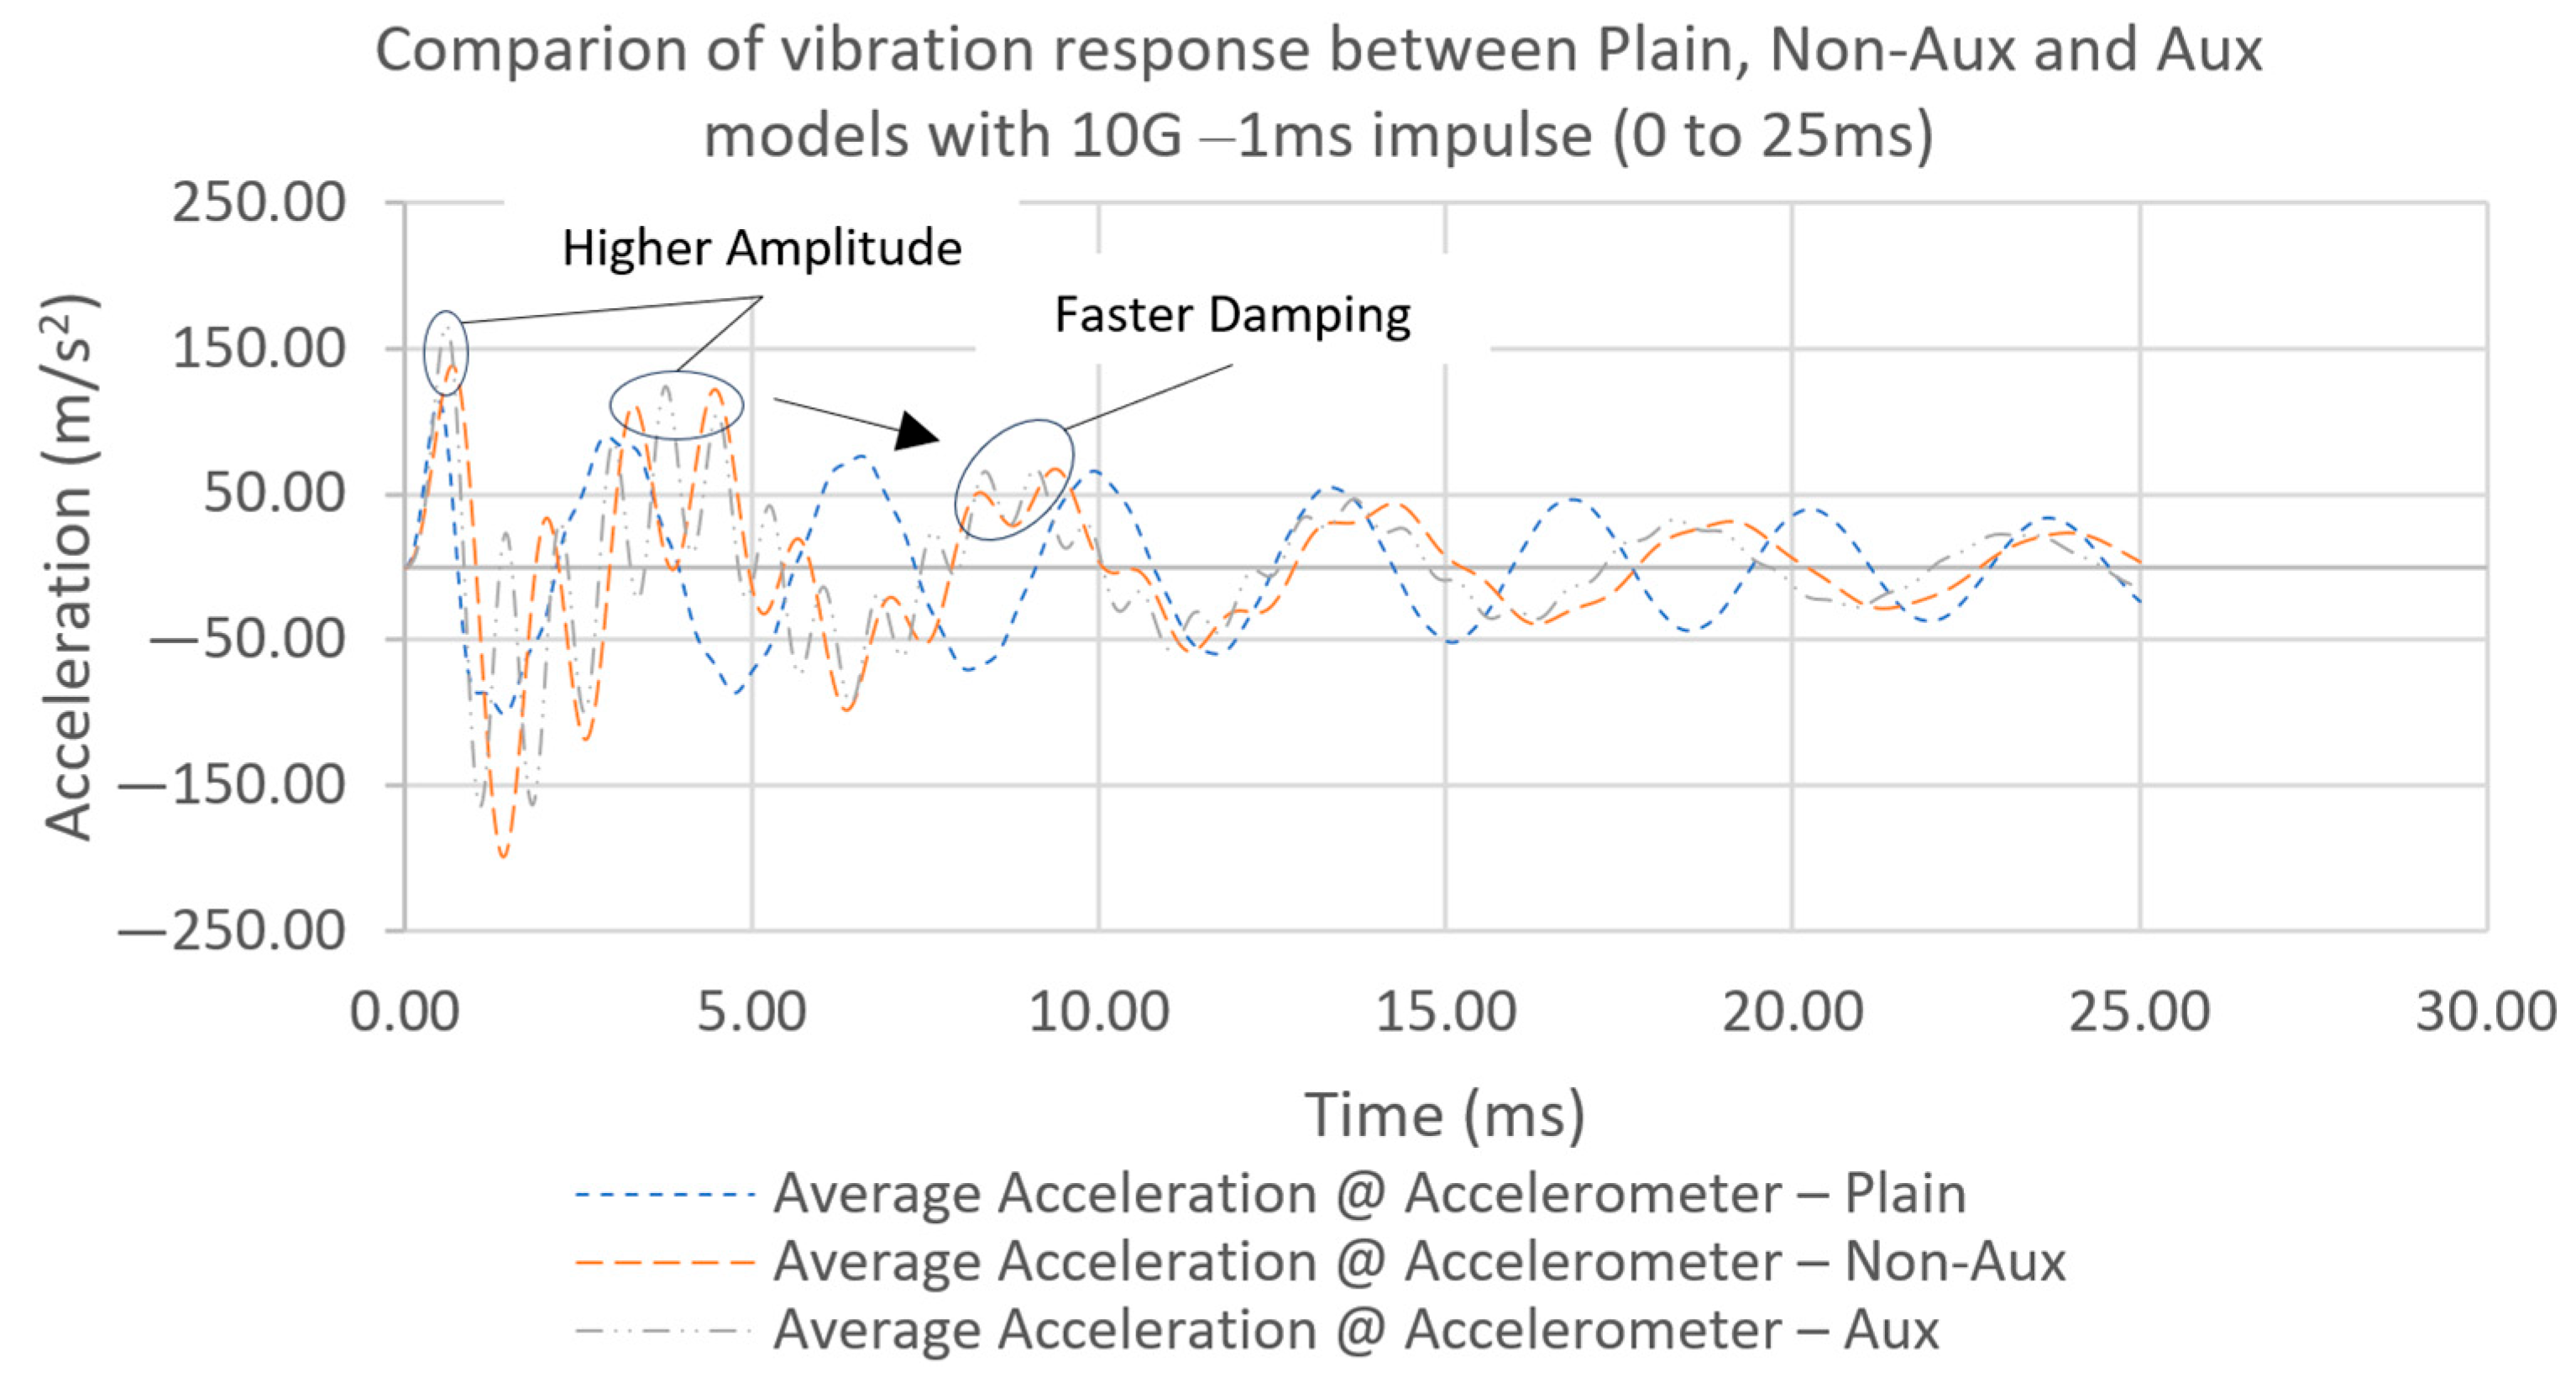
Transient study with a 10 G impulse applied within a 1 ms duration applied to the three models and the result of the response from 0 ms to 25 ms, 25 ms to 85 ms and 85 ms to 150 ms are shown in Figure 27, Figure 28 and Figure 29, respectively. Both auxetic and non-auxetic models showed slightly higher accelerations during the impulse period; however, they begin to decay faster during the free vibration period as compared to the plain model. The overall damping ratios of the auxetic and non-auxetic models are 1.82 and 1.78 times higher, as compared to the plain model, resulting in a settling time of the auxetic model slightly lower than that of the non-auxetic model, as shown in Table 9 and the plot in Figure 30. Settling time to 1 g from the non-auxetic and auxetic models is −25.6% and −27.8% faster, and the time reducing to 0.1 g from the non-auxetic and auxetic models is −18.1% and −20.5% faster, as compared to the plain model.
The average damping ratios of the auxetic and non-auxetic models are close; however, the auxetic model has a slightly lower settling time. Taking a closer look at the instantaneous damping ratio over the vibration duration shown in Figure 31, the auxetic and non-auxetic models have a significantly higher damping ratio at the beginning of the vibration, which can be explained by higher vibration amplitudes, contributing to higher displacement of the facets. As for the auxetic model, momentary peaks in damping ratio at the beginning explains the further reduction in acceleration amplitudes over the non-auxetic model.

3.2. Experiment

In the first experiment, raw results captured during the test showed noise with acceleration peaks of 0.2 g introduced by the voice coil; hence, a window of 0.25 g for a duration of 0.05 s was used to compare settling times.
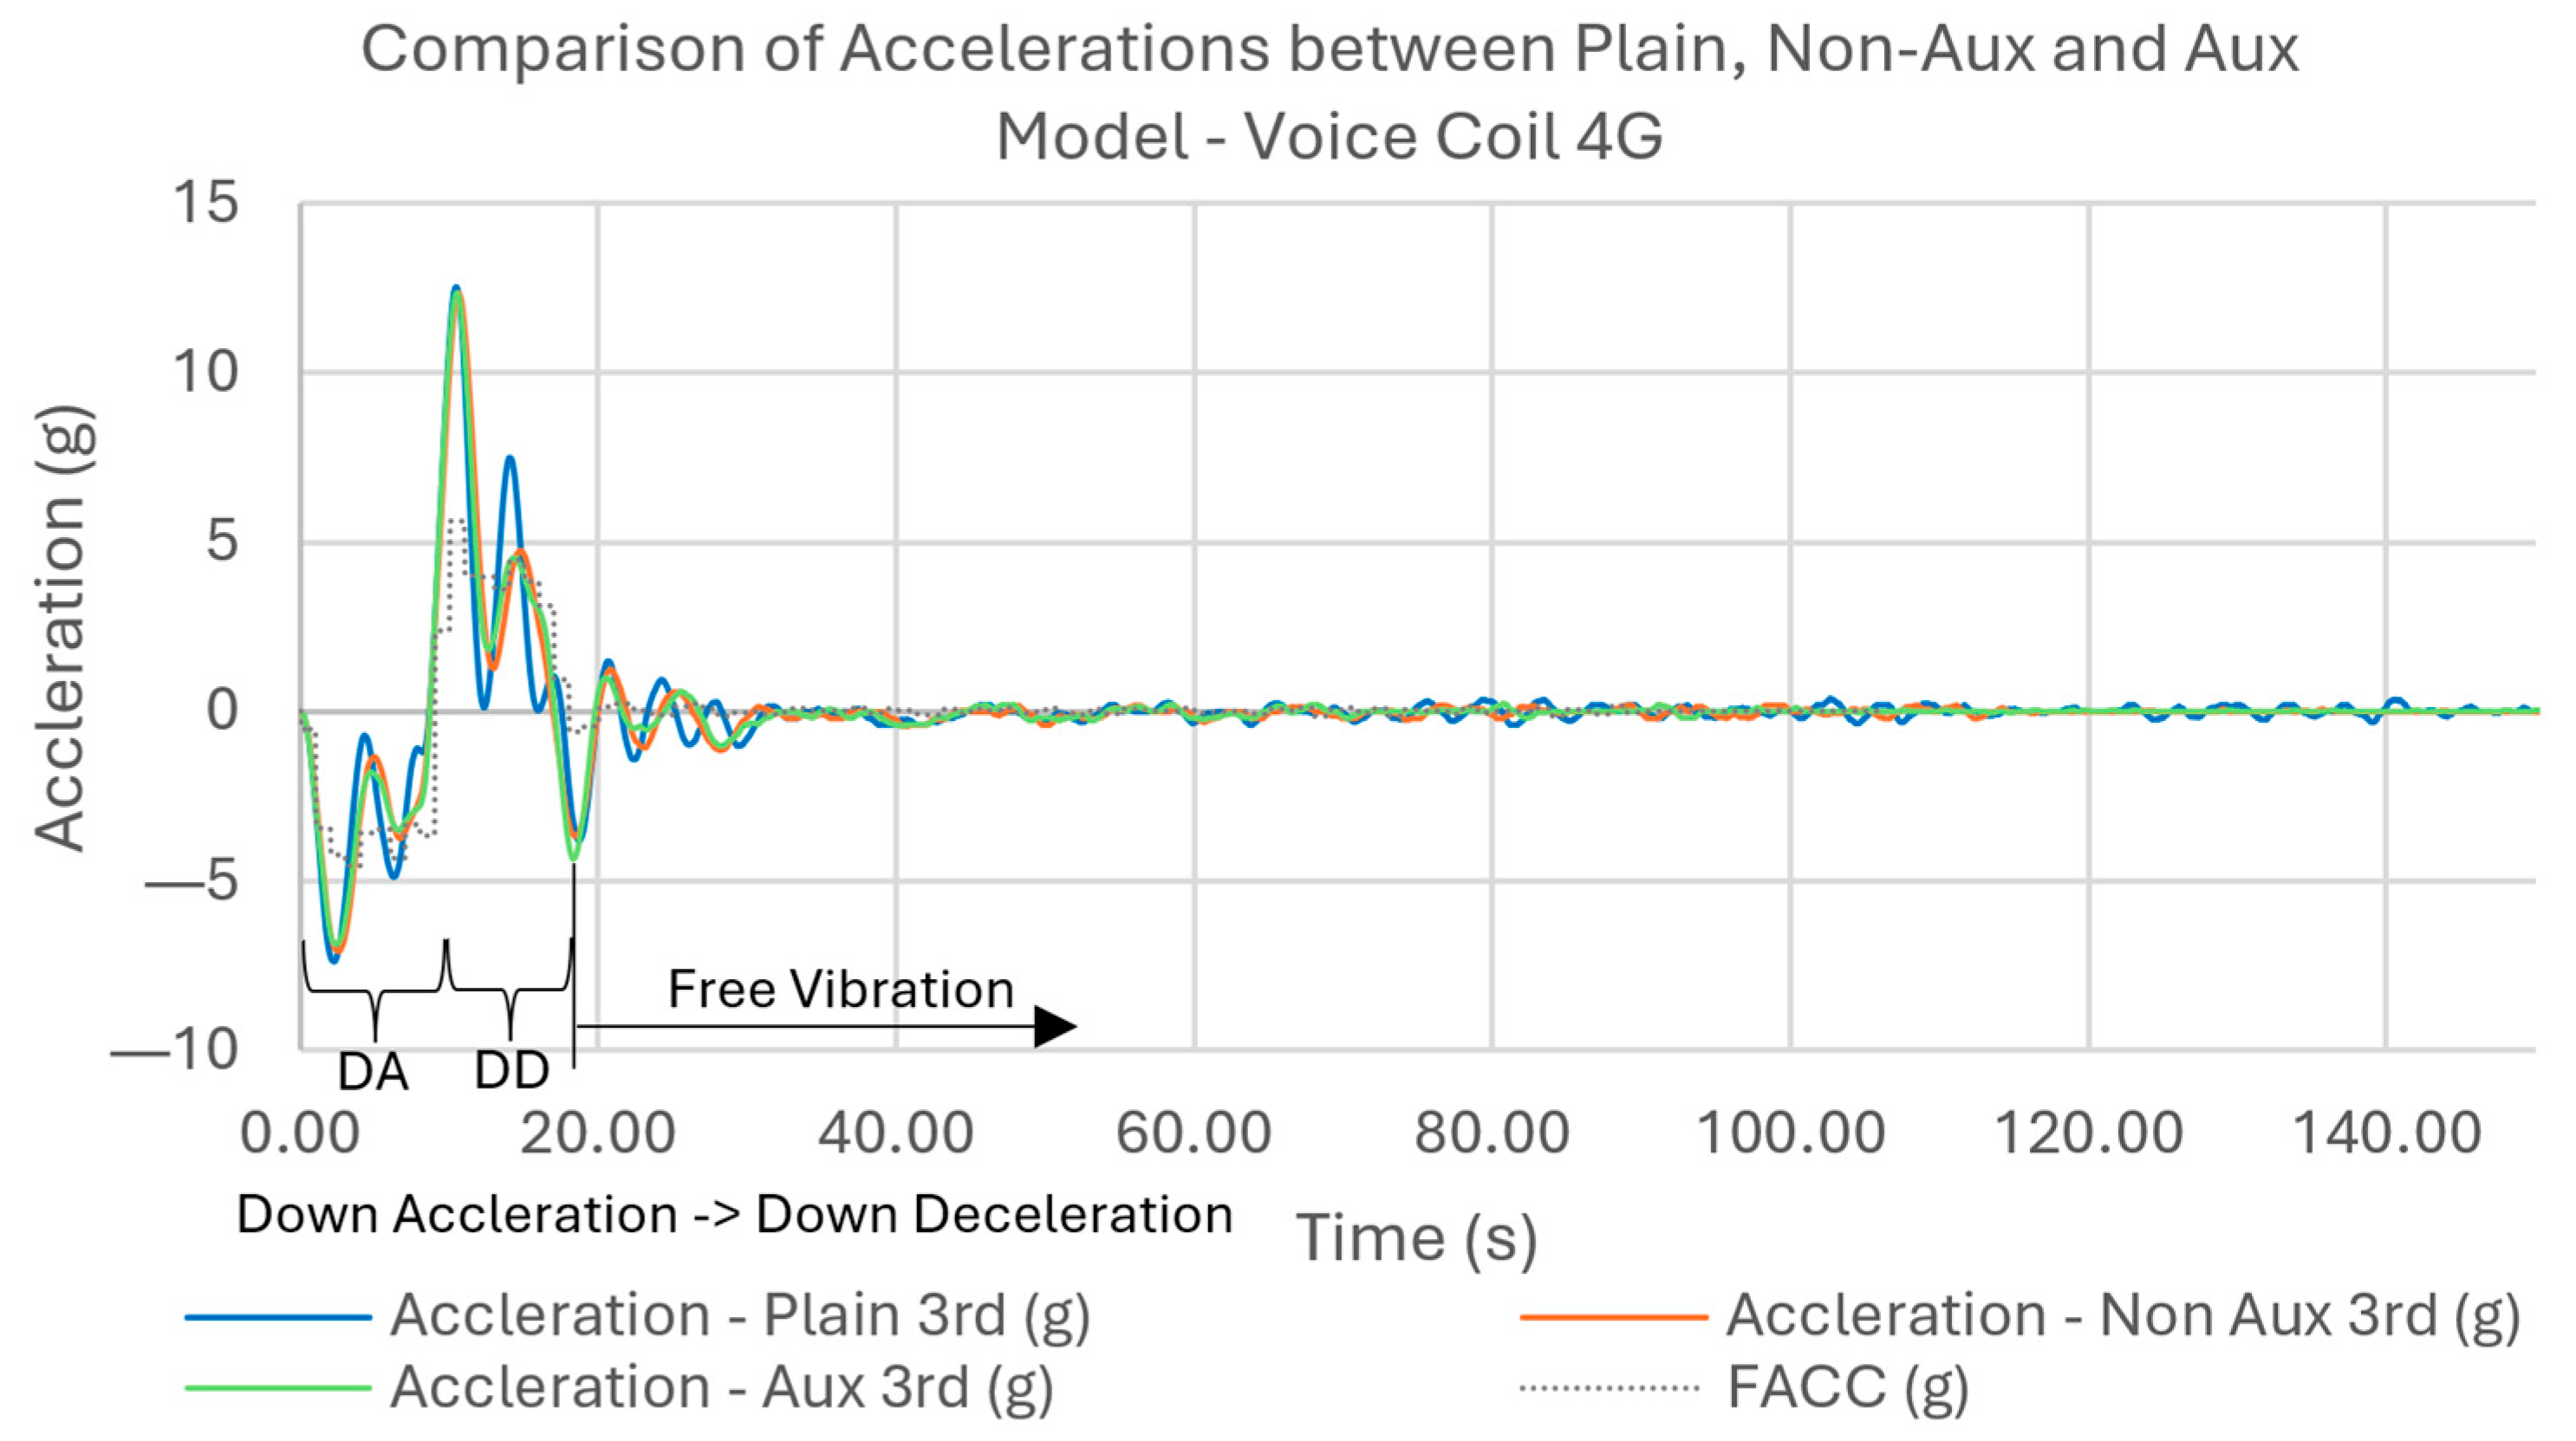
Figure 32, Figure 33, Figure 34, Figure 35 and Figure 36 show the acceleration responses of the prototypes subjected to accelerations from 0.5 g, 1 g, 2 g 3 g and 4 g, respectively. Regions of downward acceleration and downward deceleration are labeled DA and DD, as illustrated in the figures, and the free vibration region is selected for the tabulation of damping ratio. Successful peaks and valleys are selected in the free vibration region and the average logarithmic decrement is used to tabulate the damping performance. Prior to free vibration, during the actuation, vibration amplitudes of the non-auxetic and auxetic parts decay faster than in the plain model. In the plots, the amplitudes of the acceleration of the vibrations in the DA and DD regions follow the acceleration of the voice coil (FACC) closely, reflecting an improved damping performance over the plain model. An increasing improvement is also observed as acceleration increases, suggesting that damping performance increases with an increasing deformation.
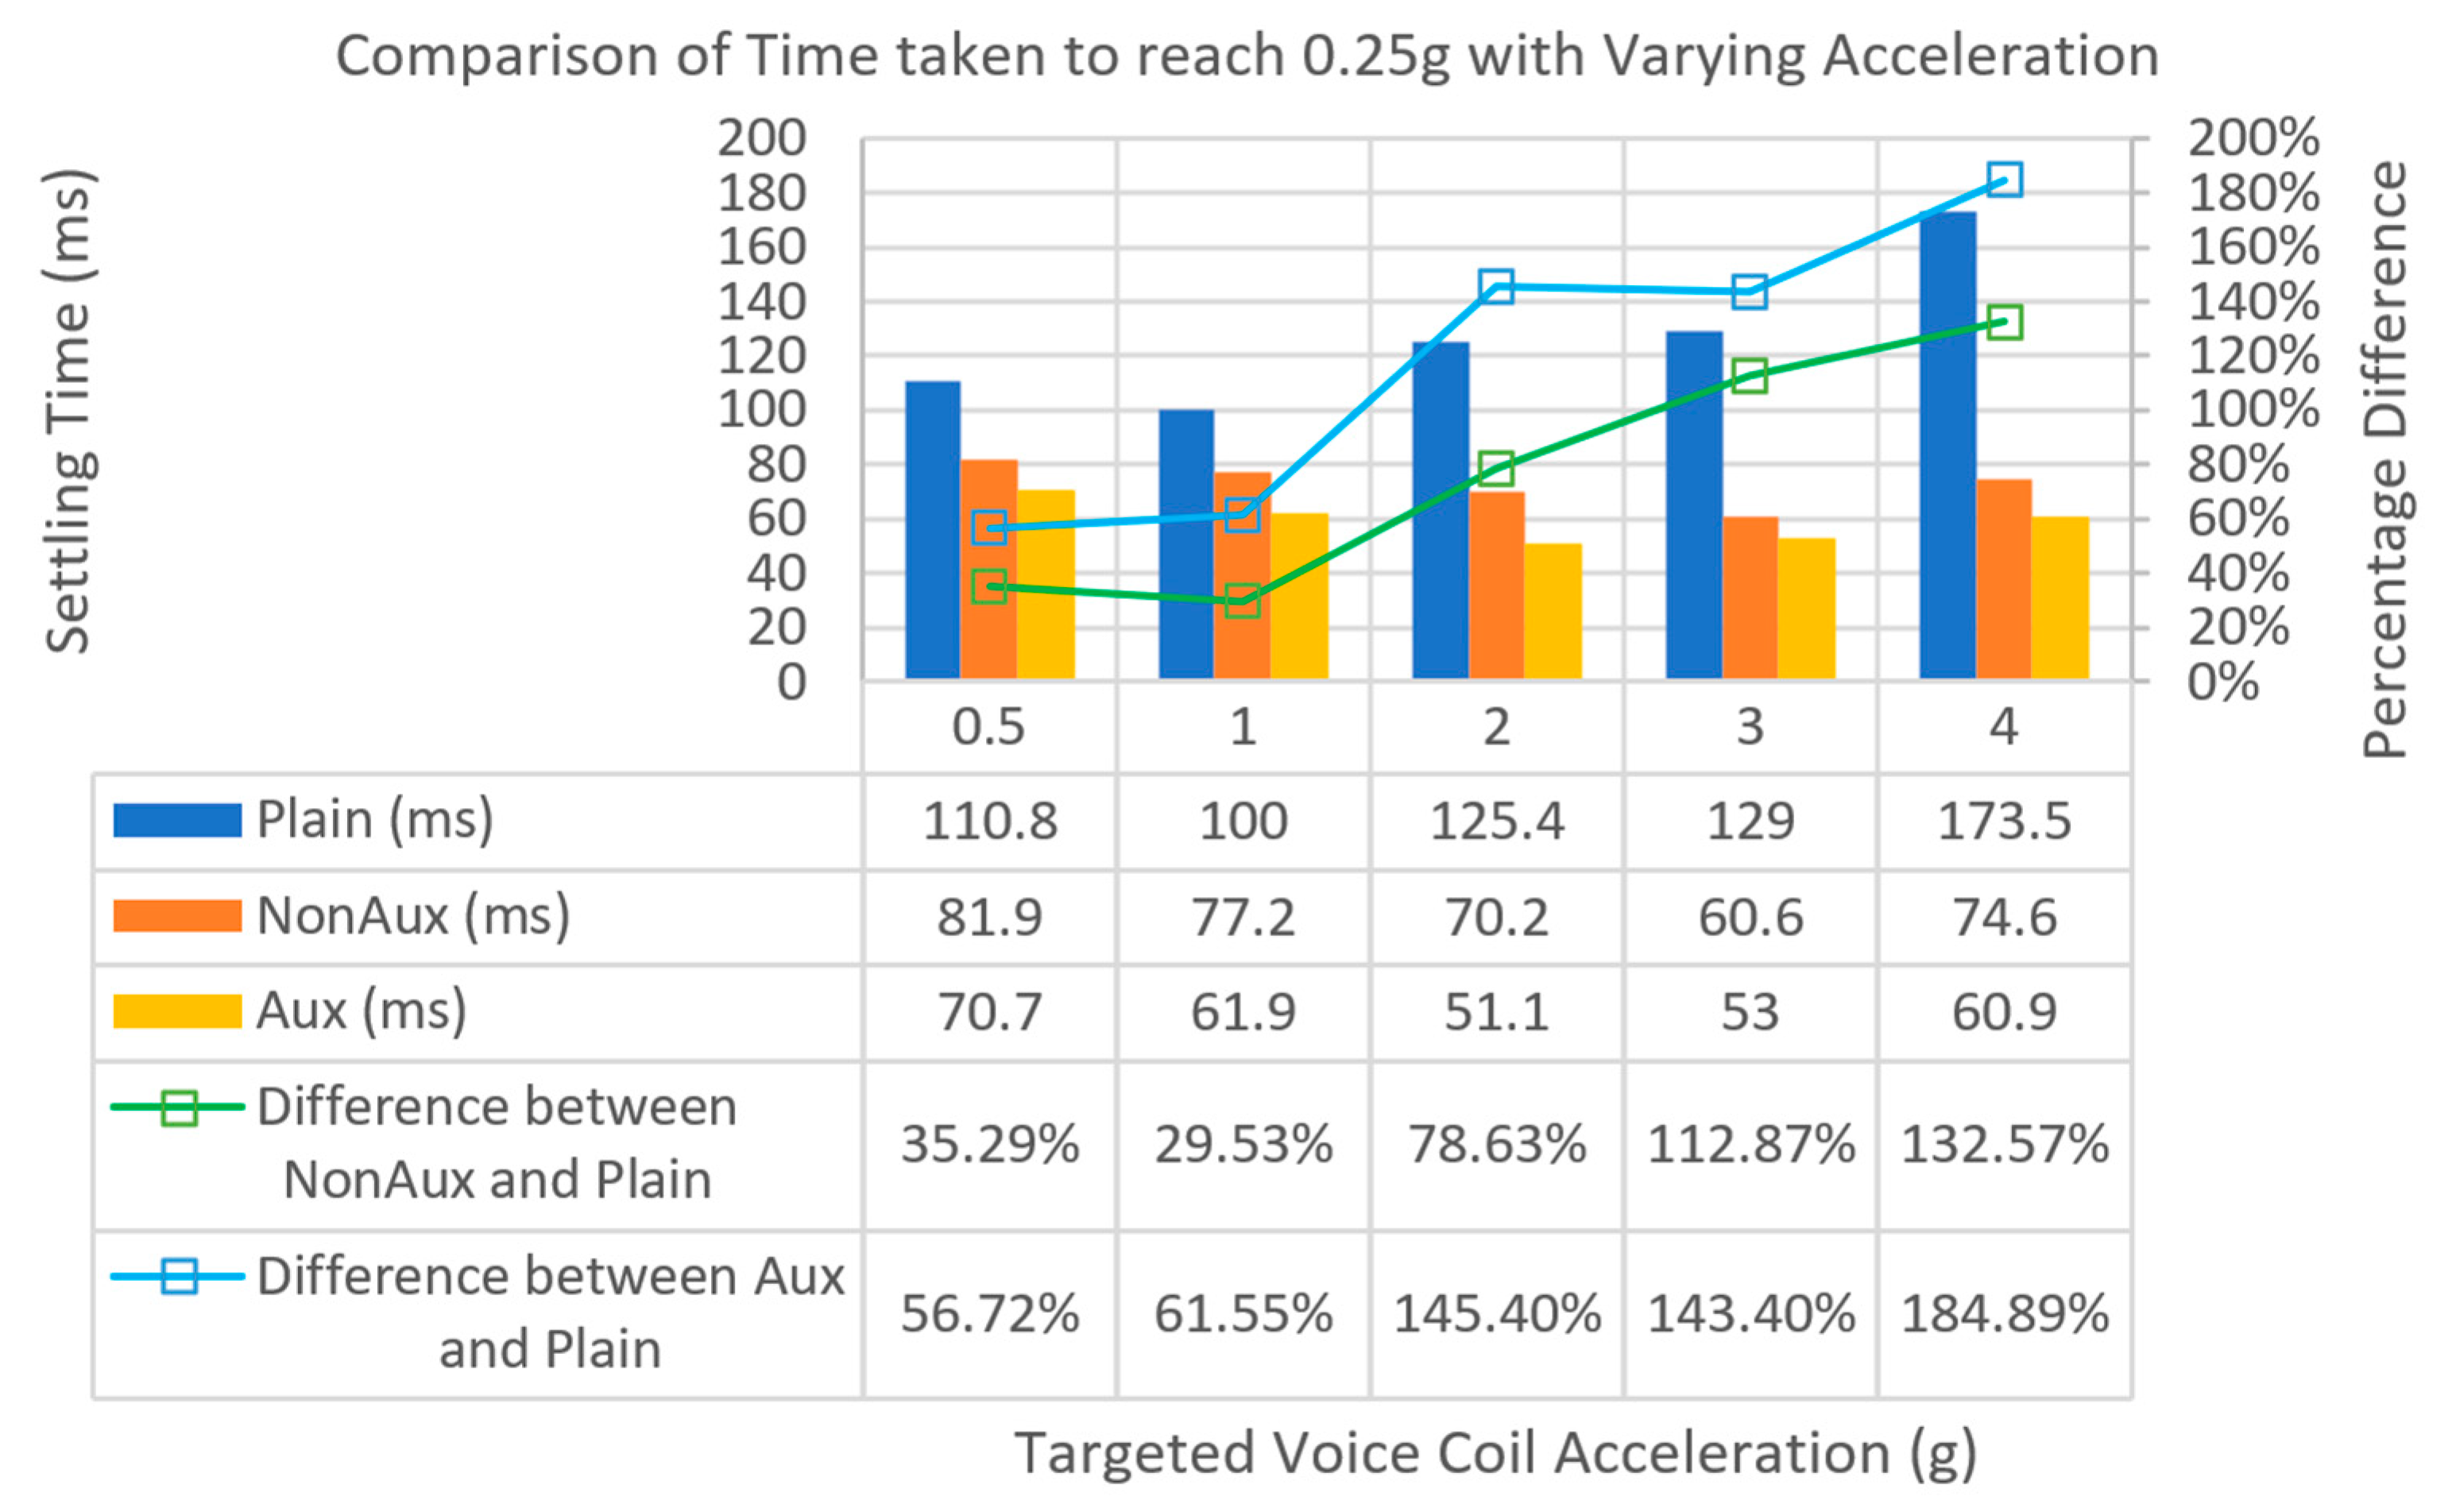
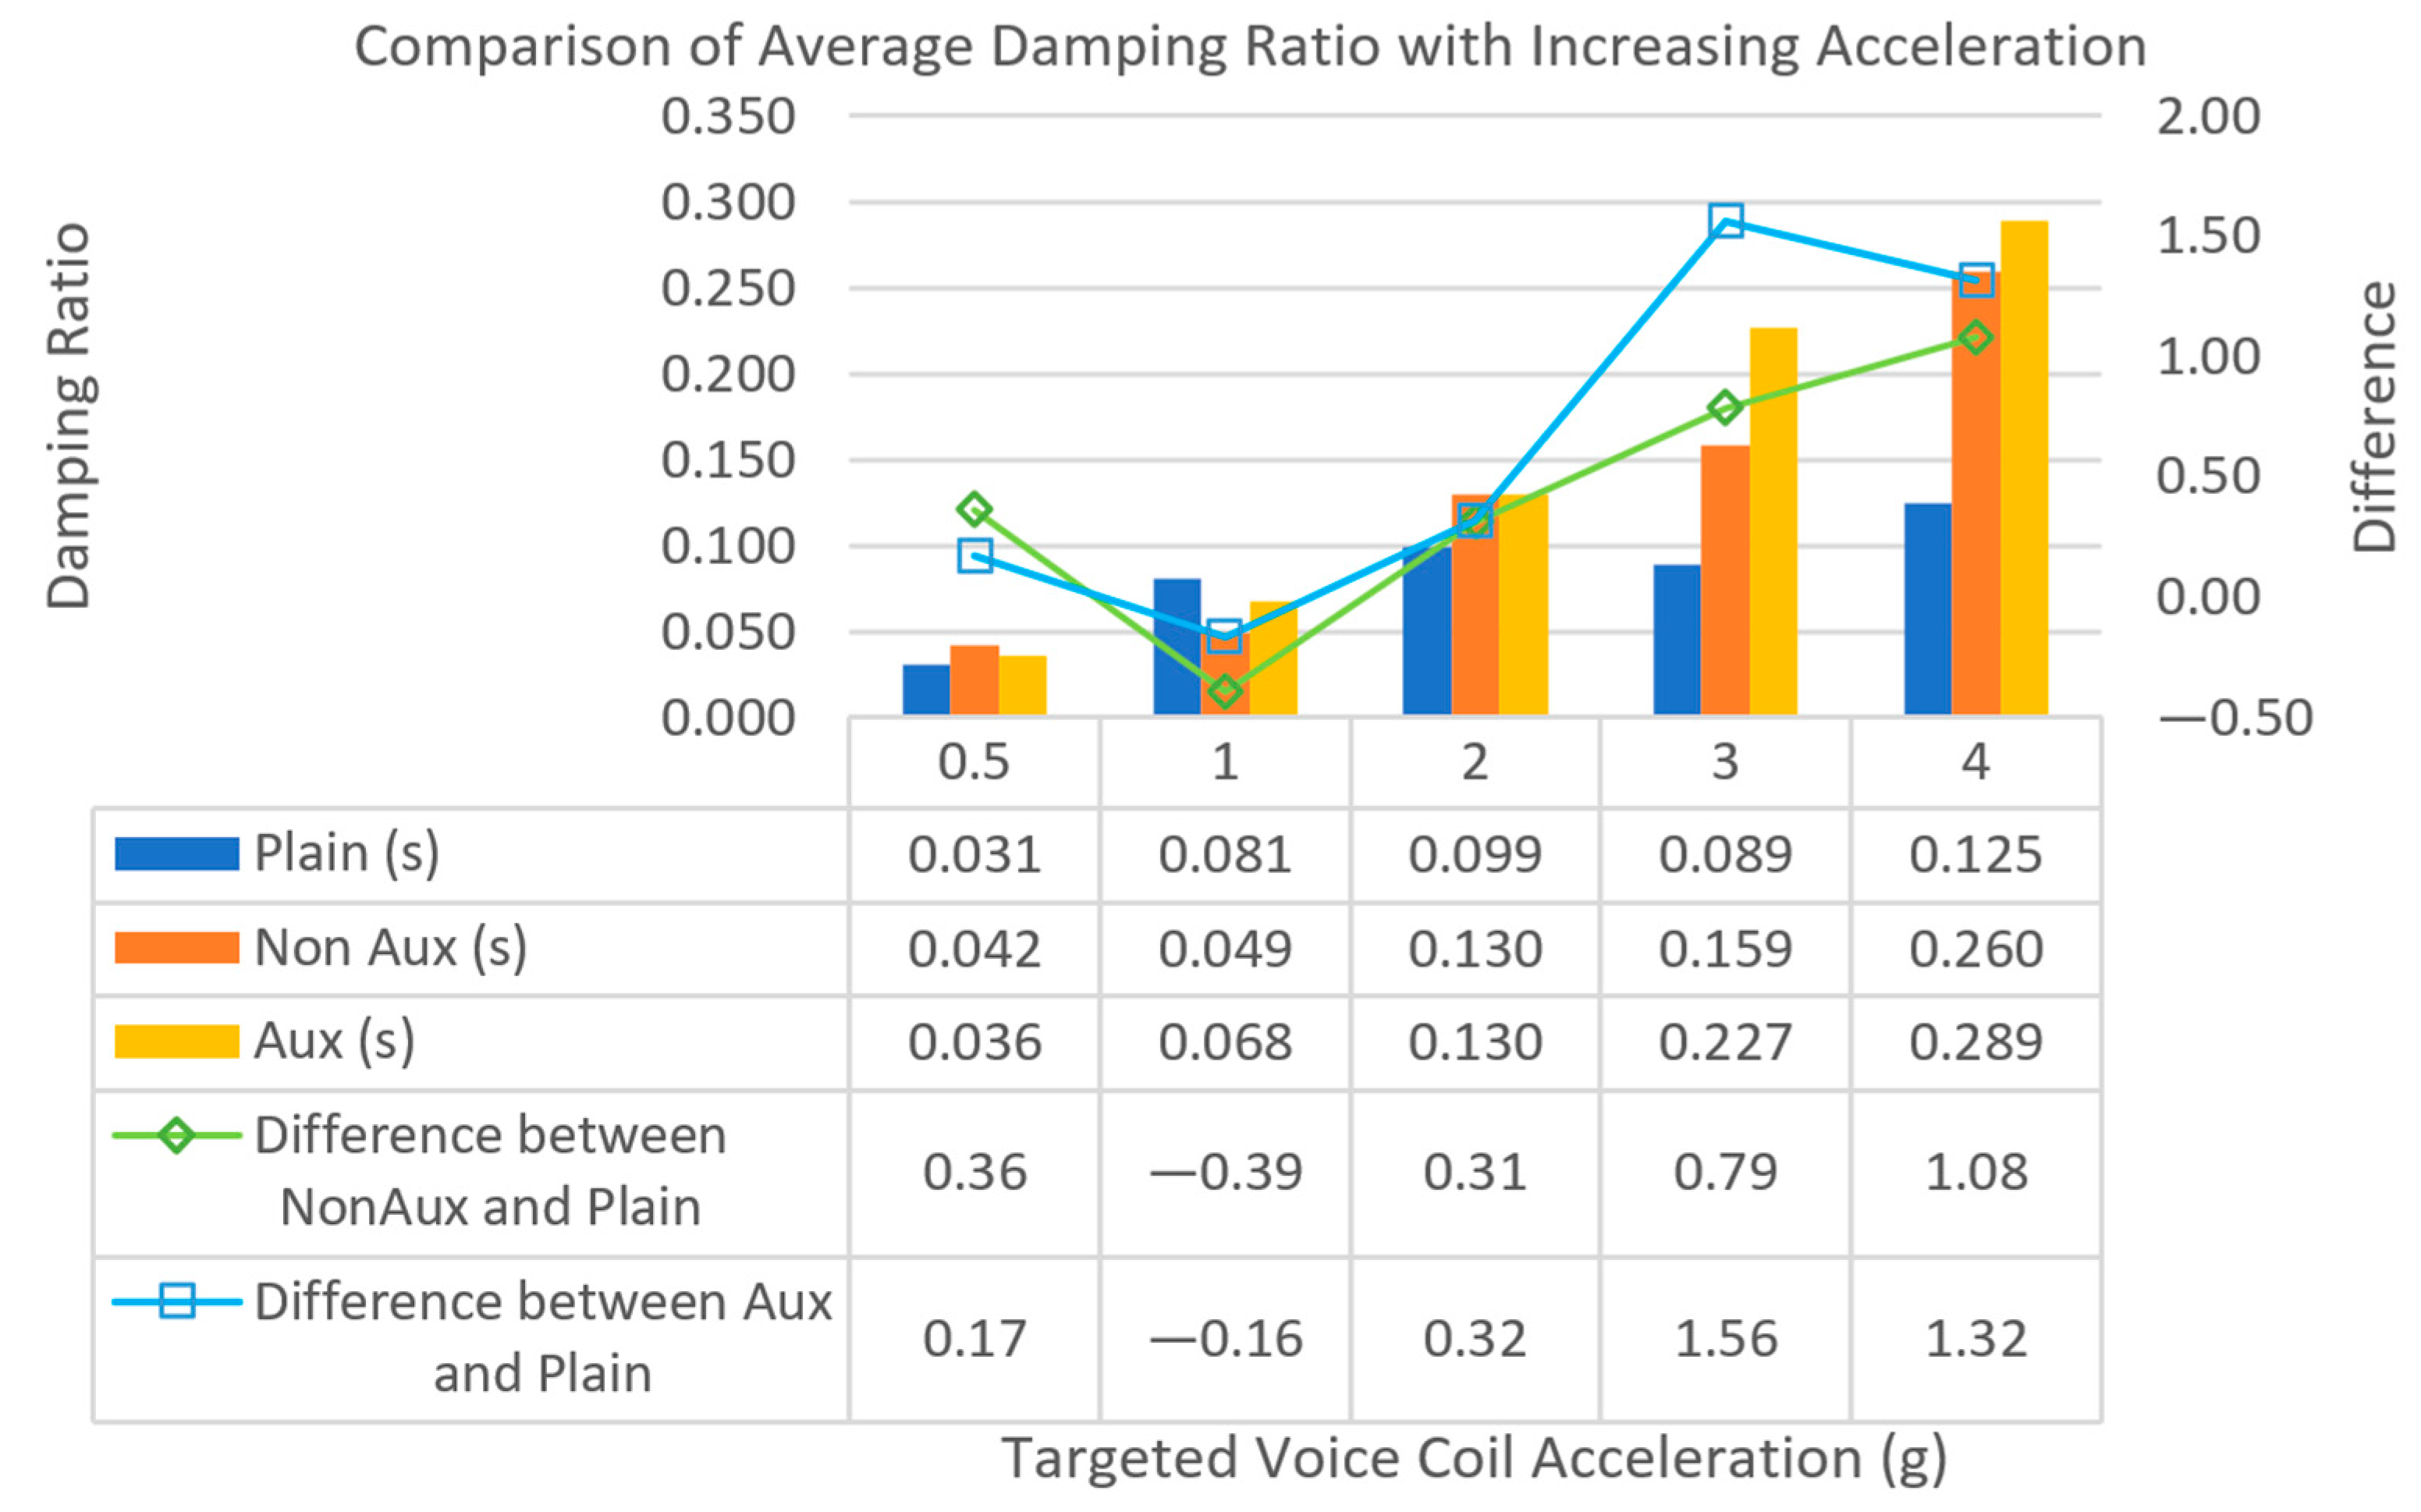
The overall damping ratios for all models reflect the same trend as their settling times. An interesting finding can be seen in Figure 37, where settling time decreases as acceleration increases from 0.5 g to 2 g in both non-auxetic and auxetic prototypes, unlike the conventionally constrained layer damping of the plain prototype. At low acceleration input of 0.5 g, damping ratios for all models were relatively similar, between 0.03 and 0.04, as shown in Figure 38. With increasing acceleration from 0.5 g to 4 g, the damping ratio of the plain model increased by 4 times to around 0.125, and its settling time increased from 111 ms to 173.5 ms, shown with blue bars in Figure 38. However, both non-auxetic and auxetic models performed remarkably better than the plain model, as input acceleration is increased, with 35.3% (non-auxetic) and 56.7% (auxetic) shorter settling time with 0.5 g acceleration and 132.6% (non-auxetic) and 184.9% (auxetic) shorter settling time with 4 g acceleration. Damping ratio increases by 6 times from 0.04 to 0.26 (non-auxetic) and by 8 times to 0.29 (auxetic). The higher damping performance with higher input acceleration can be explained by the simulated results in Figure 31. With higher displacement amplitude, the displacement of the auxetic layer becomes more significant, generating higher shear strain within the viscoelastic layer, resulting in higher damping performance. Similarly, as vibration amplitude is increased, the higher shear strain generated results in better damping performance. It is worth noting that the standard deviations of the damping ratios are relatively higher for lower input accelerations, as shown in Table 10. This is due to the contribution of higher-order vibrations and noise, which tends to be relatively more significant at lower vibration amplitudes.
In the second experiment, a comparison of the decay between the prototype and granite is studied for reduction in settling time, effective damping frequency range and transmissibility. The peak accelerations during impulse are 1.10 g, 1.49 g and 1.85 g for the plain, non-auxetic and auxetic models, respectively, and the respective forces experienced by the parts are 68.59 mN, 90.69 mN and 112.34 mN.
Comparing the accelerations between the prototypes and granite table, a lingering acceleration is noticed in all three models, where the granite decays (red) with amplitudes lower than the prototypes (blue), as shown in Figure 39. The plain model is shown at 0.025 g, non-auxetic model at 0.05 g and the auxetic model at >0.1 g. This is due to the requirement for sufficient displacement to be made for the composite sandwich to perform dampening effectively. Considering the lower stiffness of the non-auxetic and auxetic models, the results suggest that the auxetic prototype requires a higher displacement for it to be effective.
Differences in settling times between the granite and prototype are compared across the three models within a series of windows between ±0.25 g and ±0.5 g, as shown in Figure 40. Within higher settling windows from 0.5 g to 0.3 g, the auxetic prototype settled to a higher settling window faster as compared to the non-auxetic and plain prototypes. At a lower acceleration window, below 0.25 g, the plain prototype achieves lower settling times. This is again evidence that a lower minimum displacement is required for the plain sandwiches to be effective, and a larger displacement is required for the auxetic model to be effective.
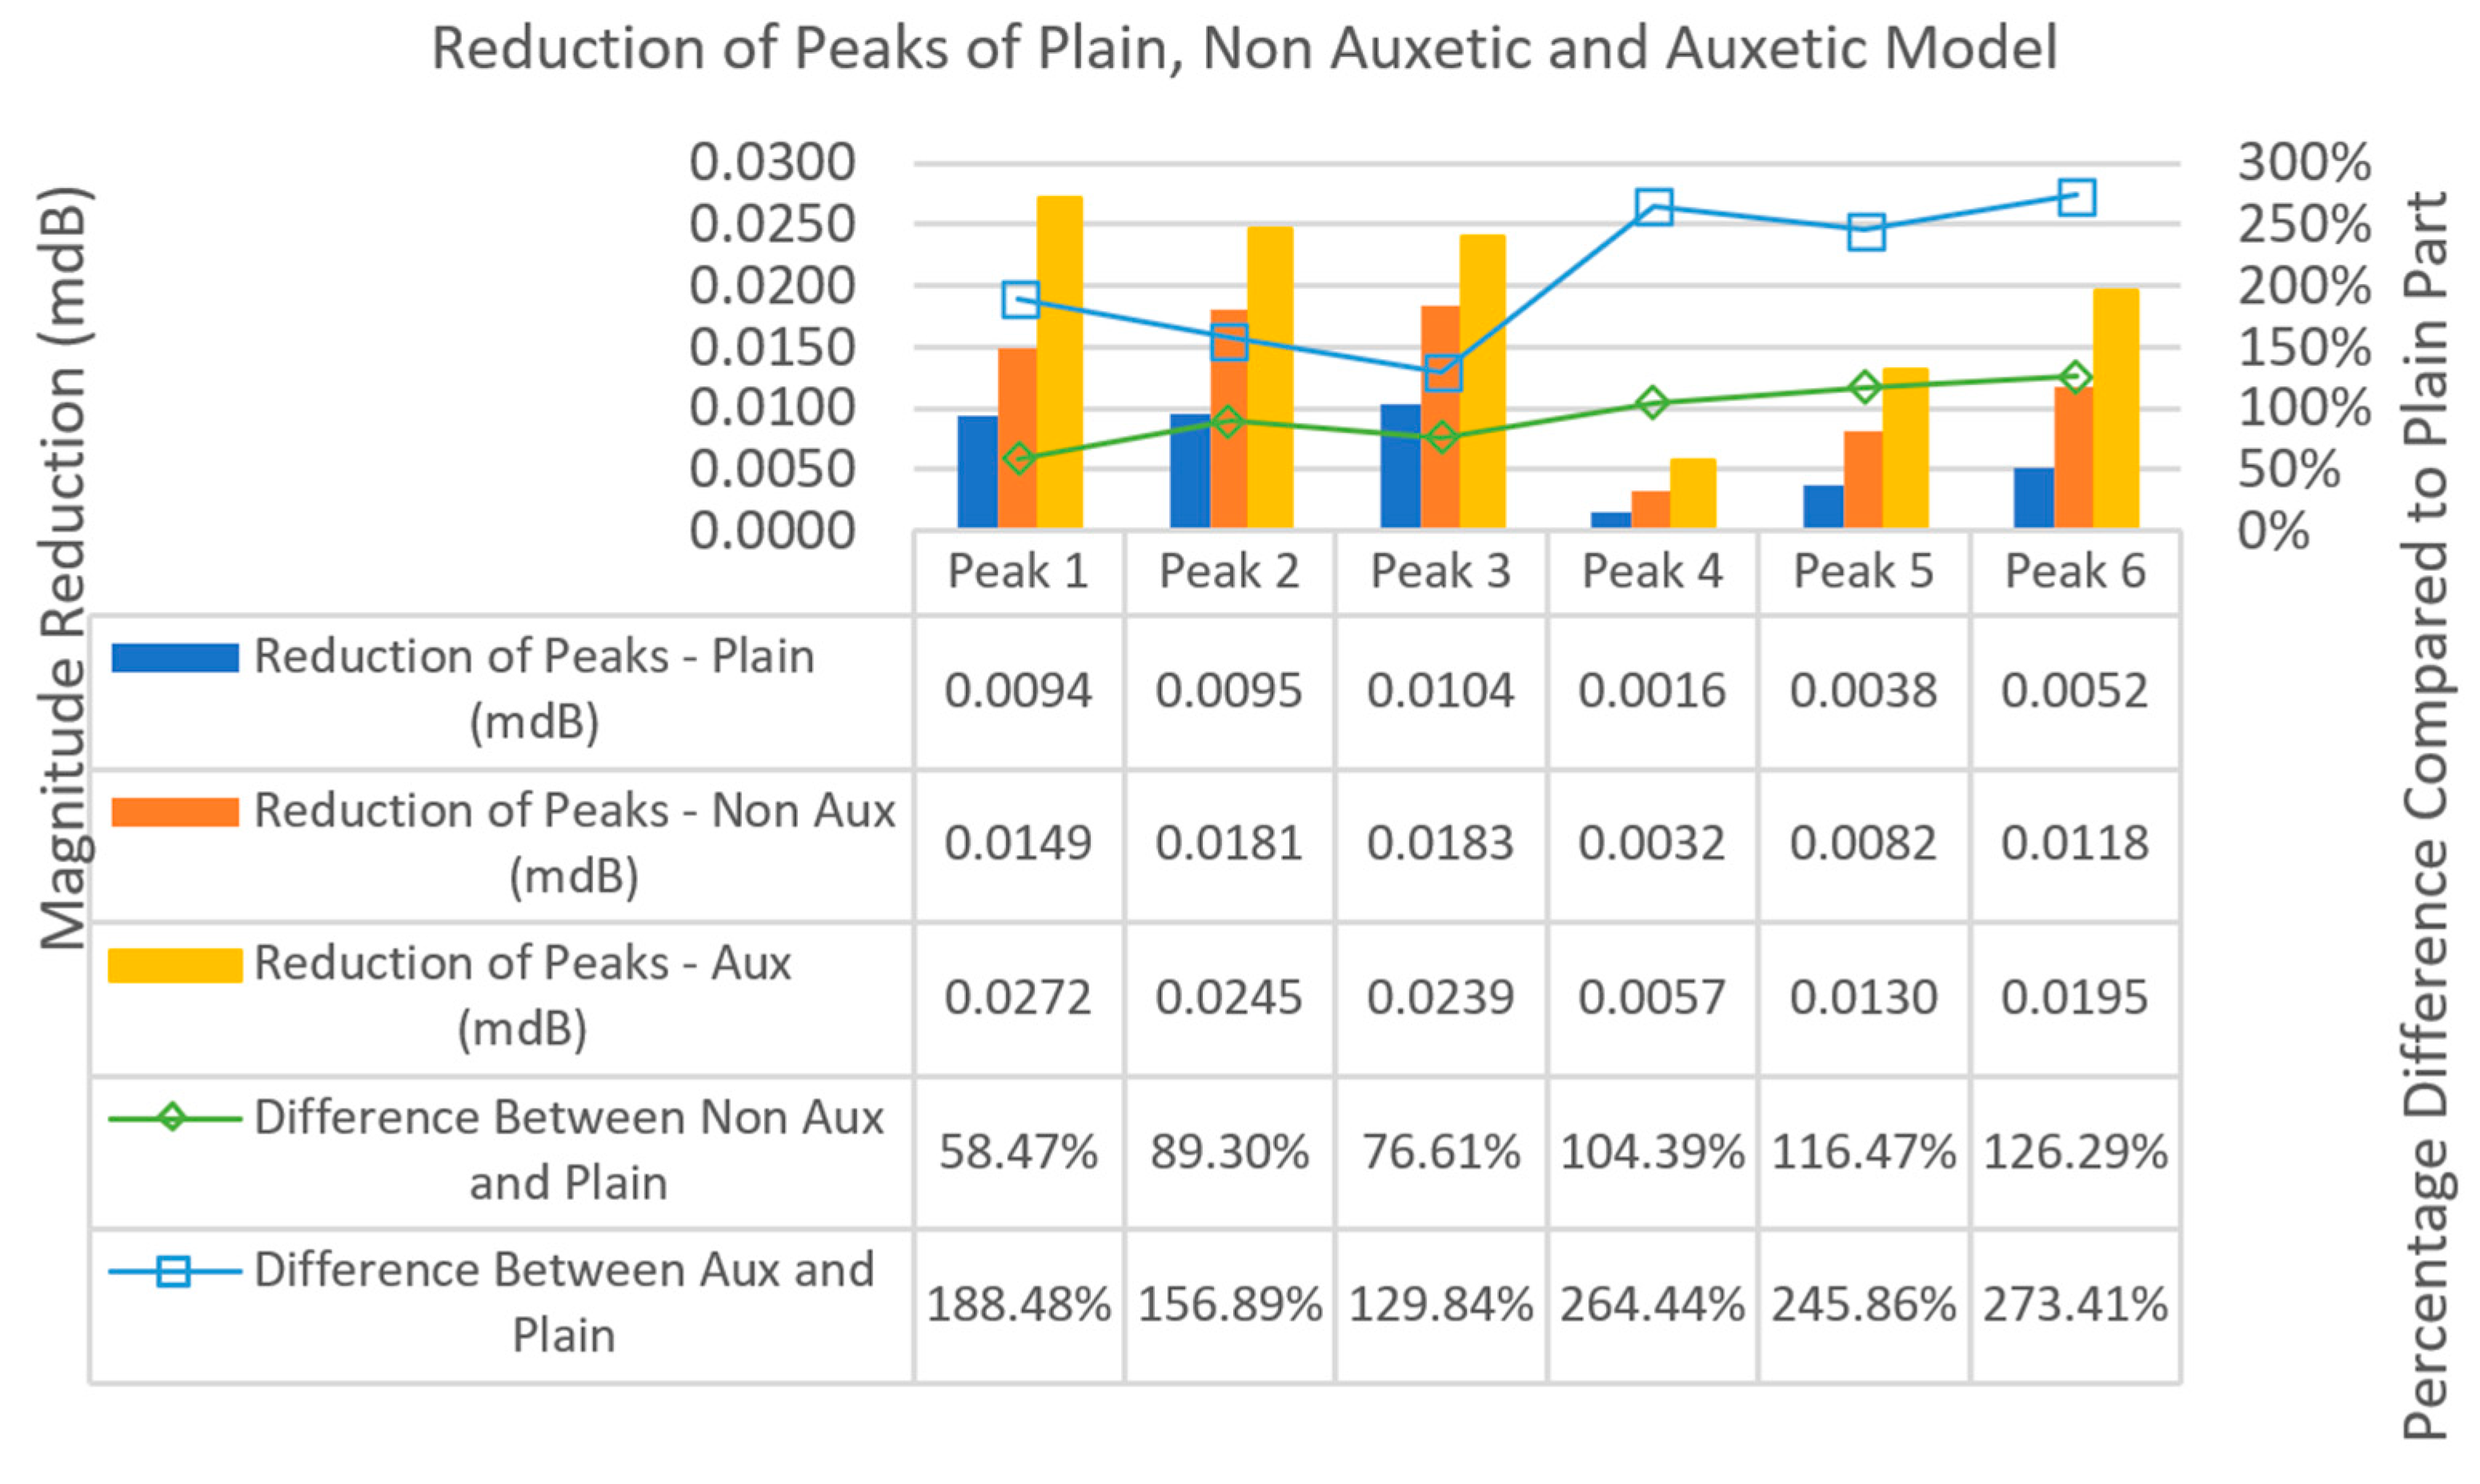
The FFT and its derived PSD plots of the three prototypes in Figure 41 show effective attenuation occurring between frequencies 750 and 1780 Hz; 779.221 Hz and 1778.22 Hz (plain), 751.249 Hz and 1770.23 Hz (non-auxetic) and 751.249 Hz and 1774.23 Hz (auxetic). Peaks in the plot are due to the resonance of existing equipment bolted to the granite table. Comparing the reduction in the peaks (PR1 to PR6) within the effective attenuation region of the PSD, the auxetic model has an overall better attenuation capability, 3 to 4 times better than the plain model and 1.5 to 2 times better than the non-auxetic model, with significantly larger attenuation of peaks 1–3 and a significant increase in attenuation of peaks 4–5 as compared to the plain model, as shown in Figure 42. Despite the auxetic prototype having almost twice the initial acceleration, the auxetic model has consistently achieved shorter settling time, as compared to the non-auxetic and plain models, with a settling acceleration window of 0.25 g or larger.

4. Conclusions

The novel auxetic composite sandwich concept of a constrained layer damper designed to support load through its constraining layers and deforming axis-symmetrically is shown to have vibration dampening enhancement over conventional constrained layer damping. The design of the sandwich is performed in two parts, where the thickness, width and modulus of the constraining layer are determined based on the load and then the thickness of the auxetic layer is varied to achieve good radial and tangential displacement at the top and bottom surfaces. Results from numerical simulation showing higher strain and strain distribution with an auxetic interlayer relate to better damping performance in experiment results. The better damping ratio at the early part of the vibration from the higher overall deformation of the sandwich results in larger facet deformation. Experimentally, it is shown that with higher damping performance comes increased impulse acceleration. The auxetic interlayer provides higher damping performance with higher vibration amplitudes; however, at smaller vibration amplitudes, it is comparable or slightly poorer than conventional constrained layer damping.
An auxetic mid-interlayer was compared with similar non-auxetic and plain models. As the auxetic sandwich is deformed axis-symmetrically, rotation of the facets generates additional shear strain to the viscoelastic layer, enhancing energy absorption. It is shown that at the initial angle, the auxetic facets do not affect Poisson’s ratio. Deformation of the auxetic layer is in a twisting manner about the hinges, such that the convex surface spreads outwards and the concave surface moves inwards, and a thickness of 0.5 mm and above would result in these deformations. A thickness of 0.5 mm is selected to avoid having high bending stiffness. The effectiveness of the auxetic layer generating higher strain is shown in the mean total equivalent strain, where the auxetic layer shows values 4.2 to 5.5 times higher than the convex and concave sides, respectively. The distribution of total equivalent strain is also shown to be significantly better than in the plain model and slightly better than in the non-auxetic model, reflecting the results of total strain energy within the viscoelastic layers. Comparing their dynamic damping performance, the auxetic and non-auxetic models show comparatively higher damping performance during free vibration. This is due to more prominent displacements of the facets during higher-amplitude displacements. The better damping performance of the auxetic model is shown in the first experiment through varying accelerations. The damping ratio of the auxetic model at lower accelerations was 0.5 g; all three models achieved relatively similar damping ratio, and at 1 g, the plain model performed better. This characteristic is also shown in the second experiment, where in the auxetic model at 0.1 g, vibration amplitudes of the model become higher than the granite platform, whereas for the plain model, it is 0.025 g. This can be explained by the fact that relative displacements are required for constrained layer damping to work; it requires a higher overall vibration amplitude to generate sufficient displacement of the auxetic facets. Similar results are shown in experiment 2, with the plain, non-auxetic and auxetic models subjected to impulse acceleration of 1 g, 1.5 g and 2 g, respectively. Peaks within the frequency range of 750 Hz to 1777 Hz are reduced by 130% to 270% compared to the plain model and 58% to 126% compared to the non-auxetic model.
The method of enhancing the piezoelectric effect by increasing strains in piezoelectric material using an auxetic structure has been studied [29,30,31,32,33], achieving similar effects of stress increase and distribution. However, it had not been applied to enhancing strains in viscoelastic layers to enhance constrained layer damping. The study on the use of an auxetic structure can be extended to the number of facets and the use of a liquid viscoelastic layer to improve the displacement of facets.
To further improve the current design, it is recommended to use a material with low bending stiffness and high tensile strength for its constraining layers, such as woven fabric. This allows the auxetic facets to rotate with ease, as the facets can twist along the edges easier. The effectiveness and characteristics of the novel auxetic composite sandwich for vibration dampening are demonstrated, where the incorporation of an auxetic interlayer can increase the performance of constrained layer damping in an axisymmetric deformation.

Author Contributions

Conceptualization, C.S.Y. and K.L.G.; Data curation, C.S.Y.; Formal analysis, C.S.Y.; Investigation, C.S.Y.; Methodology, C.S.Y. and C.W.L.; Project administration, S.I.; Resources, C.S.Y., S.I. and C.W.L.; Software, C.S.Y.; Supervision, S.I., C.W.L. and K.L.G.; Validation, C.S.Y.; Writing—original draft, C.S.Y.; Writing—review and editing, C.S.Y. and S.I. All authors have read and agreed to the published version of the manuscript.

Funding

C.S. thanks the Economic Development Board (EDB) for the support through the Industrial Postgraduate Programme (IPP)—21-IPPII-AM-003-01; 200410879N.

Data Availability Statement

The raw data supporting the conclusions of this article will be made available by the authors on request.

Acknowledgments

C.S. thanks Akribis Systems and Nanyang Technological University, Singapore, for the financial support in the form an EDB-IPP scholarship.

Conflicts of Interest

The authors declare no conflicts of interest.

References

  1. Qian, Y.; Xie, Y.; Jia, J.; Zhang, L. Development of Active Microvibration Isolation System for Precision Space Payload. Appl. Sci. 2022, 12, 4548. [Google Scholar] [CrossRef]
  2. Ungar, E.E.; Zapfe, J.A. Vibration Isolation. In Noise and Vibration Control Engineering; John Wiley & Sons, Ltd.: Hoboken, NJ, USA, 2005; pp. 557–578. [Google Scholar] [CrossRef]
  3. Park, Y.-H.; Kwon, S.-C.; Koo, K.-R.; Oh, H.-U. High Damping Passive Launch Vibration Isolation System Using Superelastic SMA with Multilayered Viscous Lamina. Aerospace 2021, 8, 201. [Google Scholar] [CrossRef]
  4. Pan, J.; Liu, Z.; Kou, X.; Song, Q. Constrained layer damping treatment of a model support sting. Chin. J. Aeronaut. 2021, 34, 58–64. [Google Scholar] [CrossRef]
  5. Gong, Y.; Peng, W.; Liu, Z. Affect of Elastic Displacement Limiter on Shock Response of Double-stage Vibration Isolation System. J. Phys. Conf. Ser. 2020, 1637, 012115. [Google Scholar] [CrossRef]
  6. Torvik, P.J. The Analysis and Design of Constrained Layer Damping Treatments; Defense Technical Information Center: Fort Belvoir, VA, USA, 1980. [Google Scholar] [CrossRef]
  7. Kolpakov, A.G. Determination of the average characteristics of elastic frameworks. J. Appl. Math. Mech. 1985, 49, 739–745. [Google Scholar] [CrossRef]
  8. Zhang, J.; Lu, G.; You, Z. Large deformation and energy absorption of additively manufactured auxetic materials and structures: A review. Compos. Part B Eng. 2020, 201, 108340. [Google Scholar] [CrossRef]
  9. Alvermann, S.; Brenn, G.; Holzapfel, G.; Schanz, M.; Sextro, W.; Steinbach, O. Effective viscoelastic behaviour of cellular auxetic materials. In Computation in Engineering and Science, 1st ed.; Verlag der Technischen Universität Graz: Graz, Austria, 2008. [Google Scholar]
  10. Novak, N.; Duncan, O.; Allen, T.; Alderson, A.; Vesenjak, M.; Ren, Z. Shear modulus of conventional and auxetic open-cell foam. Mech. Mater. 2021, 157, 103818. [Google Scholar] [CrossRef]
  11. Li, T.; Liu, F.; Wang, L. Enhancing indentation and impact resistance in auxetic composite materials. Compos. Part B Eng. 2020, 198, 108229. [Google Scholar] [CrossRef]
  12. Huang, X.; Zhang, Z.; Wu, J. An overview of impact resistance of auxetic lattice structure. J. Phys. Conf. Ser. 2020, 1549, 032077. [Google Scholar] [CrossRef]
  13. Wang, Z.; Zulifqar, A.; Hu, H. 7—Auxetic composites in aerospace engineering. In Advanced Composite Materials for Aerospace Engineering; Rana, S., Fangueiro, R., Eds.; Woodhead Publishing: Sawston, UK, 2016; pp. 213–240. [Google Scholar] [CrossRef]
  14. Zhang, X.-W.; Yang, D.-Q. Numerical and Experimental Studies of a Light-Weight Auxetic Cellular Vibration Isolation Base. Shock. Vib. 2016, 2016, 4017534. [Google Scholar] [CrossRef]
  15. Matuszewska, A. Vibration Properties of Auxetic Beam. Vib. Phys. Syst. 2018, 29, 2018031. [Google Scholar]
  16. Pan, K.; Zhang, W.; Ding, J. Negative Poisson’s Ratio Re-Entrant Base Modeling and Vibration Isolation Performance Analysis. Symmetry 2022, 14, 1356. [Google Scholar] [CrossRef]
  17. Kim, J.; Hegde, H.; Kim, H.-Y.; Lee, C. Spindle vibration mitigation utilizing additively manufactured auxetic materials. J. Manuf. Process. 2022, 73, 633–641. [Google Scholar] [CrossRef]
  18. Bianchi, M.; Scarpa, F. Vibration transmissibility and damping behaviour for auxetic and conventional foams under linear and nonlinear regimes. Smart Mater. Struct. 2013, 22, 084010. [Google Scholar] [CrossRef]
  19. Chen, Y.-L.; Wang, D.-W.; Ma, L. Vibration and damping performance of carbon fiber-reinforced polymer 3D double-arrow-head auxetic metamaterials. J. Mater. Sci. 2021, 56, 1443–1460. [Google Scholar] [CrossRef]
  20. Velásquez, M.B.; Francesconi, L.; Taylor, M. Design of low-porosity auxetic tessellations with reduced mechanical stress concentrations. Extrem. Mech. Lett. 2021, 48, 101401. [Google Scholar] [CrossRef]
  21. Chan, N.; Evans, K.E. Indentation Resilience of Conventional and Auxetic Foams. J. Cell. Plast. 1998, 34, 231–260. [Google Scholar] [CrossRef]
  22. Hu, J.S.; Wang, B.L. Crack growth behavior and thermal shock resistance of ceramic sandwich structures with an auxetic honeycomb core. Compos. Struct. 2021, 260, 113256. [Google Scholar] [CrossRef]
  23. Hu, J.S.; Wang, B.L.; Hirakata, H.; Wang, K.F. Thermal shock fracture analysis of auxetic honeycomb layer based on non-Fourier heat conduction. Eng. Struct. 2023, 279, 115581. [Google Scholar] [CrossRef]
  24. Alderson, A.; Alderson, K.L. Auxetic materials. Proc. Inst. Mech. Eng. Part G J. Aerosp. Eng. 2007, 221, 565–575. [Google Scholar] [CrossRef]
  25. Dengiz, D.; Goldbeck, H.; Curtis, S.M.; Bumke, L.; Jetter, J.; Quandt, E. Shape Memory Alloy Thin Film Auxetic Structures. Adv. Mater. Technol. 2023, 8, 2201991. [Google Scholar] [CrossRef]
  26. Easey, N.; Chuprynyuk, D.; Musa, W.M.S.W.; Bangs, A.; Dobah, Y.; Shterenlikht, A.; Scarpa, F. Dome-Shape Auxetic Cellular Metamaterials: Manufacturing, Modeling, and Testing. Front. Mater. 2019, 6, 86. [Google Scholar] [CrossRef]
  27. Peliński, K.; Smardzewski, J. Static response of synclastic sandwich panel with auxetic wood-based honeycomb cores subject to compression. Thin-Walled Struct. 2022, 179, 109559. [Google Scholar] [CrossRef]
  28. Wallbanks, M.; Khan, M.F.; Bodaghi, M.; Triantaphyllou, A.; Serjouei, A. On the design workflow of auxetic metamaterials for structural applications. Smart Mater. Struct. 2022, 31, 023002. [Google Scholar] [CrossRef]
  29. Dong, S.; Hu, H. Sensors Based on Auxetic Materials and Structures: A Review. Materials 2023, 16, 3603. [Google Scholar] [CrossRef] [PubMed]
  30. Li, Q.; Kuang, Y.; Zhu, M. Auxetic piezoelectric energy harvesters for increased electric power output. AIP Adv. 2017, 7, 015104. [Google Scholar] [CrossRef]
  31. Ferguson, W.J.G.; Kuang, Y.; Evans, K.E.; Smith, C.W.; Zhu, M. Auxetic structure for increased power output of strain vibration energy harvester. Sens. Actuators A Phys. 2018, 282, 90–96. [Google Scholar] [CrossRef]
  32. Eghbali, P.; Younesian, D.; Moayedizadeh, A.; Ranjbar, M. Study in circular auxetic structures for efficiency enhancement in piezoelectric vibration energy harvesting. Sci. Rep. 2020, 10, 16338. [Google Scholar] [CrossRef]
  33. Zhou, X.; Parida, K.; Chen, J.; Xiong, J.; Zhou, Z.; Jiang, F.; Xin, Y.; Magdassi, S.; Lee, P.S. 3D Printed Auxetic Structure-Assisted Piezoelectric Energy Harvesting and Sensing. Adv. Energy Mater. 2023, 13, 2301159. [Google Scholar] [CrossRef]
  34. Momoh, E.O.; Jayasinghe, A.; Hajsadeghi, M.; Vinai, R.; Evans, K.E.; Kripakaran, P.; Orr, J. A state-of-the-art review on the application of auxetic materials in cementitious composites. Thin-Walled Struct. 2024, 196, 111447. [Google Scholar] [CrossRef]
  35. Park, E.B.; Jeong, Y.C.; Kang, K. A novel auxetic sandwich panel for use in structural applications: Fabrication and parametric study. Mater. Today Commun. 2023, 34, 105383. [Google Scholar] [CrossRef]
  36. Bosia, F.; Poggetto, V.F.D.; Gliozzi, A.S.; Greco, G.; Lott, M.; Miniaci, M.; Ongaro, F.; Onorato, M.; Seyyedizadeh, S.F.; Tortello, M.; et al. Optimized structures for vibration attenuation and sound control in Nature: A review. Matter 2022, 5, 3311–3340. [Google Scholar] [CrossRef]
  37. My Year with the Woodpeckers by Heinz Sielmann, Translated by Sodney Lightman: Good Hardback (1959) | Hall of Books. Available online: https://www.abebooks.com/Year-Woodpeckers-Heinz-Sielmann-translated-Sodney/8466038791/bd (accessed on 25 January 2024).
  38. Lee, N.; Horstemeyer, M.F.; Rhee, H.; Nabors, B.; Liao, J.; Williams, L.N. Hierarchical multiscale structure–property relationships of the red-bellied woodpecker (Melanerpes carolinus) beak. J. R. Soc. Interface 2014, 11, 20140274. [Google Scholar] [CrossRef] [PubMed]
  39. Garland, A.P.; Adstedt, K.M.; Casias, Z.J.; White, B.C.; Mook, W.M.; Kaehr, B.; Jared, B.H.; Lester, B.T.; Leathe, N.S.; Schwaller, E.; et al. Coulombic friction in metamaterials to dissipate mechanical energy. Extrem. Mech. Lett. 2020, 40, 100847. [Google Scholar] [CrossRef]
  40. Zhang, Z.; Yang, J. Biomechanical Dynamics of Cranial Sutures during Simulated Impulsive Loading. Appl. Bionics Biomech. 2015, 2015, 596843. [Google Scholar] [CrossRef]
  41. Ventsel, E.; Krauthammer, T. Thin Plates and Shells: Theory, Analysis, and Applications; Marcel Dekker: New York, NY, USA, 2001. [Google Scholar]
  42. Grima, J.N.; Evans, K.E. Auxetic behavior from rotating triangles. J. Mater. Sci. 2006, 41, 3193–3196. [Google Scholar] [CrossRef]
  43. Salmon, F.; Company, M.; Paul, S.; Nie, M.Q. Structural Analyst. Modeling of VHB Structural Glazing Tape for Glazing System Assembly. 2013. Available online: https://api.semanticscholar.org/CorpusID:32003661 (accessed on 22 August 2024).
Figure 1. Design of an active vibration isolation system for mounting a 25 kg precision space payload, attenuating within a range of 0.5 to 200 Hz. Qian et al. [1].
Jcs 09 00162 g001
Figure 2. Commercially available vibration isolation platforms from Newport, Proaim and Minus-K.
Jcs 09 00162 g002
Figure 3. Transmissibility of a mass spring damper describing damping effectiveness above 2 times the resonance frequency (r = 1) by Eric and Jeffery, 2005. Reprinted with permission from John Wiley and Sons [2].
Jcs 09 00162 g003
Figure 4. (a) Spacecraft vibration isolator developed by Park et al., 2021 utilizing SMA blades to support a payload totaling 40 kg (10 kg each), displacement limiters to avoid excessive motion and (b) vibration isolation with constrained layer damping [3].
Jcs 09 00162 g004
Figure 5. Illustration of (a) movement of individual auxetic cells (Momoh et al., 2024) [34], (a) rotating squares, (b) chiral with circular holes, (c) re-entrant honeycomb, (d) star-shaped honeycomb resulting in negative Poisson’s ratio, (e) synclastic behavior of planar auxetic sandwich by Park et al., 2023. Reprinted with permission from Elsevier [35].
Jcs 09 00162 g005
Figure 6. Photographs of suture lines (Bosia et al., 2022) [36] of (a) a woodpecker beak, (b) cranial suture in a bison skull, (c) wavy line on the surface of an ammonoid fossil, (d) suture in a box turtle and (e) the resemblance of sutures to rotating triangle auxetic structure.
Jcs 09 00162 g006
Figure 7. Illustration of (a) the layers of the auxetic composite sandwich and (b) how the composite sandwich is constrained by the constraining layers to bear load.
Jcs 09 00162 g007
Figure 8. Illustration of axisymmetric deformation of constraining layer and the equivalent radius of a circular disc.
Jcs 09 00162 g008
Figure 9. Illustration of displacement of rotating triangle auxetic structure with change in angle between.
Jcs 09 00162 g009
Figure 10. ABS plain, non-auxetic and auxetic interlayer models for comparison.
Jcs 09 00162 g010
Figure 11. Relative moduli and relaxation time used for modeling of viscoelastic property.
Jcs 09 00162 g011
Figure 12. Study of displacement of the top and bottom auxetic layers at the slits when subjected to an axisymmetric deformation with cylindrical displacements in the radial direction (X) and tangential direction (Y).
Jcs 09 00162 g012
Figure 13. Applied impulse for transient studies.
Jcs 09 00162 g013
Figure 14. Maximum deflection at the middle of the constraining layer with thickness of constraining layer.
Jcs 09 00162 g014
Figure 15. ABS/HDPE prototypes used for the experiment: (a) plain model, (b) non-auxetic model, (c) auxetic model, (d) assembly of sandwich and holder with accelerometer attached.
Jcs 09 00162 g015
Figure 16. Schematic of setup in experiment 1 with the test platform, motion controllers and oscilloscope.
Jcs 09 00162 g016
Figure 17. Schematic of setup for experiment 2.
Jcs 09 00162 g017
Figure 18. Comparison of tangential displacements of open slits at top of auxetic layer with varying thickness.
Jcs 09 00162 g018
Figure 19. Comparison of tangential displacements of open slits at bottom of auxetic layer with varying thickness.
Jcs 09 00162 g019
Figure 20. Mode shape of (a1–a3) plain, (b1–b3) non-auxetic and (c1–c3) auxetic model for first three modes.
Jcs 09 00162 g020
Figure 21. Displacements of mid-interlayer (a) plain model, (b) non-auxetic model, (c) auxetic model, where (1) are in the radial direction and (2) are in tangential direction. Increased displacement of the auxetic modes is boxed in green.
Jcs 09 00162 g021
Figure 22. Equivalent total strain of (a1) plain model, (b1) non-auxetic model and (c1) auxetic model and total strain energy of (a2) plain model, (b2) non-auxetic model and (c2) auxetic model across both viscoelastic layers. Increased strain and strain energy of the viscoelastic layers of the auxetic modes is boxed in green.
Jcs 09 00162 g022
Figure 23. Comparison of mean total equivalent strain of viscoelastic layers of plain, non-auxetic and auxetic models.
Jcs 09 00162 g023
Figure 24. Comparison of max total equivalent strain of viscoelastic layers of plain, non-auxetic and auxetic models.
Jcs 09 00162 g024
Figure 25. Comparison of viscoelastic layer shear strains of (a) plain, (b) non-auxetic, (c) auxetic models, where (1) are in the r-θ direction for the layer on the convex side, (2) are in the r-θ direction for the layer on the concave side, (3) are in the θ-z direction for the layer on the convex side and (4) are in the θ-z direction for the layer on the concave side. Increased strain and strain energy of the viscoelastic layers of the auxetic modes is boxed in green.
Jcs 09 00162 g025
Figure 26. Cumulative distributed function of total equivalent strain of viscoelastic layers for plain, non-auxetic and auxetic models.
Jcs 09 00162 g026
Figure 27. Vibration response of HDPE/ABS models from 0 to 25 ms with 10 G—1 ms impulse.
Jcs 09 00162 g027
Figure 28. Vibration response of HDPE/ABS models from 25 to 85 ms with 10 G—1 ms impulse.
Jcs 09 00162 g028
Figure 29. Vibration response of HDPE/ABS models from 85 to 150 ms with 10 G—1 ms impulse.
Jcs 09 00162 g029
Figure 30. Settling time of HDPE/ABS models to 1 G, 0.5 G, 0.2 G and 0.1 G.
Jcs 09 00162 g030
Figure 31. Damping ratio of HDPE/ABS models over entire duration of vibration.
Jcs 09 00162 g031
Figure 32. Comparison of acceleration response of plain, non-auxetic and auxetic sandwiches with 0.5 G acceleration.
Jcs 09 00162 g032
Figure 33. Comparison of acceleration response of plain, non-auxetic and auxetic sandwiches with 1 G acceleration.
Jcs 09 00162 g033
Figure 34. Comparison of acceleration response of plain, non-auxetic and auxetic sandwiches with 2 G acceleration.
Jcs 09 00162 g034
Figure 35. Comparison of acceleration response of plain, non-auxetic and auxetic sandwiches with 3 G acceleration.
Jcs 09 00162 g035
Figure 36. Comparison of acceleration response of plain, non-auxetic and auxetic sandwiches with 4 G acceleration.
Jcs 09 00162 g036
Figure 37. Settling time of the plain, non-auxetic and auxetic models with increasing acceleration.
Jcs 09 00162 g037
Figure 38. Damping ratio of plain, non-auxetic and auxetic models with increasing accleration of the voice coil during free vibration. Lines in green and blue show the increase in damping ratios of the non-aux model and aux model, respectively, in comparison to the plain model.
Jcs 09 00162 g038
Figure 39. Vibration plots show higher reductions when amplitudes of vibrations are higher for all models in free vibration region: (a) plain model, (b) non-auxetic model, (c) auxetic model.
Jcs 09 00162 g039
Figure 40. Comparison of difference in settling time between models (plain, non-auxetic and auxetic) and granite with varying settling window.
Jcs 09 00162 g040
Figure 41. Fast Fourier Transform—FFT (blue) and Power Spectral Density—PSD (red) plots from the three tests, showing the effective attenuation region for the (a) plain, (b) non-auxetic and (c) auxetic prototype.
Jcs 09 00162 g041
Figure 42. Reduction in peaks from the vibration of the granite and comparison of the attenuation of the non-auxetic and auxetic models with the plain model (higher is better). Line in green and red shows the percentage difference between the non- auxetic and auxetic models in comparison with the plain model (higher is better).
Jcs 09 00162 g042
Table 1. Meshing parameters of the three models in Ansys.
Mesh Parameters
Mid-Interlayer
(Plain, Non-Aux, Aux)
Element Type: Tetrahedron
Element Size: 1.5 mm
Viscoelastic LayerElement Type: Hexahedral
Element Size: 1.5 mm
Constraining LayerElement Type: Hexahedral
Element Size: 1.5 mm
Plain ModelNumber of Nodes: 28,476
Number of Elements: 13,969
Non-Auxetic ModelNumber of Nodes: 28,520
Number of Elements: 13,767
Auxetic ModelNumber of Nodes: 29,219
Number of Elements: 14,128
Table 2. Material properties of auxetic composite sandwich.
PartMaterialProperties
Auxetic LayerABS (Black ABS Filament, CC3D, China)Density:1030 kg/m3
Young’s Modulus:1.63 GPa
Poisson’s Ratio:0.41
Bulk Modulus:2.98 GPa
Shear Modulus:577.76 MPa
Tensile Ultimate Strength:36.26 MPa
Tensile Yield Strength:27.44 MPa
Constraining LayerHDPE (Heavy-duty bag, Lyreco—www.lyrerco.com, Singapore)Density:958.5 kg/m3
Young’s Modulus:1.08 GPa
Poisson’s Ratio:0.42
Bulk Modulus:2.20 GPa
Shear Modulus:380.74 MPa
Tensile Ultimate Strength:28.39 MPa
Tensile Yield Strength:28.39 MPa
Viscoelastic LayerVHB5908 (Acrylic Foam Tape, 3M, USA)Density:720 kg/m3
Young’s Modulus:0.90 MPa
Poisson’s Ratio:0.49
Bulk Modulus:149.9 MPa
Shear Modulus:0.3 MPa
Table 3. Specifications of measuring equipment.
Measuring EquipmentModelSpecifications
Accelerometer8786A5—(Kistler, Switzerland)
  • Measuring Range:
±5 g
  • Sensitivity:
1026 mV/g
  • Transverse Sensitivity:
0.8%
  • Resonant Frequency:
27 KHz
  • Operating Temperature:
−54 to 80 °C
  • Mass:
21.176 g
  • Height:
21.4 mm
  • Diameter of bottom:
14.54 mm
  • Material:
Stainless Steel
Accelerometer8640A5—(Kistler, Switzerland)
  • Measuring Range:
±5 g
  • Sensitivity:
1071 mV/g, 943 mV
  • Transverse Sensitivity:
3%
  • Resonant Frequency:
17 KHz
  • Operating Temperature:
–40 to 55 °C
  • Mass:
3.5 g
  • Height:
10.2 mm
  • Diameter of bottom:
11.8 mm
  • Material:
Stainless Steel
OscilloscopeTBS 1102B—(Tektronix, USA)
  • Bandwidth:
100 MHz
  • Sampling Rate:
2 GS/s
  • Input Sensitivity:
2 mV to 5 V/div.
  • Max Voltage:
300 V rms
Table 4. Total mass of prototype and accelerometer for experiments 1 and 2.
Voice Coil Test
Setup PlainSetup non-AuxeticSetup Aux
Total Mass (g)24.0023.9023.90
Granite Test
Total Mass (g)6.366.206.18
Table 5. Motion setup for each experiment set, varying target acceleration and deceleration.
Voice Coil Setup for Each Experiment Set
Test 1Test 2Test 3Test 4Test 5
Stroke (mm)2.52.52.52.52.5
Dwell (ms)500500500500500
Velocity (mm/s)500500500500500
Target Acceleration/Deceleration (g)0.51234
Target Acceleration/Deceleration (mm/s2)4905981019,62029,43039,240
Kill Deceleration4.905 × 1054.905 × 1054.905 × 1054.905 × 1054.905 × 105
Jerk (mm/s3)4.91 × 1084.91 × 1084.91 × 1084.91 × 1084.91 × 108
Table 6. Overall mean displacements of the top surface of the auxetic layer with varying thickness measured at open and closed slits, with highest absolute values in bold.
Convex Auxetic Layer—Convex
Net Tangential Displacement @ Convex AUX Layer—Open (μm)Net Tangential Displacement @ Convex AUX Layer—Closed (μm)Net Radial Displacement @ Convex AUX Layer—Open (μm)Net Radial Displacement @ Convex AUX Layer—Closed (μm)
Thickness 0.125 mm−1.15−1.264.081.89
Thickness 0.25 mm−1.09−1.575.093.00
Thickness 0.5 mm−0.17−1.885.484.38
Thickness 1 mm1.09−2.365.044.85
Thickness 2 mm1.44−2.084.064.08
Thickness 4 mm1.00−1.322.592.52
Table 7. Overall mean displacements of the bottom surface of the auxetic layer with varying thickness measured at open and closed slits, with highest absolute values in bold.
Bottom Auxetic Layer—Concave
Net Tangential Displacement @ Bottom AUX Layer—Open (μm)Net Tangential Displacement @ Bottom AUX Layer—Closed (μm)Net Radial Displacement @ Bottom AUX Layer—Open (μm)Net Radial Displacement @ Bottom AUX Layer—Closed (μm)
Thickness 0.125 mm−1.46−1.03−1.06−3.23
Thickness 0.25 mm−1.74−0.89−2.35−4.43
Thickness 0.5 mm−1.600.32−4.00−5.19
Thickness 1 mm−1.661.80−4.71−5.15
Thickness 2 mm−1.521.92−4.09−4.18
Thickness 4 mm−0.991.27−2.66−2.56
Table 8. Results of first 6 modes of the plain, non-aux and aux prototypes with a 3.5 g and 21.176 g accelerometer.
Modal Analysis of ABS-HDPE Cell—Kistler—8640A5 (3.5063 g)
Mode (i)Plain (fi)
Hz
Non-Aux (fi)
Hz
Aux (fi)
Hz
1290.85202.51208.61
21054.10609.30731.99
31057.80618.33735.70
41795.00812.251310.20
51795.301285.901507.80
61836.001296.301513.50
Modal Analysis of ABS-HDPE Cell—Kistler—8786A5 (21.176 g)
Mode (i)Plain (fi)
Hz
Non-Aux (fi)
Hz
Aux (fi)
Hz
1133.1894.8697.17
2480.29275.44326.91
3482.30278.92328.35
4807.60422.06678.04
5807.70575.31680.00
61132.10580.07717.71
Table 9. Results of overall damping ratio and settling time of HDPE/ABS models. Results from the auxetic model boxed in green shows lower settling time as compared to the others.
Result Damping Ratio and Settling Time
ModelZ Damping RatioSettling Time (1 G—9.81 m/s2)Settling Time (0.5 G—4.905 m/s2)Settling Time (0.2 G—1.962 m/s2)Settling Time (0.1 G—0.981 m/s2)
Plain0.0260.05120.06670.08730.1011
Non-Aux0.0470.04120.05350.07080.0832
Aux0.0460.04000.05200.06880.0808
Table 10. Comparison of average damping values and their standard deviations.
Average Damping Ratio and Standard Deviation for Various Input Accelerations
0.5 g
ModelAverageStandard Deviation
Plain0.0310.055
Non-Aux0.0420.103
Aux0.0360.157
1 g
ModelAverageStandard Deviation
Plain0.0810.055
Non-Aux0.0490.115
Aux0.0680.160
2 g
ModelAverageStandard Deviation
Plain0.0990.079
Non-Aux0.1300.275
Aux0.1300.226
3 g
ModelAverageStandard Deviation
Plain0.0890.128
Non-Aux0.1590.099
Aux0.2270.111
4 g
ModelAverageStandard Deviation
Plain0.1250.096
Non-Aux0.2600.099
Aux0.2900.047
Disclaimer/Publisher’s Note: The statements, opinions and data contained in all publications are solely those of the individual author(s) and contributor(s) and not of MDPI and/or the editor(s). MDPI and/or the editor(s) disclaim responsibility for any injury to people or property resulting from any ideas, methods, instructions or products referred to in the content.