Article

Waves After Waves: The Use of Citric Acid as Salt Crystallization Inhibitor for Improving the Resistance of Concrete in Marine Environments

by
Maria Carla Ciacchella
1,*,
Myrta Castellino
2,
Andrea Tomassi
3,*,
Fabio Trippetta
4,
Assunta Marrocchi
5 and
Maria Paola Bracciale
1
1
Department of Chemical Engineering Materials Environment, Sapienza University of Rome, 00185 Rome, Italy
2
Department of Civil, Building and Environmental Engineering, Sapienza University of Rome, 00185 Rome, Italy
3
Faculty of Engineering, International Telematic University UniNettuno, 00186 Rome, Italy
4
Department of Earth Sciences, Sapienza University of Rome, 00185 Rome, Italy
5
Department of Chemistry, Biology and Biotechnology, University of Perugia, 06123 Perugia, Italy
*
Authors to whom correspondence should be addressed.
J. Compos. Sci. 2025, 9(11), 639; https://doi.org/10.3390/jcs9110639
Submission received: 21 October 2025 / Revised: 9 November 2025 / Accepted: 14 November 2025 / Published: 20 November 2025
(This article belongs to the Special Issue Sustainable Cementitious Composites)

Abstract

This study investigates the effectiveness of citric acid as a salt crystallization inhibitor aimed at improving the durability and mechanical performance of concrete exposed to marine environments. The goal is to evaluate whether the addition of citric acid can mitigate the deterioration of concrete caused by salt crystallization during wet–dry cycles and simulated wave impacts. The novelty of this work lies in the experimental demonstration that a simple and environmentally friendly organic compound can effectively reduce salt-induced damage in marine-exposed concrete. Concrete samples were subjected to repeated wet–dry cycles and simulated marine wave impacts to assess changes in their physical and elastic properties. Variations in P-wave and S-wave velocities, Young’s modulus, and the effects of salt crystallization within the concrete matrix were evaluated through acoustic measurements. Results show that citric acid significantly reduces internal cracking, stiffness loss, and salt accumulation, leading to enhanced structural integrity and greater resistance to environmental stressors. These findings highlight the potential of citric acid as a sustainable additive for improving the long-term durability and mechanical stability of concrete structures in marine environments.

1. Introduction

1.1. Concrete Durability in Marine Environnement

The assessment of concrete structures durability has gained significant attention [1,2,3], particularly in marine environments [4,5,6]. The emphasis on the preservation of concrete integrity stems from the role it plays in upholding the safety and operational effectiveness of various infrastructure systems, including buildings, bridges, and highways [7,8]. Concrete structures can be subjected to complex harsh environmental conditions, including exposure to extreme temperatures, chemical attack, and moisture, which can cause significant damage over time [9,10,11,12,13]. To guarantee structures ability to endure such challenging circumstances, it is crucial to actively monitor the material durability [14,15]. The assessment process involves evaluating the material’s current state but also identifying potential defects or vulnerabilities [16,17,18]. It turns particularly evident in marine environment structures, such as ports, harbors, and offshore platforms [19,20]. Marine structures are exposed to the ions of seawater generated, which can lead to significant degradation for salt crystal precipitation [21,22]. In addition, marine structures are subject to significant mechanical loads due to waves, currents, and tides, which can further exacerbate any existing structural issues [23]. Marine structures can suffer different types of loads induced by the hydrodynamic flows of the incoming waves that can be defined based on the observations. In wave clapotis—or standing wave—induced by the reflection phenomenon, the incoming wave crest does not reach the recurved part of the parapet wall [24]. A different case is represented by the formation of impulsive pressures (i.e., shock pressure waves) and forces originating from the top recurved part of the concrete wall [25,26]. Cuomo and co-authors suggested different scenarios in the presence of impulsive pressures and forces induced by breaking wave conditions [27]. Structures must resist against different scenarios by means of the self-weight alongside the characteristics of the employed concrete. The static load refers to the self-weight of the structure and the constant forces acting on it, such as the weight of the structures, anchoring elements, and superstructures (i.e., parapet wall) [28]. On the other hand, the dynamic load is associated with the variable and dynamic actions acting on the structure due to the marine environment and mainly includes wave forces, currents, tides, wind gusts, and other weather events [29]. These actions can generate cyclic and impulsive loads on the structure, which can influence its stability and long-term strength. To properly design a marine structure, it is necessary to consider both types of loads and evaluate the combined effects they can have on the structure itself. This involves analyzing static and dynamic forces, as well as evaluating the effects of the environment to the chemistry of the structure.

1.2. Salt Crystallization Damage and Chemical Inhibitors

Porous materials can be easily exposed to chemo-physical salt attack due to a continuous supply of salt solution and simultaneous evaporation through the drying/evaporative front, resulting in salt crystallization [30]. Salt type and concentration, evaporation rate, surface tension, vapor pressure, and ambient conditions are a few of the external factors that affect cementitious materials susceptibility to salt crystallization damage [31]. Researchers have recently acknowledged and accepted the theory that claims the pressure exerted by salt crystallization as the main mechanism [32,33]. In accordance with this assumption, salt crystals can form from a supersaturated solution and exert damaging pressure against the pore walls. These stresses may be sufficient to overcome the tensile strength of the porous material. Porosity plays a role in the size of the crystallization pressure that can form in a porous system [32,33]. Permeability is the capacity of a porous system to allow the flow of a fluid without causing structural damage. Porosity, on the other hand, is a material’s percentage of vacuum space [34,35]. The diffusivity of an ionic solution in a porous material is influenced by both permeability and porosity. High supersaturations must be maintained against the system’s inclination to reduce them by unrestricted growth or ion diffusion towards zones of lower concentration for harm to occur, as was previously indicated [36]. Materials with high mechanical strength and low porosity are typically more resistant to salt crystallization. Understanding the concrete’s microstructure will be essential to comprehending the material’s weakness. For concrete constructions older than 50 years, it turns crucial [37]. Over time, the completion of the carbonation process within the cementitious materials is completed. According to most scholars, during carbonation the concrete porosity tends to reduce. To monitor the evolution of microstructural alterations, researchers have recently investigated the long-term behavior of cement carbonation phenomena. When exposed to CO2 over an extended period, the initial phase of carbonation leads to a reduction in porosity. Nevertheless, as carbonation progresses, the carbonate matrix undergoes dissolution processes, leading to a reverse trend in porosity evolution. Consequently, this transformation makes the cement matrix more permeable and amenable to saline solutions [38]. Salt crystallization can be inhibited by organic compounds that can minimize or stop the production of salt crystals in concrete [30]. They exert their action by directly modifying the interactions within the water-porous matrix-salt system. An effective crystallization inhibitor is characterized by its ability to slacken the process of crystallization for an extended time, even when used in minimal quantities [39]. Typically, commercially available inhibitors consist of organic compounds, predominantly polycarboxylates and phosphonates, which exhibit a high level of efficacy against various slightly soluble minerals [30]. Among the organic acids, citric acid (CA) demonstrated effective inhibitory properties against the precipitation of salt crystals into traditional construction materials such as stones and bricks [40]. Citric acid is an organic acid with a chemical formula of COOH-CH2-COH(COOH)-CH2-COOH and a molecular weight of 192.12 g/mol. It possesses three carboxyl groups (-COOH) and one alcohol group (-OH) [41]. By introducing citric acid into porous materials, it hinders the formation and growth of salt crystals within the material’s pores and voids [30,42]. The effectiveness of citric acid as a salt crystallization inhibitor in concrete will be investigated for the first time in this study. Crystallization is a complex process that involves several stages, as shown in Figure 1. Initially, salts in solution exist in a dissolved state, where the system’s free energy is low. As the degree of supersaturation increases, nucleation begins, where small clusters of ions form into critical nuclei. These nuclei must reach a certain size to become stable, as their formation requires overcoming a free energy barrier. Once this critical size is achieved, the process shifts towards crystal growth. At this point, further growth occurs with the gradual addition of ions to the existing crystal lattice, resulting in the formation of larger and more stable crystals. The overall process is governed by the thermodynamic principle that systems tend toward lower Gibbs free energy, with equilibrium reached when the salt concentration falls below the saturation threshold [43,44]. The introduction of citric acid modifies this process, delaying or inhibiting nucleation and crystal growth, and thus potentially reducing the damage to concrete.
Recent studies on concrete durability in marine environments indicate that material composition and mix design critically influence long-term performance under aggressive exposure. Mahmood & Ayub (2023) reported that replacing 30% of natural aggregate with recycled aggregate reduced compressive and tensile strength by roughly 30% and decreased corrosion resistance by 40% under both simulated and field conditions [45]. Supplementary cementitious materials, such as fly ash, metakaolin (optimal at 10–15%), and slag (optimal at 40–60%), have been shown by Qu et al. (2021) and Li et al. (2022b) to refine pore structure, reduce chloride ingress, and enhance carbonation resistance [46,47]. Kim et al. (2021) demonstrated that incorporating ground granulated blast furnace slag can reduce chloride penetration and extend predicted service life by more than sevenfold [48]. Further research has explored innovative strategies to mitigate chloride-induced deterioration. Sosa et al. (2020) found that self-compacting concrete incorporating electric arc furnace and cupola slag exhibited less than 0.3% chloride content over a 6-mm depth and no rebar corrosion after 10 months [49], while Prajeesha (2024) reported that bacterial concrete with rice husk ash, corn starch, and silica fume fully prevented rebar corrosion after one year of submerged exposure [50]. Field studies by Li et al. (2022a) and Melchers (2020) confirmed that low-permeability concrete and surface densification treatments offer additional protection, particularly in the tidal and splash zones where deterioration is most severe [51,52]. Ahmed et al. (2020) further noted that glass fiber reinforced polymer (GFRP) reinforcement outperformed basalt alternatives in seawater–sea-sand concrete [53]. More recently, Zeng et al. (2025) conducted a comprehensive durability assessment of ultra-high-performance concrete (UHPC) and FRP grid-reinforced UHPC (FRU) plates under artificial seawater exposure [54]. Their results demonstrated that FRU plates, particularly those reinforced with polyethylene (PE) fibers, exhibited significantly smaller strength losses (below 7%) after one year, compared to plain UHPC specimens. Scanning electron microscopy confirmed the superior bond integrity and reduced cracking in FRU systems, highlighting the effectiveness of combining UHPC matrices with corrosion-free FRP reinforcements for marine applications. This study underscores the potential of FRU composites as next-generation materials for offshore and coastal infrastructure, offering both mechanical resilience and long-term durability in chloride-rich environments.
Previous research has addressed the use of citric acid and related chemical compounds to improve the performance of concrete and other construction materials exposed to saline and marine environments. Studies on ordinary concrete have shown that incorporating a small amount of citric acid as an admixture can enhance compressive, tensile, and flexural strength, as well as the dynamic modulus of elasticity, after extended exposure to mixed salt solutions. These effects have been linked to reduced porosity, delayed hydration, and limited ion penetration, contributing to improved durability against chloride and sulfate attack [55]. Investigations on non-cementitious materials have produced different outcomes. When tested as a crystallization inhibitor in calcareous substrates, citric acid has shown weaker performance compared with other inhibitors such as polyacrylic acid and aminotris (methylenephosphonic acid), suggesting that its effectiveness may depend on the mineralogical characteristics of the material and the exposure conditions [56]. Research on polymer concretes has also demonstrated that chemical composition and matrix type strongly influence resistance to acidic and saline environments, highlighting the importance of studying admixture effects under specific material systems [57]. Reviews of corrosion processes and protective methods in marine concretes, particularly those employing coral aggregates, have provided a broader understanding of degradation mechanisms and emphasized the need for new, sustainable solutions to improve the longevity of coastal infrastructure [58,59,60]. Although these studies contribute valuable insights into the behavior of citric acid and related compounds, the literature remains limited in addressing the combined effects of salt crystallization and cyclic marine exposure. The present work aims to fill this gap by experimentally assessing the performance of citric acid-treated concrete under controlled wet–dry cycles and simulated wave impacts. By integrating acoustic and mechanical evaluations, this study offers new evidence on how citric acid mitigates salt-induced damage and enhances the durability of concrete in aggressive marine conditions. In addition to addressing this gap, the novelty of the present study lies in three key aspects. First, the research focuses specifically on concrete exposed to simulated marine dynamic conditions, rather than on static saline immersion or on non-cementitious porous materials as in previous studies. Second, the methodology integrates mechanical testing with acoustic measurements, providing a combined evaluation of the evolution of internal damage and elastic properties under cyclic environmental stress. This dual approach enables the detection of early deterioration mechanisms that are not observable through conventional mechanical testing alone. Third, the experimental design reproduces realistic exposure scenarios through controlled wet–dry cycles and simulated wave impacts, thus establishing a direct link between laboratory findings and actual marine field conditions. These elements together represent a methodological and applicative advancement in understanding the role of citric acid as a sustainable crystallization inhibitor in marine concrete systems. The novelty of this study lies in providing a systematic experimental demonstration of the effectiveness of citric acid as a salt crystallization inhibitor under real wave flume boundary conditions. This setup reproduces the simultaneous action of salt deposition, wet–dry cycles, and mechanical wave impacts, allowing for a realistic assessment of material behavior under marine exposure. Unlike traditional surface treatments, which require periodic maintenance and involve high long-term costs, the proposed approach integrates citric acid directly into the cementitious matrix, ensuring continuous and intrinsic protection against crystallization-induced damage. Furthermore, citric acid is a bio-derived and non-toxic compound that complies with European standards for the safe handling, use, and disposal of chemical substances, providing an environmentally sustainable alternative to conventional synthetic inhibitors.

2. Materials and Methods

In the pursuit of advancing understanding of concrete behavior under wave impact stress, this study followed a comprehensive methodology (Figure 2).

2.1. Pre Scenario

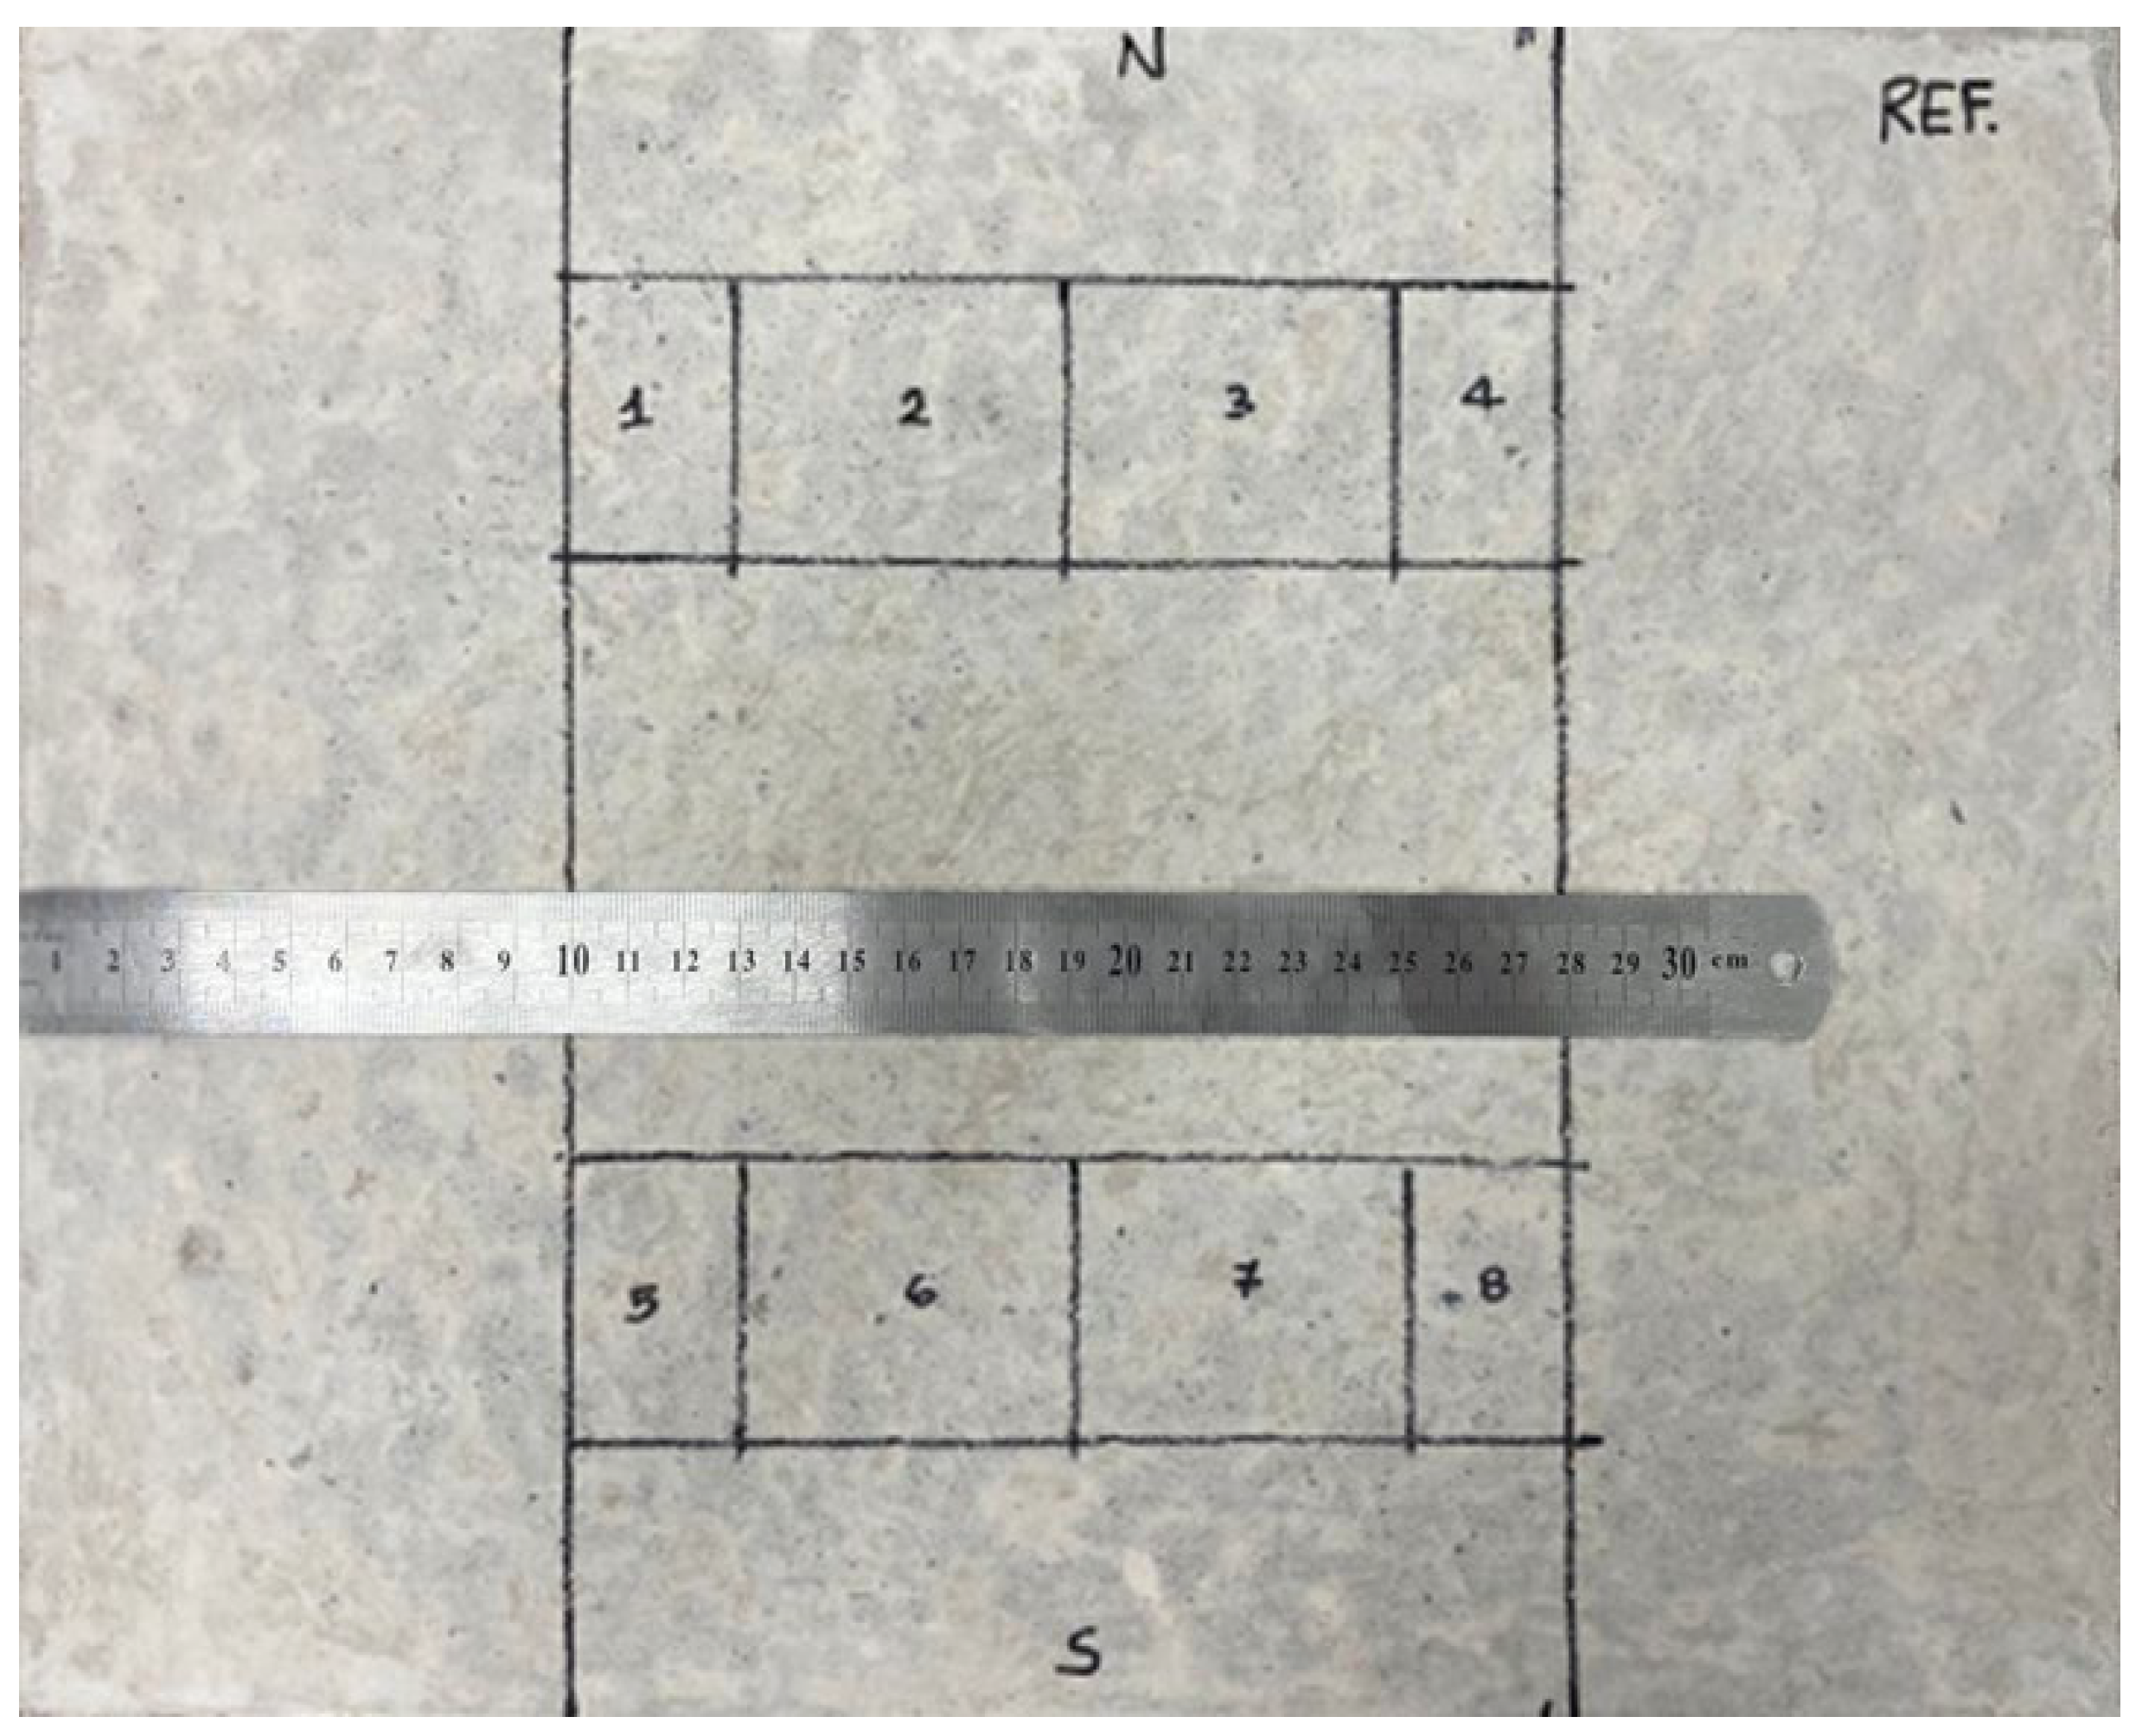
In the first phase, three concrete samples were prepared according to UNI EN 197-1:2011. In the concrete design, it was decided to use cement CEM II/B-LL32.5 R and mixed river silica sand with a guaranteed grain size curve of 0/10 mm and density > 2600 kg/m3. The use of additives was avoided to significantly reduce the variables. The water-to-binder ratio was set at 0.55, while the binder-to-aggregate ratio was defined as 1:2 by volume. Concrete specimens were packed in rectangular-based parallelepipeds of size 30 × 40 × 3 cm using wooden formwork (Figure 2A). Manual compaction was preferred. Specimens were removed from their molds after 24 h then cured at room temperature in distilled water for 28 days. A grid, consisting of equidistant nodes, was drawn on the parallel faces of the samples to ensure consistent measurements at specific points. Each sample was marked with an “N” for the upper portion and “S” for the lower portion; these symbols facilitate analyses pertinent to the simulation of wave motion in the subsequent steps of the used methodology (for comprehensive details refer to the succeeding sections) (Figure 3).
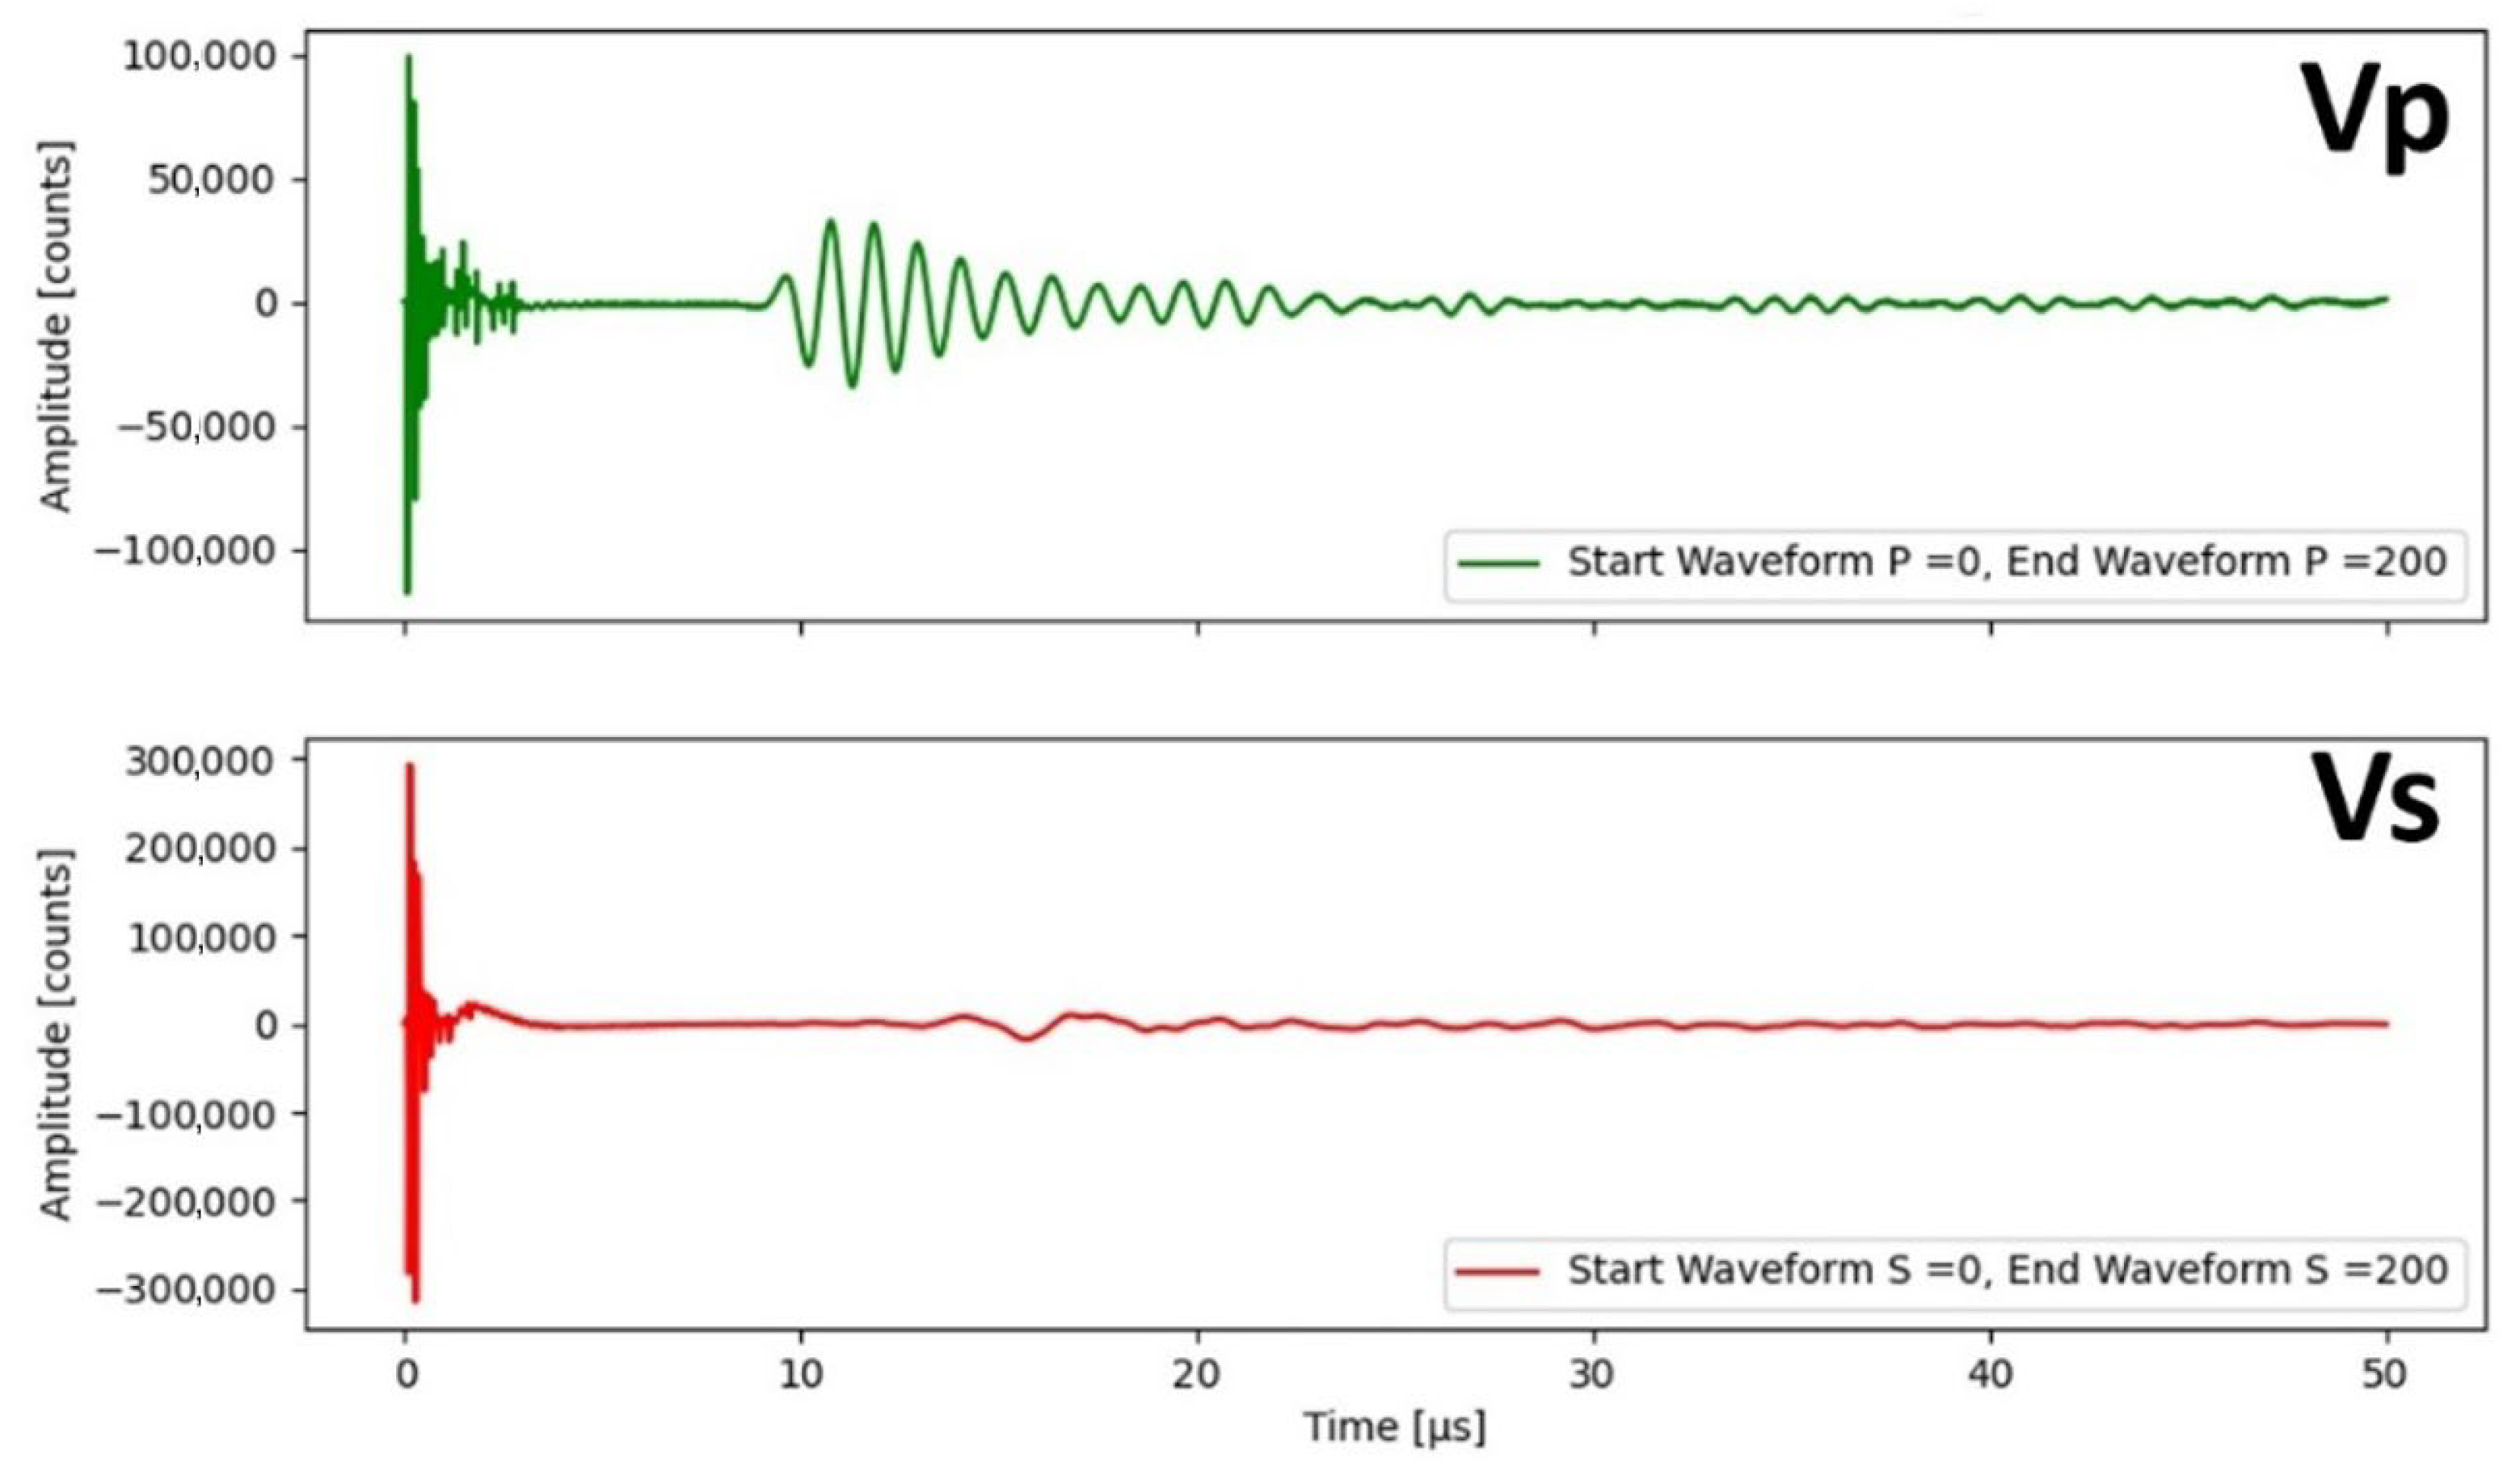
In the Pre-scenario phase, acoustic measurements were conducted on untreated samples (Figure 2B). The pulse-transmission method, which employs piezoelectric transducers as emitters and receivers of acoustic waves, has been widely adopted and refined in various studies to analyze the impact of porosity, density, and other infilling material properties on mechanical properties and thus its integrity [62,63,64,65]. Primary wave velocity (Vp) and Secondary wave velocity (Vs) were measured using a USB 8 M 8-channels multiplexed system ultrasonic device generator(Mistras Eurosonic, Vitrolles, France). Measurements were made at ambient pressure and temperature by using two 1 MHz piezoelectric transducers at time (two for P-wave and two for S-wave measurements) that are connected to this device and put in contact at the edges of the investigated material. Signals from the waveforms were recorded and displayed using scanning imaging processes based on the Mistras Ultrasonic EuroscanV software. The picking of the waves (both P and S) first arrivals was executed using a custom Python code, specifically programmed in Jupyter Notebook Version 7 of Anaconda (Figure 4). The Vp/Vs ratio serves as a proxy indicator for assessing measurement reliability its values falling within the acceptable range of 1.4 to 1.8, especially for materials like the analyzed concrete [62]. The Vp/Vs ratio offers valuable insights into the anisotropic elastic behavior of a material, revealing how P-waves (compression) and S-waves (shear) propagate at varying velocities through the material in different directions. Such behavior can arise from internal structural variations, such as microfractures or preferred orientations of mineral grains. Moreover, the Vp/Vs ratio is intimately linked to the material’s elastic moduli [66,67]. For each specimen (and for each scenario), multiple measurements were carried out at different locations on the sample surface to account for possible local variations in material properties and to improve the reliability of the dataset. This procedure was repeated several times on each specimen to verify the consistency of the results and to minimize the influence of random errors or surface irregularities. The same approach was systematically applied to all experimental scenarios, including pre-exposure, post-exposure, and wave-impact conditions, ensuring methodological uniformity and reproducibility across the entire experimental program.
Knowing the values of Vp and Vs, it was possible to calculate Young’s modulus (E) as:
E = ρ V s 2 ( 3 V p 2 4 V s 2 ) V p 2 V s 2
Since Young’s modulus was calculated from acoustic tests, using the measured values of P-wave (Vp) and S-wave (Vs) velocities, it represents the dynamic Young’s modulus rather than the static one derived from mechanical tests. The dynamic Young’s modulus, as reported in the literature, typically reflects the material’s response to high-frequency stress waves, and is generally higher than the static modulus due to the reduced influence of microcracks and material heterogeneities that are more significant under lower strain rates in static testing conditions [68,69].
Density (ρ) was measured by Anton Paar Ultra-pyc 5000 helium pycnometer from Aton Paar with an accuracy of 0.02% and repeatability of 0.01%. Density was calculated by the pycnometer as the dry weight/volume ratio of the sample. The density used to calculate Young’s modulus was only measured on the untreated sample, as the samples were supposed to be cut to fit into the pycnometer chamber, resulting in the loss of salts precipitated in the pores. However, assuming that the presence of salts in the pores would have increased the density, and since the density (ρ) is in the numerator of Equation (1), the differences in Young’s modulus between the experiments in the different scenarios would probably have been even more pronounced if it had been possible to measure the density of the samples subjected to the different treatments.
The computation of Poisson’s ratio (ν) also utilized the previously measured parameters, namely the P-wave velocity (Vp), S-wave velocity (Vs). Poisson’s ratio is a dimensionless material property that describes the lateral contraction of a material when subjected to axial deformation. The formula used for calculating Poisson’s ratio is as follows:
ν = 1 2 V p 2 2 V s 2 V p 2 V s 2
where ν represents Poisson’s ratio. Poisson’s ratio provides insights into material deformation behavior. This essential parameter influences material response to stress and finds widespread applications in engineering.
The ultrasonic dynamic elastic modulus and dynamic Poisson’s ratio were selected as degradation indicators because they allow non-destructive and repeatable monitoring of the same specimens throughout all exposure stages. These parameters are highly sensitive to early microstructural changes, such as microcrack formation and stiffness loss, which occur before visible cracking. Static tests or direct crack mapping would have required destructive procedures, preventing continuous observation of material evolution. The dynamic approach based on P- and S-wave propagation therefore provides a reliable means to assess internal damage and mechanical degradation under cyclic marine exposure.
All measurements have been performed at the Rock Mechanics and Earthquake Physics Laboratory at Sapienza Earth Science Department. Density and acoustic velocity analyses and modulus calculations were carried out on all concrete sample specimens to assess the differences between the three scenarios explained in the following paragraphs.
Porosity was also measured with the pycnometer by dividing the difference between the geometric volume of the sample and the volume measured with the pycnometer by the geometric volume; for details, see [70,71]. The porosity value only served as a qualitative estimate to ascertain the potential of the salts to precipitate within the samples.

2.2. Post Scenario

During the salt crystallization procedure, all samples underwent wet–dry cycles (Figure 2C). One specimen (WHT) served as a blank and underwent the following explained procedure in distilled water. Another sample (REF) represented a control/reference as it did not contain any salt crystallization inhibitor and was subjected to a saline imbibition procedure. The last sample (ACT) received a prior application of rejection treatment with 1 × 10⁻⁵ M citric acid solution.
The procedure will entail subjecting REF and ACT samples to a pre-conditioning stage of drying in an oven at 60 °C until constant weight is reached, followed by 30 cycles of 16 h drying and 8 h wetting by total immersion in a ternary solution comprising 3 (99 g/L Na2SO4): 1 (99 g/L NaNO3): 1 (85% NaCl—11% MgCl2—4% MgSO4—1% CaCl2—0.5% KCl), which closely replicates the air composition found in coastal areas while effectively accelerating the crystallization phenomenon. The saline solution adopted in this study was formulated to reproduce the ionic composition typically found in marine aerosols rather than in seawater. Marine aerosol represents the principal source of salt deposition and crystallization processes affecting coastal concrete structures that are not in direct contact with the sea. For this reason, the ternary solution used in the wet–dry cycles was composed of sodium sulfate (Na2SO4), sodium nitrate (NaNO3), and a mixed chloride component containing sodium, magnesium, calcium, and potassium chlorides in proportions consistent with those detected in airborne marine particulates. This formulation allows for the controlled simulation of aerosol-induced salt accumulation and crystallization under laboratory conditions, effectively reproducing the exposure mechanisms that occur in real coastal environments.
During the Post-scenario phase, a repeated round of acoustic measurements was performed on the samples following the completion of the wet–dry cycles (Figure 2D). The objective was to discern and analyze any variations in comparison to the measurements taken during the Pre-scenario phase. This iterative acoustic assessment, combined with the elastic parameters’ calculation, aimed to capture changes in the samples, shedding light on the evolving characteristics induced by the wet–dry cycles.

2.3. W Scenario

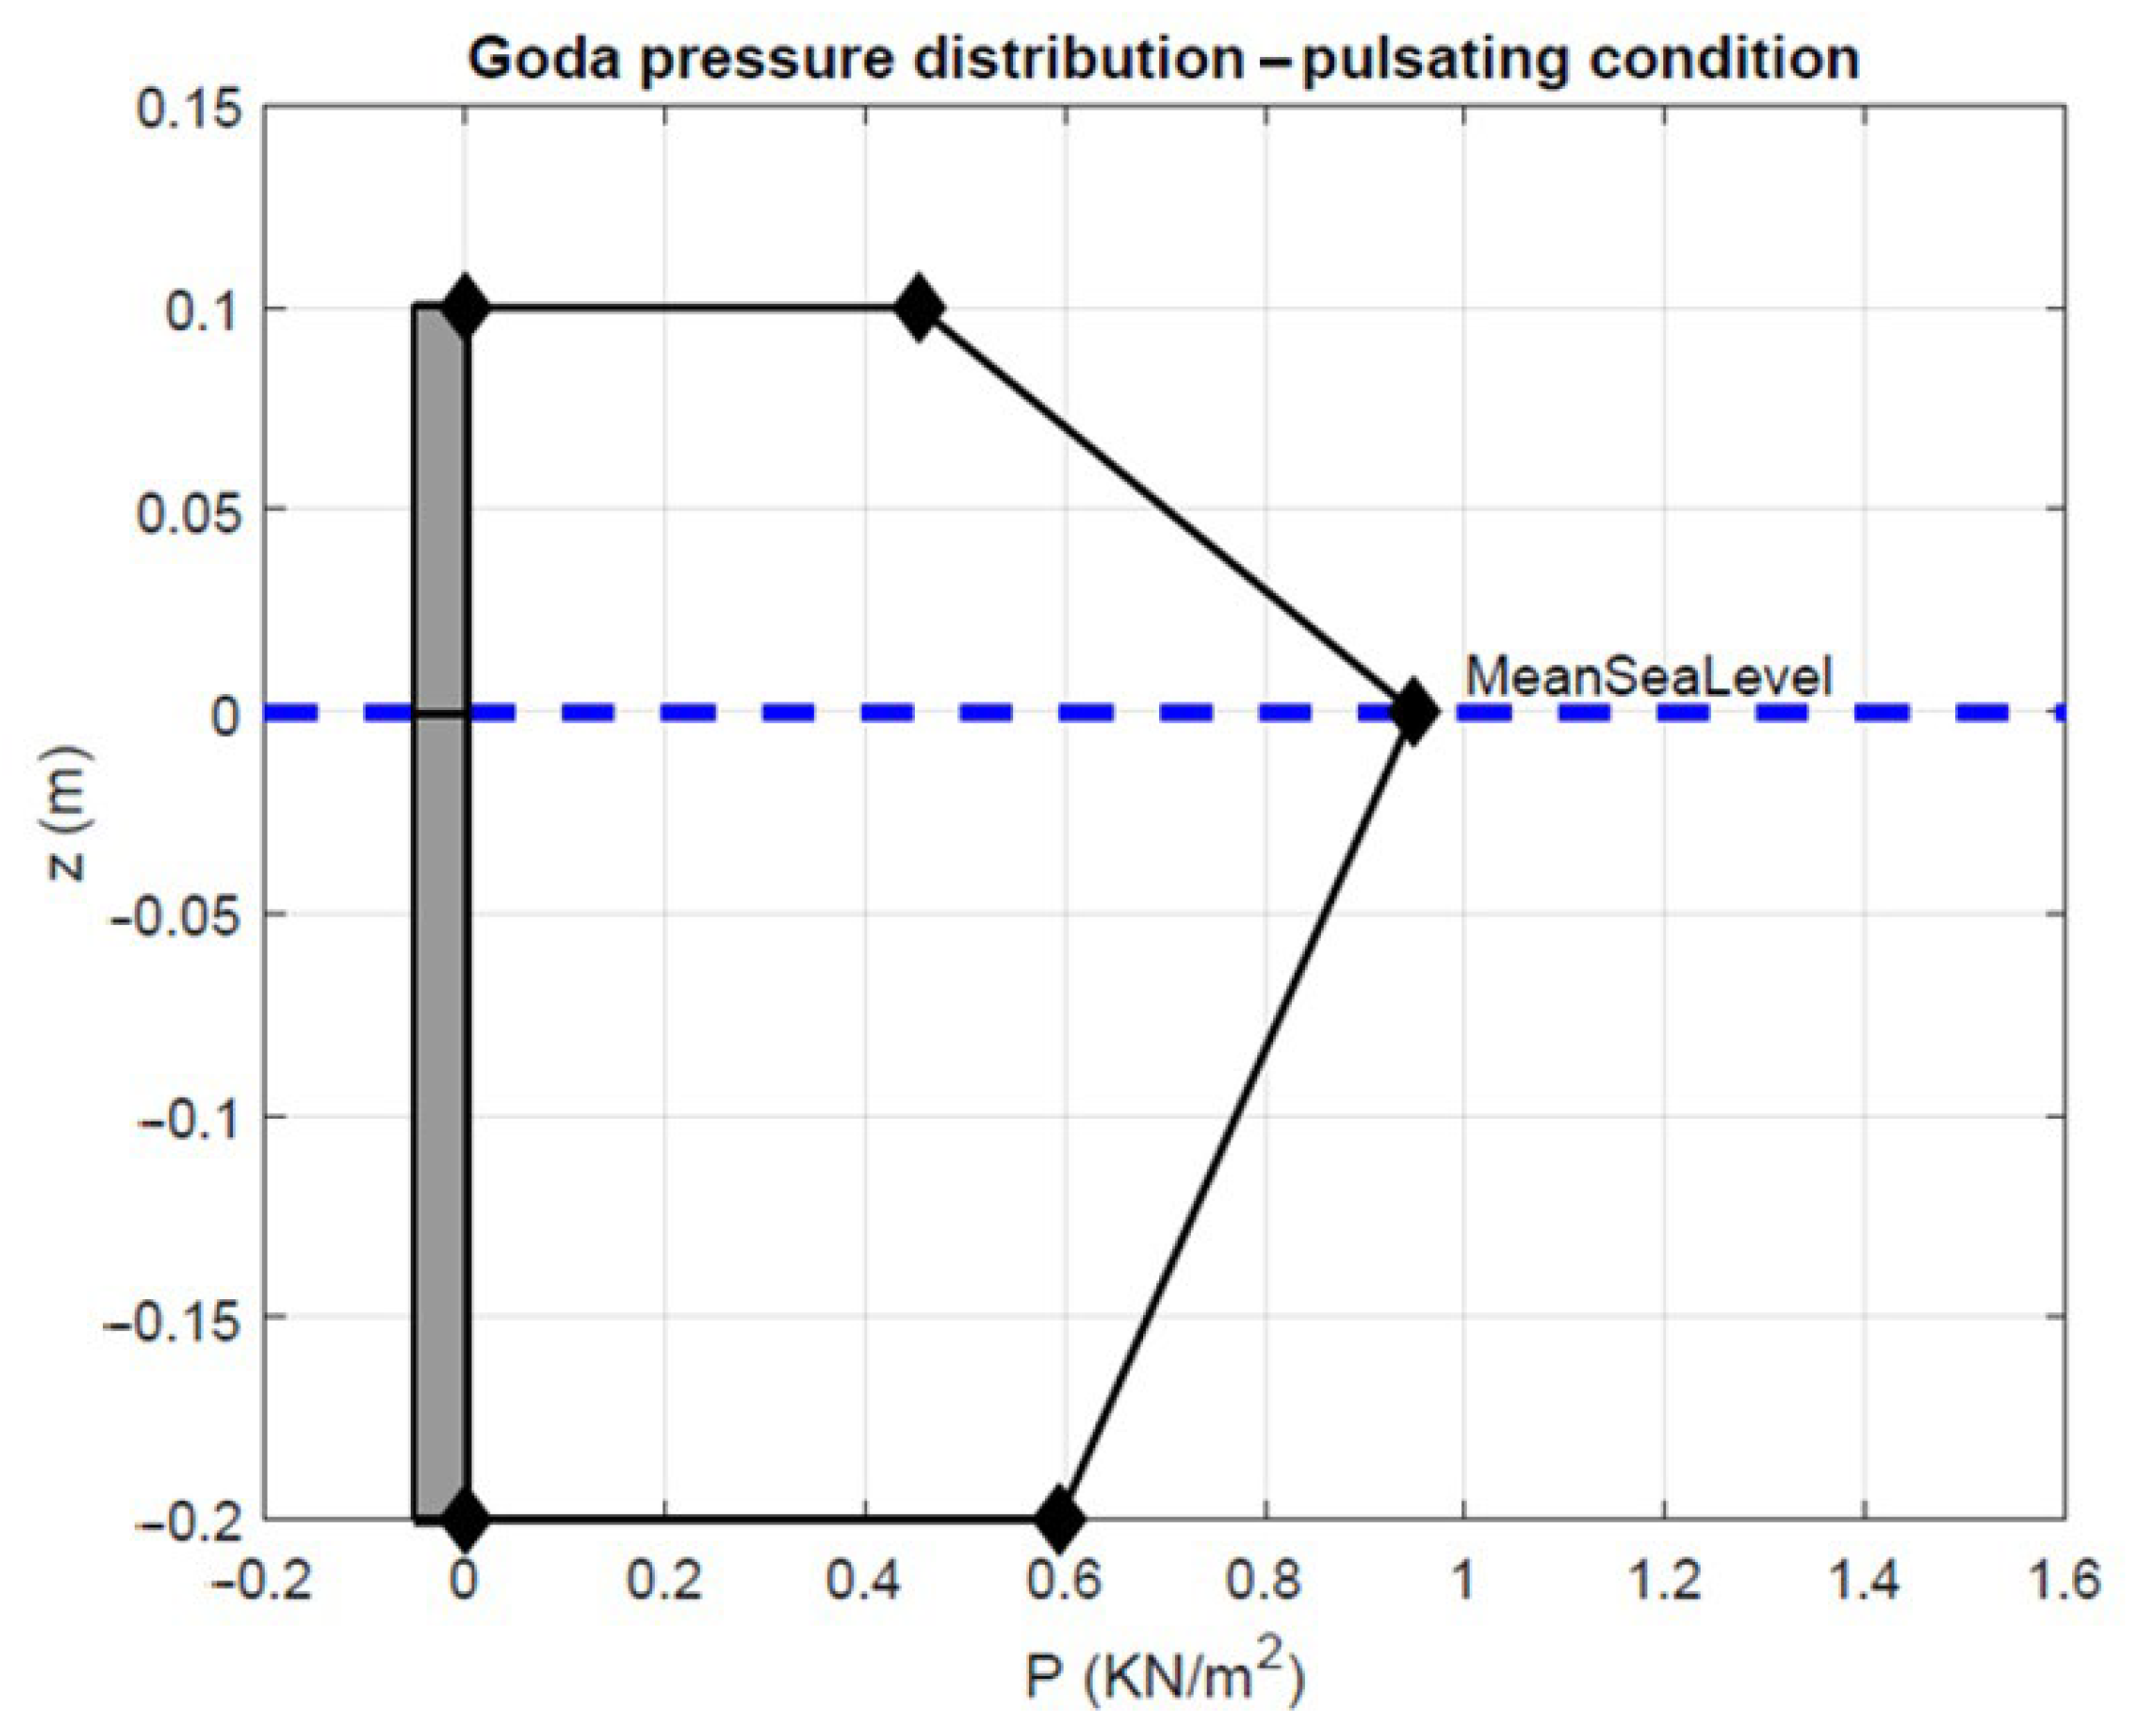
The wave motion simulation in the wave flume constituted the next phase (Figure 2E). The procedure was designed to simulate the effects of a potential marine water ingress on concrete specimens previously exposed to aerosol-like conditions. This stage represents a realistic progression of environmental exposure, where materials initially affected by salt deposition from marine aerosols may later experience direct contact with saline water through capillary rise, splash, or partial submersion. The experimental setup reproduces these conditions under controlled laboratory parameters, allowing the assessment of how prior aerosol-induced alterations influence the material’s response to more aggressive saline infiltration. This approach enables the evaluation of the combined and sequential impact of aerosol exposure and marine ingress on the physical and mechanical performance of the tested concrete. The portion marked as “N” was subjected to wave impact stress, while the portion marked as “S” experienced subaquatic stress. The graph in Figure 5 represents the Goda pressure—the pressure difference between a fluid’s absolute pressure and the ambient atmospheric pressure, representing the effective pressure acting on a surface [72]—distribution under pulsating conditions, showcasing the relationship between pressure (P in kN/m2) and depth (z in meters) below and above the mean sea level. The x-axis denotes the pressure distribution, while the y-axis represents depth. The blue dashed line indicates the mean sea level. Above this level (positive z-values), the structure experiences direct wave impacts, whereas below the mean sea level (negative z-values), the structure is subjected to subaquatic stresses resulting from wave motion without direct impact. The black line delineates the pressure distribution, where the pressure initially remains constant from 0.1 m above sea level down to the mean sea level. At this point, pressure begins to increase gradually until reaching a maximum at approximately 1.5 kN/m2 at −0.15 m, which is well below the mean sea level. This indicates that the impact zone experiences constant pressure near the surface, while the subaquatic region undergoes increased pressure due to wave motion.
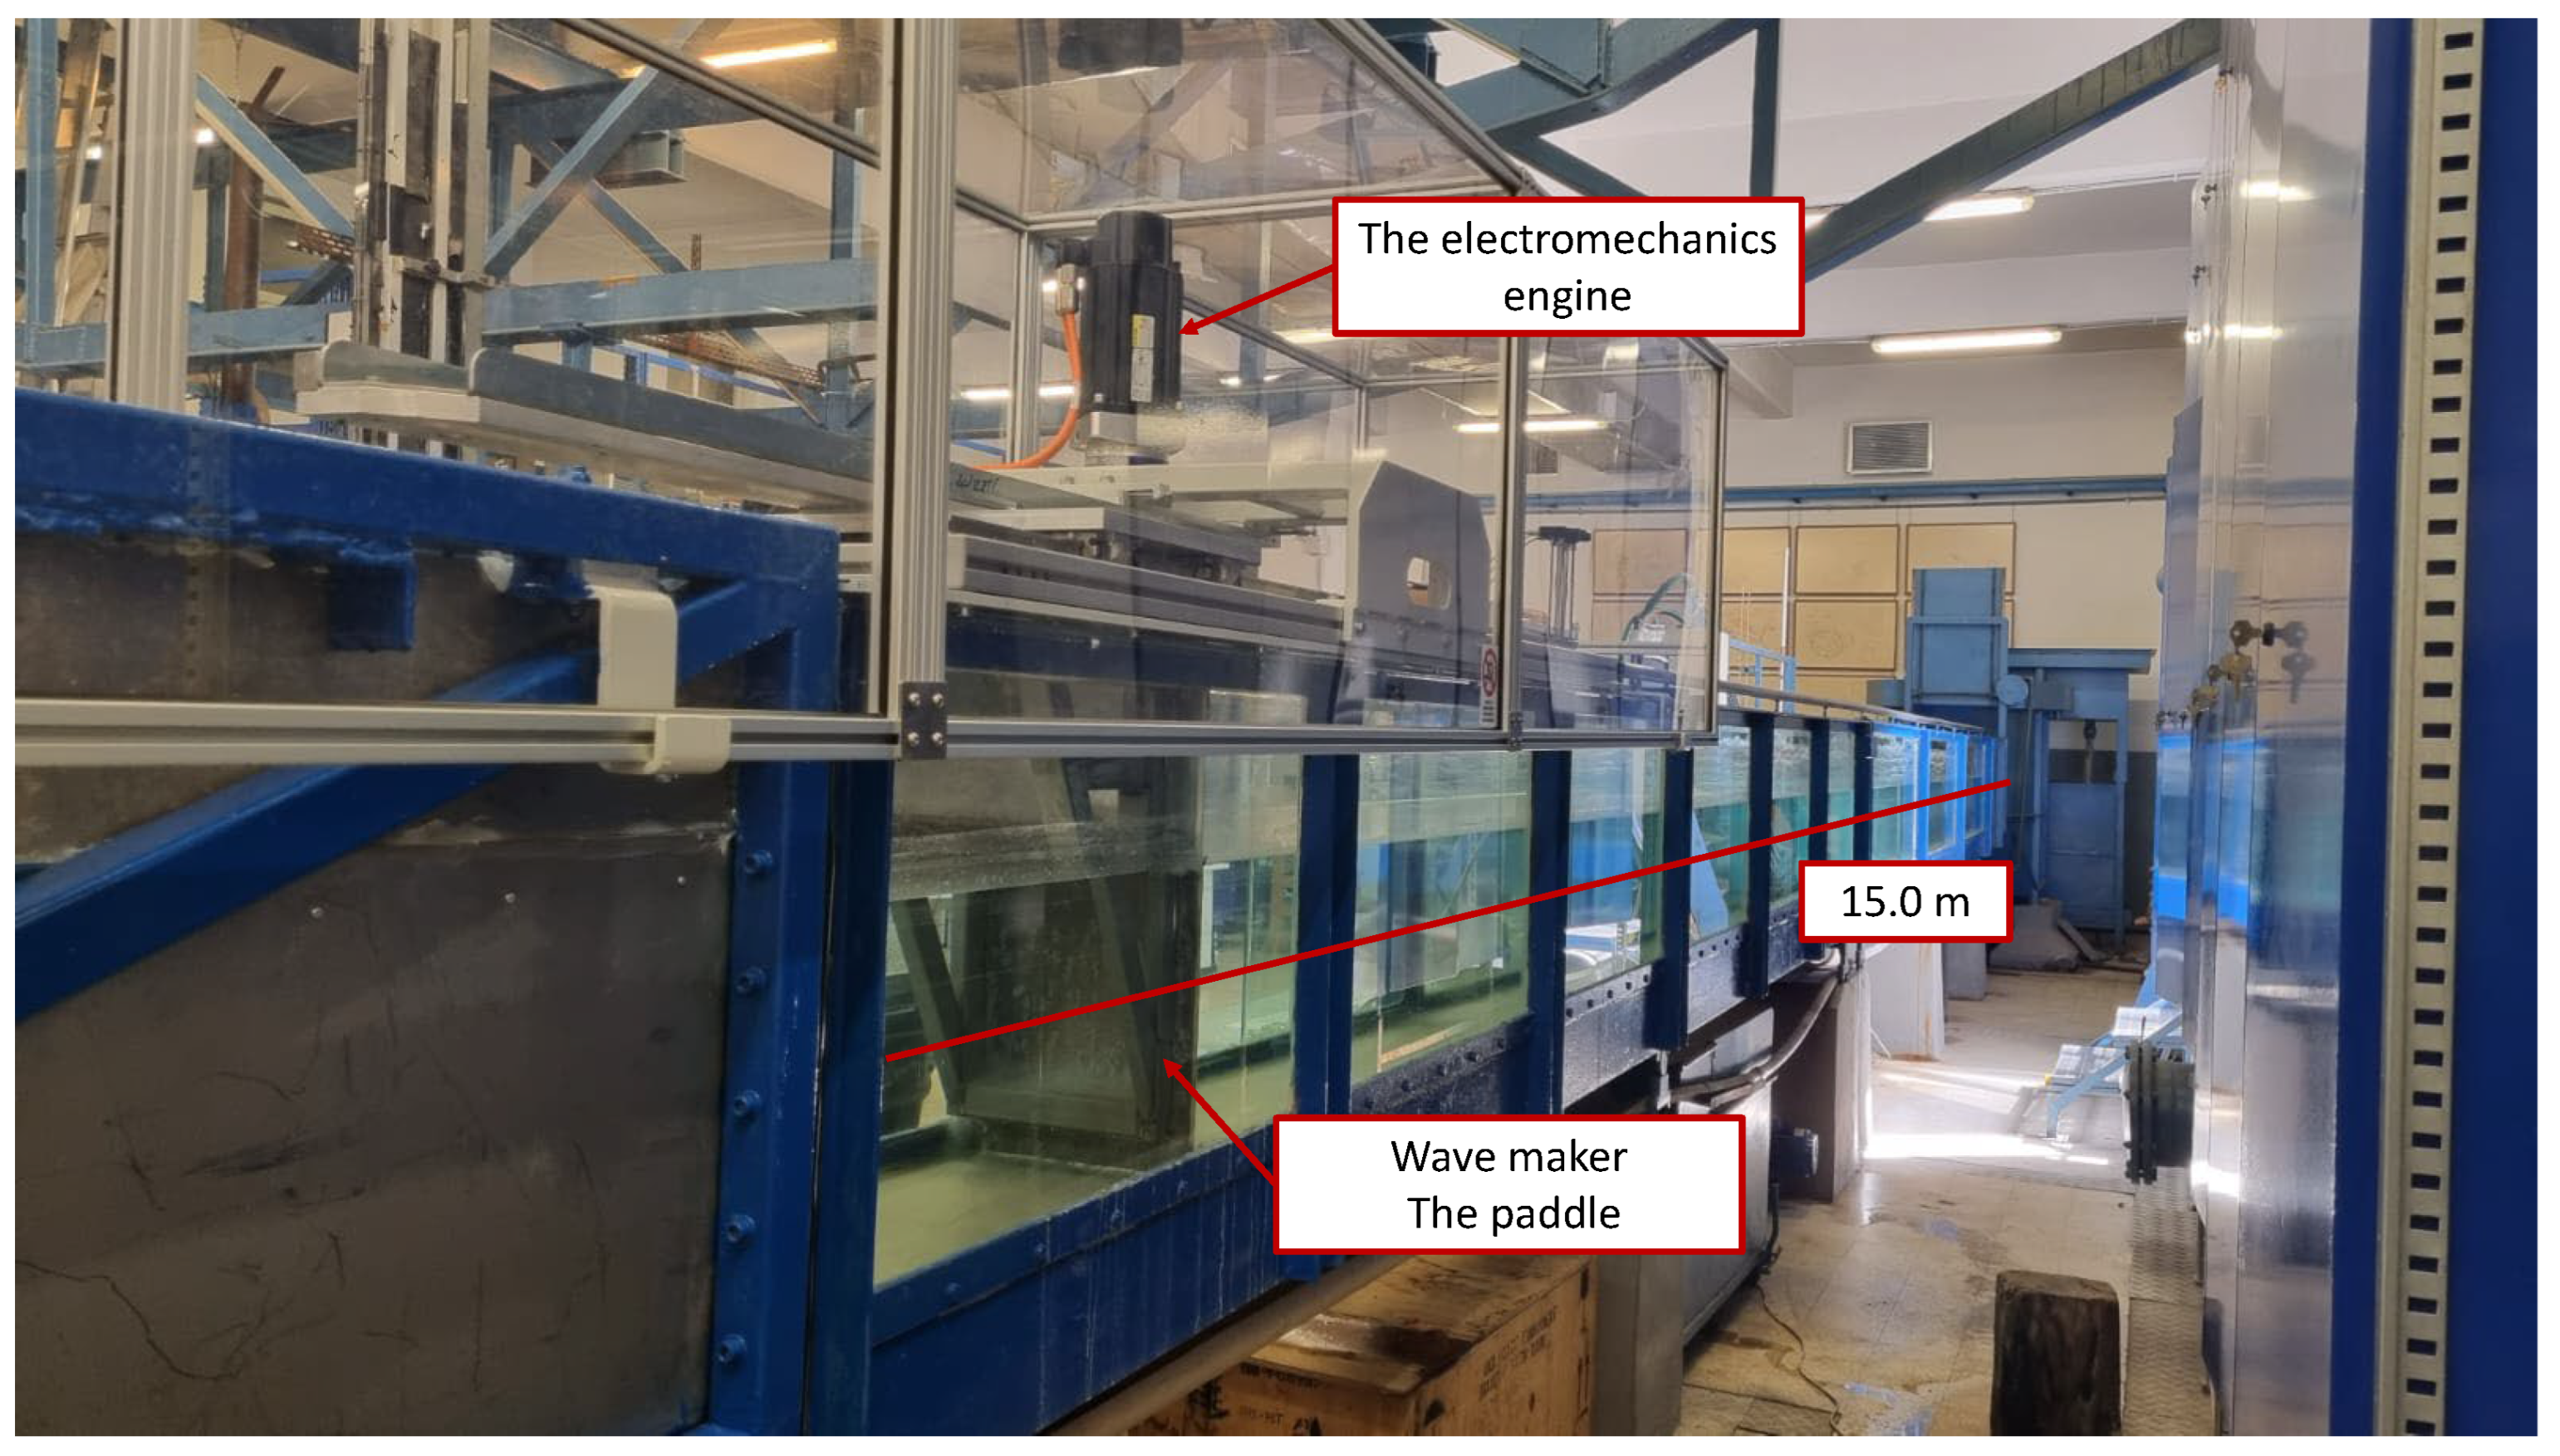
A wave flume characterized by a length of 15.0 m and a cross-section of 0.60 m by 0.60 m was used (Figure 6). The generation of waves in the flume is accomplished by using a piston wavemaker whose movement is electromechanically induced [73]. The characteristics of a generic sea state are synthesized using the AwaSys software Version 8.1, developed by the Danish University of Aalborg. By implementing the active wave absorption technique, it is possible to exploit the entire length of the wave-generating flume, as the incident wave reflected from the end of the channel towards the piston is absorbed by an opposing phase movement that generated the same wave. The wave flume is also equipped with a series of resistive level probes through which reflection analysis can be performed by using the Goda–Suzuki technique and the Mansard and Funke as well [74,75].
The experimentation in the wave flume involved testing a series of sea states that interact with specimens. The sea states are synthesized through a characteristic wave spectrum known as JONSWAP. Each sea state characterized a wave group typically composed of 1000 waves. In the experimental setup, measurements in the flume involved calculating the reflection coefficient of the specimen, which can be synthetically identified as the ratio between the incident wave and the reflected wave. The reflection analysis was conducted using two different analysis techniques: the Goda–Suzuki method, with two-level probes placed near the specimen, and the Mansard–Funke method, which requires the use of three-level signals also in proximity to the specimen. The characterization of the sea states will be based on the typical wave climate characteristics of the Western Mediterranean Sea. The selected wave characteristics were defined by a significant wave height (Hs) of approximately 0.18 m, a peak period (Tp) of 1.3 s, a spectral shape factor (γ) of 3.3, and a breaking index (Hb/h) of about 0.75, consistent with moderate-energy conditions typically observed in Western Mediterranean nearshore environments. These parameters were validated through resistive probe measurements and reflection analysis using the Goda–Suzuki and Mansard–Funke methods, confirming that the generated waves accurately reproduced the intended hydrodynamic conditions. Finally, in the W scenario, a last round of acoustic measurements (and elastic parameters’ calculation) was executed on the samples following the wave motion simulation (Figure 2F). This evaluation aimed to discern and analyze differences in comparison to the Pre-scenario, Post-scenario, and W scenario measurements.

3. Results

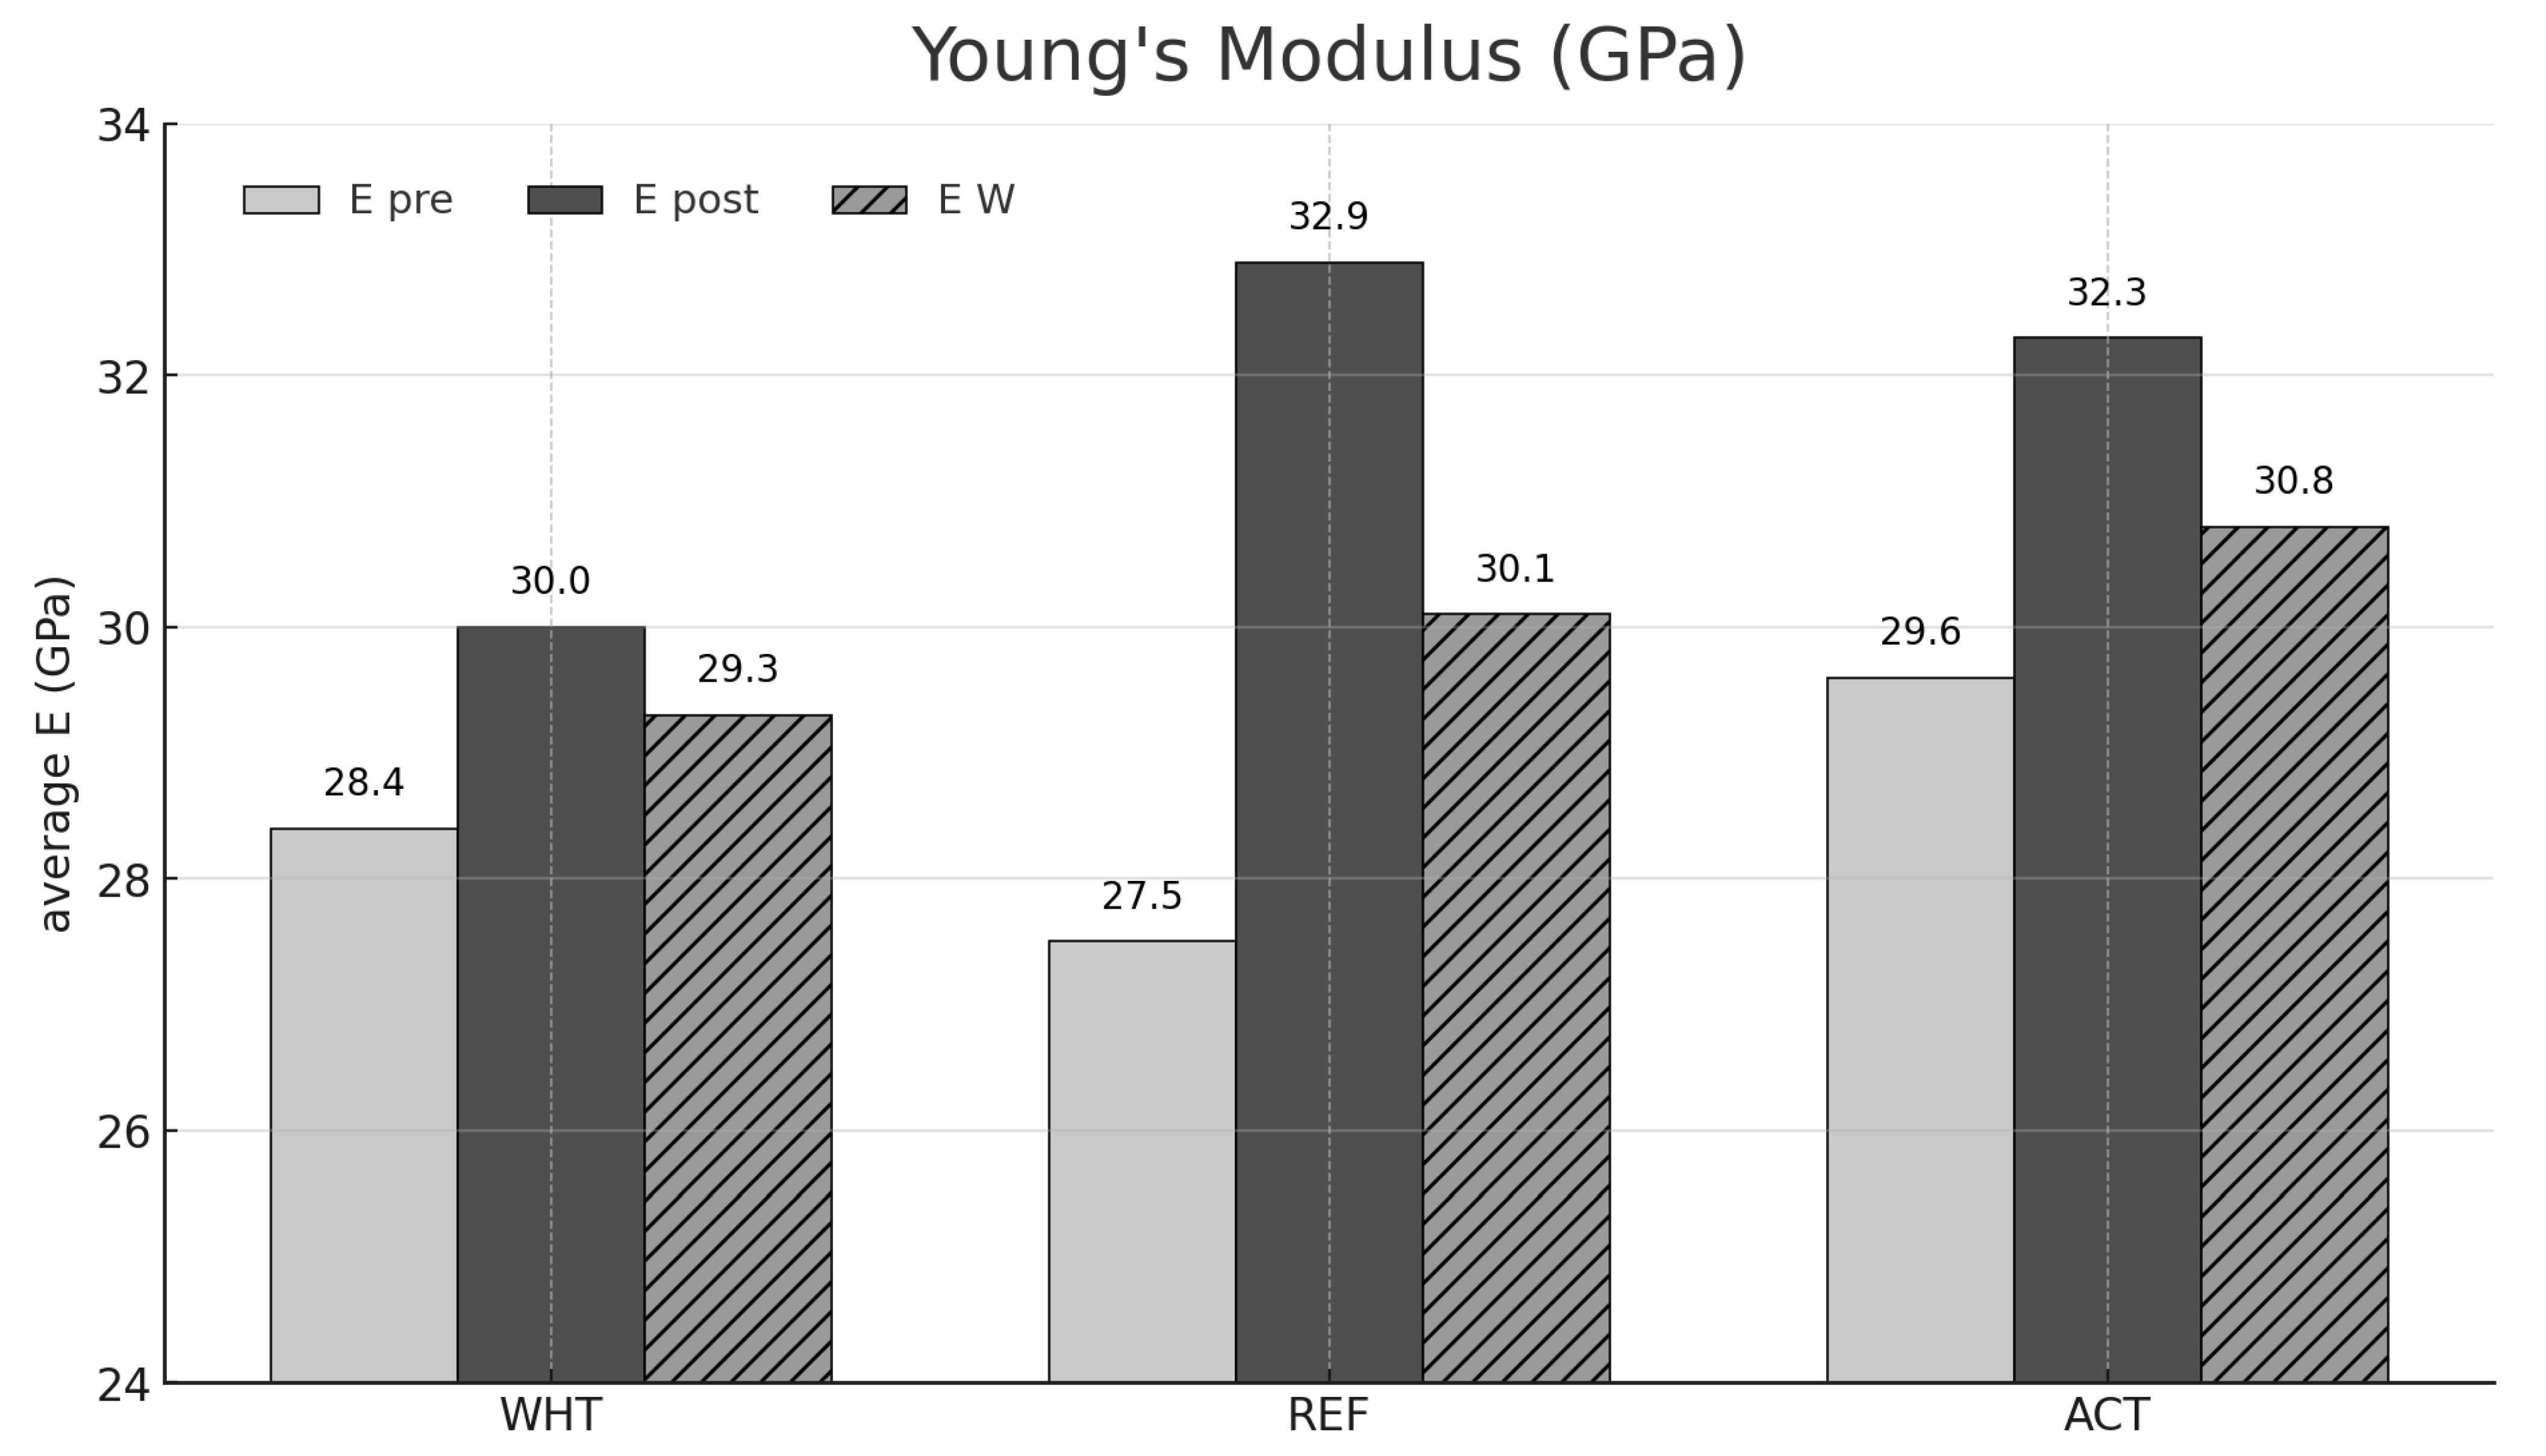
The averages for the measured P-wave velocities, S-wave velocities, and Vp/Vs ratios of the concrete samples are presented in Table 1. Averages of dynamic Young’s modulus (E) calculated with Equation (1) are reported in Table 2 and plotted in a histogram in Figure 7. The average of the sample densities required to calculate the elastic parameters was 2264 kg/m3 according to data obtained by the helium pycnometer. As mentioned, density was only measured on the untreated sample to avoid the loss of precipitated salts, and if it had been possible to measure the crystallized samples, the differences in E would have been even more pronounced due to the likely increase in density. E results show overall typical cement values between 27 and 33 GPa for each sample (REF, ACT, WHT) and for each scenario (Pre, Post, W). This systematic variation in Young’s modulus offers valuable insights into the mechanical behavior of the concrete, highlighting the influence of wet–dry cycles and marine wave motion on its elastic response.

3.1. Pre Scenario

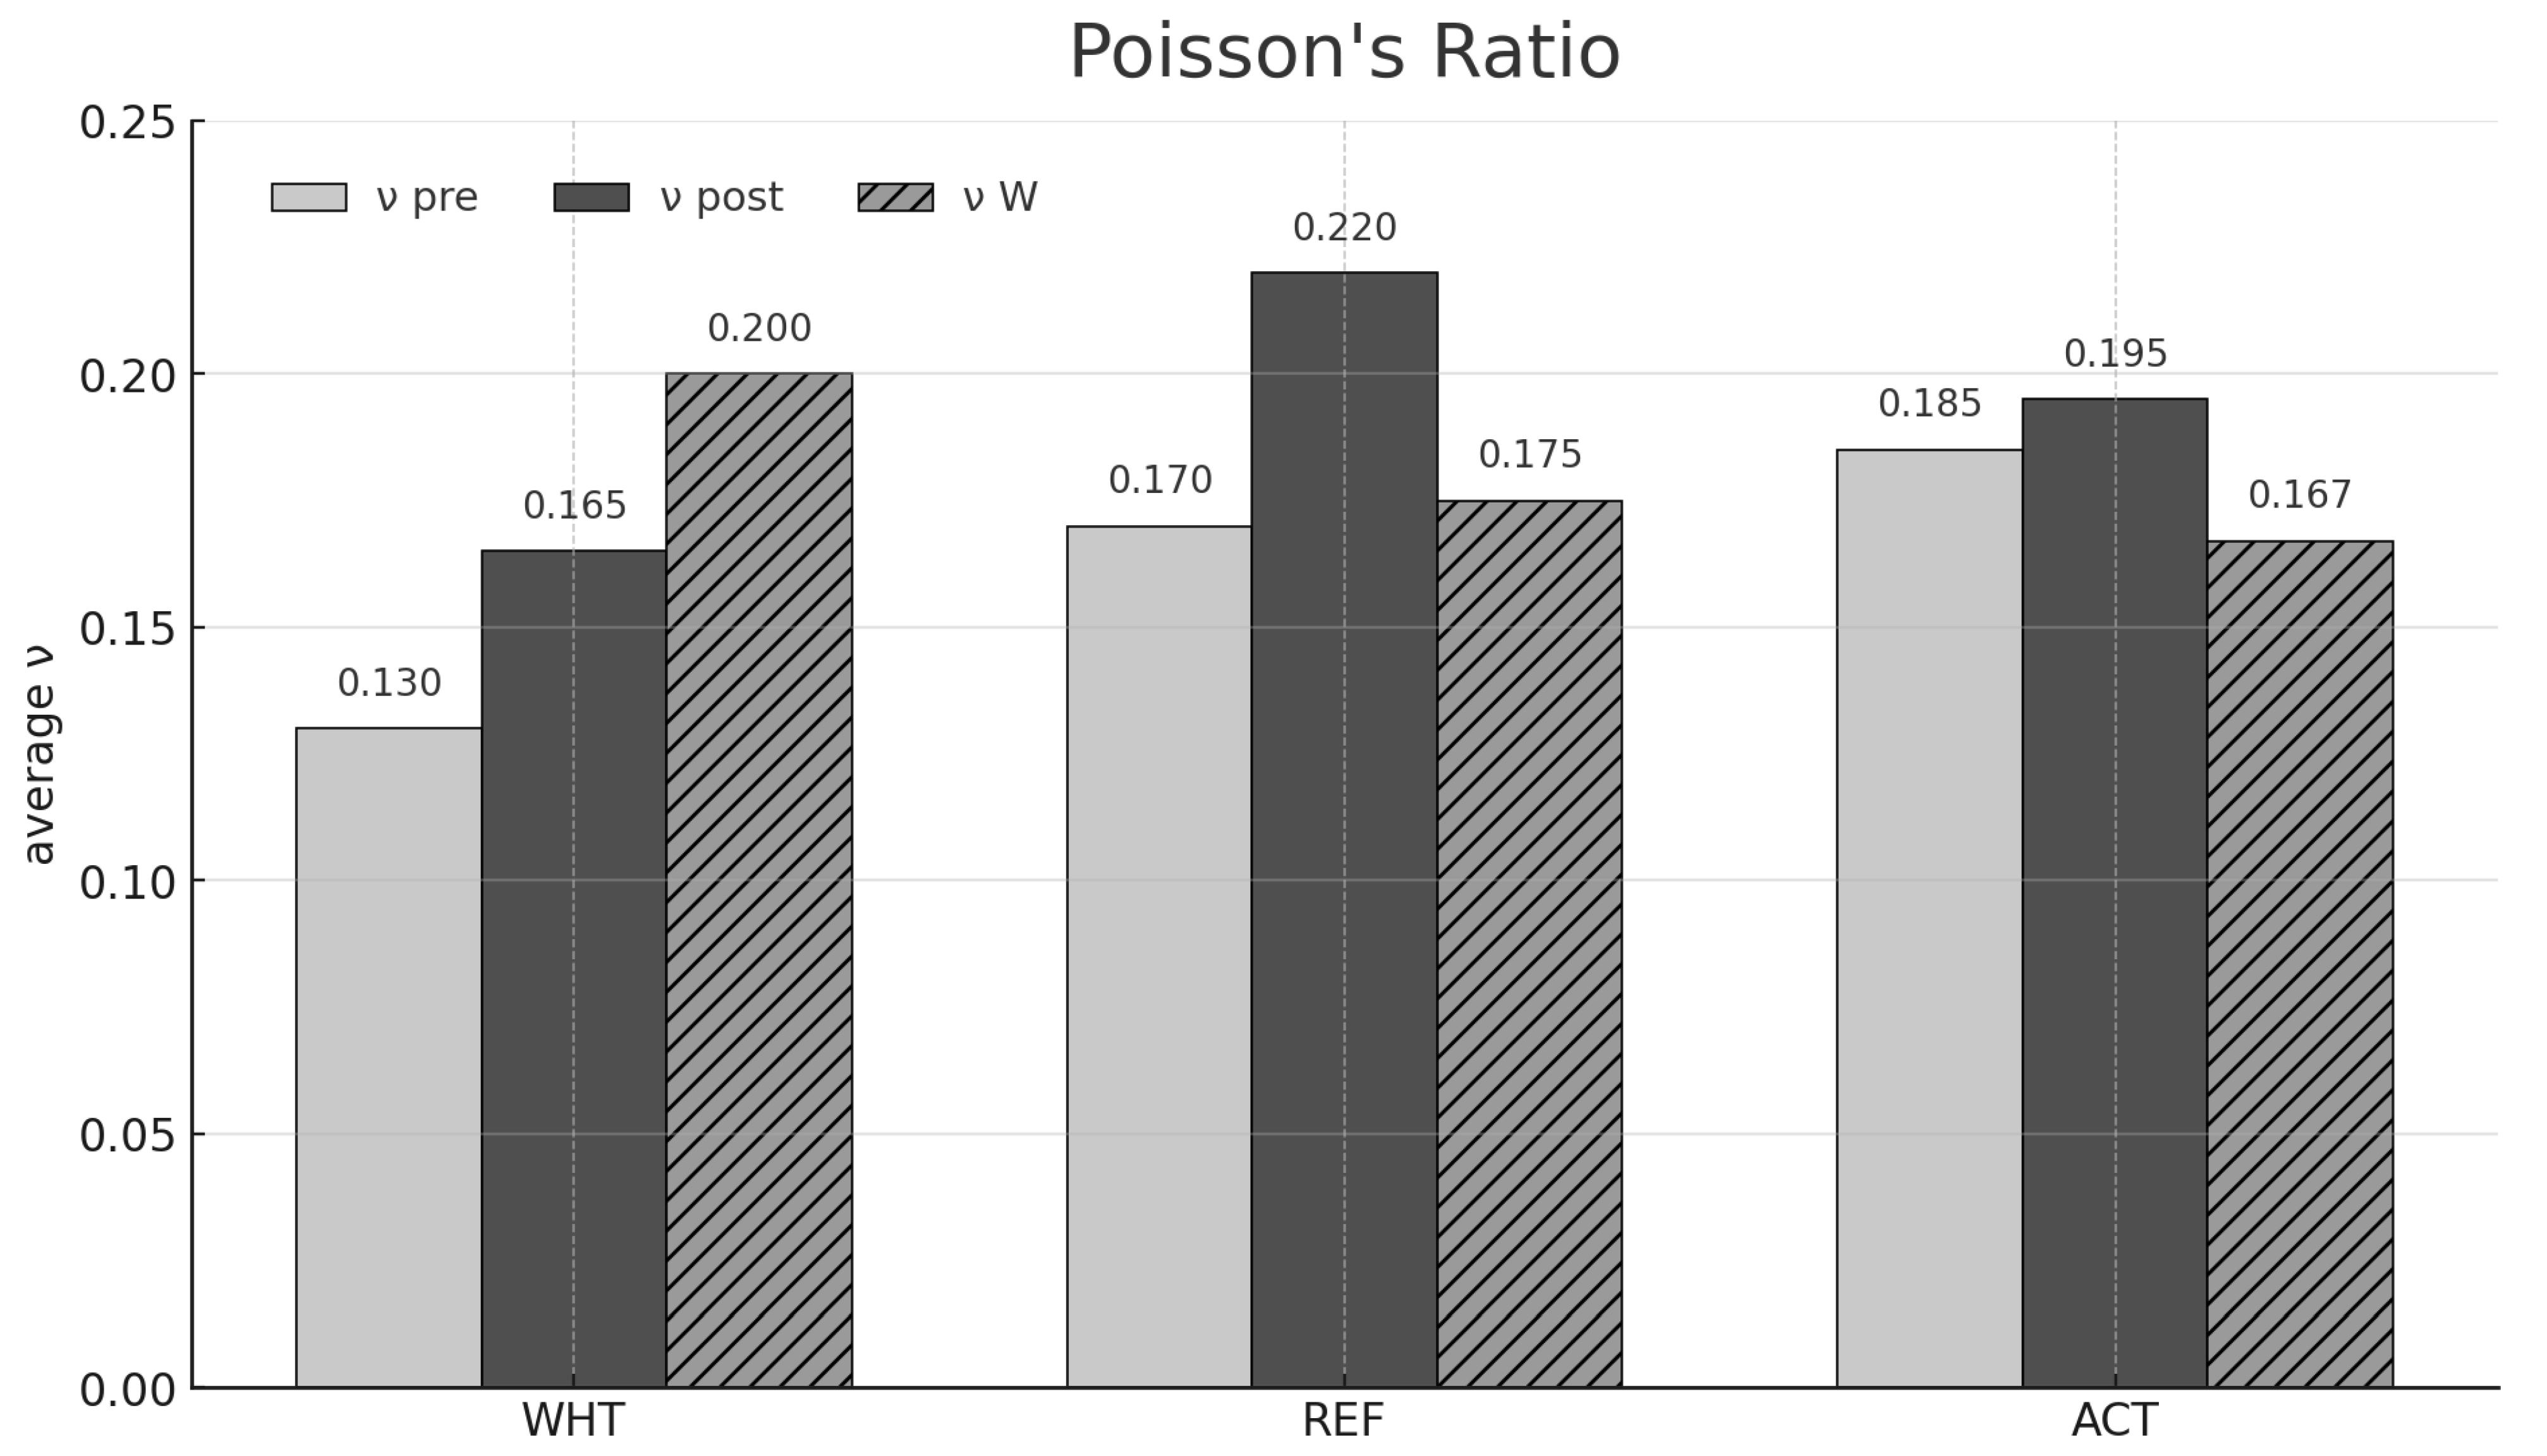
All samples show no relevant differences in values for the Pre scenario. The findings align with references in the literature [68,69]. Specifically, when considering P-Wave Velocity (Vp) in concrete, it typically falls within the range of 3000 to 4500 m per second (m/s) [50,53]. All samples in the Pre scenario show similar values of Vp, Vs, and Vp/Vs. Specifically, for the REF sample, Vp is 3.62 km/s, Vs is 2.27 km/s, and the Vp/Vs ratio is 1.60. For the WHT sample, Vp is 3.65 km/s, Vs is 2.36 km/s, and the Vp/Vs ratio is 1.55. For the ACT sample, Vp is 3.80 km/s, Vs is 2.35 km/s, and the Vp/Vs ratio is 1.62 (Table 1). The computation of E reveals a distinct trend in the values across the different scenarios. Specifically, the Pre-scenario demonstrates lower values if compared to the other scenarios, i.e., ~27 GPa for REF sample, ~28 GPa for WHT, and ~29 GPa for ACT (Table 2 and Figure 7). In the Pre scenario, the dynamic Poisson’s ratio (ν) exhibits relatively low and similar values across all samples. Specifically, the REF sample shows a value of 0.17, while the WHT sample is slightly lower at 0.13. The ACT sample displays the highest value at 0.19. These values align with the typical behavior of untreated concrete, where no significant internal stresses or crystallization phenomena have yet influenced the material’s elastic response (Table 3 and Figure 8).

3.2. Post Scenario

The samples analyzed under Post scenario display significant variability, both in comparison to the values observed in the Pre scenario and within the Post scenario itself. For all samples the wet–dry cycles lead to an increase in both Vp and Vs values, especially for REF and ACT, which got in contact with saline solution. In the Post scenario, all samples exhibit significant increases in Vp and Vs due to the wet–dry cycles, particularly for the REF and ACT samples, which were exposed to the saline solution. For the REF sample, Vp increases by 12.7% (from 3.62 km/s to 4.08 km/s), and Vs increases by 7.0% (from 2.27 km/s to 2.43 km/s). The Vp/Vs ratio rises by 4.8% (from 1.60 to 1.67). The ACT sample shows an increase in Vp of 4.6% (from 3.80 km/s to 3.97 km/s) and in Vs of 4.2% (from 2.35 km/s to 2.45 km/s), with a minimal increase of 0.3% in the Vp/Vs ratio (from 1.62 to 1.62). The WHT sample, subjected to only distilled water, experiences a more modest increase in Vp by 3.5% (from 3.65 km/s to 3.78 km/s), and Vs increases by 1.1% (from 2.36 km/s to 2.38 km/s), while the Vp/Vs ratio rises by 2.3% (from 1.55 to 1.59) (Table 1). (E in the Post-scenario exhibits higher values compared to the other two scenarios, i.e., ~33 GPa for the REF sample, ~30 GPa for WHT, and ~32 GPa for ACT (Table 2 and Figure 7). In the Post scenario, after the wet–dry cycles, ν increases for all samples, reflecting the structural changes caused by exposure to saline solutions and repeated wetting and drying. The REF sample experiences the most significant increase, with ν rising to 0.22, representing a 26% increase compared to the Pre scenario. The ACT sample also shows a notable increase to 0.19, though the percentage rise (4.3%) is lower compared to REF, indicating the moderating effect of the crystallization inhibitor. The WHT sample, treated with distilled water, shows an increase in ν to 0.17, representing a 28% rise compared to the Pre scenario (Table 3 and Figure 8).

3.3. W Scenario

The Vp and Vs values observed in this scenario are intermediate for REF and ACT. In contrast, the Vp for WHT is significantly higher, while the Vs is comparatively lower. In the W scenario, after exposure to wave impact, the Vp and Vs values for the REF and ACT samples are intermediate between the Pre and Post scenarios, while the WHT sample shows a higher Vp and lower Vs. For the REF sample, Vp decreases by 6.8% (from 4.08 km/s to 3.81 km/s) compared to the Post scenario, and Vs decreases by 2.2% (from 2.43 km/s to 2.38 km/s). The Vp/Vs ratio decreases by 4.3% (from 1.67 to 1.60). The ACT sample shows a smaller reduction in Vp, down by 3.5% (from 3.97 km/s to 3.83 km/s), and Vs decreases by 1.2% (from 2.45 km/s to 2.42 km/s), with the Vp/Vs ratio decreasing by 2.3% (from 1.62 to 1.59). The WHT sample, on the other hand, sees a 0.7% increase in Vp (from 3.78 km/s to 3.81 km/s), but Vs decreases by 2.5% (from 2.38 km/s to 2.33 km/s), resulting in a 3.2% increase in the Vp/Vs ratio (from 1.59 to 1.64) (Table 1). E in W-scenario shows intermediate values for all three sample groups, i.e., ~30 GPa for the REF sample, ~29 GPa for WHT, and ~31 GPa for ACT (Table 2 and Figure 7). In the W scenario, after exposure to wave impacts, ν shows varied behavior. For the WHT sample, ν increases further to 0.20, reflecting a 19% increase from the Post scenario. The REF sample, however, experiences a decrease in ν to 0.18, suggesting that the mechanical stress of wave impacts may have reduced the internal porosity, limiting further expansion. The ACT sample shows a slight decrease in ν to 0.17, indicating that the inhibitor effectively mitigated further internal changes, preserving the sample’s structural integrity under wave-induced stress (Table 3 and Figure 8).

4. Discussion

4.1. Pre Scenario

The slight differences between the different REF, ACT, and WHT sample variations in their response to P-waves and S-waves due to minor potential structural heterogeneity or preferred orientations of grain components.
Given the observed variations in Vp and Vs among REF, ACT, and WHT samples, which suggest minor structural heterogeneities or preferred grain orientations, it becomes imperative to consider how these microstructural variations translate into macroscopic elastic properties. This link is crucial for understanding the broader implications of seismic response on the material’s mechanical behavior. The subsequent analysis of the Young’s modulus (E) and the Poisson’s ratio (ν) in the Pre Scenario provides a direct comparison, where the elastic parameters E and ν align with the variations in Vp and Vs. This alignment offers a comprehensive insight into the material’s anisotropic properties, further emphasizing the role of porosity and grain distribution in defining its overall elastic response. Such a correlation is vital for interpreting the slight but significant variations observed in the elastic characteristics of the samples, as evidenced by the referenced studies [76,77,78,79].

4.2. Pre Scenario

Upon wet–dry cycles, on all samples, noticeable increases in Vp, Vs, Vp/Vs, and E values can be seen, as shown in Table 4.
The WHT sample, despite undergoing wet–dry cycles in distilled water, also shows an increase in Vp by 3.49%, Vs by just over 1%, and Vp/Vs by 2.3% compared to the Pre scenario measurements. This demonstrates that even mild rewetting in salt-free solution can result in a little amount of material compaction and an improvement in the material’s measured elastic features. This phenomenon could be explained by the contribution of Calcium Silicate Hydrate (C-S-H) in the cement to the increase in elastic properties during the extended curing—typically beyond the initial curing period of 28 days [80]. C-S-H products are formed during the cement hydration process and are responsible for bonding the cement grains and influencing the mechanical properties of the hardened cement paste [81]. In particular, belite, consisting essentially of dicalcium silicate (C2S) is responsible for increases in strength at long curing [82]. When the hardened cement is exposed to water, the C-S-H can further hydrate and absorb water, causing them to swell and leading to increased compaction. During the wet–dry cycles experienced by the sample, each immersion phase likely caused further partial hydration of the C-S-H [83,84]. To illustrate how slowly the reaction happens under normal temperature conditions, it is observed that hydration penetration is on the order of 4 mm after 28 days and reaches 8 mm after a year [85]. The process has been observed to extend for 50 years or longer if the structure is not subjected to total drying conditions. This “re-hydration” process improved the cement grains’ ability to connect with one another, which led to compaction. The microstructure of the material stiffened as a result, increasing the elastic wave velocities that were recorded.
However, this increment is significantly lower compared to the sample previously exposed to the saline solution (REF). The Vp, Vs values and their ratio in the REF sample are higher compared to the ones in the initial measurements of the Pre scenario. More specifically, Vp increases by 12.7%, Vs increases by 7%, and Vp/Vs increases by 4.8%. This considerable shift can be due, in part, to the partial decrease in porosity by the precipitation of salt crystals inside the sample during the soaking and drying processes, in addition to the CSH hydration. The saline solution interaction causes a gradual crystallization process to take place. As the salt solution hits saturation, it will start to crystallize as stable nuclei form [86]. The nuclei are easily resoluble at concentrations close to saturation. After the nuclei are formed, crystal growth begins, so new units of the crystal being formed are incorporated within the crystal lattice. The presence of salt, being well-known for its high acoustic and seismic velocity [87,88], replaced the air within the pores (which has Vp~330 m/s), leading to a sudden rise in Vp, Vs, and their ratio. Thus, the substitution of air by the salt crystals resulted in a substantial increase in the velocities of both P- and S-waves, affecting the overall acoustic properties and consequently improving dynamic elastic parameters of the concrete sample [89]. These findings highlight the impact of the presence of salts on the properties of the cement, emphasizing the importance of considering environmental factors in concrete performance assessments and design [90,91]. However, this apparent enhancement in stiffness after the wet–dry cycles is misleading. In reality, as the salts continue to accumulate over time due to the salinity of the environment and completely occlude the pores, they could subject the concrete’s matrix to internal tensile stress [86,92]. A pressure must be applied to inhibit the growth of a crystal placed in a supersaturated solution. Without this applied pressure, the system would naturally tend to draw ions from the solution to facilitate the formation of additional solid material. In a porous matrix, thermodynamic driving force is given by:
P a = R T V c l n Q K
where Pa is the pressure exerted by the pore wall, R is the ideal gas constant, T is the absolute temperature, Vc is the molar volume of the crystal, Q is the reaction quotient, and K is the equilibrium constant. Once the tensile strength of the cement is exceeded, whether due to normal or shear stress, it would lead to failure [33,93]. Consequently, the salts within the porosity initially enhance the material’s qualities, but only momentarily, as they significantly diminish its long-term strength and nominal lifespan [86,94].
The ACT sample represents a middle rise between the increases experienced by WHT and REF. In fact, it exhibits increased values, albeit with a considerably lower increment compared to the REF sample. The percentage increase is found to be 4.6% for Vp, 4.2% for Vs, and 0.3% for their ratio. These results demonstrate the effectiveness of the applied salt crystallization inhibitor in significantly reducing the precipitation of salt crystals within the material’s porosity [30]. However, an increase in Vp and Vs values is still observed in the ACT sample compared to the WHT sample treated with distilled water alone. This is because the inhibitor, instead of completely preventing salt crystallization in the pores, causes salt crystals to form with a less destructive morphology. This reduces the internal stress in the material, preventing significant alterations in the stress state and still allowing a certain degree of crystallization. As a result, the salt crystals exert less pressure on the pore walls, maintaining a moderate increase in Vp and Vs values in the ACT sample. Among the various mechanisms of action of inhibitors, citric acid, in the case of the study, is precisely the delay in the formation of stable nuclei. Additionally, the difference in acoustic wave velocities is accentuated, as the P-waves experience much less increase than the S-waves, thus dampening the increment of their ratio [95,96,97]. The increase in velocity difference can be attributed to the fact that the residual salt crystallization occurs within the pores and probable microfractures due to the shrinkage during the concrete curing phase. This primarily influences the propagation of the S-waves. The P-waves propagate through both the solid matrix and voids, making them less sensitive to the partial closure of fractures and cracks. On the contrary, the S-waves mainly rely on the solid matrix for propagation, as they cannot transmit through empty spaces. Hence, they are more influenced by the partial occlusion of the porosity [98,99]. As a result, the preferential crystallization of salts along these discontinuities causes a more significant increase in Vs compared to Vp, leading to a pronounced velocity difference. As a result, the introduction of the salt crystallization inhibitor leads to an effective improvement in the resistance of concrete in saline environments [5,6].
The distinct responses observed in Vp, Vs, and Vp/Vs values across different samples treated with wet–dry cycles underline a crucial aspect of material behavior under environmental stressors. As illustrated in Table 3, each sample type—WHT, REF, and ACT—displays a noticeable enhancement in these parameters, suggesting an increase in material compactness and a reduction in porosity, which are indicative of changes in the microstructure integrity and bonding strength within the cement matrix. These changes are not isolated but are directly linked to modifications in the material’s elastic properties, reflected in the increase in the Young’s modulus (E) as reported in the Post scenario. Specifically, the WHT, REF, and ACT samples exhibit increases in E by 5.72%, 19.85%, and 9.33%, respectively. This correlation highlights how the microstructural changes induced by environmental conditions directly translate into macroscopic mechanical properties. The enhanced elastic parameters after the wet–dry cycles support the notion that even subtle changes at the microscopic level can significantly impact the overall stiffness and structural integrity of the concrete, ultimately influencing its long-term durability and performance in varied environmental conditions.
In the “Post scenario,” the Poisson’s ratio (ν) demonstrates substantial variations across samples, providing further insight into the elastic response of the material under wet–dry cycles.
The REF sample exhibits a 26% increase in ν compared to the Pre scenario, suggesting enhanced ductility and reduced rigidity of the cement matrix. The parameter ν, which quantifies the material’s lateral deformation in response to axial loading, highlights a change in the material’s response to the stress. In particular, the increased ν can be attributed to localized weakening of bonds within the cement microstructure due to salt crystallization within the pore network. Consequently, this weakening enables greater transverse deformability, leading to increased lateral deformation and a diminished resistance to stress concentrations.
In the ACT sample, a more modest increase of 4.3% in ν relative to the Pre scenario indicates the effectiveness of the crystallization inhibitor in mitigating pore-filling salt crystal formation and preserving material rigidity. The limited increase in ν demonstrates that the inhibitor significantly restrains transverse deformation, maintaining the structural integrity of the cement matrix despite exposure to wet–dry cycles. This result underscores the potential of crystallization inhibitors to preserve structural stability in saline environments by reducing deformation potential under stress.
In contrast, the WHT sample, treated only with distilled water, presents a 28.2% rise in ν, surpassing even the REF sample. This notable increase is likely due to enhanced transverse deformability induced by the hydration and swelling of Calcium Silicate Hydrate (C-S-H) phases within the cement. Distilled water appears to augment axial stiffness more than transverse strength, thus amplifying ν. This swelling effect highlights how rehydration processes, even in the absence of salts, can substantially impact the microstructure’s deformation characteristics, leading to an amplified ν value.
These observations of ν across WHT, REF, and ACT samples in the Post scenario reveal how environmental conditions and chemical treatments distinctly influence the elastic behavior and structural resilience of cement. The differential increases in ν demonstrate that subtle microstructural changes—whether induced by crystallization, rehydration, or inhibition treatments—can lead to substantial shifts in deformation behavior, influencing the material’s long-term durability and its capacity to withstand environmental stressors.

4.3. W Scenario

An overall downward trend in Vp, Vs, and Vp/Vs values compared to the Pre scenario is observed after being exposed to the mechanical action of the marine wave motion in the W scenario (Table 5). These negative increments show that the concrete samples’ physical and elastic properties have been reduced by the wave impact.
The WHT sample exhibits a slight increase in Vp values (0.66%) and Vp/Vs ratio (3.2%), along with a decrease in Vs values (2.5%). The increase in Vp (and consequently Vp/Vs) in the absence of salts within the microstructure can once again be attributed to rehydration and strengthening caused by C-S-H compaction [81]. Conversely, the decrease in Vs values could suggest that micro fractures induced by the simulated wave action alone were primarily developed between cement grains, affecting the propagation of S-waves more than P-waves and consequently lowering Vs.
The REF sample shows a drop in Vp values of 6.8%, Vs of 2.2%, and Vp/Vs ratio of 4.3%. These findings reveal how the simulated coastal marine environment caused the acoustic wave’s velocity to decelerate throughout the sample. Subsequent to the reintroduction of salts into the solution, the mechanical force of the simulated waves has contributed to an increase in both primary and secondary porosity within the sample [100,101]. With the growth of salt crystals, this process could have engendered microfractures, thus compromising the sample’s structural integrity [86,93].
The ACT sample exhibits a notably milder reduction. Vp decreases by 3.5%, Vs by 1.2%, and Vp/Vs by 2.3%. The post-phase wet–dry cycles caused less damage to the sample from salt crystallization. Consequently, compared to the REF sample, it has handled the mechanical impact of the simulated marine wave with considerably superior structural integrity. A comparison with the REF sample suggests either that the salts had already micro-cracked the REF sample prior to the wave impacts or, in case the salts had not all leached back into solution, that Vp, Vs, and Vp/Vs decrease more under mechanical wave action in the presence of salt crystals in the microstructure. This result highlights how the application of the inhibitor has contributed to maintaining the sample’s resistance against the combined effects of salt crystallization and mechanical stress from wave simulation.
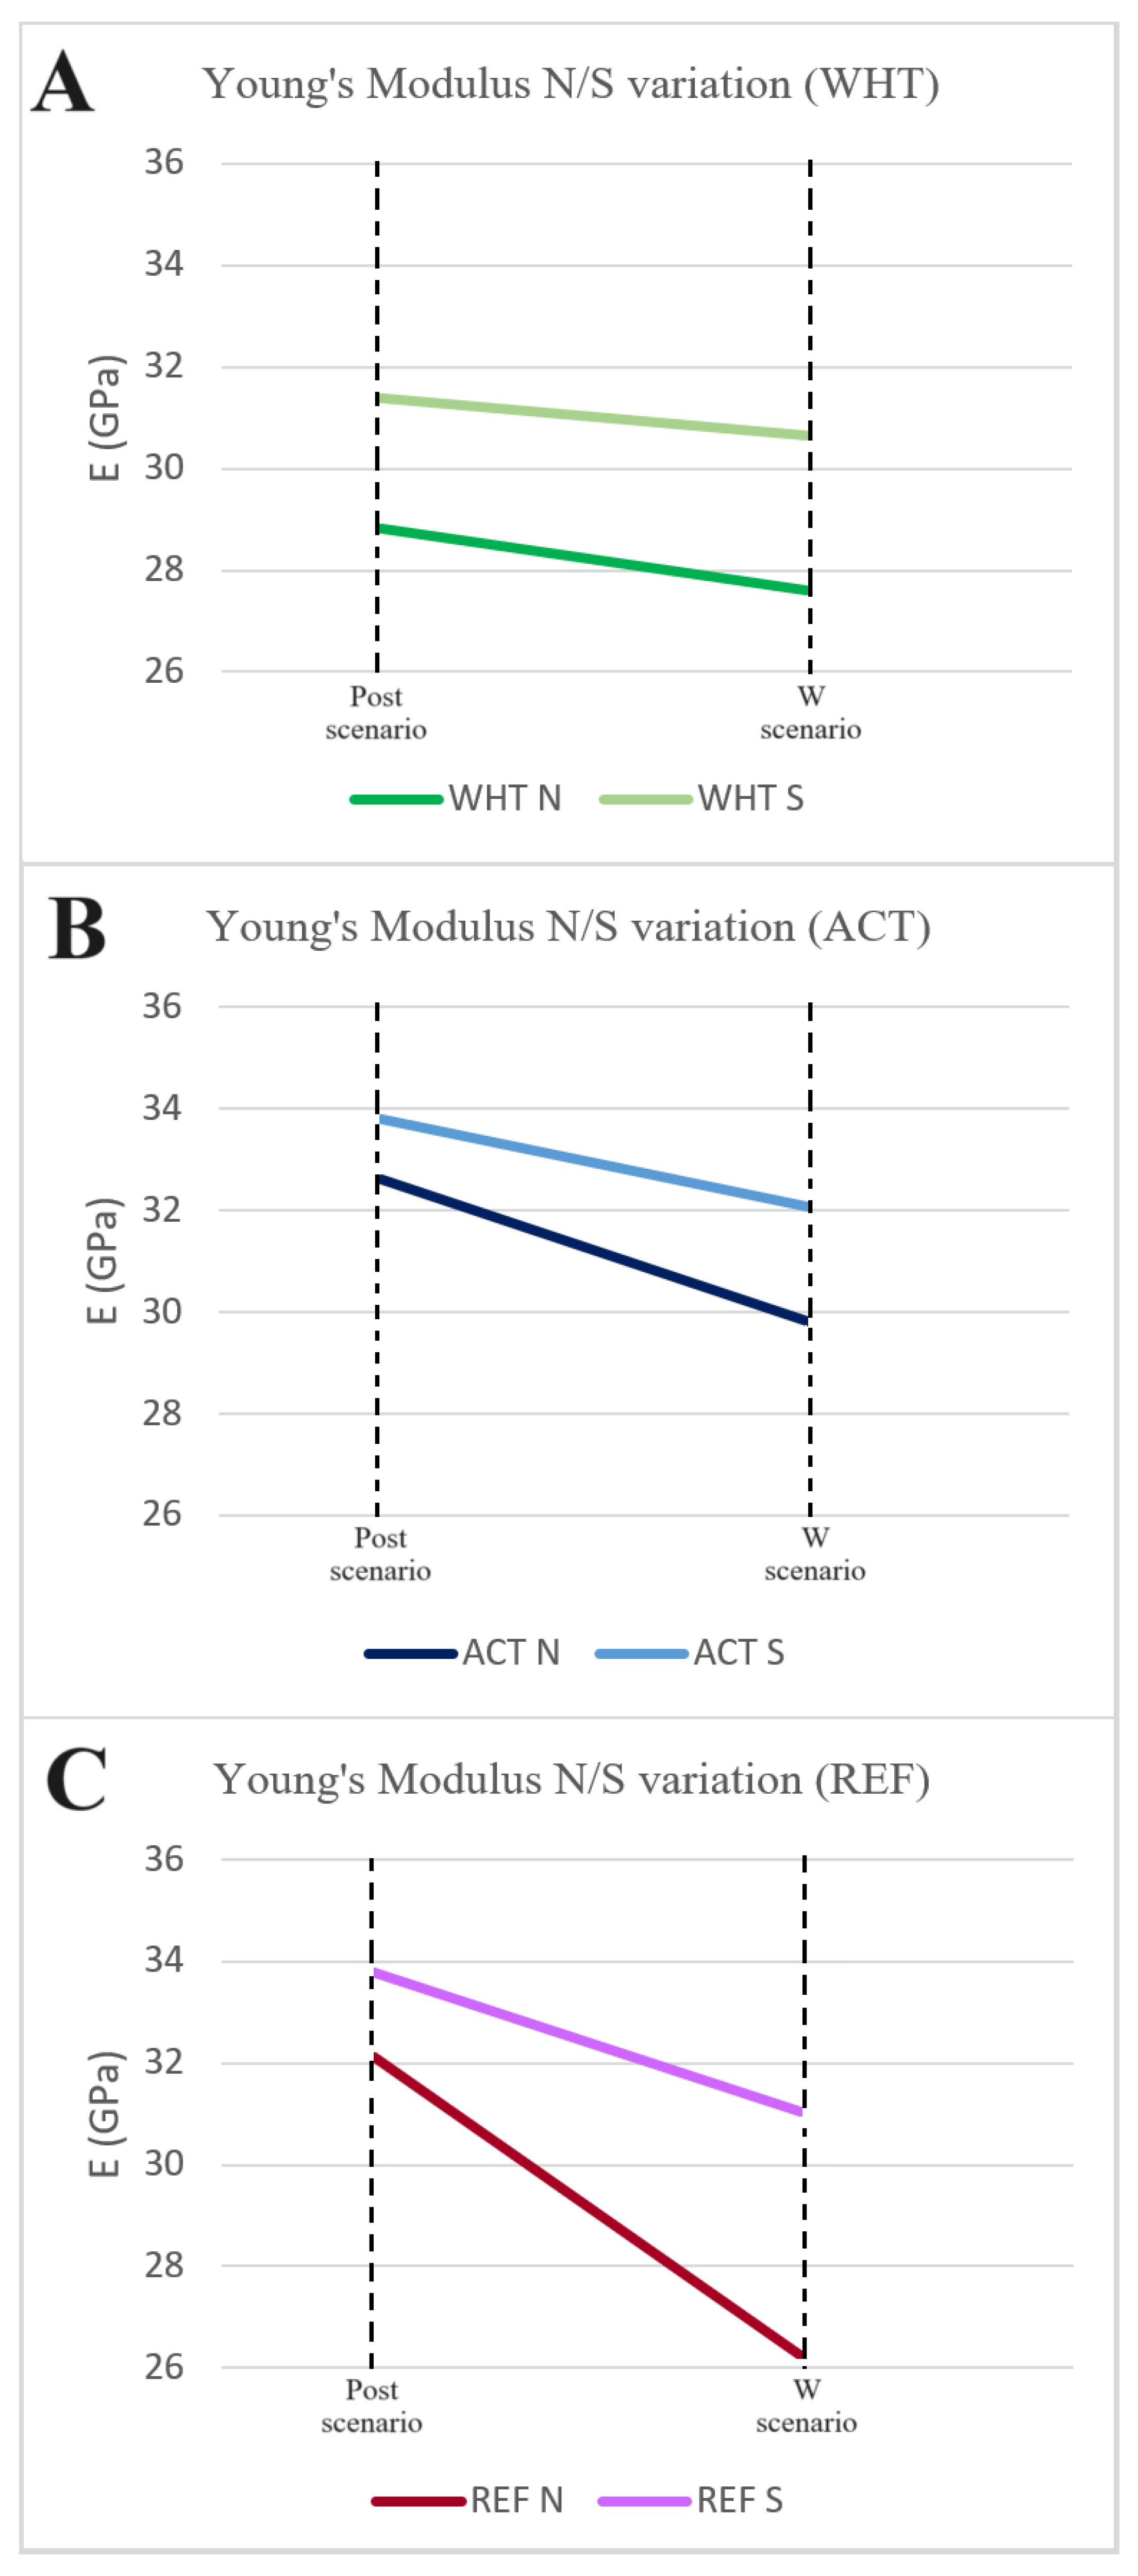
The observed variations in E between these zones further elucidate the differential effects of the mechanical forces at play (Figure 9). In the W Scenario, for each sample, the upper section, referred to as the “N” zone, was subjected to the direct impact and breaking of waves, forming a wave impact zone. In contrast, the submerged lower section, designated as the “S” zone, experienced subaquatic stress induced by wave motion without the occurrence of wave breaking. This differentiation led to varying outcomes in the E values. Young’s modulus values are lower in the wave impact zone (N) of the samples and higher in the subaquatic stress zone (S). This discrepancy highlights the greater vulnerability of the wave impact zone, indicating that it experiences more pronounced weakening compared to the subaquatic stress zone. Comparing WHT, REF, and ACT samples in their upper (N) and lower (S) sections between the Post scenario and the W scenario reveals distinct trends in the Young’s modulus. In the case of the WHT sample, E remains relatively consistent in the N portion. However, there is a slight decrease in values in the S portion after the wave impact. Here, only the mechanical force of the waves is considered, leading to the decline in E and thus weakening of the material. REF sample demonstrates a significant decrease in values, both in its N and S portions. Hence, it can be identified as the most damaged or susceptible sample, particularly in the N portion, which experiences a greater decline. The significant decrease in the Young’s modulus values of the REF N sample observed in Figure 9 during the “W” scenario is indicative of the damaging effects of salt crystallization within the concrete matrix. The reduction in stiffness can be attributed to the crystallization of salts that occurs when the saline solution penetrates the porous structure of the concrete and evaporates during the wet–dry cycles. As the salts crystallize, they exert pressure on the pore walls, which leads to the formation of microcracks. These microcracks propagate under the cyclic stress of the environmental exposure, weakening the overall structure and resulting in a decrease in Young’s modulus. The presence of these salt crystals within the concrete matrix not only occupies the pore spaces but also induces internal stresses that contribute to further damage. The pressure generated by the crystallization process increases the risk of internal cracking, reducing the material’s stiffness and mechanical integrity. The data suggest that the crystallization of salts in the REF sample, which lacked any inhibitor, significantly compromised its mechanical properties, as reflected in the sharp decline in Young’s modulus values. This behavior is consistent with the known effects of salt crystallization in porous materials, where the formation of salt crystals within the pores leads to a degradation of the material’s mechanical strength. In contrast, the ACT sample shows notably lower decreases in values, both in the N portion, which still experiences more damage, and in the S portion. Notably, in the W-scenario, the values between N and S remain relatively stable after the action of the milder waves. This outcome is interpreted as a strong indication of the salt crystallization inhibitor’s effectiveness.
In the W Scenario, variations in Poisson’s ratio reveal the impact of wave-induced mechanical stresses on the structural behavior of the concrete samples, with each sample responding distinctively to the wave action.
The REF sample is the most significantly affected by wave motion, showing a reduction in Poisson’s ratio by 19.6%, which indicates a substantial loss in strength and a degradation of mechanical performance. This decrease in ν underscores the vulnerability of the cement matrix when subjected to both salt crystallization and wave impact, resulting in compromised mechanical stability. The reduction in Poisson’s ratio suggests that the mechanical force of the waves facilitated axial rather than transverse deformability, likely due to the formation of oriented microfractures that limit the sample’s capacity for transverse expansion under stress. This observation points to the heightened susceptibility of REF to internal damage and mechanical degradation in saline environments.
Conversely, the ACT sample exhibits a more moderate reduction in ν values, around 14%, indicating the protective influence of the salt crystallization inhibitor in mitigating mechanical deterioration. This reduction highlights the inhibitor’s role in preserving structural integrity, as it limits both the extent of microstructural weakening and the potential for transverse deformation under wave-induced stress. By effectively restraining salt crystallization, the inhibitor allows the ACT sample to withstand mechanical stress without significant loss in elasticity or durability. This distinct difference in damage levels between REF and ACT confirms the effectiveness of the inhibitor in preserving mechanical performance under simulated wave impact conditions.
In contrast, the WHT sample displays an increase in Poisson’s ratio by 19%, consistent with previously observed increases in the Vp/Vs ratio. This trend can be attributed to the combined effects of wet–dry cycles in distilled water and wave-induced mechanical action, which appear to facilitate further hydration and compaction of C-S-H phases within the matrix. The wave motion instigates microfracture development, particularly between cement grains, enhancing the material’s ability to deform transversely. The increase in Poisson’s ratio in WHT indicates greater transverse deformability and an overall change in the deformation behavior, primarily due to microstructural reinforcement via hydration rather than salt-induced porosity occlusion.
A further differentiation emerges when comparing the Poisson’s ratio values across the N (wave impact) and S (subaquatic stress) zones. The N zone, exposed to direct wave impact, consistently shows higher Poisson’s ratio values after the W Scenario, indicating enhanced deformability in this area. In the S zone, which endures subaquatic stress without direct wave breaking, ν remains comparatively stable, underscoring the greater vulnerability of the wave impact zone to mechanical weakening. This localized increase in Poisson’s ratio aligns with the observed reduction in Young’s modulus in the N zone, demonstrating that wave impact induces a preferential weakening in this area, enhancing the potential for deformation and underscoring the role of environmental stressors in determining concrete performance durability.

5. Conclusions

In this study, the primary objective was to unravel the interplay between salt crystallization, mechanical stress, and the elastic properties of concrete in coastal marine environments. A customized experimental setup involving the application of a salt crystallization inhibitor, wet–dry cycles, and wave impacts is aimed at addressing a main research question: How does salt crystallization influence the durability and mechanical integrity of concrete structures in the challenging context of coastal marine conditions?
  • The presence of salt crystals in concrete’s porosity led to significant changes in its elastic properties, with notable decreases in Young’s modulus and variable changes in Poisson’s ratio. This highlights the material’s vulnerability to the deteriorative effects of salt crystallization, leading to reduced stiffness and strength over time.
  • The use of a salt crystallization inhibitor showcased its effectiveness in mitigating the detrimental impact of salt crystals on concrete. Samples treated with the inhibitor displayed enhanced resistance to both salt-induced damage and mechanical stress, emphasizing its potential for improving the durability of concrete structures in marine environments.
  • Different regions within the concrete samples revealed varying responses to wave impacts. The upper wave impact zone experienced an overall greater damage, resulting in decreased moduli values. In contrast, the lower subaquatic stress zone showed less damage and preserved stiffness, suggesting that structural integrity can be better maintained below the waterline.
The findings underscore the importance of considering both the immediate and long-term effects of salt-induced damage on concrete’s mechanical properties. As a practical implication, the use of salt crystallization inhibitors can substantially improve the material’s resistance to deterioration. Nevertheless, limitations exist, such as the focus on laboratory-scale conditions and the absence of other environmental factors. This study is also limited by the fact that advanced instrumental analyses such as X-ray diffraction (XRD), scanning electron microscopy (SEM), and differential thermal analysis (DTA) were not included, although they could provide valuable insights into the microstructural and chemical mechanisms underlying the observed macroscopic improvements in durability and mechanical behavior. These techniques require sectioning the specimens, which would alter the actual state of salt crystallization within the pores. Cutting the samples either in dry conditions (which would modify the state of pore filling due to changes in stress and temperature) or in wet conditions (which would lead to the dissolution of the salts) would distort the crystallization phenomena and invalidate the integrity of the crystallization structures. For this reason, the present study focused on non-destructive methods, such as acoustic and mechanical measurements, which preserve the authenticity of the sample conditions while providing valuable macroscopic data. Although this limitation exists, we acknowledge that further research using non-invasive or alternative methods could complement the current study, providing deeper insight into the microscopic mechanisms behind the macroscopic results. Another limitation of this study is that only one concentration of citric acid was employed. This choice was made to maintain consistency with previous research and to ensure that the observed effects could be directly attributed to the presence of the inhibitor rather than to variations in dosage. The selected concentration has been shown in the literature to be effective without interfering with cement hydration or mechanical stability. Future investigations may consider testing different concentrations to further assess the relationship between dosage and inhibition efficiency under varying environmental conditions.
Future research should explore the broader implications of these findings in real-world scenarios and consider synergies with other durability-enhancing strategies. Building on the current laboratory-based results, future developments will focus on extending the experimental design to include additional environmental variables such as temperature and humidity fluctuations, wind-driven aerosol transport, and exposure geometries representative of real structural configurations. Incorporating these factors will allow for a more comprehensive assessment of how citric acid-treated concrete behaves under realistic marine conditions and combined environmental stresses. Long-term exposure tests and in situ monitoring campaigns in actual coastal environments will also be pursued to validate laboratory results and establish a stronger link between experimental outcomes and field performance. This work contributes valuable insights for designing more resilient concrete structures in coastal regions while setting the stage for future investigations into the dynamic interplay between materials and the marine environment.

Author Contributions

Conceptualization, M.C.C., F.T., A.M. and M.P.B.; methodology, M.C.C., M.C., A.T., F.T., A.M. and M.P.B.; software, M.C.C., M.C., A.T. and F.T.; validation, M.C.C., M.C., A.T., F.T., A.M. and M.P.B.; data curation, M.C.C., M.C., A.T., F.T., A.M. and M.P.B.; writing—original draft preparation, M.C.C., M.C. and A.T.; writing—review and editing, M.C.C., M.C., A.T., F.T., A.M. and M.P.B.; visualization, M.C.C., M.C. and A.T.; supervision, M.C.C., F.T., A.M. and M.P.B. All authors have read and agreed to the published version of the manuscript.

Funding

This research received no external funding.

Data Availability Statement

The datasets generated and/or analyzed during the current study are available from the corresponding author on reasonable request.

Acknowledgments

We are grateful to the editor and the anonymous reviewers for their constructive comments and suggestions which greatly improved the scientific quality of the work.

Conflicts of Interest

The authors declare that they have no known competing financial interests or personal relationships that could have appeared to influence the work reported in this paper.

References

  1. Gjørv, O.E. Durability of Concrete Structures. Arab. J. Sci. Eng. 2011, 36, 151–172. [Google Scholar] [CrossRef]
  2. Mays, G.C. Durability of Concrete Structures: Investigation, Repair, Protection; CRC Press: Boca Raton, FL, USA, 1991; ISBN 978-0-203-47347-4. [Google Scholar]
  3. Tang, S.W.; Yao, Y.; Andrade, C.; Li, Z. Recent Durability Studies on Concrete Structure. Cem. Concr. Res. 2015, 78, 143–154. [Google Scholar] [CrossRef]
  4. Mehta, P.K. Durability of Concrete in Marine Environment–A Review. Spec. Pub. 1980, 65, 1–20. [Google Scholar] [CrossRef]
  5. Zhu, H.; Yu, H.; Ma, H. Electrochemical study on effect of rust inhibitors on corrosion of reinforcing bar in concrete in marine environment. Dongnan Daxue Xuebao (Ziran Kexue Ban)/J. Southeast Univ. (Nat. Sci. Ed.) 2020, 50, 109–119. [Google Scholar] [CrossRef]
  6. Yu, H.; Da, B.; Ma, H.; Zhu, H.; Yu, Q.; Ye, H.; Jing, X. Durability of Concrete Structures in Tropical Atoll Environment. Ocean. Eng. 2017, 135, 1–10. [Google Scholar] [CrossRef]
  7. Wilson, P.I. The Politics of Concrete: Institutions, Infrastructure, and Water Policy. Soc. Nat. Resour. 2015, 28, 109–115. [Google Scholar] [CrossRef]
  8. Meyer, C. The Greening of the Concrete Industry. Cem. Concr. Compos. 2009, 31, 601–605. [Google Scholar] [CrossRef]
  9. Saetta, A.; Scotta, R.; Vitaliani, R. Mechanical Behavior of Concrete under Physical-Chemical Attacks. J. Eng. Mech. 1998, 124, 1100–1109. [Google Scholar] [CrossRef]
  10. Shoukry, S.N.; William, G.W.; Downie, B.; Riad, M.Y. Effect of Moisture and Temperature on the Mechanical Properties of Concrete. Constr. Build. Mater. 2011, 25, 688–696. [Google Scholar] [CrossRef]
  11. Falegnami, A.; Tomassi, A.; Gunella, C.; Amalfitano, S.; Corbelli, G.; Armonaite, K.; Fornaro, C.; Giorgi, L.; Pollini, A.; Caforio, A.; et al. Defining Conceptual Artefacts to Manage and Design Simplicities in Complex Adaptive Systems. Heliyon 2024, 10, e41033. [Google Scholar] [CrossRef]
  12. Tomassi, A.; Falegnami, A.; Romano, E. Unveiling Simplexity: A New Paradigm for Understanding Complex Adaptive Systems and Driving Technological Innovation. Innovations 2025, 6, 100954. [Google Scholar] [CrossRef]
  13. Tomassi, A.; Falegnami, A.; Romano, E. Talking Resilience: Embedded Natural Language Cyber-Organizations by Design. Systems 2025, 13, 247. [Google Scholar] [CrossRef]
  14. Yin, G.-J.; Zuo, X.-B.; Tang, Y.-J.; Ayinde, O.; Wang, J.-L. Numerical Simulation on Time-Dependent Mechanical Behavior of Concrete under Coupled Axial Loading and Sulfate Attack. Ocean Eng. 2017, 142, 115–124. [Google Scholar] [CrossRef]
  15. Cusson, D.; Lounis, Z.; Daigle, L. Durability Monitoring for Improved Service Life Predictions of Concrete Bridge Decks in Corrosive Environments. Comput.-Aided Civ. Infrastruct. Eng. 2011, 26, 524–541. [Google Scholar] [CrossRef]
  16. Omar, T.; Nehdi, M.L. Condition Assessment of Reinforced Concrete Bridges: Current Practice and Research Challenges. Infrastructures 2018, 3, 36. [Google Scholar] [CrossRef]
  17. Kawamura, K.; Miyamoto, A. Condition State Evaluation of Existing Reinforced Concrete Bridges Using Neuro-Fuzzy Hybrid System. Comput. Struct. 2003, 81, 1931–1940. [Google Scholar] [CrossRef]
  18. Shah, A.A.; Ribakov, Y. Non-Destructive Evaluation of Concrete in Damaged and Undamaged States. Mater. Des. 2009, 30, 3504–3511. [Google Scholar] [CrossRef]
  19. Fan, W.; Zhong, Z.; Huang, X.; Sun, W.; Mao, W. Multi-Platform Simulation of Reinforced Concrete Structures under Impact Loading. Eng. Struct. 2022, 266, 114523. [Google Scholar] [CrossRef]
  20. Ferreira, R.M. Probability-Based Durability Analysis of Concrete Structures in Marine Environment; Escola de Engenharia-Universidade do Minho: Guimarães, Portugal, 2004. [Google Scholar]
  21. Ting, M.Z.Y.; Wong, K.S.; Rahman, M.E.; Meheron, S.J. Deterioration of Marine Concrete Exposed to Wetting-Drying Action. J. Clean. Prod. 2021, 278, 123383. [Google Scholar] [CrossRef]
  22. Sayward, J.M. Salt Action on Concrete; U.S. Army Cold Regions Research and Engineering Laboratory: Hanover, NH, USA, 1984. [Google Scholar]
  23. Abdollahnia, H.; Alizadeh Elizei, M.H.; Reza Kashyzadeh, K. Multiaxial Fatigue Life Assessment of Integral Concrete Bridge with a Real-Scale and Complicated Geometry Due to the Simultaneous Effects of Temperature Variations and Sea Waves Clash. J. Mar. Sci. Eng. 2021, 9, 1433. [Google Scholar] [CrossRef]
  24. Sainflou, G. Essai Sur Les Digues Meritimes Verticales. Ann. Pnots Chaussees 1928, 98, 5–48. [Google Scholar]
  25. Castellino, M.; Lara, J.L.; Romano, A.; Losada, I.J.; De Girolamo, P. Wave Loading for Recurved Parapet Walls in Non-Breaking Wave Conditions. Analysis of the Induced Impulsive Forces. In Coastal Engineering 2018, Proceedings of the 36th International Conference on Coastal Engineering (ICCE 2018), Baltimore, MD, USA, 30 July–3 August 2018; American Society of Civil Engineers (ASCE): Reston, VA, USA, 2018; Volume 36. [Google Scholar]
  26. Castellino, M.; Romano, A.; Lara, J.L.; Losada, I.J.; De Girolamo, P. Confined-Crest Impact: Forces Dimensional Analysis and Extension of the Goda’s Formulae to Recurved Parapets. Coast. Eng. 2021, 163, 103814. [Google Scholar] [CrossRef]
  27. Cuomo, G.; Allsop, W.; Bruce, T.; Pearson, J. Breaking Wave Loads at Vertical Seawalls and Breakwaters. Coast. Eng. 2010, 57, 424–439. [Google Scholar] [CrossRef]
  28. Johanning, L.; Smith, G.H.; Wolfram, J. Measurements of Static and Dynamic Mooring Line Damping and Their Importance for Floating WEC Devices. Ocean Eng. 2007, 34, 1918–1934. [Google Scholar] [CrossRef]
  29. Kirk, C.L.; Etok, E.U.; Cooper, M.T. Dynamic and Static Analysis of a Marine Riser. Appl. Ocean. Res. 1979, 1, 125–135. [Google Scholar] [CrossRef]
  30. Bracciale, M.P.; Sammut, S.; Cassar, J.; Santarelli, M.L.; Marrocchi, A. Molecular Crystallization Inhibitors for Salt Damage Control in Porous Materials: An Overview. Molecules 2020, 25, 1873. [Google Scholar] [CrossRef]
  31. Lubelli, B.; van Hees, R.P. Effectiveness of Crystallization Inhibitors in Preventing Salt Damage in Building Materials. J. Cult. Herit. 2007, 8, 223–234. [Google Scholar] [CrossRef]
  32. Scherer, G.W. Stress from Crystallization of Salt. Cem. Concr. Res. 2004, 34, 1613–1624. [Google Scholar] [CrossRef]
  33. Flatt, R.J.; Scherer, G.W. Thermodynamics of Crystallization Stresses in DEF. Cem. Concr. Res. 2008, 38, 325–336. [Google Scholar] [CrossRef]
  34. Vomocil, J.A. Porosity. In Methods of Soil Analysis: Part 1 Physical and Mineralogical Properties, Including Statistics of Measurement and Sampling; John Wiley & Sons: Hoboken, NJ, USA, 1965; Volume 9, pp. 299–314. [Google Scholar]
  35. Bretti, G.; Ceseri, M.; Natalini, R.; Ciacchella, M.C.; Santarelli, M.L.; Tiracorrendo, G. A Forecasting Model for the Porosity Variation during the Carbonation Process. GEM-Int. J. Geomath. 2022, 13, 13. [Google Scholar]
  36. Kowacz, M.; Putnis, C.; Putnis, A. The Effect of Cation: Anion Ratio in Solution on the Mechanism of Barite Growth at Constant Supersaturation: Role of the Desolvation Process on the Growth Kinetics. Geochim. Cosmochim. Acta 2007, 71, 5168–5179. [Google Scholar] [CrossRef]
  37. Li, Z.; Zhou, X.; Ma, H.; Hou, D. Advanced Concrete Technology; John Wiley & Sons: Hoboken, NJ, USA, 2022; ISBN 1-119-80625-9. [Google Scholar]
  38. Morad, S. Carbonate Cementation in Sandstones: Distribution Patterns and Geochemical Evolution. Carbonate Cem. Sandstones Distrib. Patterns Geochem. Evol. 1998, 1–26. [Google Scholar]
  39. Tung, H.-H.; Paul, E.L.; Midler, M.; McCauley, J.A. Crystallization of Organic Compounds: An Industrial Perspective; John Wiley & Sons: Hoboken, NJ, USA, 2023; ISBN 1-119-87946-9. [Google Scholar]
  40. Ciacchella, M.C. Control of Crystallization Pressure in Cementitious Materials Using a Bio-Based Inhibitor; Sapienza Università di Roma: Rome, Italy, 2025. [Google Scholar]
  41. Bodsworth, A.N.F. Investigation of Atmospheric Phase Transitions in Low Temperature, Mixed Aerosols; University of British Columbia: Vancouver, BC, Canada, 2010. [Google Scholar]
  42. Charola, A.E. Salts in the Deterioration of Porous Materials: An Overview. J. Am. Inst. Conserv. 2000, 39, 327–343. [Google Scholar] [CrossRef]
  43. Tovbin, Y.K. Second Law of Thermodynamics, Gibbs’ Thermodynamics, and Relaxation Times of Thermodynamic Parameters. Russ. J. Phys. Chem. A 2021, 95, 637–658. [Google Scholar] [CrossRef]
  44. Zerres, H.; Prausnitz, J.M. Thermodynamics of Phase Equilibria in Aqueous-organic Systems with Salt. AIChE J. 1994, 40, 676–691. [Google Scholar] [CrossRef]
  45. Mahmood, W.; Ayub, T. Mechanical Properties and Corrosion Resistance of Recycled Aggregate Concrete Exposed to Accelerated and Natural Marine Environment. J. Build. Eng. 2023, 66, 105867. [Google Scholar] [CrossRef]
  46. Qu, F.; Li, W.; Dong, W.; Tam, V.W.; Yu, T. Durability Deterioration of Concrete under Marine Environment from Material to Structure: A Critical Review. J. Build. Eng. 2021, 35, 102074. [Google Scholar] [CrossRef]
  47. Li, S.; Jin, Z.; Pang, B.; Li, J. Durability Performance of an RC Beam under Real Marine All Corrosion Zones Exposure for 7 Years. Case Stud. Constr. Mater. 2022, 17, e01516. [Google Scholar] [CrossRef]
  48. Kim, S.; Usman, M.; Park, C.; Hanif, A. Durability of Slag Waste Incorporated Steel Fiber-Reinforced Concrete in Marine Environment. J. Build. Eng. 2021, 33, 101641. [Google Scholar] [CrossRef]
  49. Sosa, I.; Thomas, C.; Polanco, J.A.; Setién, J.; Tamayo, P. Durability in Marine Environment of High-Performance Concrete with Electric Arc Furnace Slags and Cupola Slag Admixture. In Proceedings of the XV International Conference on Durability of Building Materials and Components, Barcelona, Catalonia, 20–23 October 2020. [Google Scholar]
  50. Prajeesha, M.; Packialakshmi, S. Evaluation of Bacterial Concrete Corrosion Resistance in Marine Settings: A Morphological Analysis Perspective. Int. Res. J. Educ. Technol. 2024, 6. [Google Scholar]
  51. Li, K.; Zeng, J.; Tang, L.; Sørensen, H.E.; Castro Borges, P.; Geiker, M.R.; Pedersen, M.T.; Zhang, P.; Surana, S.; Maddalena, R. Long-Term Field Exposure of Structural Concretes in Marine Environment: State-of-the-Art Review by RILEM TC 289-DCM. Mater. Struct. 2022, 55, 205. [Google Scholar] [CrossRef]
  52. Melchers, R.E. Long-Term Durability of Marine Reinforced Concrete Structures. J. Mar. Sci. Eng. 2020, 8, 290. [Google Scholar] [CrossRef]
  53. Ahmed, A.; Guo, S.; Zhang, Z.; Shi, C.; Zhu, D. A Review on Durability of Fiber Reinforced Polymer (FRP) Bars Reinforced Seawater Sea Sand Concrete. Constr. Build. Mater. 2020, 256, 119484. [Google Scholar] [CrossRef]
  54. Zeng, J.-J.; Hao, Z.-H.; Sun, H.-Q.; Zeng, W.-B.; Fan, T.-H.; Zhuge, Y. Durability Assessment of Ultra-High-Performance Concrete (UHPC) and FRP Grid-Reinforced UHPC Plates under Marine Environments. Eng. Struct. 2025, 323, 119313. [Google Scholar] [CrossRef]
  55. Khalil, W.I. Using Citric Acid as an Admixture and It’s Influence on Some Properties of Concrete. Eng. Tech. J. 2009, 27, 33–46. [Google Scholar] [CrossRef]
  56. Saleh, M.M.; Darwish, S.S.; Elzoghby, M. The Effectiveness of Some Crystallization Inhibitors in Preventing Salt Damage to Limestone. J. Cryst. Growth 2022, 585, 126606. [Google Scholar] [CrossRef]
  57. Ribeiro, M.; Tavares, C.; Ferreira, A. Chemical Resistance of Epoxy and Polyester Polymer Concrete to Acids and Salts. J. Polym. Eng. 2002, 22, 27–44. [Google Scholar] [CrossRef]
  58. Zhao, Y.; Wang, Q.; Zhang, R.; Zheng, X. Corrosion Behavior of Coral Aggregate Concrete in Marine Environments and Anti-Corrosion Methods for Improvement: A Review. Eng. Rep. 2025, 7, e70229. [Google Scholar] [CrossRef]
  59. Falegnami, A.; Romano, E.; Tomassi, A. The Emergence of the GreenSCENT Competence Framework. In The European Green Deal in Education; Routledge: London, UK, 2024; pp. 204–216. ISBN 978-1-00-349259-7. [Google Scholar]
  60. Tomassi, A.; Falegnami, A.; Meleo, L.; Romano, E. The GreenSCENT Competence Frameworks. In The European Green Deal in Education; Routledge: London, UK, 2024; ISBN 978-1-00-349259-7. [Google Scholar]
  61. UNI EN 197-1:2011; Cement. Part 1: Composition, Specification and Conformity Criteria for Common Cements. Italian Organization for Standardization (UNI): Milan, Italy, 2012. Available online: https://store.uni.com/uni-en-197-1-2011 (accessed on 27 December 2023).
  62. Panzera, T.H.; Rubio, J.C.; Bowen, C.R.; Vasconcelos, W.L.; Strecker, K. Correlation between Structure and Pulse Velocity of Cementitious Composites. Adv. Cem. Res. 2008, 20, 101–108. [Google Scholar] [CrossRef]
  63. Bogas, J.A.; Gomes, M.G.; Gomes, A. Compressive Strength Evaluation of Structural Lightweight Concrete by Non-Destructive Ultrasonic Pulse Velocity Method. Ultrasonics 2013, 53, 962–972. [Google Scholar] [CrossRef]
  64. Tomassi, A.; De Franco, R.; Trippetta, F. High-Resolution Synthetic Seismic Modelling: Elucidating Facies Heterogeneity in Carbonate Ramp Systems. Pet. Geosci. 2024, 31, petgeo2024-047. [Google Scholar] [CrossRef]
  65. De Fazio, N.; Placidi, L.; Tomassi, A.; Fraddosio, A.; Castellano, A.; Paparella, F. Different Mechanical Models for the Study of Ultrasonic Wave Dispersion for Mechanical Characterization of Construction Materials. Int. J. Solids Struct. 2025, 315, 113352. [Google Scholar] [CrossRef]
  66. Mavko, G.; Mukerji, T.; Dvorkin, J. The Rock Physics Handbook; Cambridge University Press: Cambridge, UK, 2020; ISBN 978-1-108-42026-6. [Google Scholar]
  67. Saxena, N.; Mavko, G. Estimating Elastic Moduli of Rocks from Thin Sections: Digital Rock Study of 3D Properties from 2D Images. Comput. Geosci. 2016, 88, 9–21. [Google Scholar] [CrossRef]
  68. Olsen, C.; Christensen, H.F.; Fabricius, I.L. Static and Dynamic Young’s Moduli of Chalk from the North Sea. Geophysics 2008, 73, E41–E50. [Google Scholar] [CrossRef]
  69. Guillot, F.M.; Trivett, D.H. A Dynamic Young’s Modulus Measurement System for Highly Compliant Polymers. J. Acoust. Soc. Am. 2003, 114, 1334–1345. [Google Scholar] [CrossRef]
  70. Tomassi, A.; Trippetta, F.; de Franco, R.; Ruggieri, R. From Petrophysical Properties to Forward-Seismic Modeling of Facies Heterogeneity in the Carbonate Realm (Majella Massif, Central Italy). J. Pet. Sci. Eng. 2022, 211, 110242. [Google Scholar] [CrossRef]
  71. Tomassi, A.; Trippetta, F.; de Franco, R.; Ruggieri, R. How Petrophysical Properties Influence the Seismic Signature of Carbonate Fault Damage Zone: Insights from Forward-Seismic Modelling. J. Struct. Geol. 2023, 167, 104802. [Google Scholar] [CrossRef]
  72. Goda, Y. New Wave Pressure Formulae for Composite Breakwaters. In Coastal Engineering; American Society of Civil Engineers (ASCE): Reston, VA, USA, 2015; pp. 1702–1720. [Google Scholar]
  73. Martinelli, L.; Ruol, P.; Volpato, M.; Favaretto, C.; Castellino, M.; De Girolamo, P.; Franco, L.; Romano, A.; Sammarco, P. Experimental Investigation on Non-Breaking Wave Forces and Overtopping at the Recurved Parapets of Vertical Breakwaters. Coast. Eng. 2018, 141, 52–67. [Google Scholar] [CrossRef]
  74. Goda, Y.; Suzuki, Y. Estimation of Incident and Reflected Waves in Random Wave Experiments. In Coastal Engineering 1976; American Society of Civil Engineers (ASCE): Reston, VA, USA, 1976; pp. 828–845. [Google Scholar]
  75. Mansard, E.P.; Funke, E.R. The Measurement of Incident and Reflected Spectra Using a Least Squares Method. In Coastal Engineering 1980; American Society of Civil Engineers (ASCE): Reston, VA, USA, 1980; pp. 154–172. [Google Scholar]
  76. Hashin, Z. The Elastic Moduli of Heterogeneous Materials. J. Appl. Mech. Trans. ASME 1960, 29, 143–150. [Google Scholar] [CrossRef]
  77. Hill, R. A Self-Consistent Mechanics of Composite Materials. J. Mech. Phys. Solids 1965, 13, 213–222. [Google Scholar] [CrossRef]
  78. Mehta, P.K. Concrete. Structure, Properties and Materials; Department of Civil and Environmental Engineering, University of California at Berkeley: Berkeley, CA, USA, 1986. [Google Scholar]
  79. Mori, T.; Tanaka, K. Average Stress in Matrix and Average Elastic Energy of Materials with Misfitting Inclusions. Acta Metall. 1973, 21, 571–574. [Google Scholar] [CrossRef]
  80. Hu, L.M.; Gao, D.Y.; Li, Y.Z.; Song, S.Q. Analysis of the Influence of Long Curing Age on the Compressive Strength of Plastic Concrete. Adv. Mater. Res. 2012, 382, 200–203. [Google Scholar] [CrossRef]
  81. Gard, J.A.; Taylor, H.F.W. Calcium Silicate Hydrate (II) (“C-S-H(II)”). Cem. Concr. Res. 1976, 6, 667–677. [Google Scholar] [CrossRef]
  82. Sui, T.; Fan, L.; Wen, Z.; Wang, J.; Zhang, Z. Study on the Properties of High Strength Concrete Using High Belite Cement. J. Adv. Concr. Technol. 2004, 2, 201–206. [Google Scholar] [CrossRef]
  83. Chatterji, S.; Jeffery, J.W. Studies of Early Stages of Paste Hydration of Cement Compounds, II. J. Am. Ceram. Soc. 1963, 46, 187–191. [Google Scholar] [CrossRef]
  84. John, E.; Lothenbach, B. Cement Hydration Mechanisms through Time–a Review. J. Mater. Sci. 2023, 58, 9805–9833. [Google Scholar] [CrossRef]
  85. Zhutovsky, S.; Kovler, K.; Bentur, A. Assessment of Distance of Water Migration in Internal Curing of High-Strength Concrete. In ACI SP-220 Autogenous Deformation Concrete; American Concrete Institute: Farmington Hills, MI, USA, 2004; pp. 181–197. [Google Scholar]
  86. Flatt, R.J. Salt Damage in Porous Materials: How High Supersaturations Are Generated. J. Cryst. Growth 2002, 242, 435–454. [Google Scholar] [CrossRef]
  87. Schulze, O.; Popp, T.; Kern, H. Development of Damage and Permeability in Deforming Rock Salt. Eng. Geol. 2001, 61, 163–180. [Google Scholar] [CrossRef]
  88. Trippetta, F.; Collettini, C.; Vinciguerra, S.; Meredith, P. Laboratory Measurements of the Physical Properties of Triassic Evaporites from Central Italy and Correlation with Geophysical Data. Tectonophysics 2010, 492, 121–132. [Google Scholar] [CrossRef]
  89. Moropoulou, A.; Haralampopoulos, G.; Tsiourva, T.; Auger, F.; Birginie, J.M. Artificial Weathering and Non-Destructive Tests for the Performance Evaluation of Consolidation Materials Applied on Porous Stones. Mater. Struct. 2003, 36, 210–217. [Google Scholar] [CrossRef]
  90. Jaffer, S.J.; Hansson, C.M. Chloride-Induced Corrosion Products of Steel in Cracked-Concrete Subjected to Different Loading Conditions. Cem. Concr. Res. 2009, 39, 116–125. [Google Scholar] [CrossRef]
  91. Zhang, D.; Ghouleh, Z.; Shao, Y. Review on Carbonation Curing of Cement-Based Materials. J. CO2 Util. 2017, 21, 119–131. [Google Scholar] [CrossRef]
  92. Sakr, M.R.; Bassuoni, M.T.; Hooton, R.D.; Drimalas, T.; Haynes, H.; Folliard, K.J. Physical Salt Attack on Concrete: Mechanisms, Influential Factors, and Protection. ACI Mater. J. 2020, 117, 253–268. [Google Scholar] [CrossRef]
  93. Tsui, N.; Flatt, R.J.; Scherer, G.W. Crystallization Damage by Sodium Sulfate. J. Cult. Herit. 2003, 4, 109–115. [Google Scholar] [CrossRef]
  94. Holly, I.; Bilčík, J. Effect of Chloride-Induced Steel Corrosion on Working Life of Concrete Structures. Solid State Phenom. 2018, 272, 226–231. [Google Scholar] [CrossRef]
  95. Jamshidi, A. An Investigation on Ultrasonic Wave Velocity of Laminated Sandstone under Freeze-Thaw and Salt Crystallization Cycles: Insights from Anisotropy Effects. J. Build. Eng. 2023, 71, 106461. [Google Scholar] [CrossRef]
  96. Sun, Z. Seismic Anisotropy in Salt from Theoretical Study, Modelling, and Field Experiments; University of Calgary: Calgary, Canada, 1995; ISBN 0-612-03226-4. [Google Scholar]
  97. Zong, J.; Stewart, R.; Dyaur, N. Salt Anisotropy: Ultrasonic Lab Experiments and Traveltime Ramifications. In SEG Technical Program Expanded Abstracts 2014; SEG Technical Program Expanded Abstracts, Society of Exploration Geophysicists: Houston, TX, USA, 2014; pp. 383–388. [Google Scholar]
  98. Kennett, B.L.N.; Engdahl, E.R.; Buland, R. Constraints on Seismic Velocities in the Earth from Traveltimes. Geophys. J. Int. 1995, 122, 108–124. [Google Scholar] [CrossRef]
  99. Müller, T.M.; Gurevich, B.; Lebedev, M. Seismic Wave Attenuation and Dispersion Resulting from Wave-Induced Flow in Porous Rocks—A Review. Geophysics 2010, 75, 75A147–75A164. [Google Scholar] [CrossRef]
  100. International Offshore Mechanics and Arctic Engineering Symposium. In Proceedings of the Sixth International Symposium & Exhibit on Offshore Mechanics and Arctic Engineering, Houston, TX, USA, 1–6 March 1987; American Society of Mechanical Engineers: New York, NY, USA, 1987.
  101. Uenishi, K.; Yamachi, H.; Nakamori, J. Precise Dynamic Disintegration of Concrete Structures by Controlling Wave Motion. Procedia Struct. Integr. 2022, 42, 755–761. [Google Scholar] [CrossRef]
Figure 1. Schematic representation of the crystallization process. The graph illustrates the relationship between Gibbs free energy (ΔG) and time during salt crystallization. Initially, ions are dissolved in a supersaturated solution. As the degree of supersaturation increases, nucleation occurs, leading to the formation of small, unstable nuclei. At this stage, Gibbs free energy rises, reaching a peak when the critical nuclei form. Once the energy barrier is overcome, stable crystal growth ensues, driving the system toward lower energy states. As the solution approaches equilibrium solubility, crystal growth continues, lowering the Gibbs free energy. The process culminates in larger, more stable crystals. The introduction of inhibitors, such as citric acid, can interfere with nucleation and crystal growth, effectively reducing or delaying crystallization within the porous material.
Jcs 09 00639 g001
Figure 2. Procedure methods workflow. (A,B) Pre Scenario. (A) Concrete samples preparation according to UNI EN 197-1:2011 [61]. Each sample is 3 × 30 × 40 cm sized. Grids on the parallel faces of the samples ensure subsequent measurements in the same areas. (B) Acoustic measures on untreated samples through two piezoelectric 1 MHz transducers. The picking of the first P- and S-wave arrivals is performed using a custom Python (Python 3.13.0. Release Date: Oct. 7, 2024) code. (C,D) Post Scenario. (C) Salt crystallization procedure. The three samples underwent wet–dry cycles, into distilled water for WHT and into saline solution for REF and ACT. ACT sample was pre-treated with a 10−5 M citric acid solution. (D) Acoustic measures on samples after the wet–dry cycles to identify differences compared to the Pre Scenario measurements. Each sample was marked with an N for the upper portion and S for its lower portion to allow for a faster identification of sample position into the wave flume. (E,F) W scenario. (E) Wave motion simulation into the wave flume. Portion marked as N is affected by the wave impact stress. Portion marked as S is affected by subaquatic stress. (F) Acoustic measures on samples after the wave motion simulation to identify differences compared to the Pre Scenario and Post Scenario measurements.
Jcs 09 00639 g002
Figure 3. Example photograph of one face of the REF sample, illustrating the grid consisting of equidistant nodes where acoustic measurements were conducted. The numbers refer to the exact points where the measurement was taken. Additionally, symbols “N” and “S” are depicted, denoting the upper and lower portions, respectively. These symbols are instrumental for analyses related to the wave motion simulation in subsequent methodological steps (refer to succeeding sections for details).
Jcs 09 00639 g003
Figure 4. Example of wave plotting during the process of picking. The picking of the first wave arrivals was performed using a custom Python code, specially programmed in Anaconda’s Jupyter Notebook.
Jcs 09 00639 g004
Figure 5. The pressure distribution is illustrated in the Goda graph. Insights into the physical forces experienced by samples in both the direct wave impact zone (N zone) and the subaquatic stress zone (S zone).
Jcs 09 00639 g005
Figure 6. The wave flume. In the labels are reported the total length of the flume (15 m), the electromechanics engine which allows motion to the wave maker, and the paddle spreading the wave.
Jcs 09 00639 g006
Figure 7. Graph showing the averaged measured values of E (in GPa) for the three samples (WHT, REF, ACT) referred to the samples without treatment (pre) reported in the lighter shade of orange, to the samples subjected to wet–dry cycles (post) reported in the intermediate shade of orange, and to the samples subjected to the simulation of marine wave motion (W) reported in the darkest shade of orange.
Jcs 09 00639 g007
Figure 8. Graph showing the averaged measured values of ν for the three samples (WHT, REF, ACT) referred to the samples without treatment (pre) reported in the lighter shade of grey, to the samples subjected to wet–dry cycles (post) reported in the intermediate shade of grey, and to the samples subjected to the simulation of marine wave motion (W) reported in the darkest shade of grey.
Jcs 09 00639 g008
Figure 9. Graph illustrating the averaged Young’s modulus values observed in the wave impact zone (N) and in the subaquatic stress zone (S) sections of the WHT (A), ACT (B), and REF (C) samples before and after W-scenario (black vertical dashed lines).
Jcs 09 00639 g009
Table 1. Averages of acoustic velocity data measured in laboratory on concrete samples (WHT, REF, ACT) and relative Vp/Vs ratios. Samples labelled (pre) refer to those measured after the hardening of the cement without any specific treatment. Samples labeled (post) refer to those subjected to wetting and drying cycles. Samples labelled (W) refer to those subjected to the simulation of marine wave motion.
WHT (Pre) Avg.σREF (Pre) Avg.σACT (Pre) Avg.σ
Vp (km/s)3.652630.163503.623510.182033.796830.16986
Vs (km/s)2.359810.097292.272590.139662.347620.07057
Vp/Vs1.550120.093871.596170.057591.618160.07736
WHT (Post) avg. REF (Post) avg. ACT (Post) avg.
Vp (km/s)3.780180.106214.083590.112803.971000.03887
Vs (km/s)2.384960.092752.432490.098512.446340.02101
Vp/Vs1.585990.043061.672890.065881.623320.01920
WHT (W) avg. REF (W) avg. ACT (W) avg.
Vp (km/s)3.805180.064263.806300.147253.832200.05082
Vs (km/s)2.325140.046712.379940.087892.417180.02734
Vp/Vs1.636870.039671.600460.052581.586080.02348
Table 2. Averages of acoustic velocity data measured in laboratory on concrete samples (WHT, REF, ACT) and relative.
E [GPa]
WHT (Pre) Avg.σREF (Pre) Avg.σACT (Pre) Avg.σ
28.463171.736627.488182.999729.595301.6528
WHT (post)
N+S avg.
REF (Post) N+S avg. ACT (post) N+S avg.
30.09301.876732.94681.762332.35760.4480
WHT (post)
N avg.
REF (Post)   N avg. ACT (post)   N avg.
28.80791.144932.11520.871832.69570.4561
WHT (post)
N avg.
REF (Post)   S avg. ACT (post)   S avg.
30.65681.582633.96122.154731.88940.3102
WHT (W) avg. REF (W) avg. ACT (W) avg.
28.387360.833829.161981.637929.854830.9109
WHT (W)
N avg.
REF (W)   N avg. ACT (W)   N avg.
27.61790.801926.26261.017728.82011.2499
WHT (W)
S avg.
REF (W)   S avg. ACT (W)   S avg.
29.65680.886431.06121.751430.88940.6089
Table 3. Averages of Poisson’s ratio values (ν) calculated through concrete samples (WHT, REF, ACT). Again, samples labelled (pre) refer to those measured after the hardening of the cement without any specific treatment. Samples labelled (post) refer to those subjected to wetting and drying cycles. Samples labeled (W) refer to those subjected to the simulation of marine wave motion.
WHT (Pre) avg.REF (Pre) avg.ACT (Pre) avg.
n0.1310393510.1736097940.185821307
WHT (Post) avg.REF (Post) avg.ACT (Post) avg.
n0.1680799070.2189932040.193896367
WHT (W) avg.REF (W) avg.ACT (W) avg.
n0.2003876120.1761049180.166669406
Table 4. Averages Average increases in Vp, Vs, and Vp/Vs values between wet–dry cycle-treated samples (Post) and cured samples (Pre).
WHT (Pre → Post)REF (Pre → Post)ACT (Pre → Post)
Vp Increase %3.4912.694.58
Vs Increase %1.067.034.20
Vp/Vs Increase %2.314.800.31
Table 5. Averages of the percentage increase in Vp, Vs, Vp/Vs values between wet–dry cycles treated samples and wave-impact affected samples (Post-W).
SampleWHT (Post → W)REF (Post → W)ACT (Post → W)
Vp Variation %0.66−6.79−3.49
Vs Variation %−2.50−2.16−1.19
Vp/Vs Variation %3.20−4.32−2.29
Disclaimer/Publisher’s Note: The statements, opinions and data contained in all publications are solely those of the individual author(s) and contributor(s) and not of MDPI and/or the editor(s). MDPI and/or the editor(s) disclaim responsibility for any injury to people or property resulting from any ideas, methods, instructions or products referred to in the content.