3.1. Combined Co-Precipitation and Solid-State Method
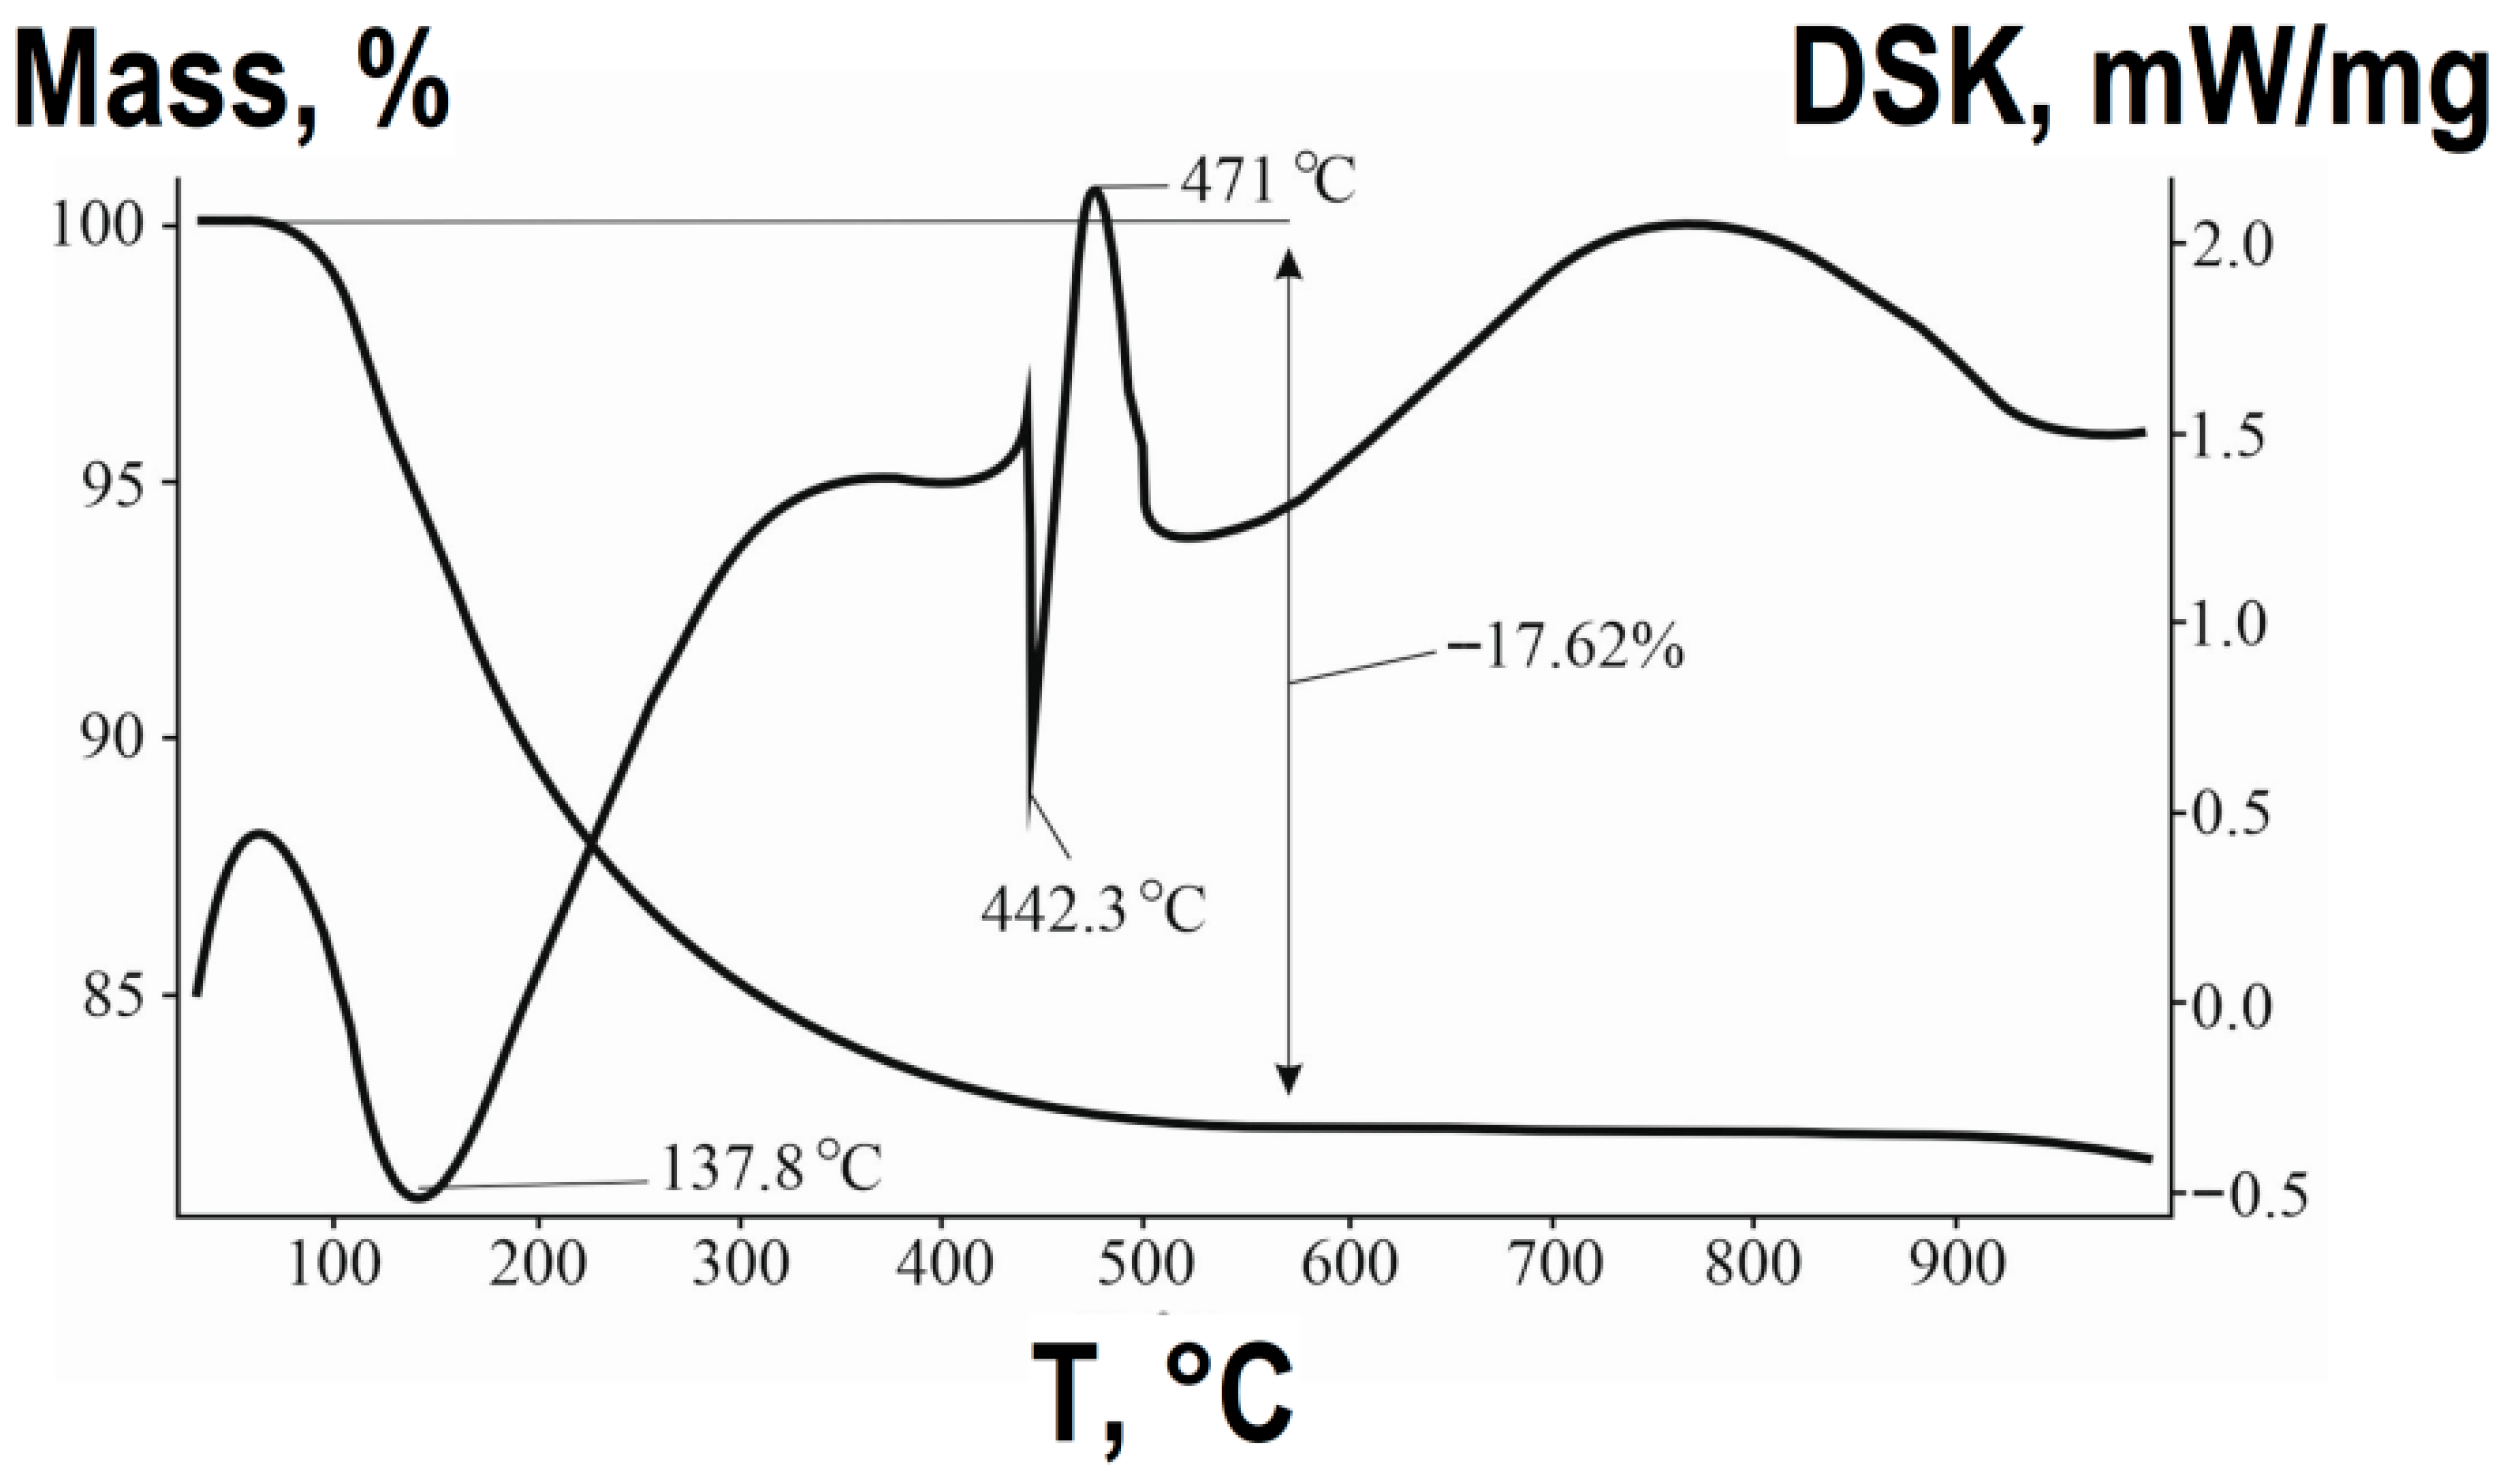
Before thermal treatment of the samples, DTA and TG studies of the synthesized air-dry precursor were conducted, and the results are presented in
Figure 3.
Based on the TG-DTA results (
Figure 3), the chemical transformation during the synthesis of ZnFe
2O
4 via the combined method can be described by a multi-step process. The significant mass loss (~20–25%) observed up to approximately 400 °C is primarily attributed to the removal of water molecules. This process involves two main stages:
The initial endothermic effect is associated with the evaporation of residual adsorbed water from the highly developed surface of the precursor gel and the decomposition of aqua complexes [Fe(H2O)6]3+ and [Zn(H2O)6]2+, leading to the formation of amorphous hydroxides (~30–150 °C).
The subsequent mass loss corresponds to the endothermic decomposition of the precipitated hydroxides (FeOOH and Zn(OH)
2) (~150–440 °C). This stage involves the condensation and removal of structural hydroxyl groups (dehydroxylation), resulting in the formation of amorphous iron and zinc oxides:
The formation of the target spinel phase occurs in the temperature range of 440–470 °C, as evidenced by the distinct exothermic effect on the DTA curve, which is not accompanied by a significant mass change. This effect corresponds to the solid-state reaction between the newly formed ZnO and Fe
2O
3 nanoparticles, leading to the crystallization of the zinc ferrite phase:
The high reactivity of the nanoscale oxides, obtained from the molecularly mixed precursor, allows this reaction to proceed at a significantly lower temperature compared to the classical ceramic method.
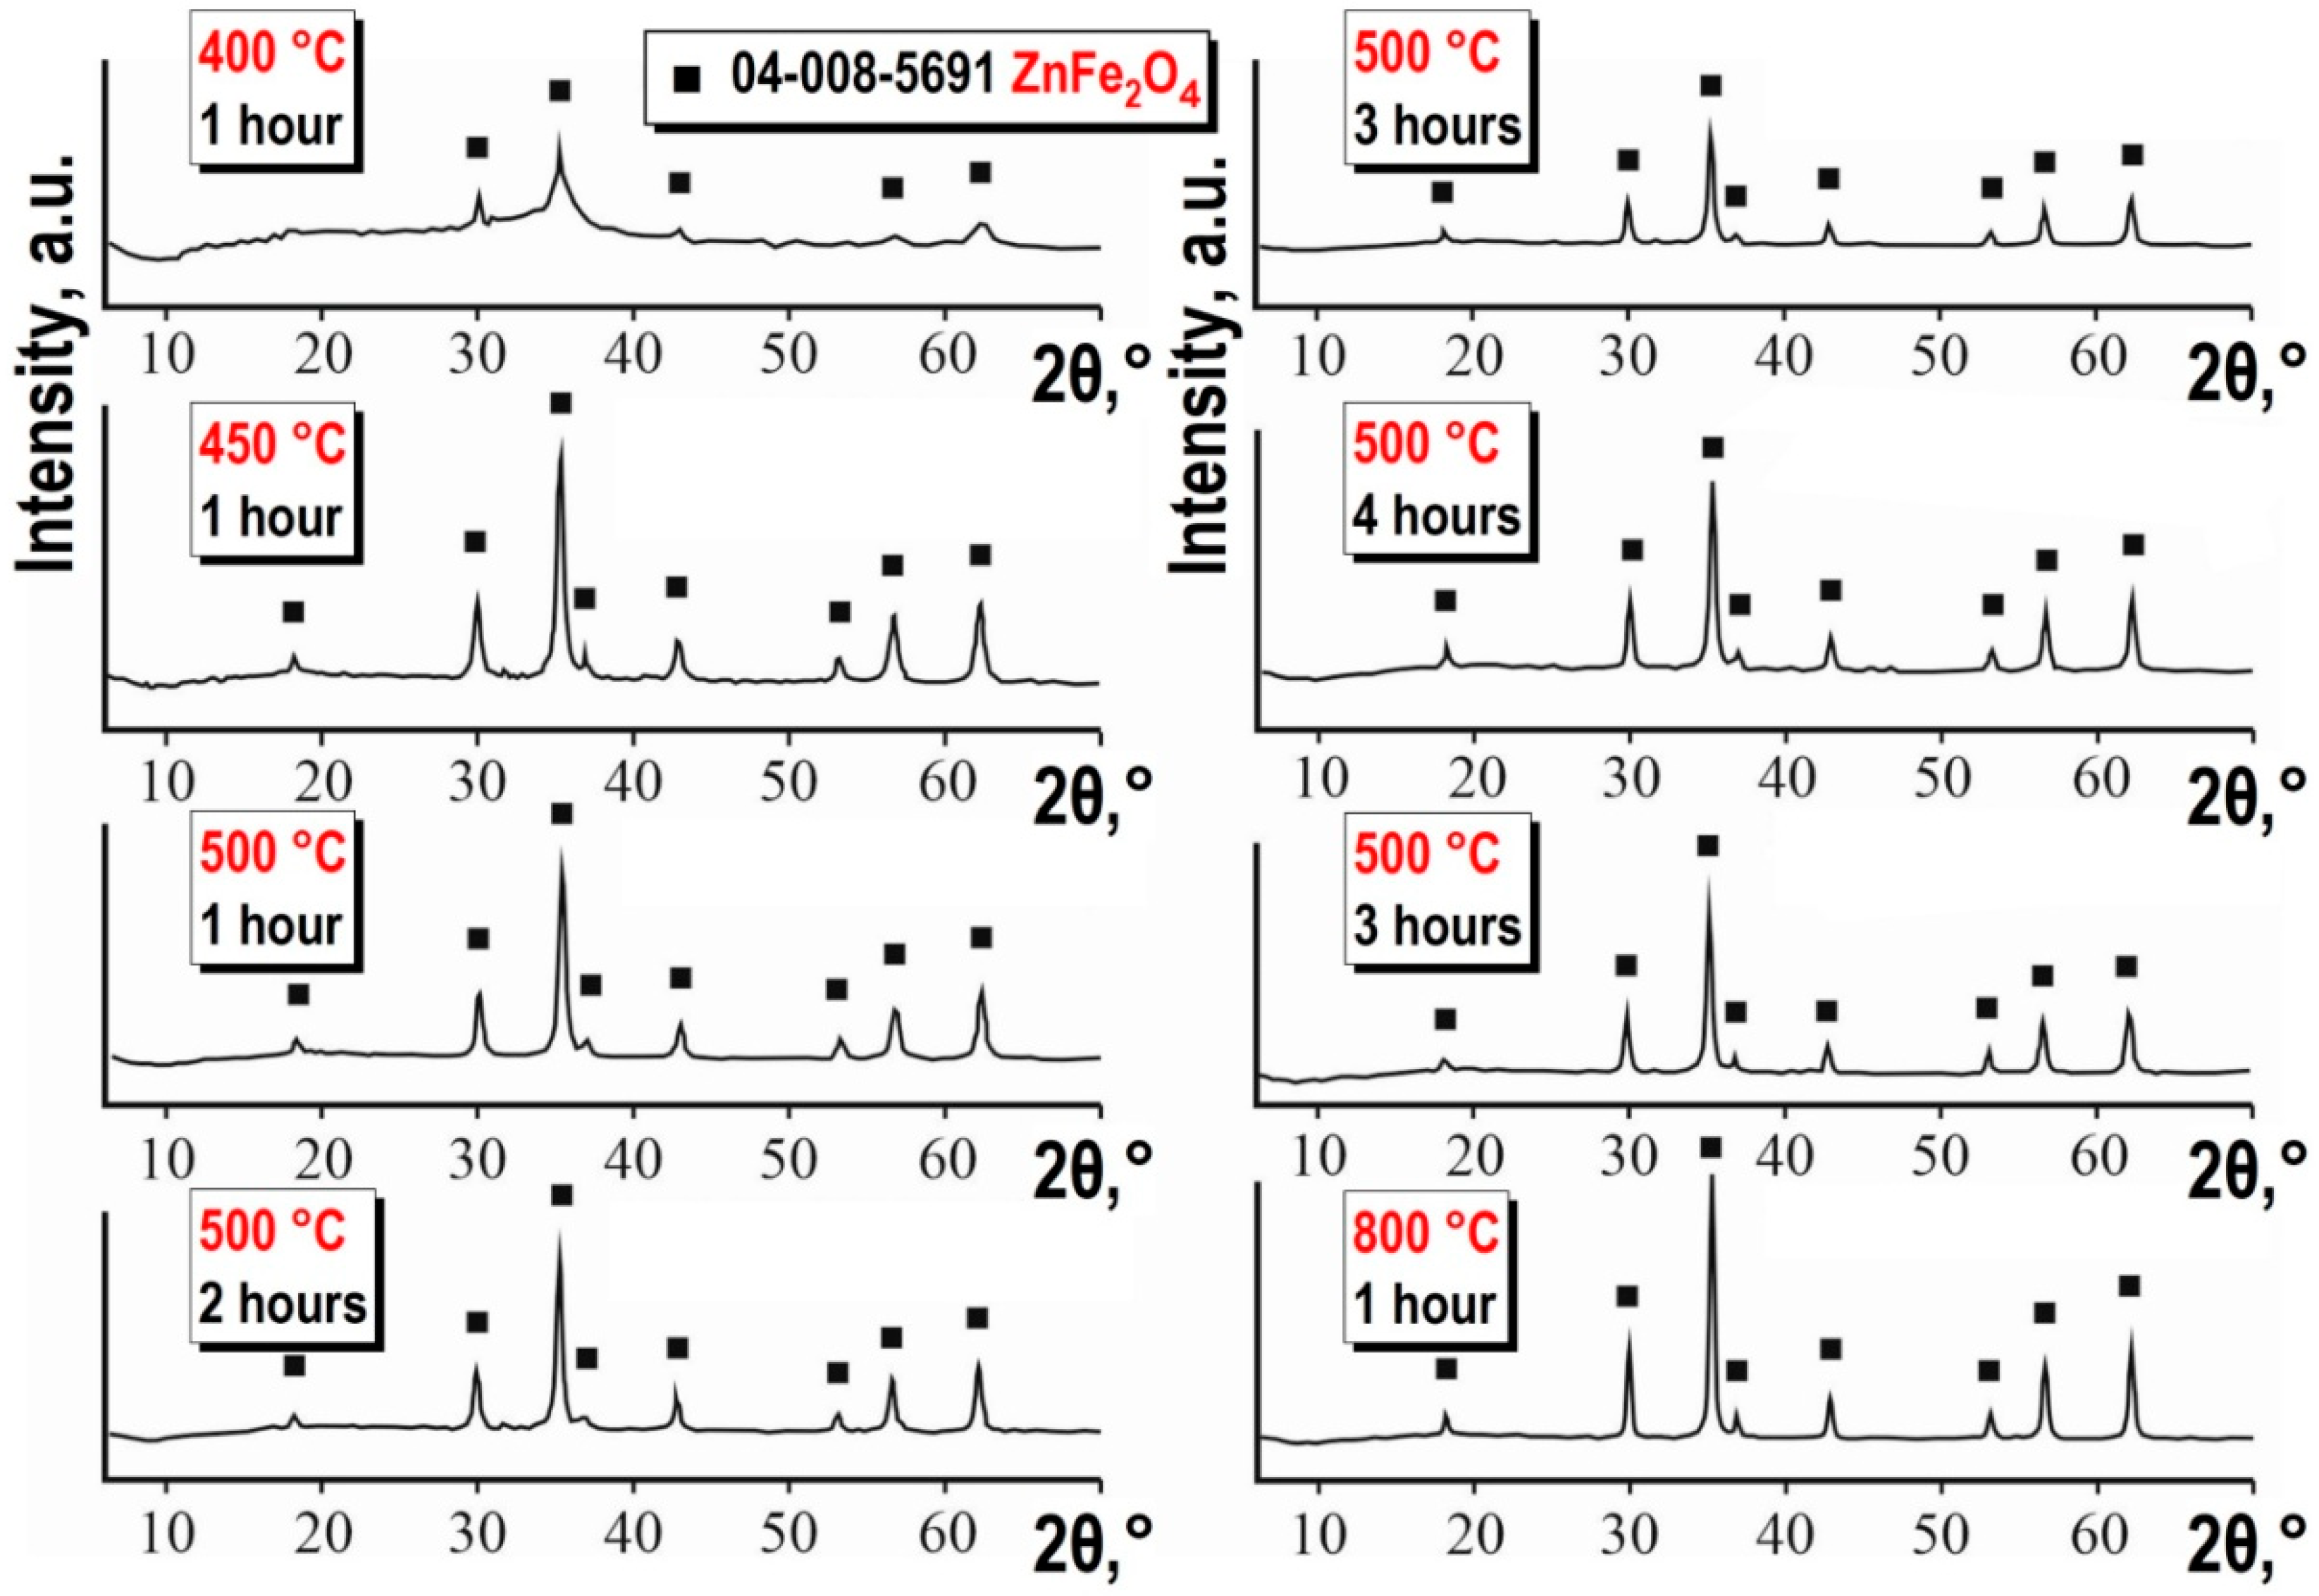
The thermal treatment of samples, in investigating the conditions for the formation of the target phase obtained through the combined approach, was conducted at various temperatures. The influence of the time factor on the formation and physical parameters of zinc ferrite compounds was also studied (see
Figure 4 and
Table 1). To economically optimize the synthesis conditions, research was conducted on the potential reduction in the temperature required for obtaining the target phase.
From the X-ray diffraction patterns (see
Figure 4), it is evident that thermal treatment of the precursor at 400 °C for 1 h results in the formation of an amorphous phase of ZnFe
2O
4. Clearly, these synthesis conditions do not adequately facilitate the crystallization processes of zinc ferrite, as confirmed by the DTA data (see
Figure 3). Increasing the temperature of the process for obtaining the target product promotes the formation of ZnFe
2O
4 phases with well-defined crystallinity (see
Figure 4), starting from 450 °C. Both the increase in calcination temperature and duration do not affect the phase composition of the synthesized product (see
Figure 4). Raising the temperature to 800 °C results in sharper and well-resolved reflections (see
Figure 4).
Table 2 and
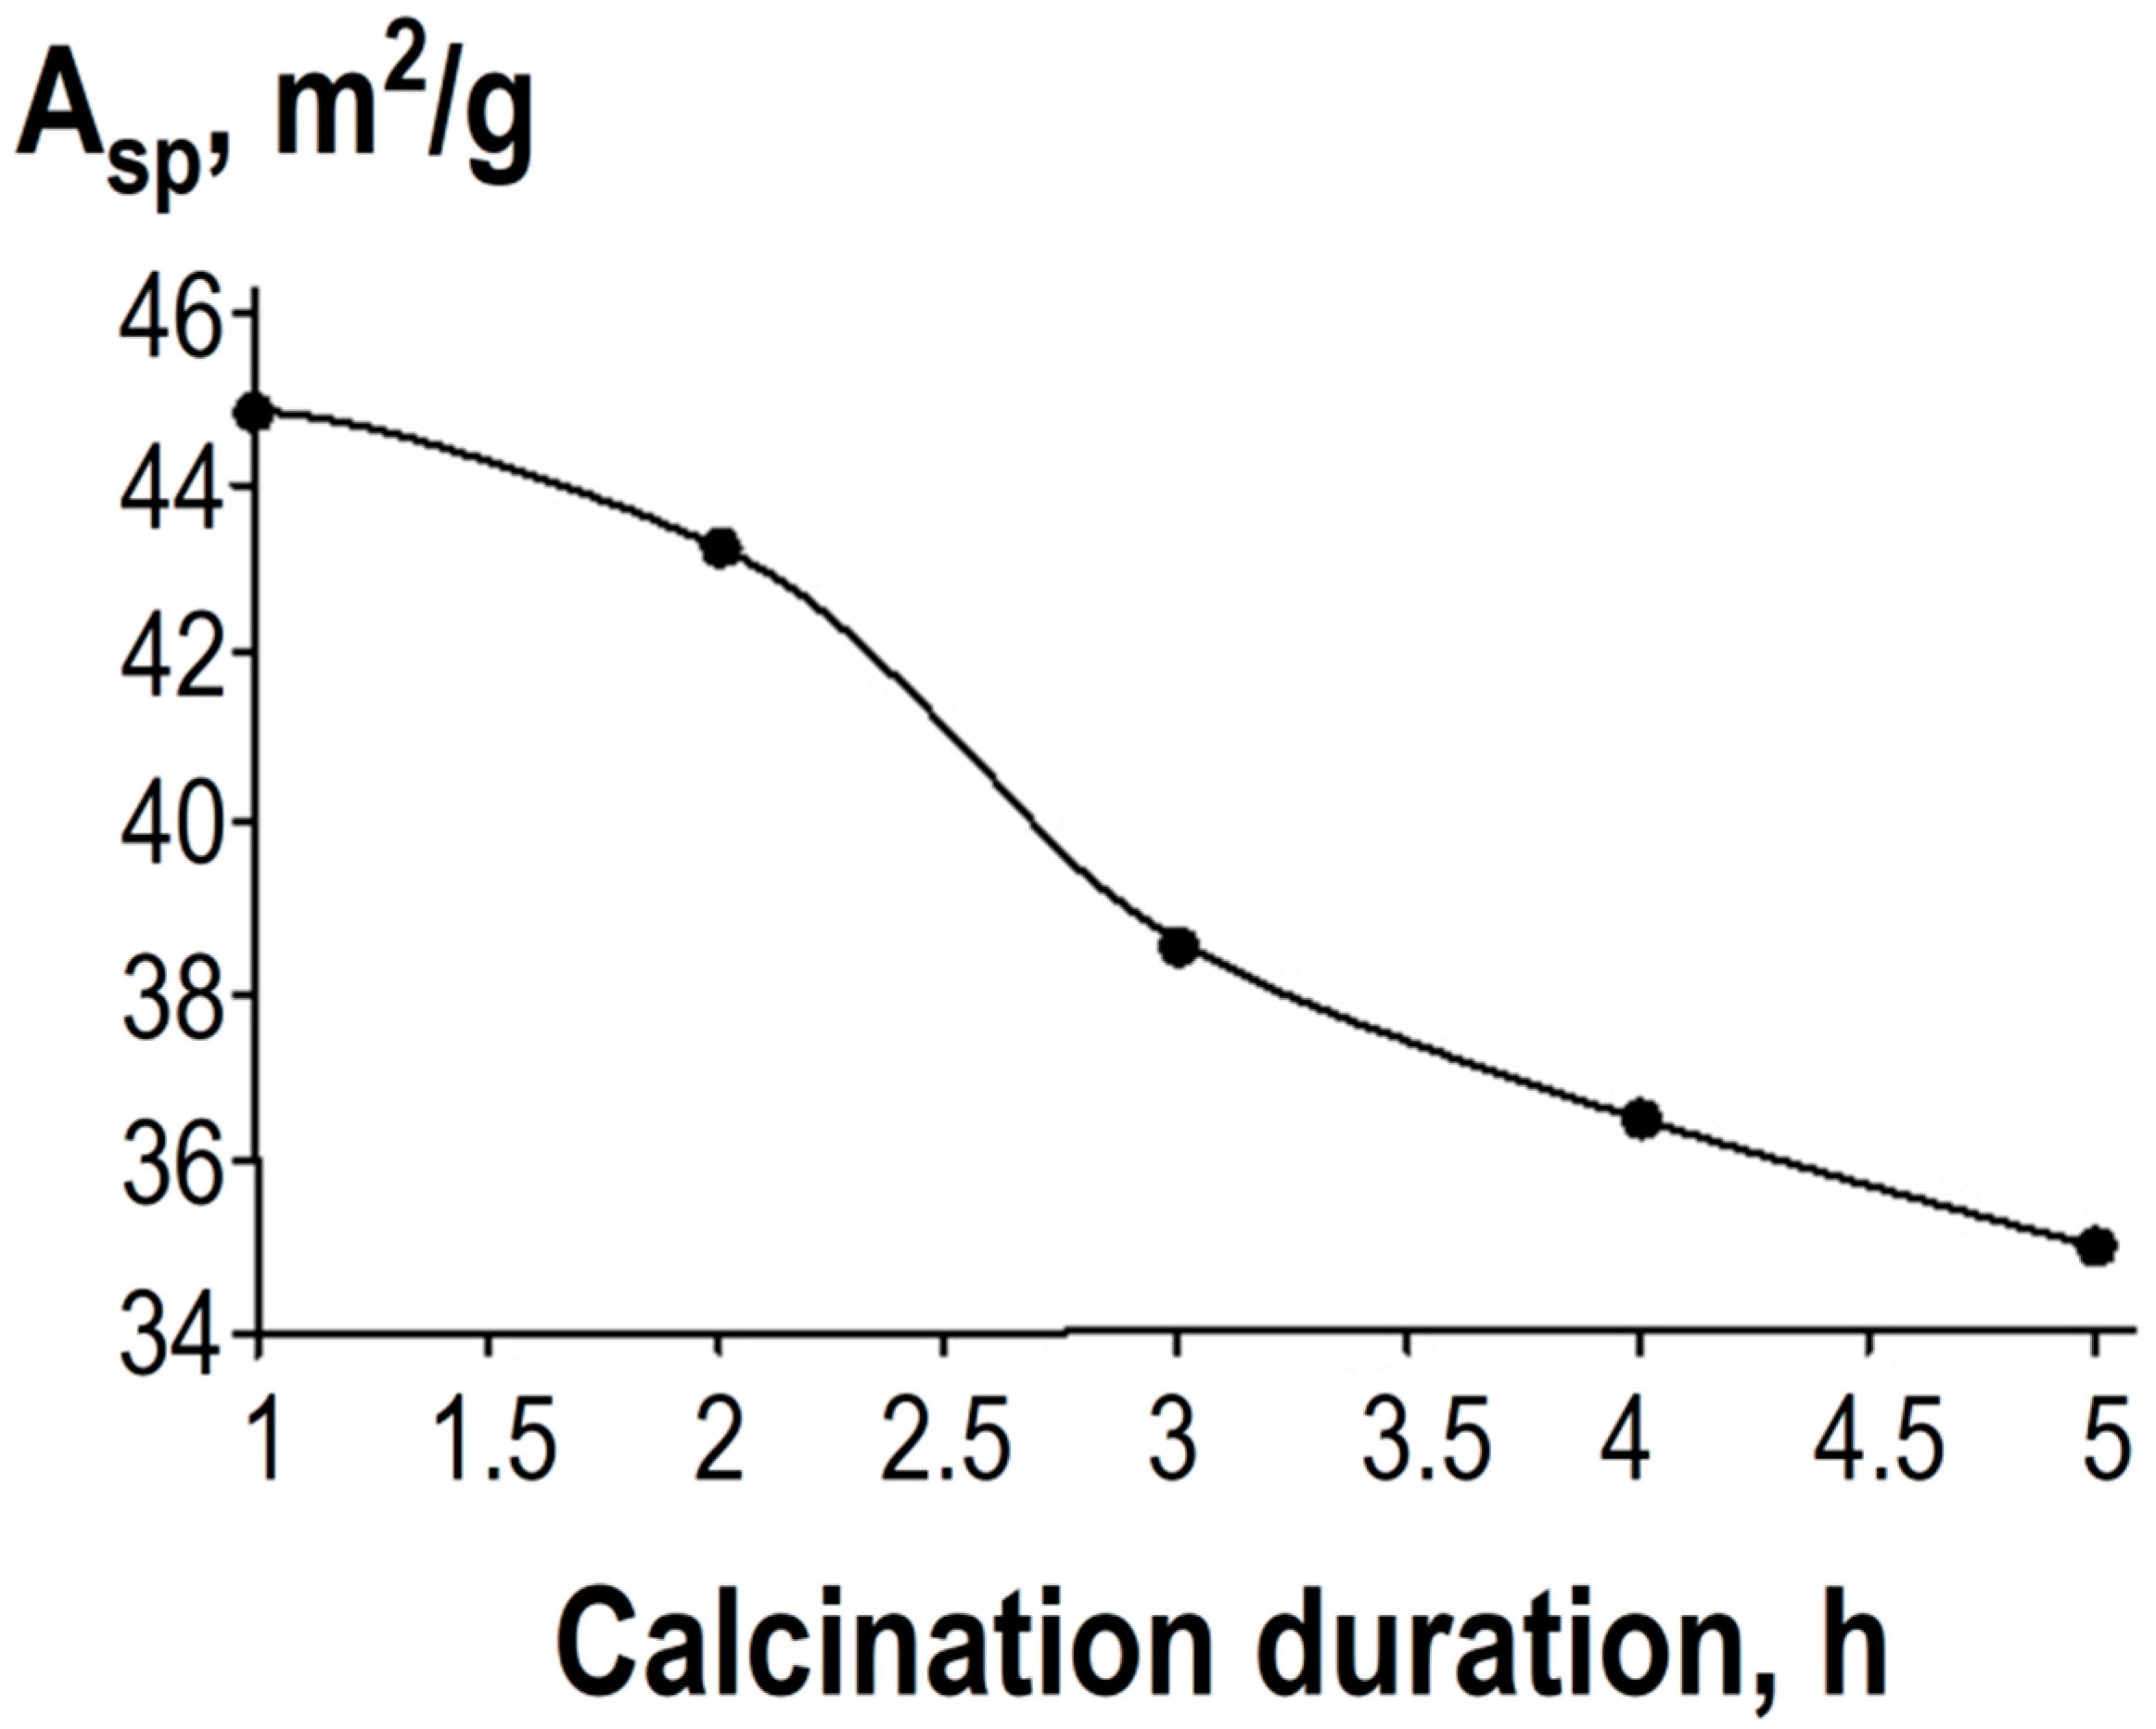
Figure 5 present the specific surface area values for the indicated sample compositions, determined by the BET method based on nitrogen adsorption/desorption isotherms using the TriStar II 3020 specific surface area analyzer.
It is evident that reducing the synthesis temperature of the target product (see
Table 2) facilitates the formation of nanosized compounds with a more developed specific surface area—the specific surface area increases by 2.7 times when comparing the parameters of samples calcined at 450 °C and 800 °C. Additionally, it was experimentally found that increasing the duration of thermal treatment leads to a decrease in specific surface area due to the agglomeration of product particles (see
Figure 5)—the specific surface area decreases by 1.3 times when comparing the parameters of samples calcined at 500 °C for varying durations.
To validate the results of the X-ray phase analysis, a chemical analysis of the obtained zinc ferrite compounds was conducted, the results of which confirm the formation of the target phase (see
Table 3).
3.2. Solid-State Method
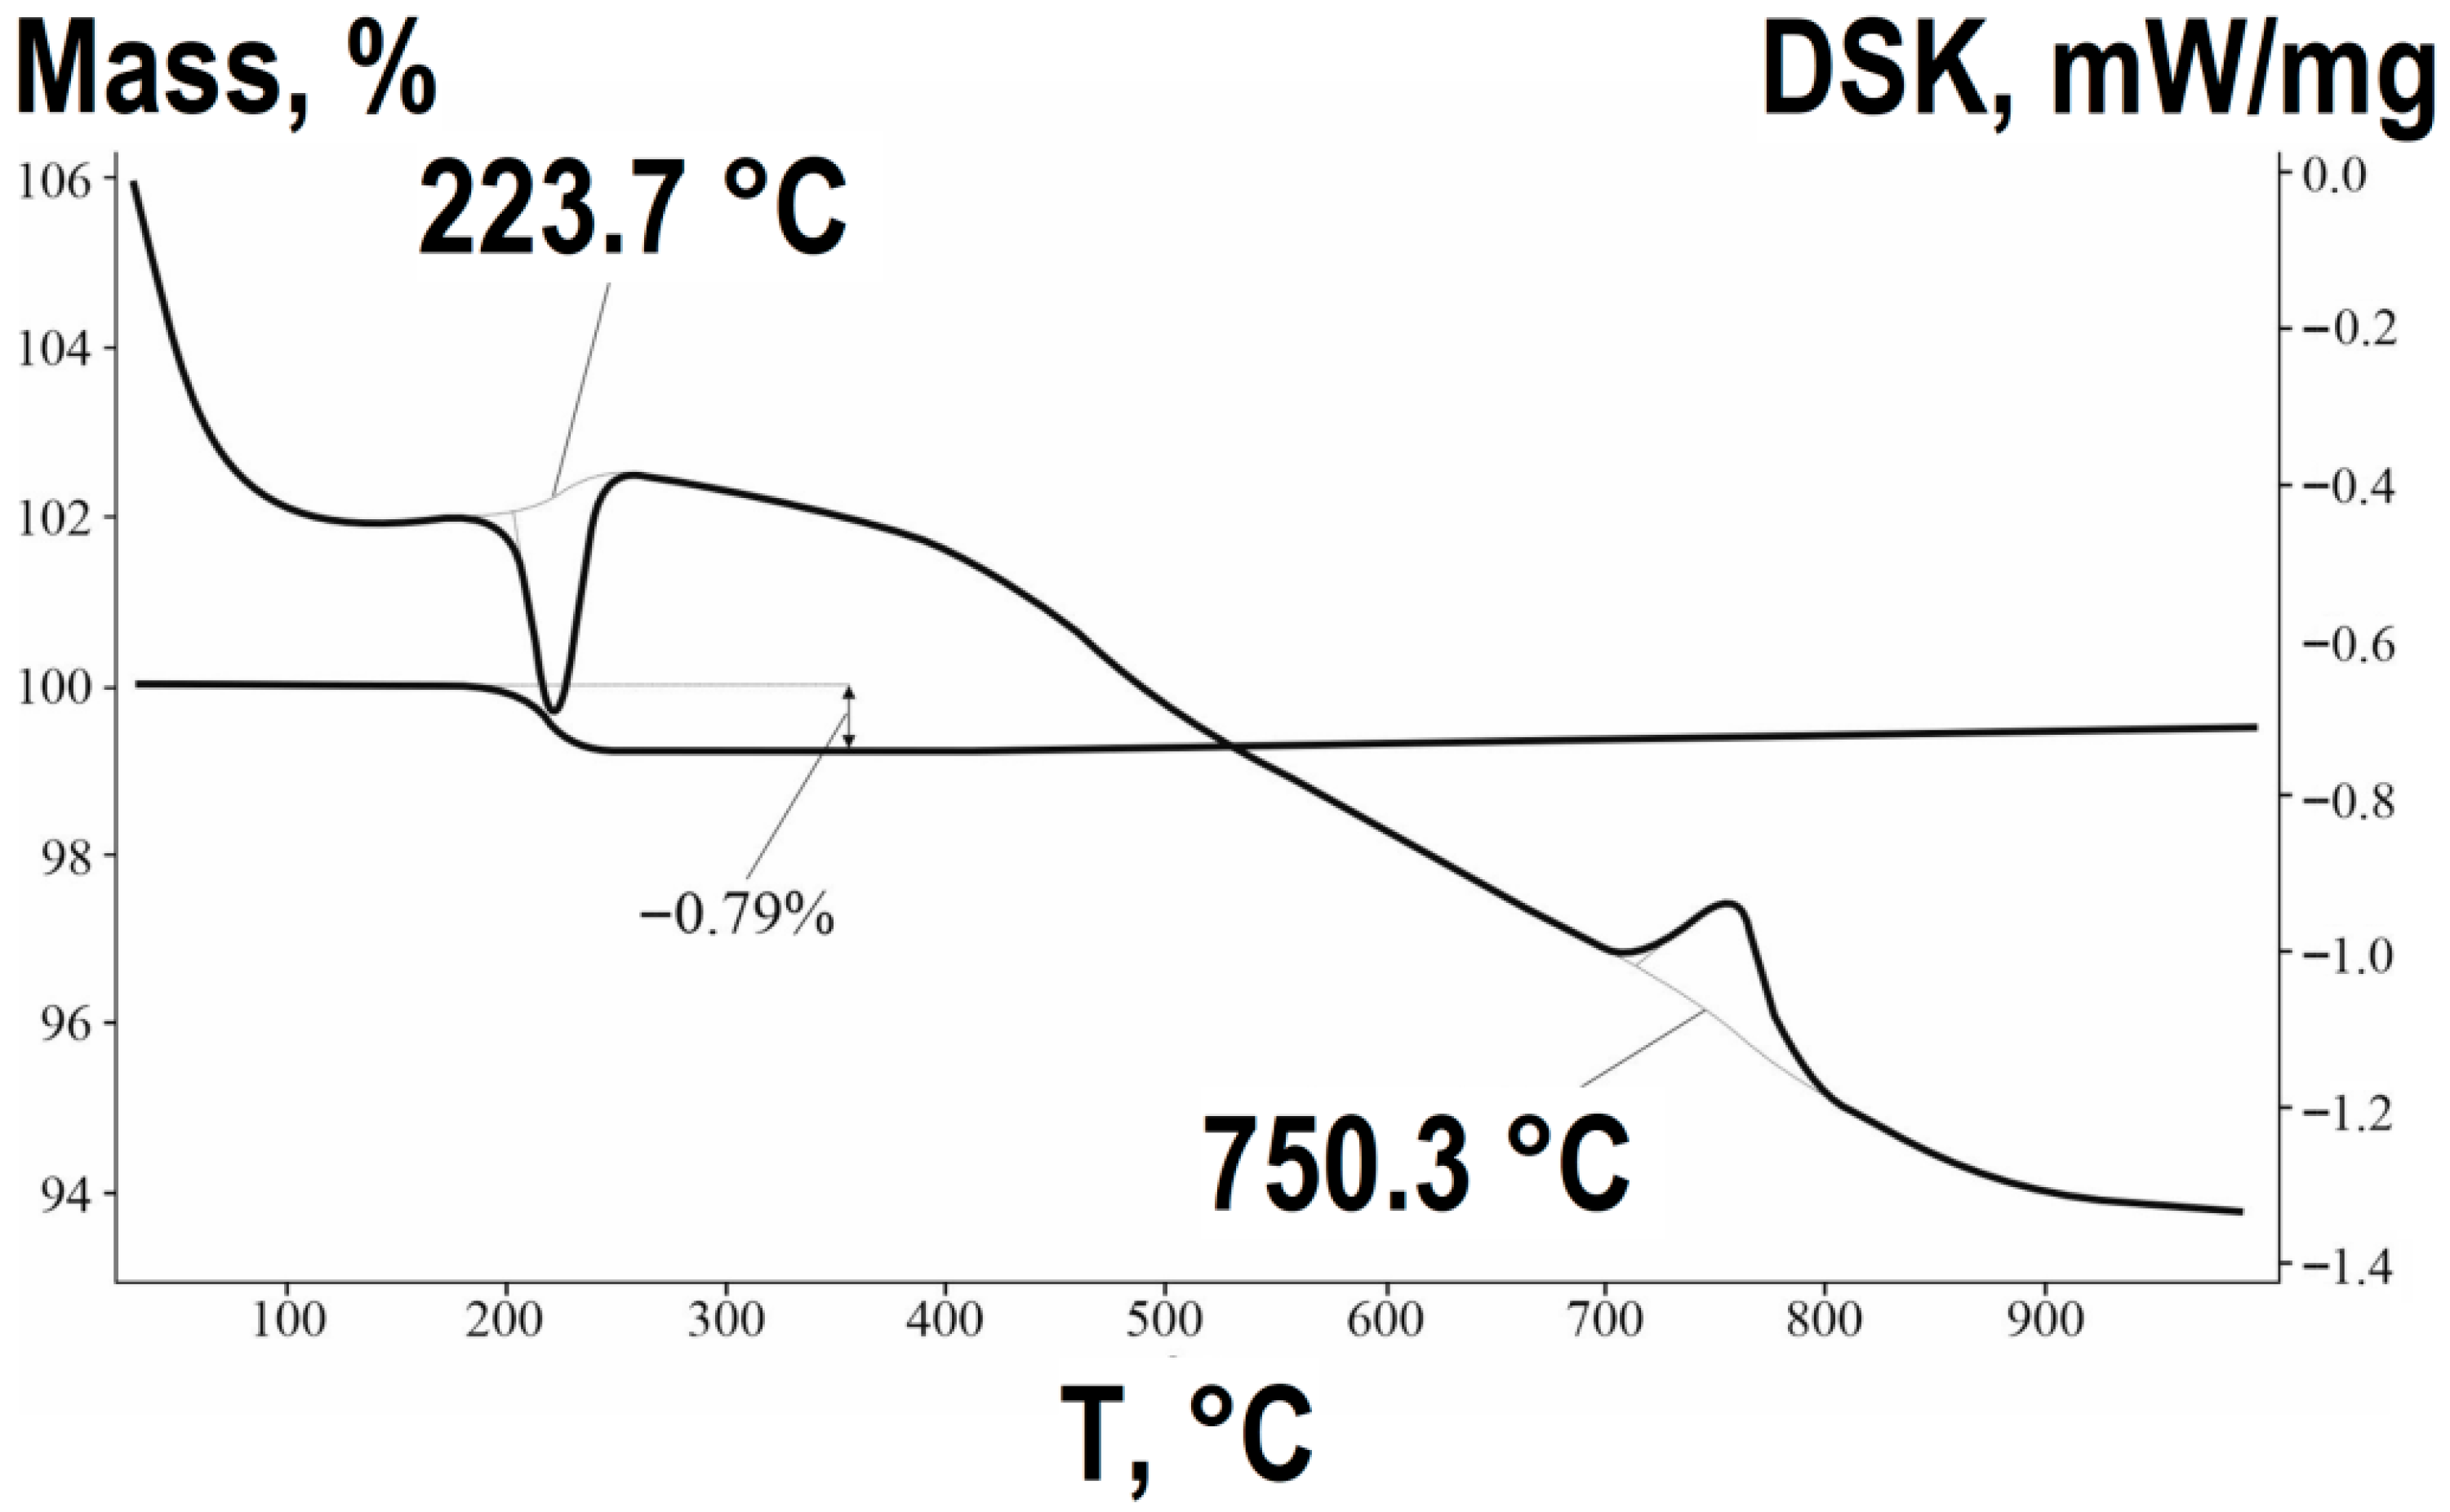
The TG-DTA analysis for the solid-state method (
Figure 6) reveals a fundamentally different and much simpler process. The slight mass loss (~0.79%) and the corresponding endothermic effect in the range of 198–225 °C are associated solely with the removal of moisture adsorbed by the oxide powder mixture from the atmosphere. The key chemical transformation is the direct solid-state reaction between micron-sized ZnO and Fe
2O
3 particles, which initiates at temperatures above ~700 °C. The sharp exothermic peak at 715–750 °C, without any associated mass loss, marks the crystallization and formation of the well-defined ZnFe
2O
4 spinel structure according to the reaction:
The high temperature required for this single-step reaction is characteristic of the classical ceramic method, where diffusion between solid oxide particles is the rate-limiting step.
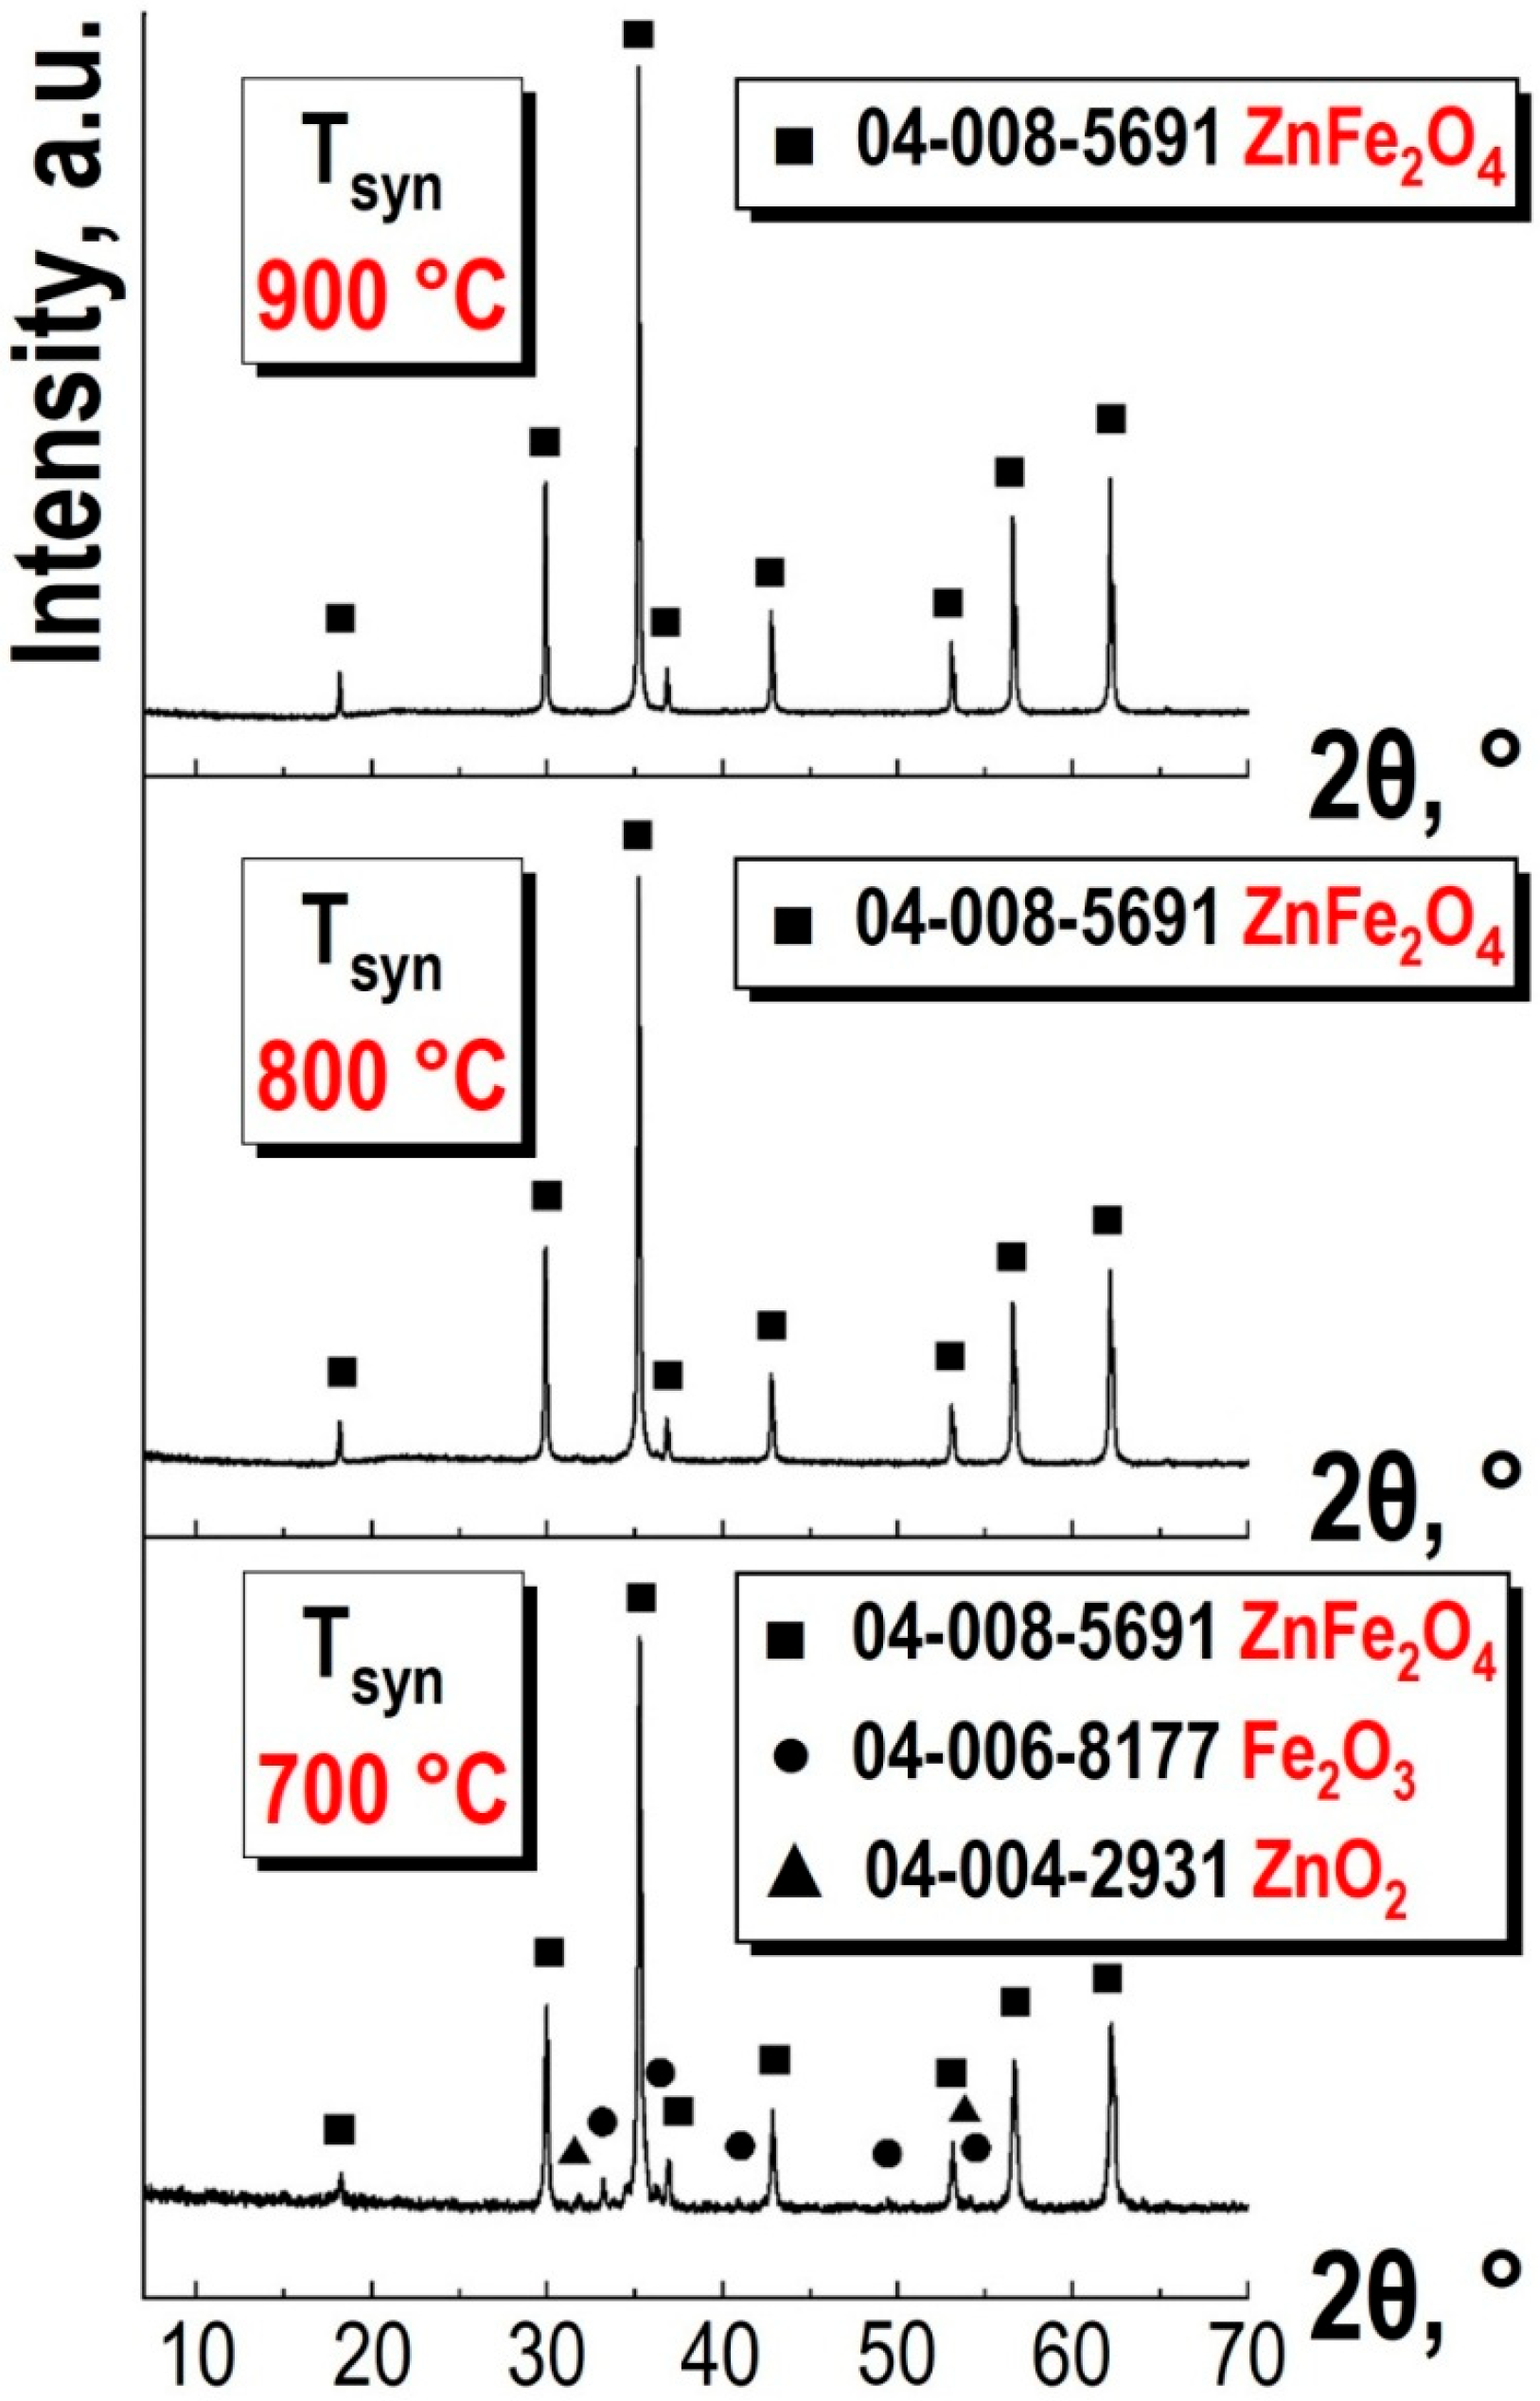
Figure 7 presents the results of X-ray phase analysis for samples of spinel ferrite ZnFe
2O
4 synthesized at various temperatures (the synthesis temperatures are indicated in the figure).
At a synthesis temperature of 700 °C, a monophasic product is not formed. The sample contains iron and zinc oxides: 6% Fe
2O
3 and 4% ZnO. Increasing the temperature to 800 °C results in the formation of the target product—spinel ferrite ZnFe
2O
4—which correlates with the DTA results (see
Figure 6). Further increasing the synthesis temperature to 900 °C causes the lines in the X-ray diffraction spectrum to become sharper and better resolved compared to the sample obtained at 800 °C.
The results of the X-ray structural analysis are presented in
Table 3. As can be seen from the data presented in
Table 3, increasing the synthesis temperature has little effect on the parameters of the elementary cell of the crystal lattice.
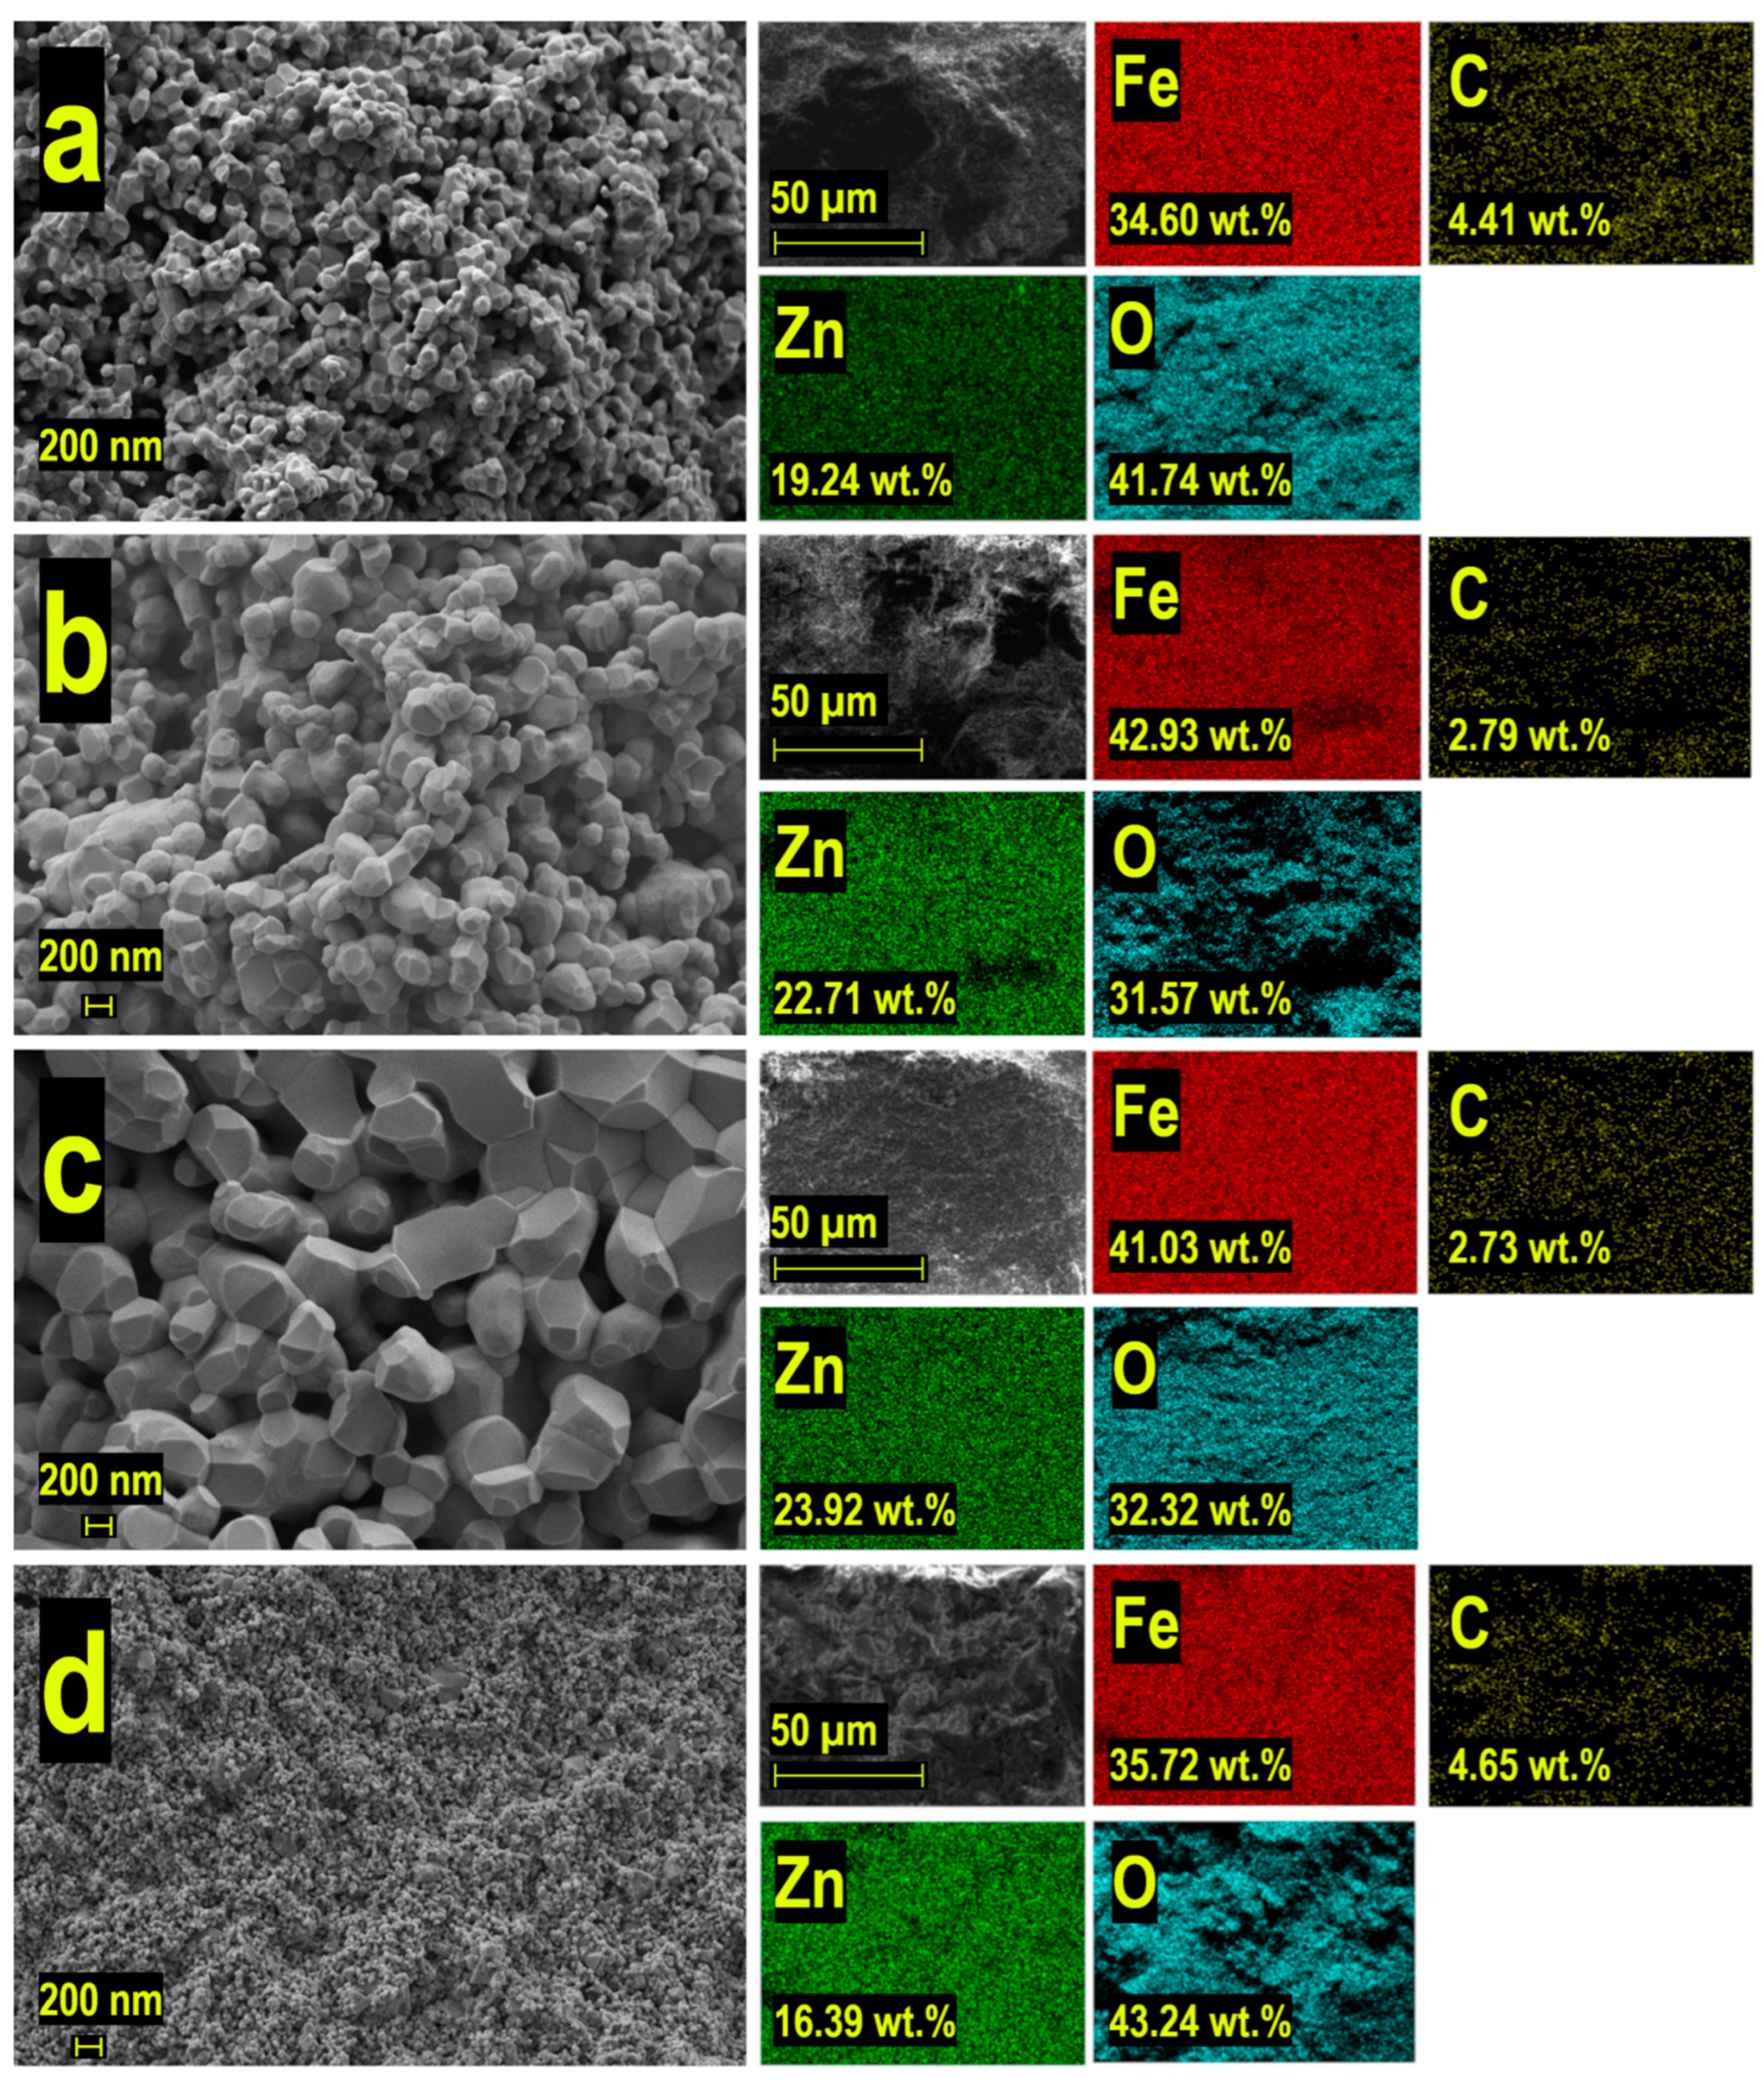
A comprehensive SEM analysis of the materials synthesized via different methods (
Figure 8) revealed distinctive morphological characteristics and microstructural features across varying synthesis conditions. The surface morphology examination demonstrated a systematic evolution of structural organization at the microscale level.
The conventional solid-state synthesis route yielded notable changes in particle morphology with increasing temperature. Initial stages showed loosely packed quasi-spherical agglomerates with distinct particle boundaries and minimal coalescence. As the synthesis temperature increased, progressive particle growth and agglomeration became evident, ultimately leading to the formation of virtually monolithic ceramics with well-defined grain boundaries and advanced sintering features (
Figure 8a–c).
In contrast, the combined synthesis approach (
Figure 8d) resulted in markedly different microstructural characteristics. This method produced ceramics with significantly finer morphology, exhibiting substantially smaller agglomerate sizes and more uniform particle distribution. The observed difference in microstructural development can be attributed to the modified synthesis pathway, which effectively controlled particle growth and agglomeration processes.
EDS mapping analysis provided additional insights into the spatial distribution of constituent elements. The color-coded elemental maps revealed homogeneous distribution of Zn, Fe, and O throughout the analyzed areas, confirming uniform phase composition across all samples. This compositional uniformity suggests successful formation of the desired phase structure, regardless of the synthesis method employed.
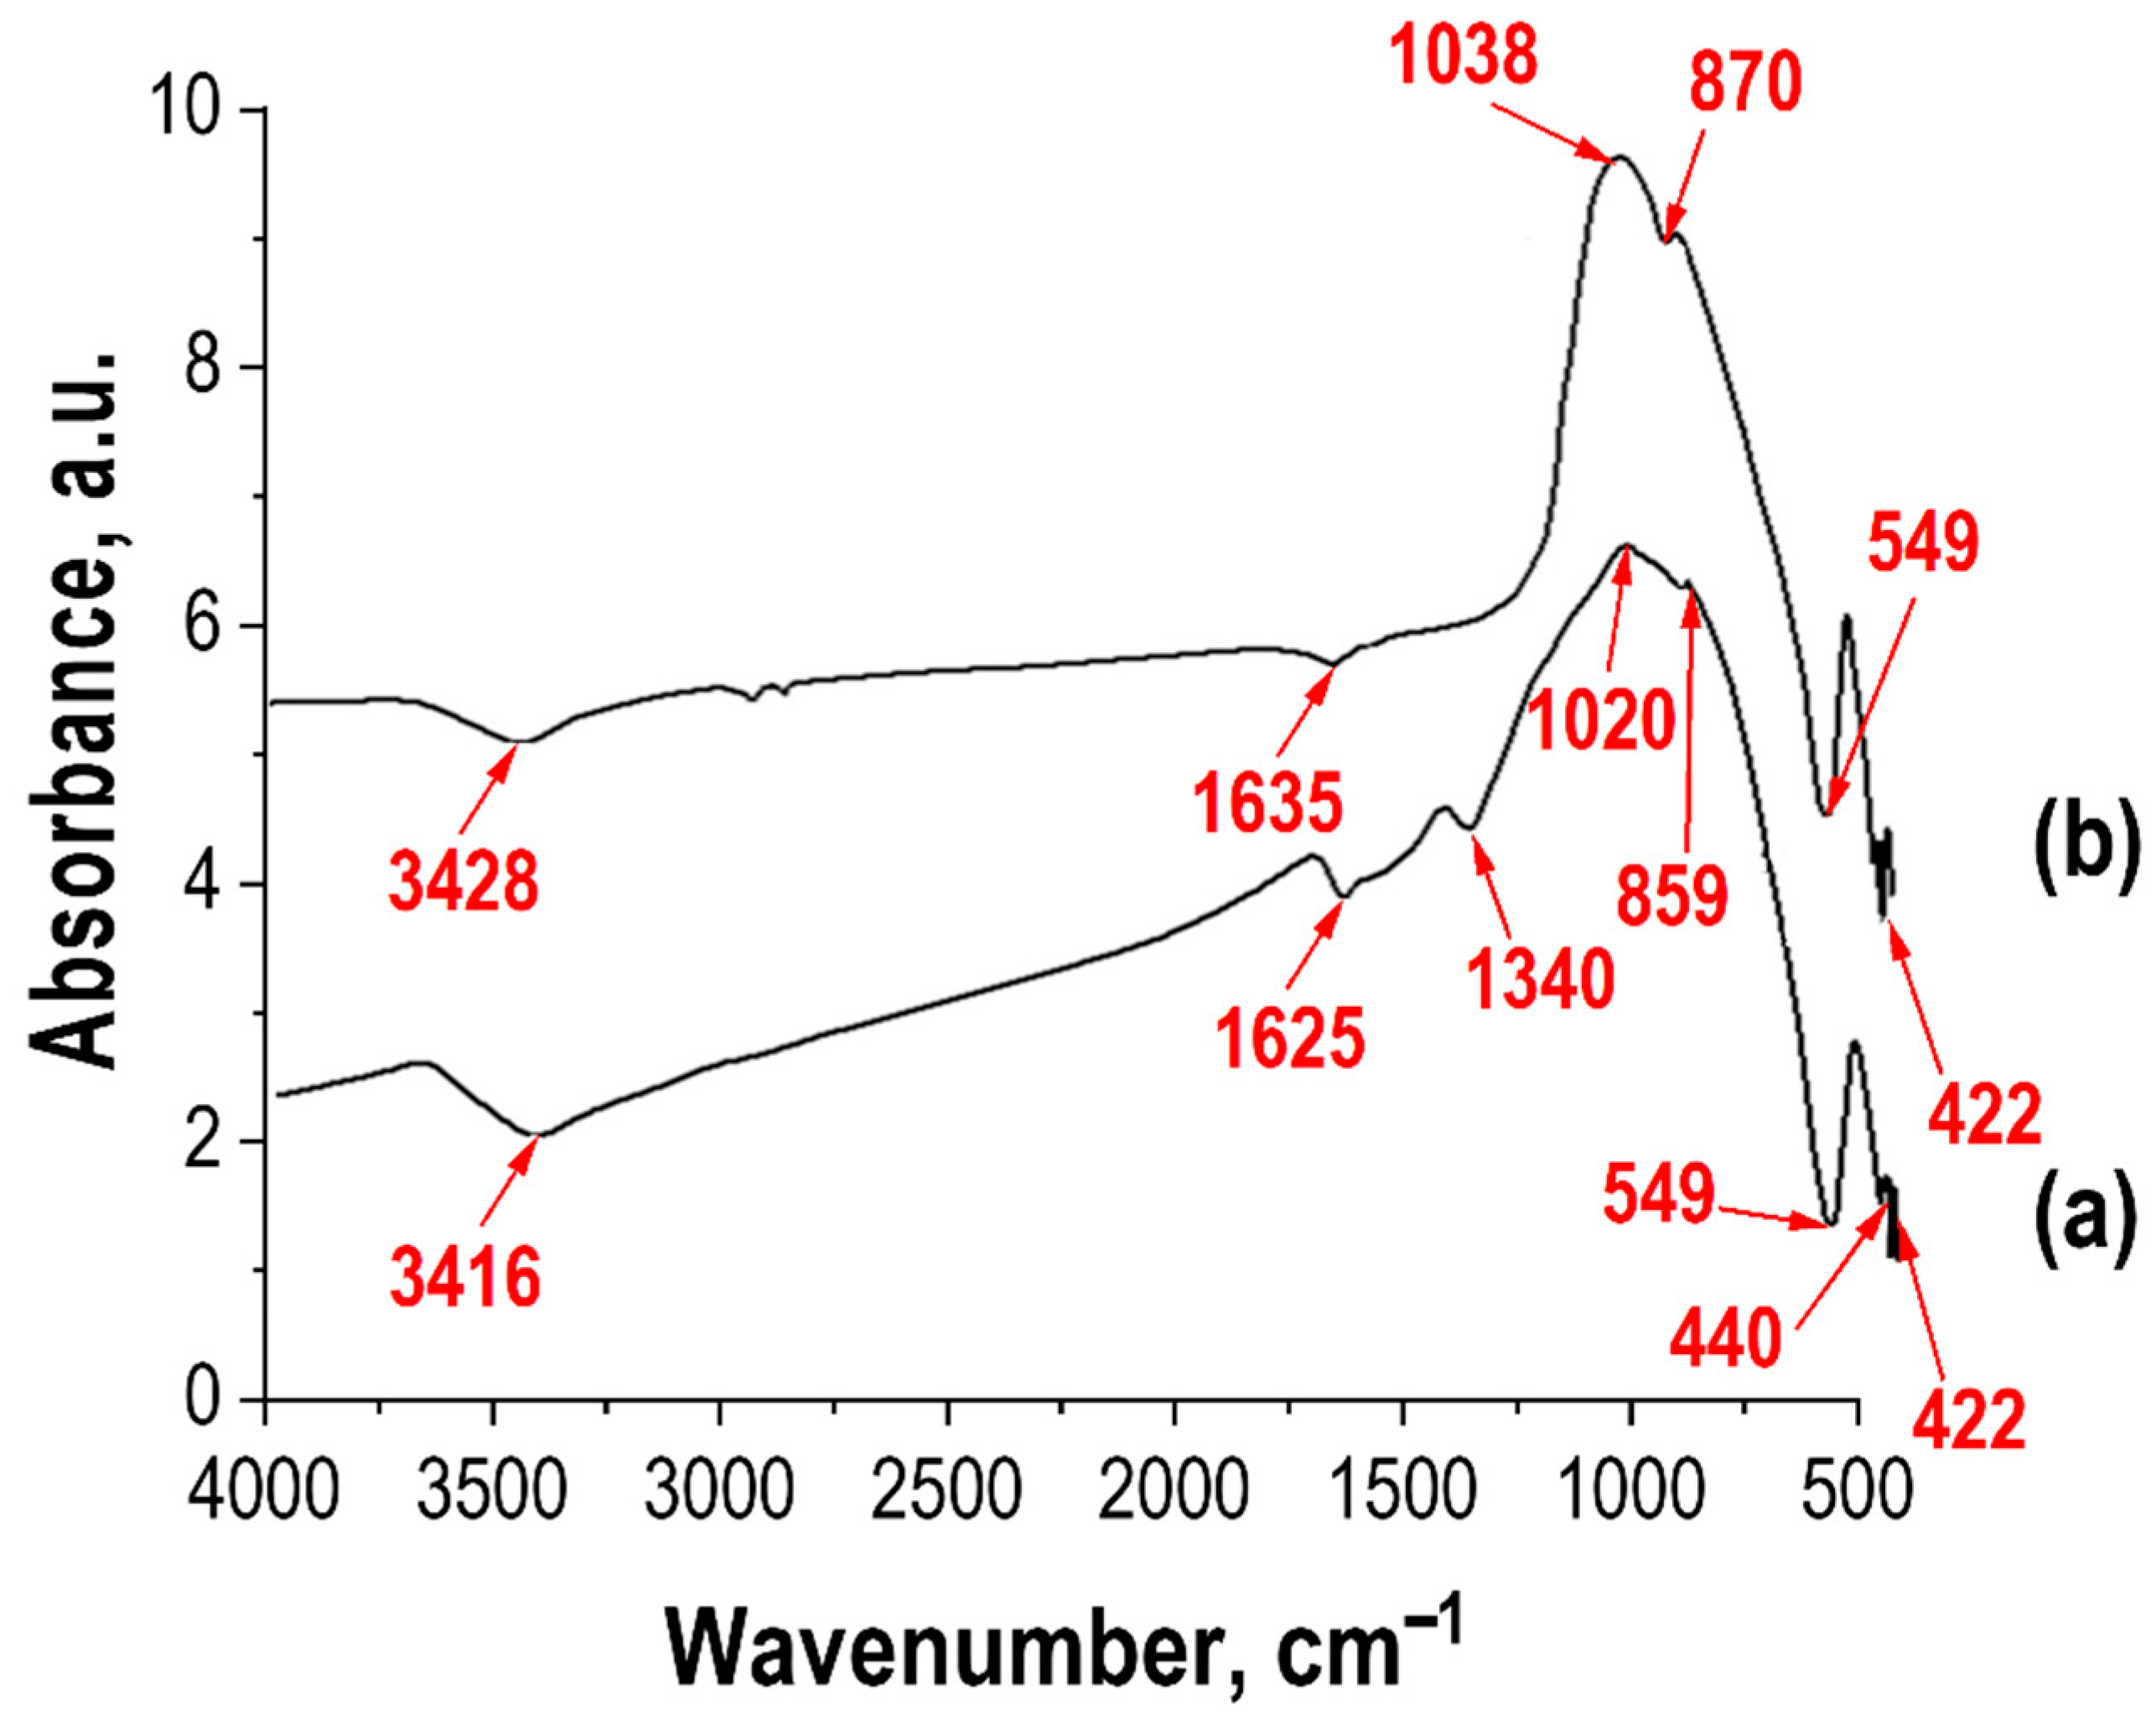
Fourier-transform infrared (FTIR) spectra can be used to determine the crystalline structure and molecular composition of the synthesized zinc ferrite compounds. FTIR studies were conducted on two synthesized samples using different approaches (see
Figure 9). The analysis data (
Figure 9) show that strong absorption peaks appear in the range of 500–1630 cm
−1. The shape of the curves is identical, which may indicate similarity in their compositions. Broad absorption band in the range of 3627–3500 cm
−1 (see
Figure 9) corresponds to the contribution from hydroxyl ions (OH) [
33,
34,
35,
36]. The presence of this band indicates the high surface activity of the ferrite microparticles, which is associated with the presence of broken bonds and, consequently, a high probability of adsorption by hydroxyl ions (OH)
− and H
+ active hydroxyl groups.
The absorption band near ~1630 cm
−1 corresponds to the bending vibrations δ(OH), while the absorption bands at ~859–870 cm
−1 and ~1020–1038 cm
−1 (see
Figure 9) are associated with the bending vibrations of the Zn–O–H and Fe–O–H bonds, respectively. For all ferrite compositions, broad absorption bands are observed in the spectral range from 50 to 1000 cm
−1 (see
Figure 9), which are associated with lattice vibrations of the Fe–O and Zn–O bonds [
36,
37,
38]. The absorption peak near ~550 cm
−1 is characterized by the vibrations of the Fe–O–Zn bonds. Additionally, for the sample synthesized from solutions (see
Figure 9), absorption bands are observed in the region of 1350 cm
−1, which may be attributed not only to the presence of hydroxyl groups but also to adsorbed forms of O
2 and CO
2 due to the developed surface [
39].
Absorption bands in the range of ~420–440 cm
−1 (see
Figure 9) are related to the vibrations of the Fe–O bonds [
40,
41,
42]. To investigate the potential ionic conductivity of zinc cations, a crystallochemical analysis methodology was employed using the ToposPro software package [
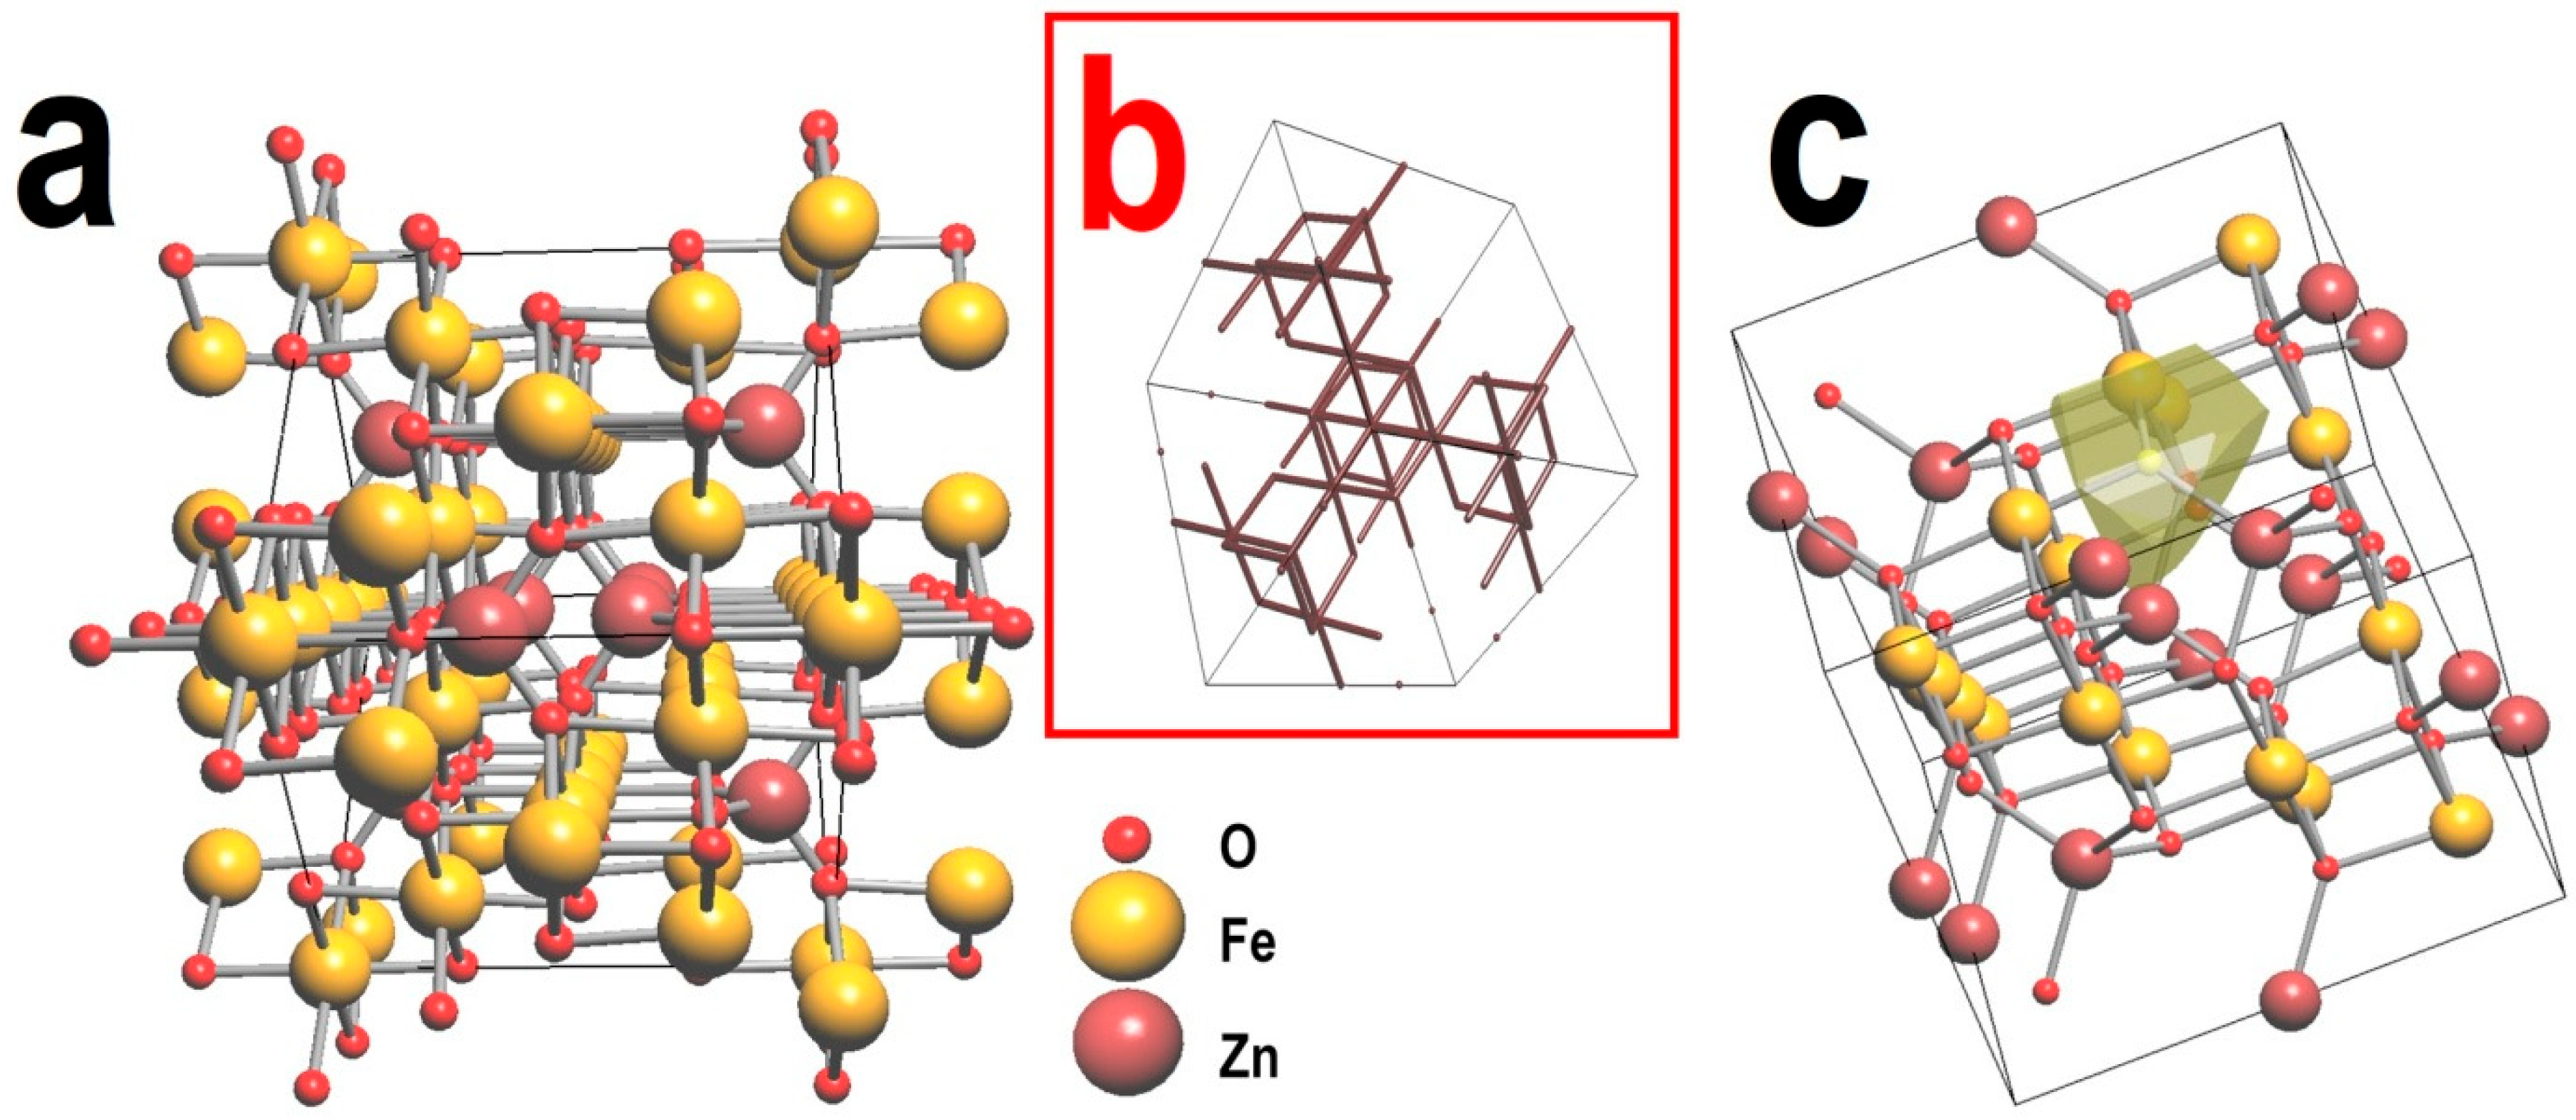
43]. The “free space” within the crystal lattice (see
Figure 10) contains a network of cavities and channels that are geometrically accessible for mobile ions, thus influencing the emergence of ionic conductivity. This study is based on a geometrical-topological (GT) approach, which involves partitioning the crystal space into convex polyhedra, specifically Voronoi polyhedra, which serve as geometric representations of the positions of atoms or cavities within the crystal structure [
44]. A Voronoi polyhedron represents a region of crystal space where planes intersect at the midpoint of contact between a target ion and neighboring ions (see
Figure 10). Each ion within the structure corresponds to its unique Voronoi polyhedron, while the overall structure can be comprehensively represented by the complete set of polyhedra that collectively occupy the crystal space [
44].
The vertices of the Voronoi polyhedra corresponding to the positions of the atoms represent the centroids of fundamental vacancies in the structure. The edges between these vertices denote elementary pathways connecting such vacancies. These vacancies and pathways are characterized by corresponding radii, denoted as Rsd and rchan. The calculation of Rsd involves determining the radius of a sphere whose volume is equal to the volume of the Voronoi polyhedron generated from all atomic positions within the structure. Conversely, rchan is calculated as the radius of the circle inscribed around the edge of the Voronoi polyhedron, representing atomic positions, where all constituent atoms along the trajectory are located on the specified circle.
Fundamental vacancies and pathways are accessible for ionic migration provided that their radii meet specific criteria:
The minimum radial separation distances, denoted as R
sd(min), are presented in tabular form and are typically provided for various ions in reference materials [
45]. Conversely, the minimum channel radius r
chan(min) is calculated by combining the ionic radii of both the working ion (r
wi) and the surrounding ion (r
env) with a deformation coefficient (γ). This calculation takes into account the potential polarizability or deformation of the working ion during its migration:
The complete representation of voids and channels in the crystal structure is achieved when their sizes meet the conditions (9) and (10). Notably, if this migration map demonstrates infinite periodicity in any direction, whether one-dimensional, two-dimensional, or three-dimensional—it indicates that the underlying crystal structure possesses the necessary prerequisites for facilitating ionic conductivity.
Using the ToposPro software, the crystal structure of ZnFe
2O
4 was analyzed for its capability to support ionic conductivity of Zn
2+ cations (see
Figure 10). The parameters for the analysis were selected based on literature data [
45]: Zn
2+ (r
wi = 0.83 Å), R
sd(min) = 1.20, r
chan(min) = 1.60, γ = 0.80. The calculations revealed that the crystal structure of zinc ferrite contains 3D channels for facilitating ionic conductivity of Zn
2+ cations (see
Figure 10).
Based on the results of the TG analysis, electrophysical studies were conducted on the synthesized zinc ferrites ZnFe
2O
4 with a spinel-type structure using impedance spectroscopy. The complex impedance diagrams obtained at room temperature for the compound synthesized by the solid-state method at various temperatures are presented in
Figure 11a.
The appearance of the diagrams for samples synthesized at temperatures of 900 °C and 1000 °C is similar (see
Figure 11a), unlike the sample synthesized at 800 °C, which does not exhibit an inclined line in the low-frequency region (see
Figure 11a). Diagram shapes for samples synthesized at temperatures of 900 °C and 1000 °C are characteristic of ionic conductors, where the low-frequency relaxation process indicates the formation of a double electric layer at the sample-electrode interface.
It is likely that for the sample synthesized at 800 °C, the absence of a low-frequency “tail” on the impedance diagram is related to its considerably higher resistance (compared to the samples obtained at 900 °C and 1000 °C), suggesting that such a low-frequency relaxation process should be observed at even lower frequencies. However, the Matrix MCR-9010 instrument has technical limitations, with a minimum accessible frequency of 10 Hz. Within the Maxwell–Wagner picture, interfacial (grain-boundary/electrode) polarization has a characteristic frequency fc = 1/(2πRiCi). The larger resistance of this specimen shifts the corresponding relaxation below the experimental frequency window, while the bulk arc remains visible. This correlation rationalizes the impedance features without invoking a change in transport mechanism.
The overall equivalent circuit model for the samples synthesized by the solid-state method is depicted in
Figure 11b. This model was chosen due to its alignment with the underlying physical mechanisms and its ability to accurately model the experimental Nyquist plots. The use of a Warburg element is a logical choice when considering the spectral data, as the initial part of the high-frequency range exhibits linearity within a limited interval, characteristic of diffusion-based processes. The resistance R
el characterizes electronic conductivity, while R
ct, C
ct, W
ct characterize the cathode material. The constant phase element CPE
dl is associated with the formation of a double electric layer, which appears as an inclined line on the impedance diagram (see
Figure 11). For the sample synthesized at 800 °C, the CPE
dl element is absent. The impedance Nyquist plots were processed using the EIS Spectrum Analyser software to achieve the most accurate calculation of the parameters of the equivalent circuit model. The obtained impedance dependencies for the investigated samples are extrapolated to the real part of the impedance axis, i.e., in the limit as the frequency of the measuring field approaches zero. The results of such calculations are shown as a line. There is a good correlation between the calculated results and the measured data, with the results of the calculations presented in
Table 4.
Comparing the impedance diagrams presented in
Figure 11, it is evident that increasing the synthesis temperature leads to an increase in the conductivity of the cathode material by almost two orders of magnitude. The values of the specific electronic and ionic conductivities are provided in
Table 5.
The complex impedance diagrams obtained at room temperature for the compounds synthesized by the combined method are presented in
Figure 11c. Their appearance is also characteristic of ionic conductors [
46,
47,
48,
49]. It is evident that the conductivity of the samples synthesized by the combined method (see
Figure 12) has significantly increased compared to the samples obtained by the solid-state method (see
Figure 11c,d). The shape of the Nyquist plots was also modeled using the equivalent circuit model shown in
Figure 11b. The results of the calculations for the obtained data are presented in
Table 6 and are shown in
Figure 11c,d as lines.
For the samples obtained by the combined method, the same trend is observed as for the samples synthesized by the solid-state method. Increasing the synthesis temperature (from 450 °C to 500 °C) leads to an increase in conductivity by nearly an order of magnitude (see
Table 7). Additionally, raising the sintering temperature also results in an increase in conductivity (see
Table 7).
Earlier, a research team conducted a study on zinc ferrite ZnFe
2O
4 with a spinel structure using density functional theory (DFT) [
30]. The results of the quantum-chemical modeling of Zn
2+ ionic conductivity in this compound indicated a theoretical ionic conductivity value of σ = 5 × 10
−6 S/cm [
30]. Our study has shown that the electrophysical properties of ZnFe
2O
4 vary depending on the synthesis conditions and methods. It was found that only two samples obtained by the solid-state method at T = 800 °C and 900 °C exhibited unsatisfactory conductivity (less than theoretical) and are unsuitable for use as cathode materials. However, both methods allow for the production of samples with significantly higher specific ionic conductivity.
Samples obtained by the combined method exhibit higher ionic conductivity compared to those produced by the solid-state method. This is attributed to the fact that synthesis using the sol–gel technique results in compounds with smaller particle sizes and a more developed specific surface area. Additionally, the sintering temperature of the ceramics also influences ionic conductivity—an increase in temperature leads to enhanced conductivity.
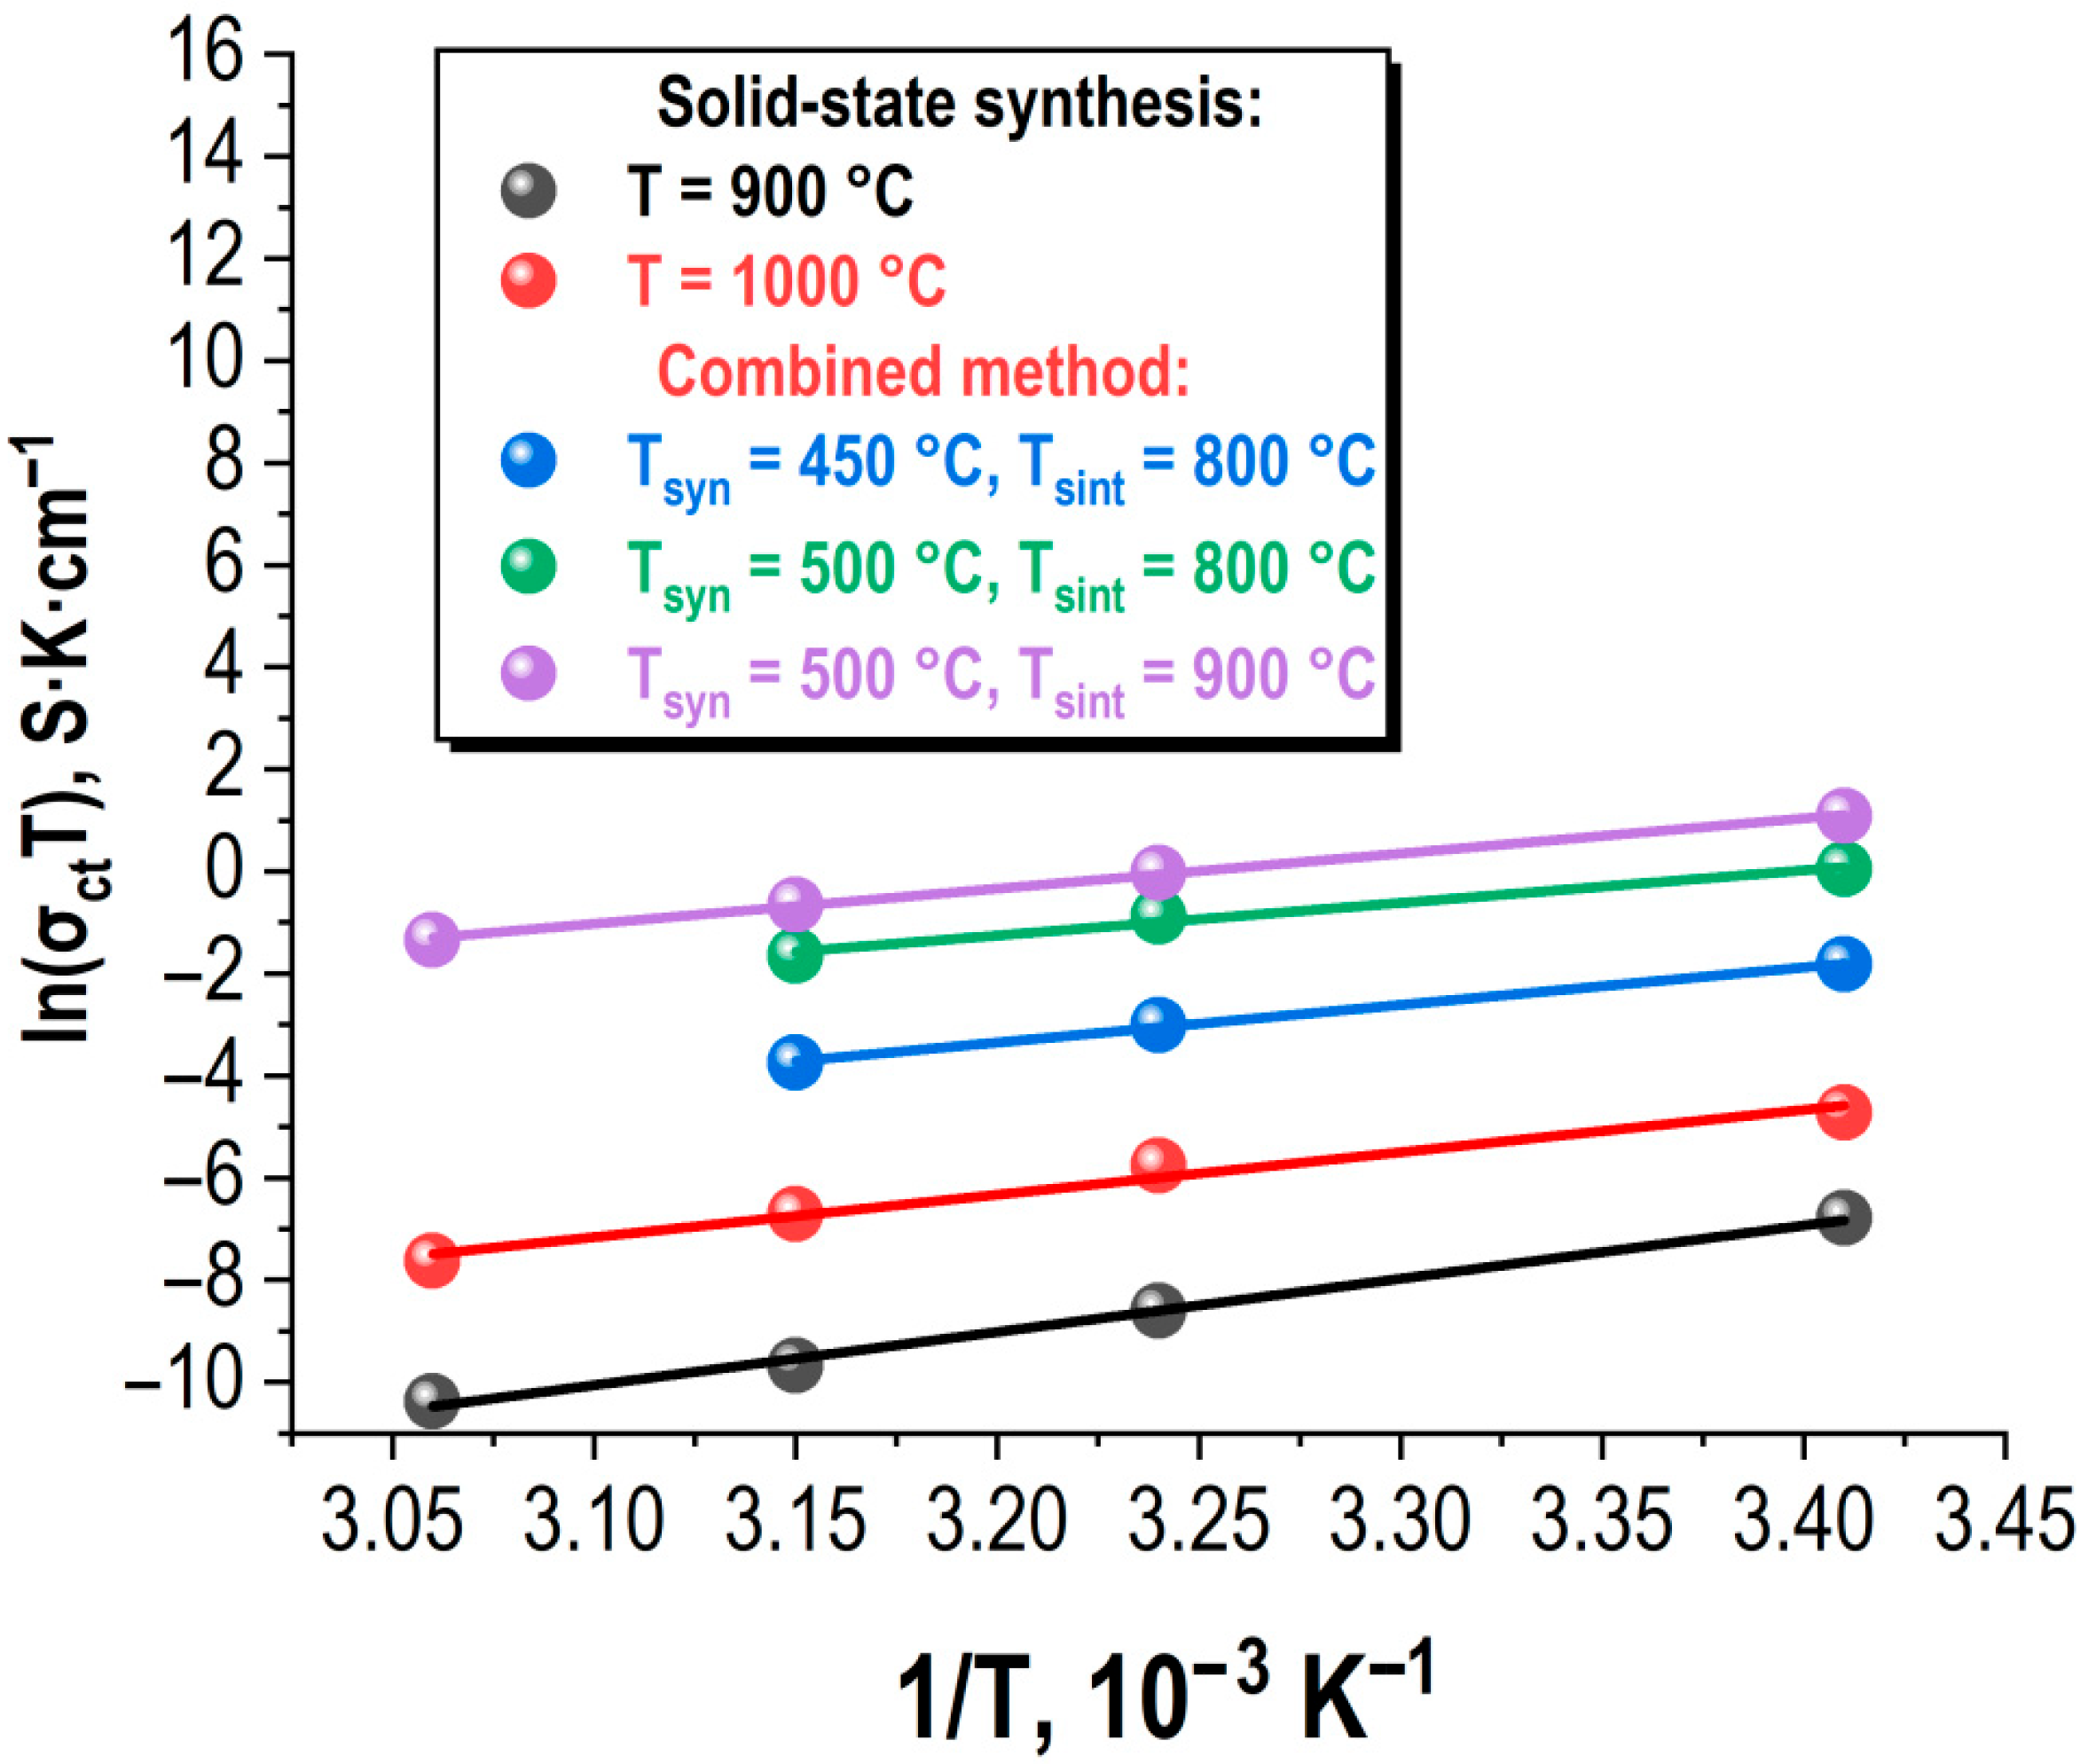
The conducted studies over a practically significant temperature range (20–55 °C) revealed that as the samples are heated, the specific ionic conductivity decreases (see
Figure 12), regardless of the synthesis method and sintering conditions of the ceramics.
The studies were conducted in a stepwise heating mode, followed by stabilization and holding at a specified temperature. The obtained dependencies σ
ct(T) satisfy the Arrhenius law:
where σ
ct is the static specific conductivity of the cathode material, A
0 is the pre-exponential factor, E
a is the activation energy, representing the effective height of the potential barrier that the cation must overcome to hop from a lattice site to a vacancy, k is the Boltzmann constant, and T is the temperature.
From the obtained dependencies, the values of the activation energy of charge carriers were determined, as indicated in
Figure 12. The activation energy values for the compositions synthesized by various methods and under different conditions are similar and fall within the range of approximately 0.8 to 0.85 eV.
The temperature dependence of conductivity is attributed to ionic transport in spinel ZnFe2O4. The activation energies from Arrhenius fits (≈0.80–0.85 eV) fall in the typical range for vacancy-assisted ionic migration in ferrites, indicating that the governing mechanism remains unchanged across synthesis routes. Elemental analysis reveals a slight Zn deficiency (cation non-stoichiometry). In spinel oxides, such non-stoichiometry is commonly compensated by cation vacancies and/or by changes in cation distribution/valence to preserve charge neutrality; for ZnFe2O4 this may include vacancies on the Zn (A) sublattice and/or on octahedral (B) sites together with partial inversion.


