1. Introduction
Acrylic solid surface composite is defined in ISO 19712-2:2007 as a solid surfacing material, composed of polymeric materials, pigments, and fillers, intended to be cast into sheets or shaped into products [
1]. In the literature and technical documents, the material is most often referred to as acrylic solid surface, composed of 35–45% polymethyl methacrylate (PMMA) and 55–65% aluminium trihydrate (Al(OH)
3, ATH). Colourants are also added. One form of ATH is the mineral “gibbsite”, the principal global source of aluminium. These composites are seeing ever-broader use [
2]. Across interior and furniture applications, bending is a dominant service load; therefore, this study focuses on flexural strength (
σf) and flexural modulus (E
f), as well as their density-normalized (‘specific’) counterparts, σ/ρ and E/ρ.
Acrylic solid surface (PMMA/ATH) composites, widely known under the trade name Corian
®, were developed by DuPont
TM, Wilmington, DE, USA, scientist Donald Slocum in 1967 as a durable, non-porous alternative to natural stone, receiving a patent in 1968 and being introduced commercially in 1971 at the National Association of Home Builders meeting [
3]. They were initially developed for laboratory countertops and sinks, but were soon found to have numerous applications in interior design, furniture, and even jewelry.
Leading brands and technical disclosures consistently declare PMMA/ATH composites—e.g., Corian
®, Kerrock
® (Kolpa, Metlika, Slovenia), HI-MACS
® (LX Hausys Ltd., Seoul, Republic of Korea), KRION
® (PORCELANOSA Group, Villarreal, Castellón, Spain), Hanex
® (Hyundai L&C Co., Ltd., Seoul, Republic of Korea), and BetaCryl
® (BTS S.p.A., Lurate Caccivio, Italy), where the mineral functions as a filler in a polymer matrix (PMMA) [
4,
5,
6,
7,
8,
9,
10,
11,
12,
13]. As a class, these materials fall under ISO 19712 for solid surfacing materials, which defines the relevant test methods and sheet-product requirements; across brands, similar composition ranges are reported (e.g., ~35–45% acrylic polymer and ~55–65% ATH), conceptually consistent with the “2/3 ATH + 1/3 PMMA” formulation [
1,
7].
Although manufacturers provide extensive technical data on these materials, there is a lack of independent research comparing some of their characteristics and analysing their properties. There is very little information in the scientific literature about the use of acrylic solid surface materials in furniture. Moreover, while densities vary across brands and lots (1650–1810 kg/m
3), specific properties are rarely reported, which limits fair comparison under mass constraints. Solid surface composite materials can be recycled, albeit at high cost, and reused multiple times, which is a key advantage in terms of the circular economy [
14]. Additionally, recent studies have investigated the combination of acrylic material with wood to produce wood–plastic composites [
15].
Under mass or deflection constraints (e.g., cantilevered worktops, shelves, wall-mounted panels), specific properties (
σ/
ρ,
E/
ρ) become particularly informative. Two dominant scenarios have been described for PMMA/ATH: cracking of ATH agglomerates due to strong adhesion and interfacial debonding resulting from weak adhesion. Both mechanisms influence stiffness and strength in bending, helping to explain the scatter in
σf across brands and lots. Standard flexural tests are reliable for comparative assessment but should not be over-interpreted as “ultimate” strength due to local damage kinematics and micro-porosity formation [
16].
Prior works have examined PMMA/ATH composites using EN 310 [
17] protocols, which complicates direct comparison with the ISO 178 results used here. Jivkov & Elenska-Valchanova showed that veneering 6-mm sheets can raise flexural strength by approximately 7.5%, with no gain in modulus, and reported no thickness effect (6 vs. 12 mm) under EN 310 [
18]. Because EN 310 is designed for wood-based panels with a span-to-thickness ratio of 20:1, in contrast to 16:1 at ISO 178 [
19], and modulus calculation is linear towards secant (ε = 0.0005–0.0025), direct comparison values should be made with caution, and this supports our focus on strength/modulus separation and on method differences.
Temperature-dependent testing on Corian and Staron further indicated that both flexural strength and modulus drop with increasing temperature from 20 °C up to 160 °C [
20]. The tests were also conducted in accordance with EN 310. This motivates the thermoforming-relevant heating/cooling experiments and the post-cooling reassessment of properties, as per ISO 178, in this study.
Filler-content studies consistently find modulus increases with ATH loading, while strength is governed by matrix continuity/defects and particle effects [
21,
22]. Aruniit et al. examined ATH content (55–65%) in a polyester-based solid surface composite (isophthalic acid and neopentyl glycol), not in PMMA/ATH [
21]. They found that increasing filler content lowers flexural strength (the pure resin is 2.3 times stronger than the composite), while stiffness increases with filler content. Particle size and surface treatment likely modulate this trend. In this study, it is reported that flexural moduli exceed typical Corian values, and the cited Corian data span a wide range and lack provenance, so cross-study comparisons should be made cautiously. The authors also note cost reductions with higher filler loadings (−3.5% for +5% ATH; −7.5% for +10% ATH).
Zhang reported that in PMMA/ATH solid surface composites, the elastic modulus increases with filler content, while particle diameter has little effect on modulus [
22]. Because the reinforcing action of ATH is offset by agglomeration-induced weakening, higher filler levels produce only minimal gains in strength. By contrast, a larger particle diameter reduces flexural strength.
Another study assessed 6-mm acrylic solid surface bonds to five substrates (laminated/unlaminated particleboard, plywood, MDF, foamed PVC) using three adhesives—1-component polyurethane, rubber-based, and PVAc—per EN 205 [
23,
24]. The adhesive and substrate significantly affected the tensile-shear strength. The rubber-based adhesive on plywood performed best, and wood-based substrates outperformed the others overall. For PVAc with wood-based adherends, a non-EN 205 method is recommended for fair evaluation.
Brand-comparative data, including LG HI-MACS, Corian, and Tristone, report density varied from 1650 kg/m
3 (LG Hi-macs) to 1780 kg/m
3 (Corian) and 1800 kg/m
3 (Tristone), and flexural strength from 68 MPa for LG Hi-MACS to 70 MPa for Tristone and 75 MPa for Corian, but lack statistical descriptors, limiting interpretability [
25].
Based on a review of the technical documentation of key manufacturers of PMMA/ATH, the average density is approximately 1730 kg/m3, ranging from 1680 kg/m3 (Kerrock—Kolpa), 1700 kg/m3 (Corian—Du Pont) to 1810 kg/m3 (Hanex—Hyundai L&C). The flexural strength ranges from 64 to 73 MPa (average: 68.9 MPa), with a maximum value of 73 MPa in Krion (Porcelanosa Grupo). The flexural modulus has an average of 8900 MPa and reaches 10,800 MPa for Hanex.
Solid surface composites (PMMA/ATH) exhibit a measurable sensitivity to thermal exposure. It is well known that within the particulate composite microstructure, a microstress exists associated with the coefficient of thermal elongation (CTE) mismatch between the matrix and the particles, which is believed to have a significant influence on the viscoplastic behaviour of composites [
16]. The response depends on the regime and glass transition temperature (T
g). Short-time sub-T
g annealing, prolonged thermal/moisture ageing, rapid hot–cold cycling, and freeze–thaw) and on the quality of the matrix–filler interface. Fine ATH dispersion and surface modification tend to stabilise the thermo-mechanical response, whereas unbalanced cycling and long exposure cause a reduction in flexural strength [
26,
27].
PMMA is an amorphous polymer; a typical T
g is 100–110 °C (depends on molecular weight, plasticisers, moisture, and fillers such as ATH). Short annealing slightly below T
g can relax residual stresses and stabilise the flexural response; above T
g, the modulus decreases and the risk of unwanted deformation increases [
28].
A submicron ATH dispersion (e.g., via bead milling), combined with suitable surface chemistry, has been shown to enhance thermal stability and improve the mechanical performance of PMMA/ATH. These effects are commonly attributed to the relaxation of residual stresses and a more robust flexural response [
26]. At the matrix level, PMMA exhibits a pronounced temperature-dependent transition from quasi-brittle to highly ductile behaviour in the 20–80 °C range, which explains why moderate sub-T
g annealing can homogenize the flexural response, whereas heating close to or above T
g leads to softening [
27].
Stress whitening in thermoformed acrylic composites was studied through an experimental procedure developed for the conventional in situ heavy-gage thermoforming process [
29]. They found that the density and size of deformation features yield different levels of stress whitening in thermoformed PMMA/ATH samples.
For facade-grade PMMA/ATH panels subjected to elevated temperatures and humidity, studies report a noticeable decrease in flexural strength, accompanied by a moderate drop in modulus—an important consideration for outdoor applications [
28]. After 300 cycles according to ASTM C666 (Standard Test Method for Resistance of Concrete to Rapid Freezing and Thawing) [
30] and subsequent testing to ASTM D790 (Standard Test Methods for Flexural Properties of Unreinforced and Reinforced Plastics and Electrical Insulating Materials) [
31], no visible surface damage was observed. However, the flexural strength decreased significantly (e.g., ~58 MPa → ~46 MPa for a specific formulation/colour), underscoring the need for mechanical, not only visual, verification after environmental cycling [
32].
Glassy polymers exhibit a well-known tension–compression asymmetry. Tensile loading tends to promote crazing, whereas compression favors shear yielding, leading to different yield stresses and failure morphologies [
33].
The mechanical response of PMMA is strongly strain-rate and temperature-dependent, with higher strain rates and lower temperatures increasing strength and modulus, and elevated temperatures (approaching Tg) softening the material. This has been quantified in uniaxial and flexural tests on PMMA, as well as in studies on filled PMMA systems relevant to PMMA/ATH [
27].
Several important gaps can be identified in the current knowledge base. Independent data on the physical and mechanical properties of acrylic solid surface (PMMA/ATH) composites are relatively limited in peer-reviewed sources. For some materials, contradictory results are reported, and specific studies lack sufficient methodological detail. Methodological divergence further limits comparability, as furniture-oriented studies often employ EN 310, while manufacturers typically rely on ISO 178/ASTM D790. In addition, the technical data disclosed by manufacturers varies considerably between brands or is absent altogether (e.g., BetaCryl). Specific properties (σ/ρ, E/ρ) are rarely reported, despite the brand-to-brand variation in density and the frequent presence of mass or deflection constraints in applications. Finally, systematic data on the effect of thermoforming-relevant heating on flexural strength and elastic modulus are lacking.
The study aimed to investigate the physical and mechanical properties of commercial acrylic solid surface (PMMA/ATH) composite available on the market, identifying a correlation between physical and mechanical properties and the strength characteristics of the material, and evaluating the effect of thermal treatment on flexural strength, strain, and modulus in PMMA/ATH composites.
3. Results
3.1. Physical Properties of PMMA/ATH Composites
In the present study, the primary property investigated is density (ρ), as it reflects the material’s composition and correlates with mechanical performance. Thickness is also critical for designers, prefabricators, and installers; therefore, deviations from the nominal thickness must be accounted for in design and quality control.
3.1.1. Density
Data on the density of the studied PMMA/ATH composites are given in
Table 3. Across the investigated PMMA/ATH composites, the mean density ranges from 1680 to 1748 kg/m
3 (Δ = 4.04%). In 11 series with a total of
n = 190 tests, the average densities are strongly clustered around 1690–1740 kg/m
3, with a weighted average (by sample volume) of 1712 kg/m
3. The range of mean values is 1680–1748 kg/m
3 (lowest at 3_Lu8: 1680 kg/m
3, highest at 8_Co6: 1748 kg/m
3), and the interquartile range for the averages is approximately 1697–1728 kg/m
3. Intragroup variability is low: typically, SD = 3–11 kg/m
3 with coefficient of variation (CV) = 0.2–0.6%; only 3_Lu8 shows greater dispersion (SD = 25.3 kg/m
3, CV = 1.5%). Extreme individual observations range from 1635 kg/m
3 (minimum at 3_Lu8) to 1756 kg/m
3 (maximum at 17_Ke12_8101), but do not change the overall picture of a compact distribution around 1712 kg/m
3. These results confirm good homogeneity between the series and consistency with the expected density for PMMA/ATH solid surface materials, as well as the lower density of materials with higher translucency.
By thickness, a clear but moderate trend is observed: 6 mm > 12 mm > 8 mm. The weighted means are 1731.56 kg/m
3 (95% CI 1725.83–1737.28) for 6 mm, 1712.72 kg/m
3 (95% CI 1709.10–1716.33) for 12 mm, and 1688.58 kg/m
3 (95% CI 1681.71–1695.46) for 8 mm (
Table 4). The differences are approximately 19 kg/m
3 between 6 and 12 mm (1.1%) and approximately 24 kg/m
3 between 12 and 8 mm (1.4%); the 95% confidence intervals for 6 and 12 mm do not overlap. Tukey’s HSD analysis of the differences between the groups with a 95% confidence interval reveals statistically significant differences between the mean values of the three compared groups, indicating that density varies with thickness.
At fixed thickness, statistically significant between-manufacturer differences are present. For 6 mm, Corian shows a higher mean density than Kerrock (+31.8 kg/m3, 95% CI 26.7–36.9, p < 0.001). For 8 mm, Kerrock exceeds Lumino (+17.3 kg/m3, 95% CI 5.2–29.4, p = 0.0049), with Lumino also displaying appreciably higher within-group variability (SD ≈ 25 kg/m3). For 12 mm, BetaCryl has a lower mean density than Corian (−11.6 kg/m3, p = 0.0083) and Kerrock (−7.3 kg/m3, p = 0.0019), whereas the Corian–Kerrock difference is not statistically significant (+4.3 kg/m3, p = 0.374).
3.1.2. Thickness
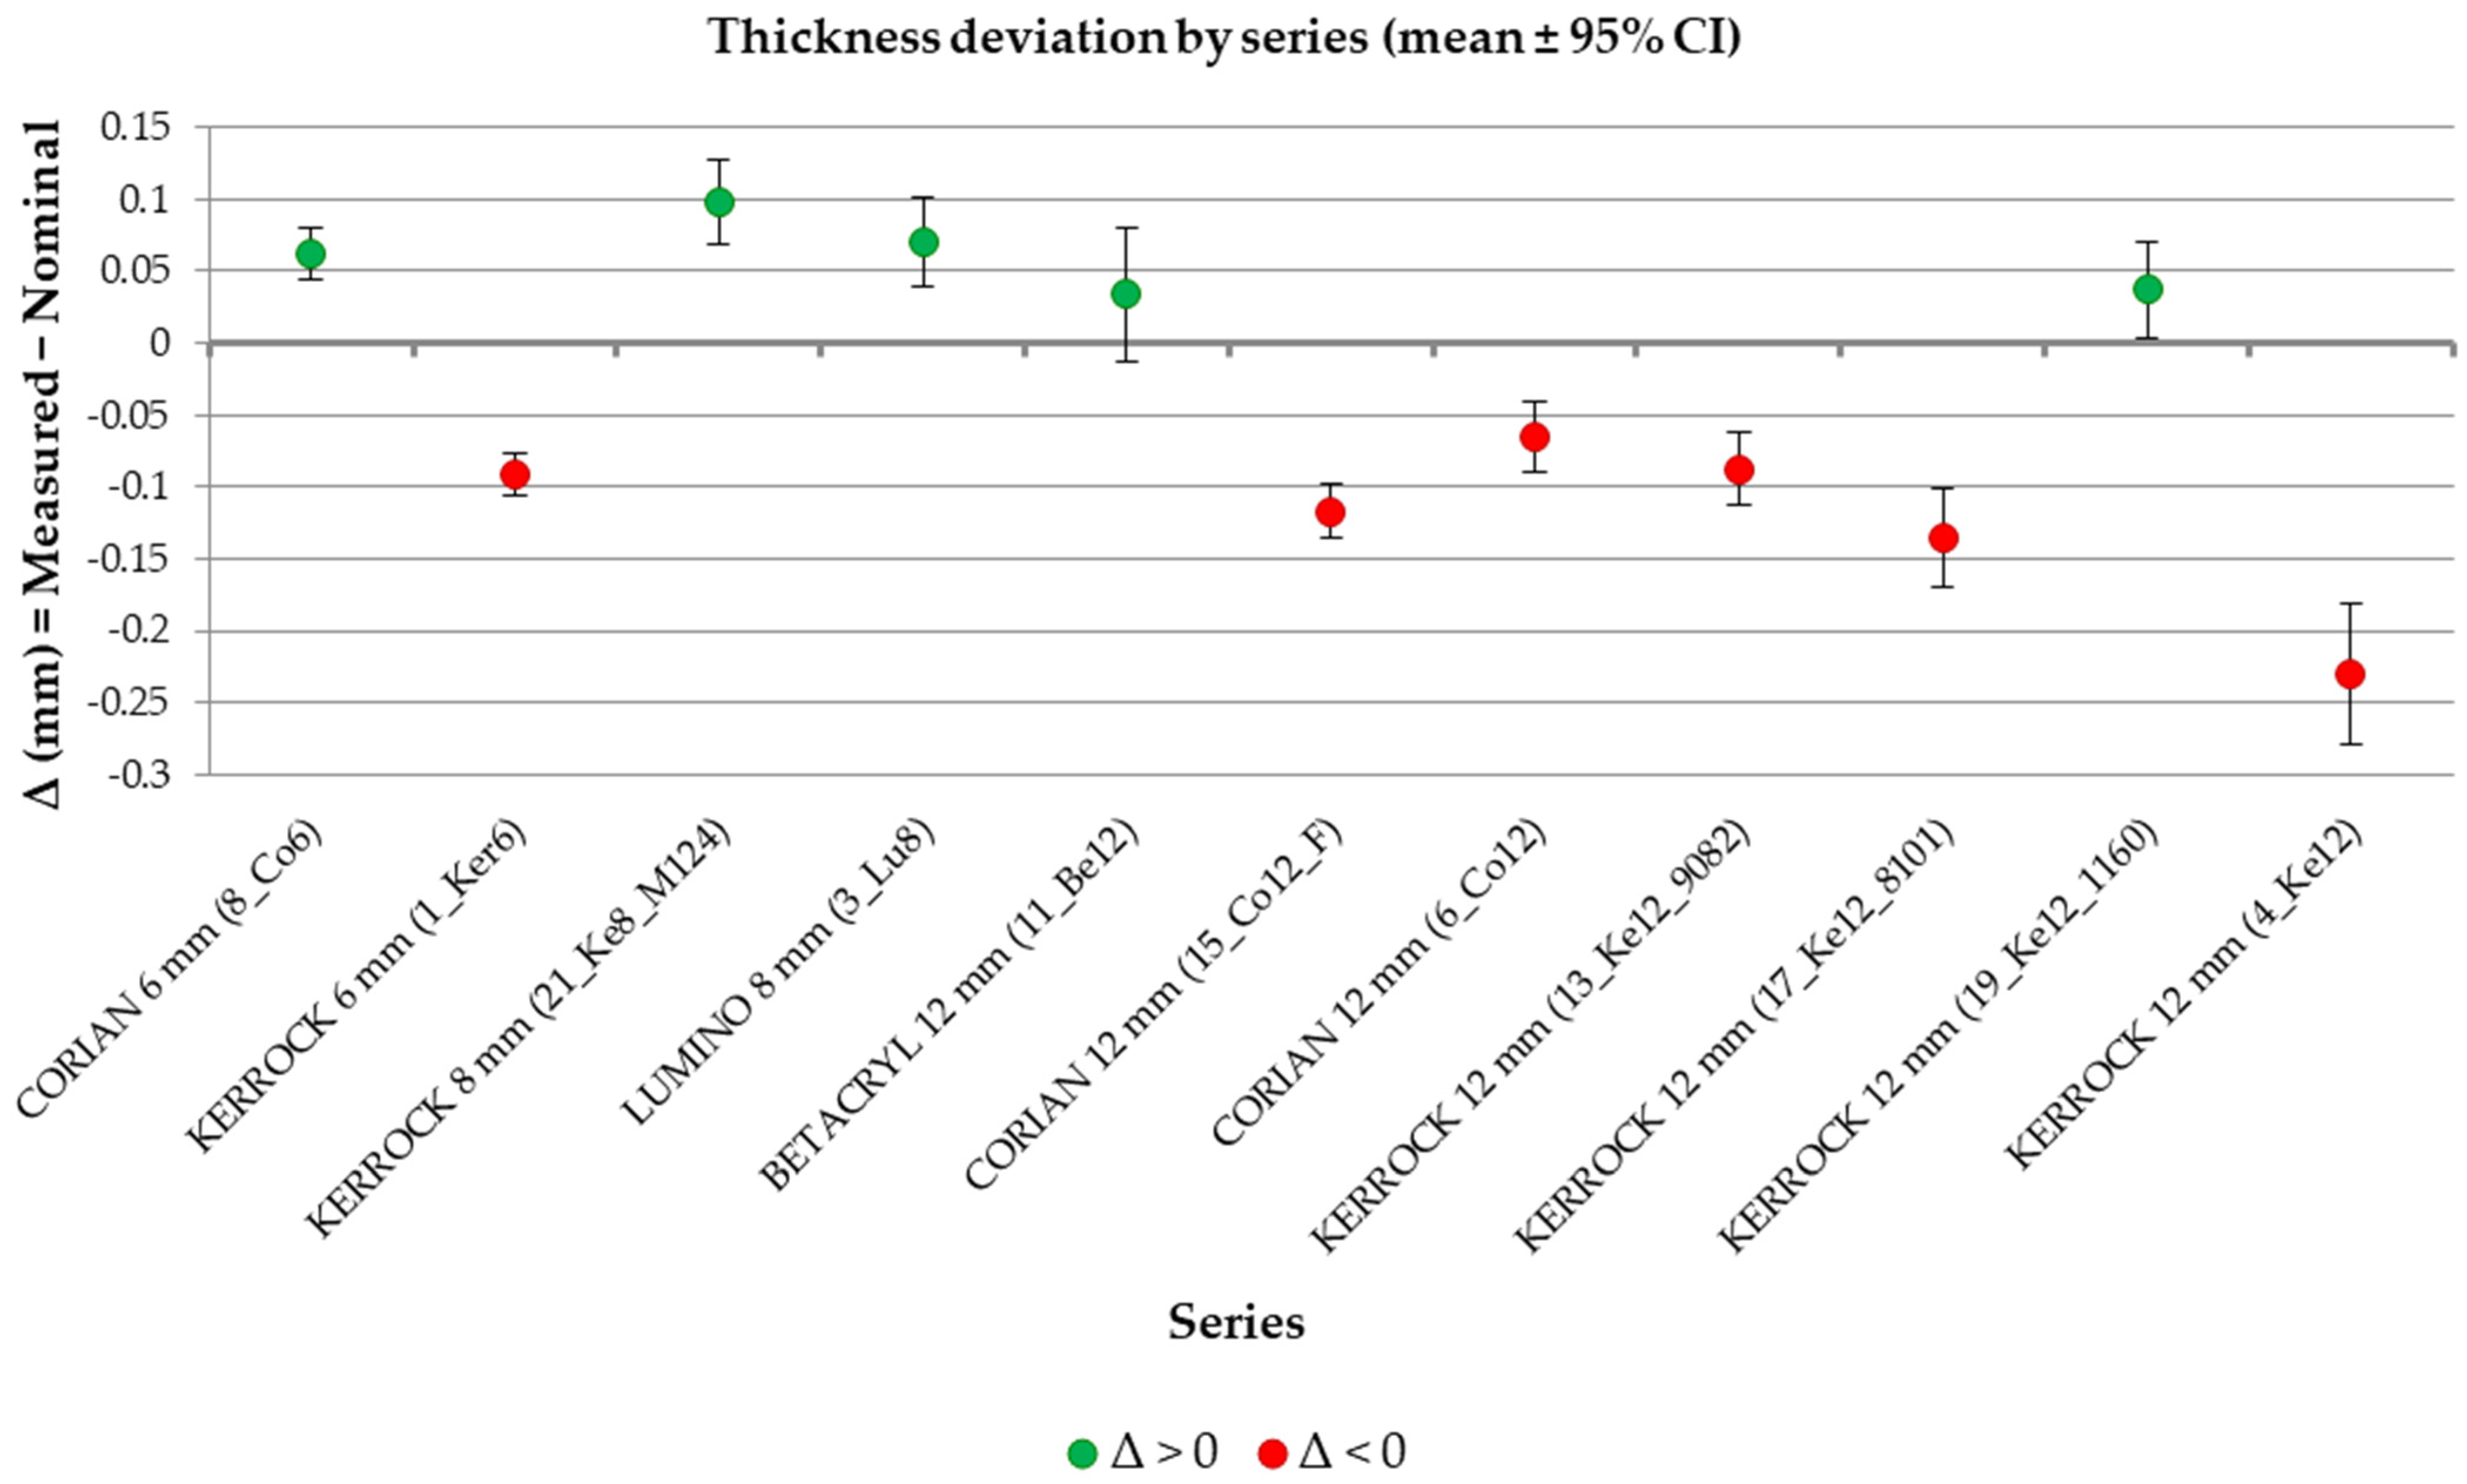
Across all series, measured thickness closely tracks the nominal values with minor, systematic deviations. In
Figure 3, the mean thickness deviation (measured − nominal) by series with 95% CI is given. Green markers indicate values above nominal (thicker), red markers indicate values below nominal (thinner). The 0-mm baseline denotes the nominal thickness. At 6 mm, Corian is slightly above nominal (+0.062 ± 0.018 mm), while Kerrock is slightly below (−0.091 ± 0.015 mm). At 8 mm, both series are marginally above nominal (Kerrock + 0.098 ± 0.030 mm, Lumino + 0.071 ± 0.031 mm). At 12 mm, most series are very close to the nominal value with narrow confidence bands: Corian ranges from −0.117 ± 0.019 mm (Fossil) to −0.066 ± 0.025 mm, while BetaCryl is slightly above (+0.034 ± 0.046 mm). In comparison, Kerrock spans from −0.229 ± 0.049 mm to +0.037 ± 0.033 mm depending on formulation. These deviations, on the order of 0.05–0.23 mm, are practically minor and consistent, supporting the use of measured thickness with the reported 95% CIs for design and tolerance analyses.
The mean percentage deviation of thickness from the nominal value across the series ranges from −1.90% to +1.22%, with most values within ±1%. At 6 mm, Corian is thicker than nominal (+1.03% ± 0.30%), whereas Kerrock is thinner (−1.51% ± 0.25%). At 8 mm, both series lie slightly above nominal (+0.89% ± 0.39%; Kerrock: +1.22% ± 0.38%). At 12 mm, minor negative deviations predominate: Corian Glacier White (−0.55% ± 0.21%), Corian Fossil (−0.97% ± 0.16%), Kerrock108 Snow white (−1.90% ± 0.40%), Kerrock Leucite 9082 (−0.73% ± 0.22%), and Kerrock Strontianite 8101 (−1.12% ± 0.28%), while BetaCryl Flex 100 Classic White (+0.28% ± 0.38%) and Kerrock Venetian terrazzo 1160 (+0.31% ± 0.28%) are very close to nominal (CIs include zero).
Overall, the data indicate small but systematic manufacturer- and thickness-dependent differences: 6- and 8-mm sheets tend to be slightly above the nominal value, whereas 12-mm sheets are mostly below. When not otherwise specified by the supplier, thickness tolerances for solid surface sheets follow ISO 19712-1 (±0.25 mm for 3–4 mm; ±0.30 mm for 4.5–5 mm; >5 mm by agreement). All deviations obtained in this study fall within the range of the tolerances of the thinnest sheets (4 mm) according to the standard. Representative manufacturer data of DuPont Corian
® allow tolerances for 12 mm: 11.4–12.6 mm (±0.6); within-sheet ≤ 0.8 mm) and for 6 mm: 5.6–7.0 mm and within-sheet max 0.8 mm [
36]. Kerrock declares for 12 mm sheets: a thickness tolerance of −0.3/+0.2 mm, and the maximum deviation within one sheet is 0.3 mm [
5].
3.2. Flexural Strength of PMMA/ATH Composites
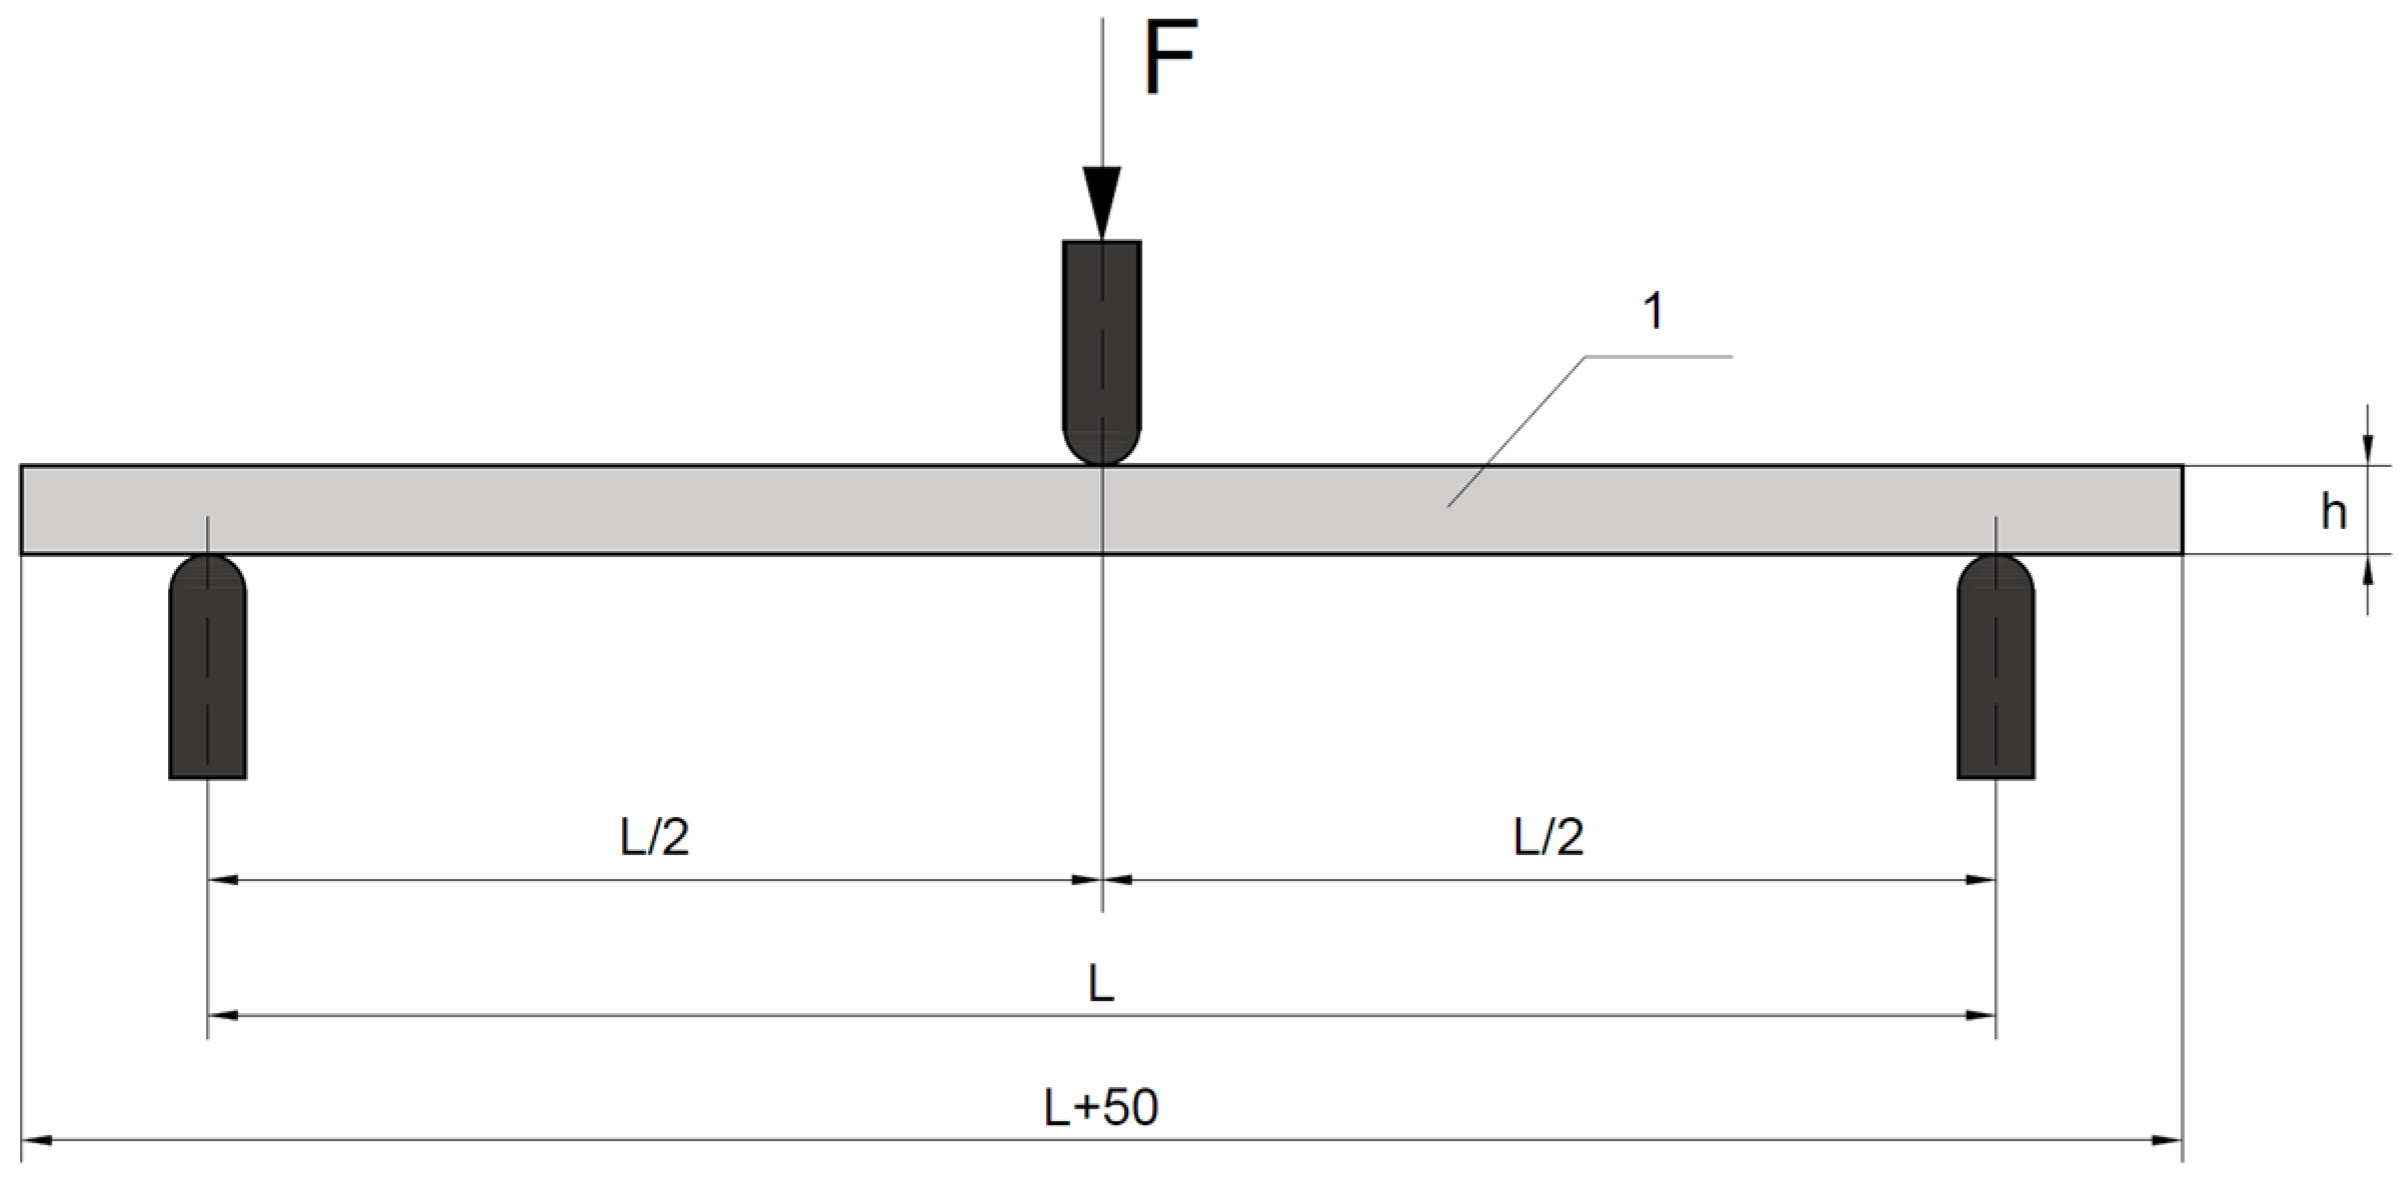
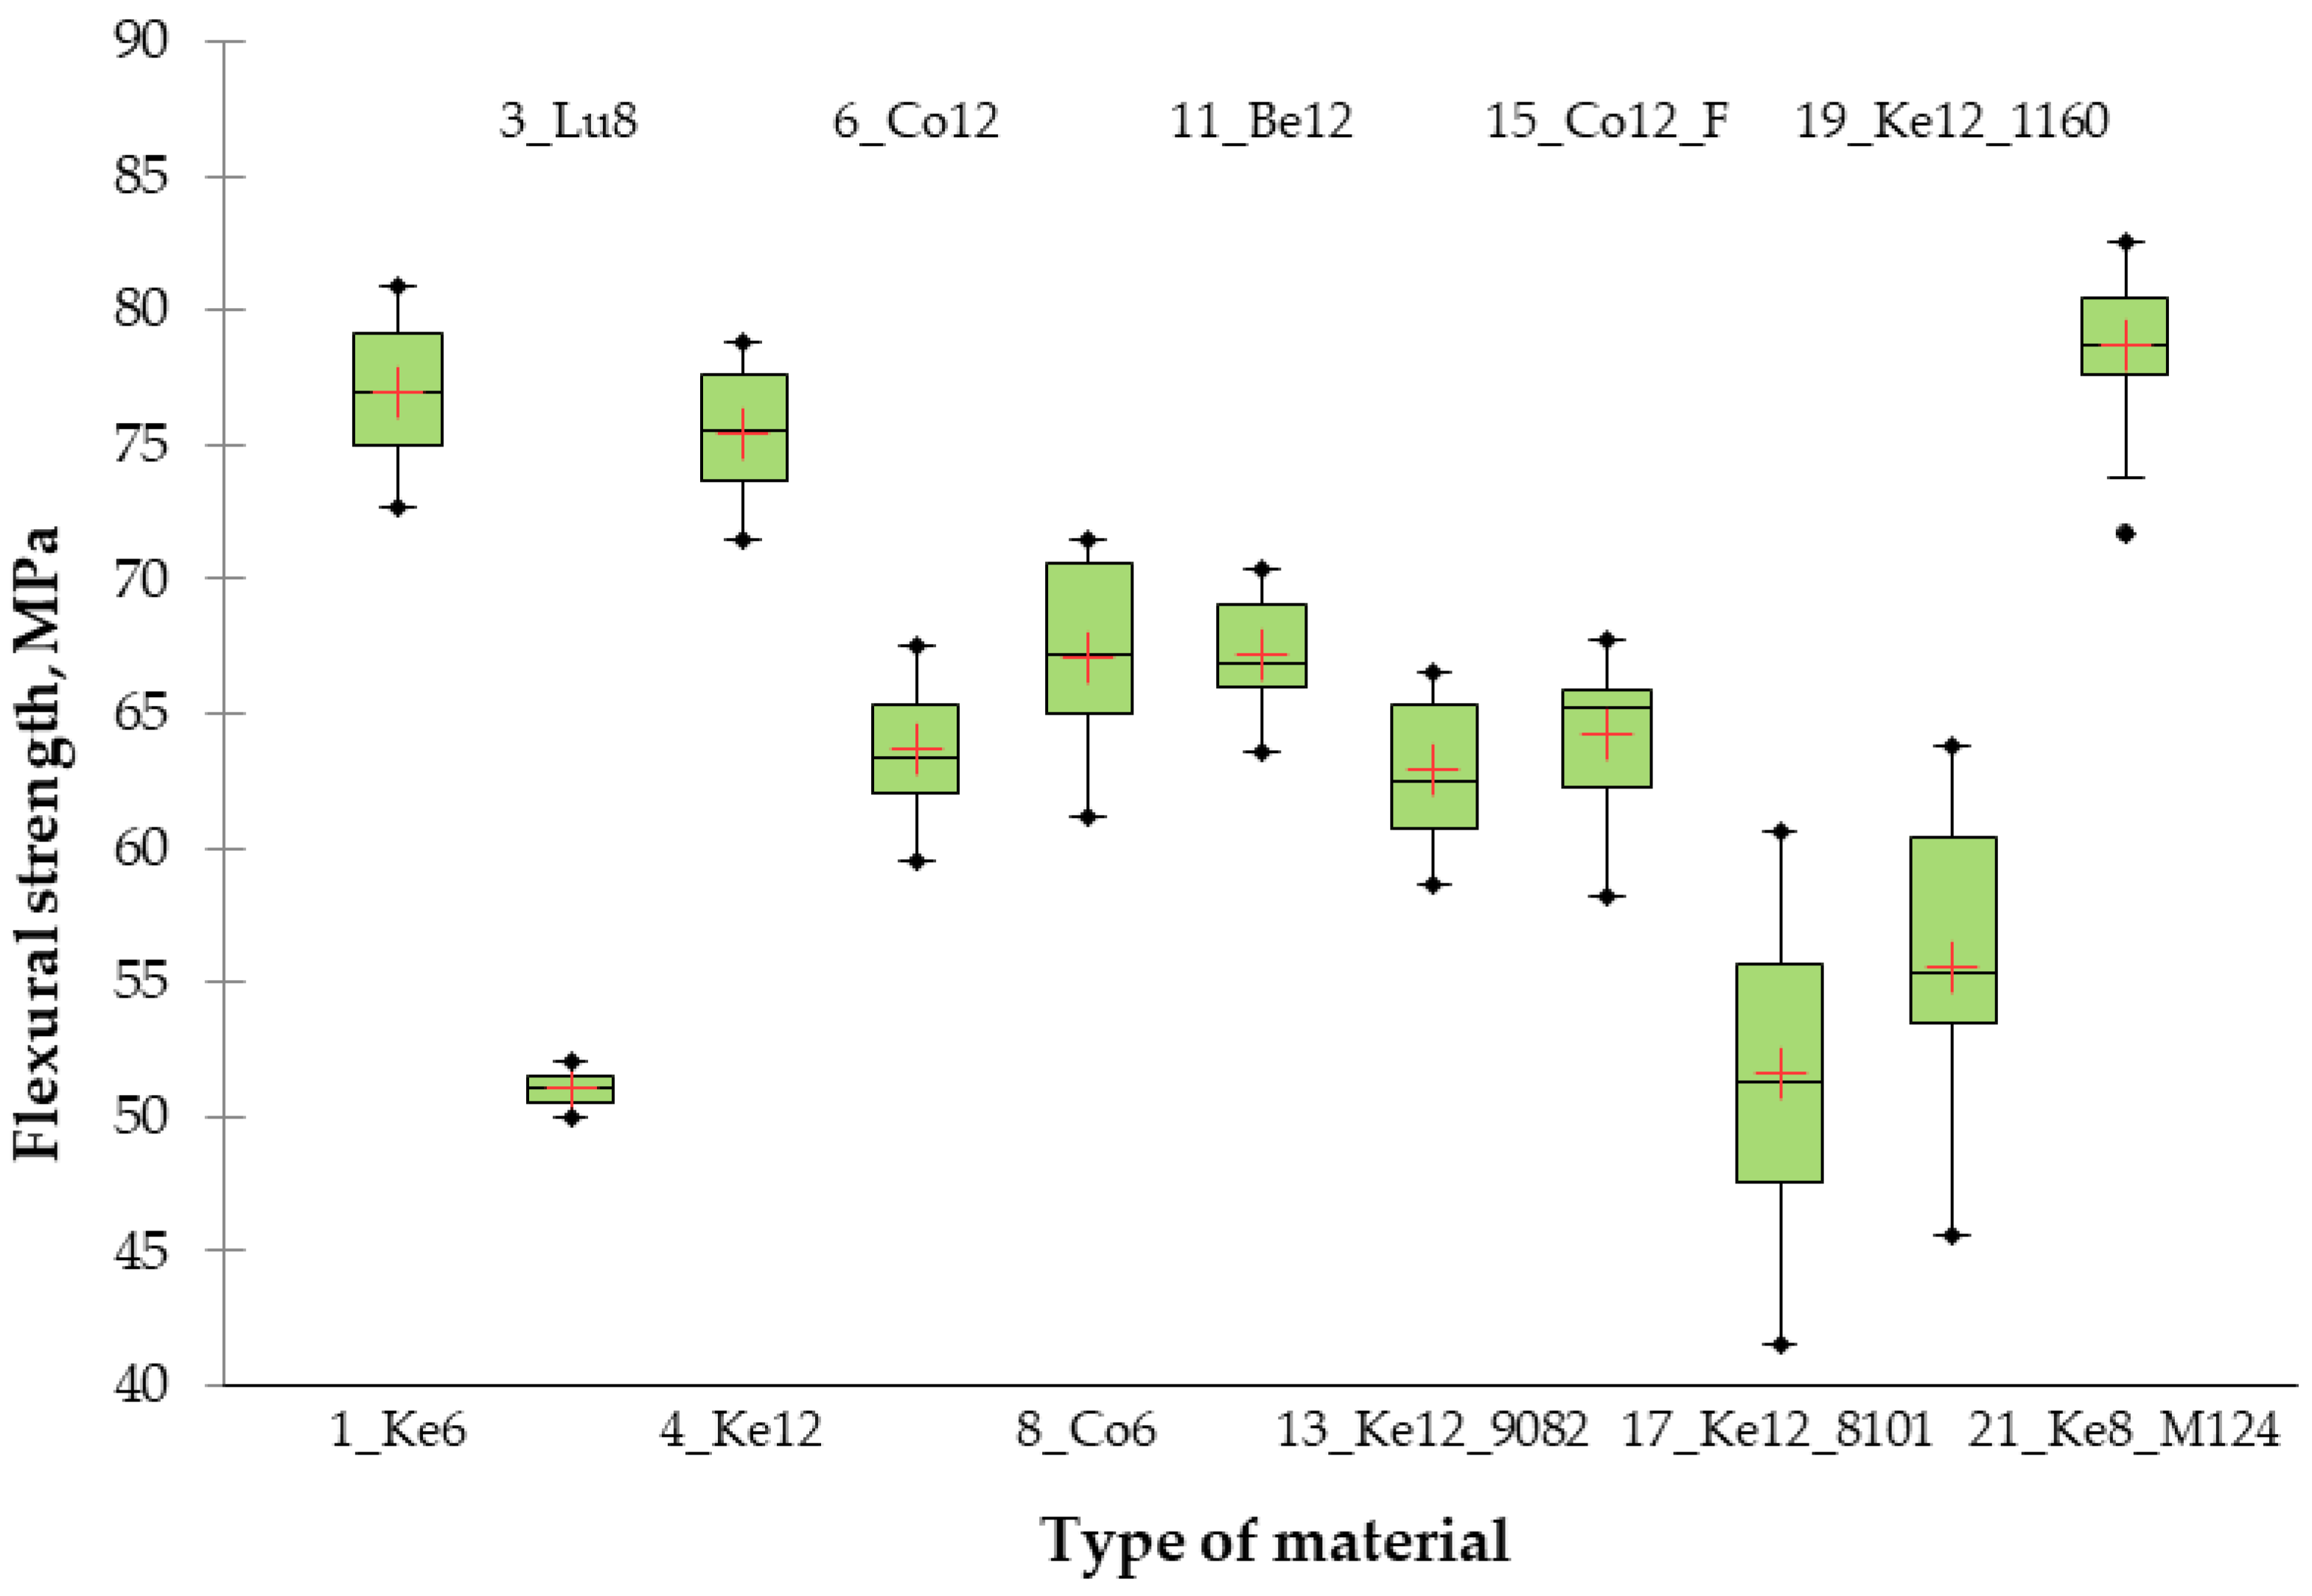
The results from the test for the evaluation of
σf of PMMA/ATH composites are given graphically in
Figure 4.
Table 5 presents the Tukey’s HSD analysis of the differences between groups, with a 95% confidence interval, for all pairwise comparisons of the
σf of PMMA/ATH composites. The composites are ranked in descending order of
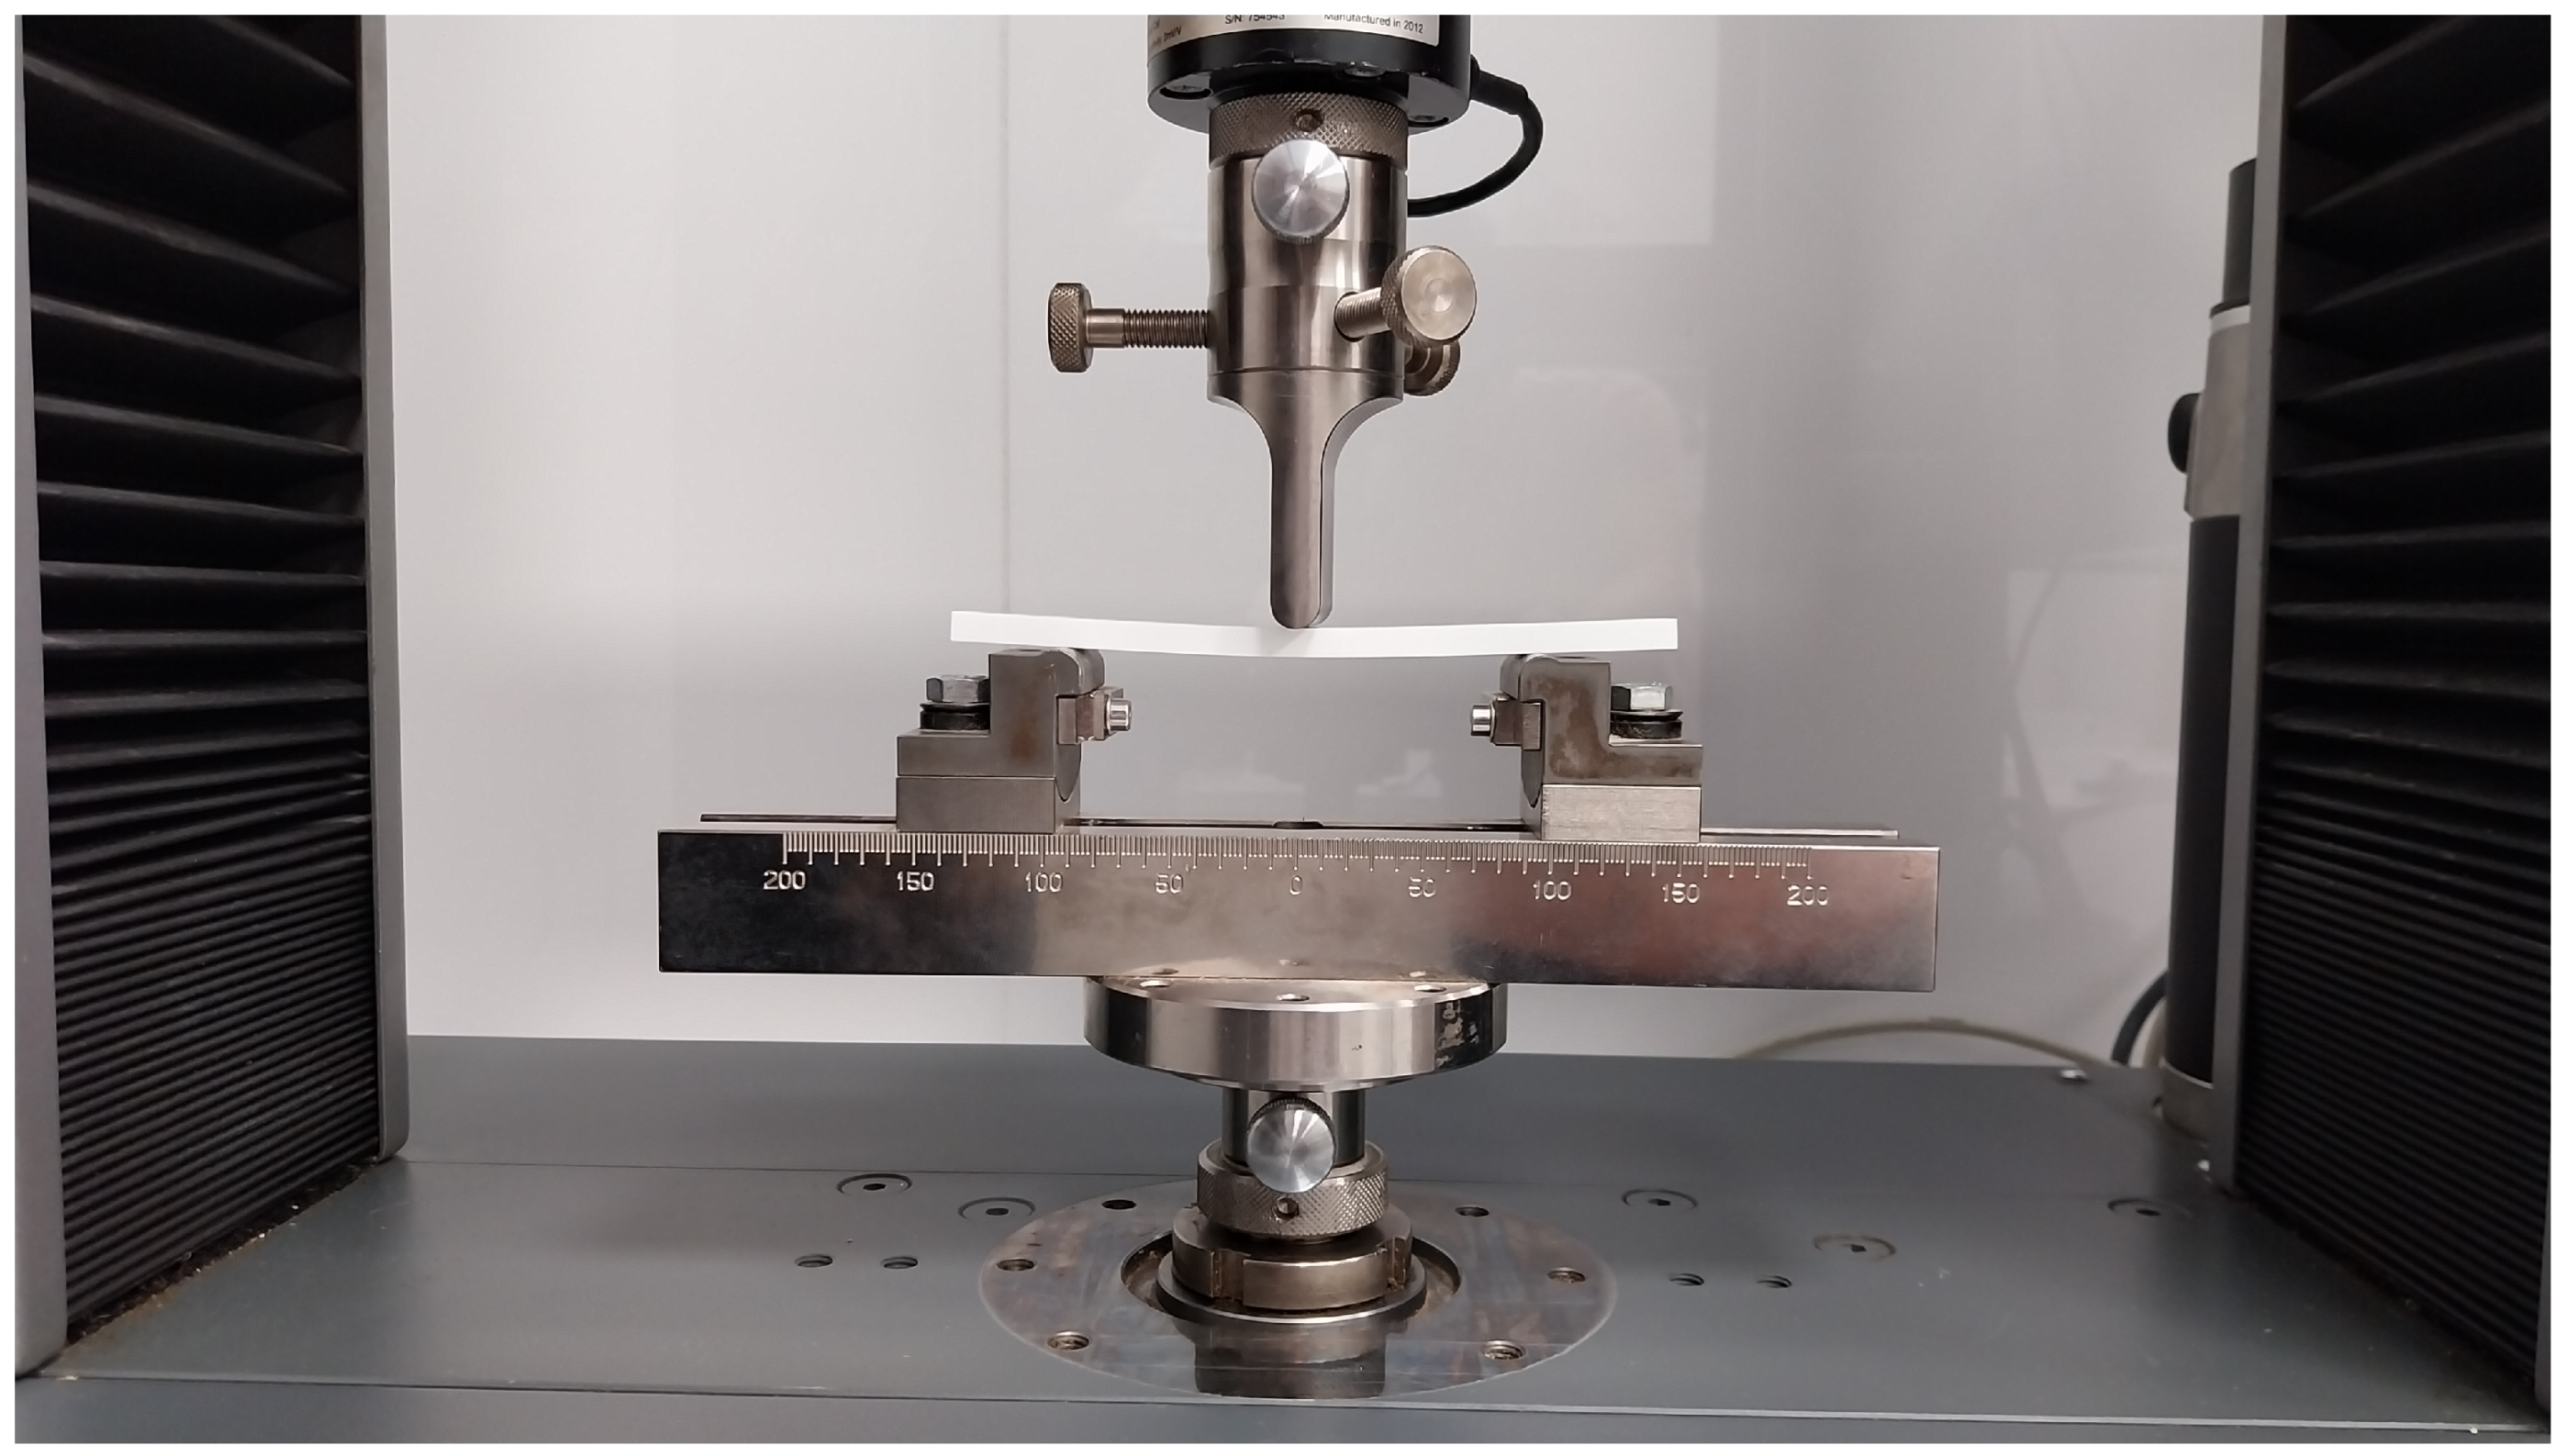
σf. In
Figure 5, a test specimen is being subjected to testing.
The box plot graph shown in
Figure 4 for
σf, (MPa) of PMMA/ATH composites clearly shows a division into high (21_Ke8_M124, 1_Ke6, 4_Ke12), medium (11_Be12, 8_Co6, 13_Ke12_9082, 15_Co12_F) and low (19_Ke12_1160, 17_Ke12_8101, 3_Lu8) levels, with the high group having the highest values (~75–80 MPa) and the lowest dispersion.
The results obtained for the σf of the PMMA/ATH composites clearly show that it varies over a relatively extensive range. The ANOVA on σf (MPa) separated the eleven PMMA/ATH composites into six Tukey HSD homogeneity groups (HG), from A to F. The top tier comprised 21_Ke8_M124 (78.68 MPa; 95% CI: 77.23–80.12; HG A) and 1_Ke6 (76.91 MPa; 75.60–78.22; HG A, B), which were statistically indistinguishable from each other but higher than all others in Groups C–F. Solid surface 4_Ke12 ranked next (75.73 MPa; 74.71–76.75; HG B), significantly lower than 21_Ke8_M124 yet overlapping with 1_Ke6 (shared HG B). An intermediate block spanned Groups C–E: 11_Be12 (C, 67.21 MPa; 66.27–68.15), 8_Co6 (C, D, 67.09 MPa; 65.55–68.64), 15_Co12_F (D, E, 64.17 MPa; 63.03–65.32), 6_Co12 (E, 63.64 MPa; 62.68–64.61), and 13_Ke12_9082 (E, 62.93 MPa; 61.79–64.07). The lowest strengths clustered in HG F: 19_Ke12_1160 (55.58 MPa; 52.75–58.40), 17_Ke12_8101 (51.58 MPa; 49.06–54.11), and 3_Lu8 (51.08 MPa; 50.76–51.40). Overall, the spread between the best- and worst-performing PMMA/ATH composites was 27.6 MPa (≈35% of the top LS mean), with a clear gap between the high-strength A–B cluster (75.7–78.7 MPa) and the mid-strength C–E block (63–67 MPa), and a distinctly weaker F group (51–55.6 MPa).
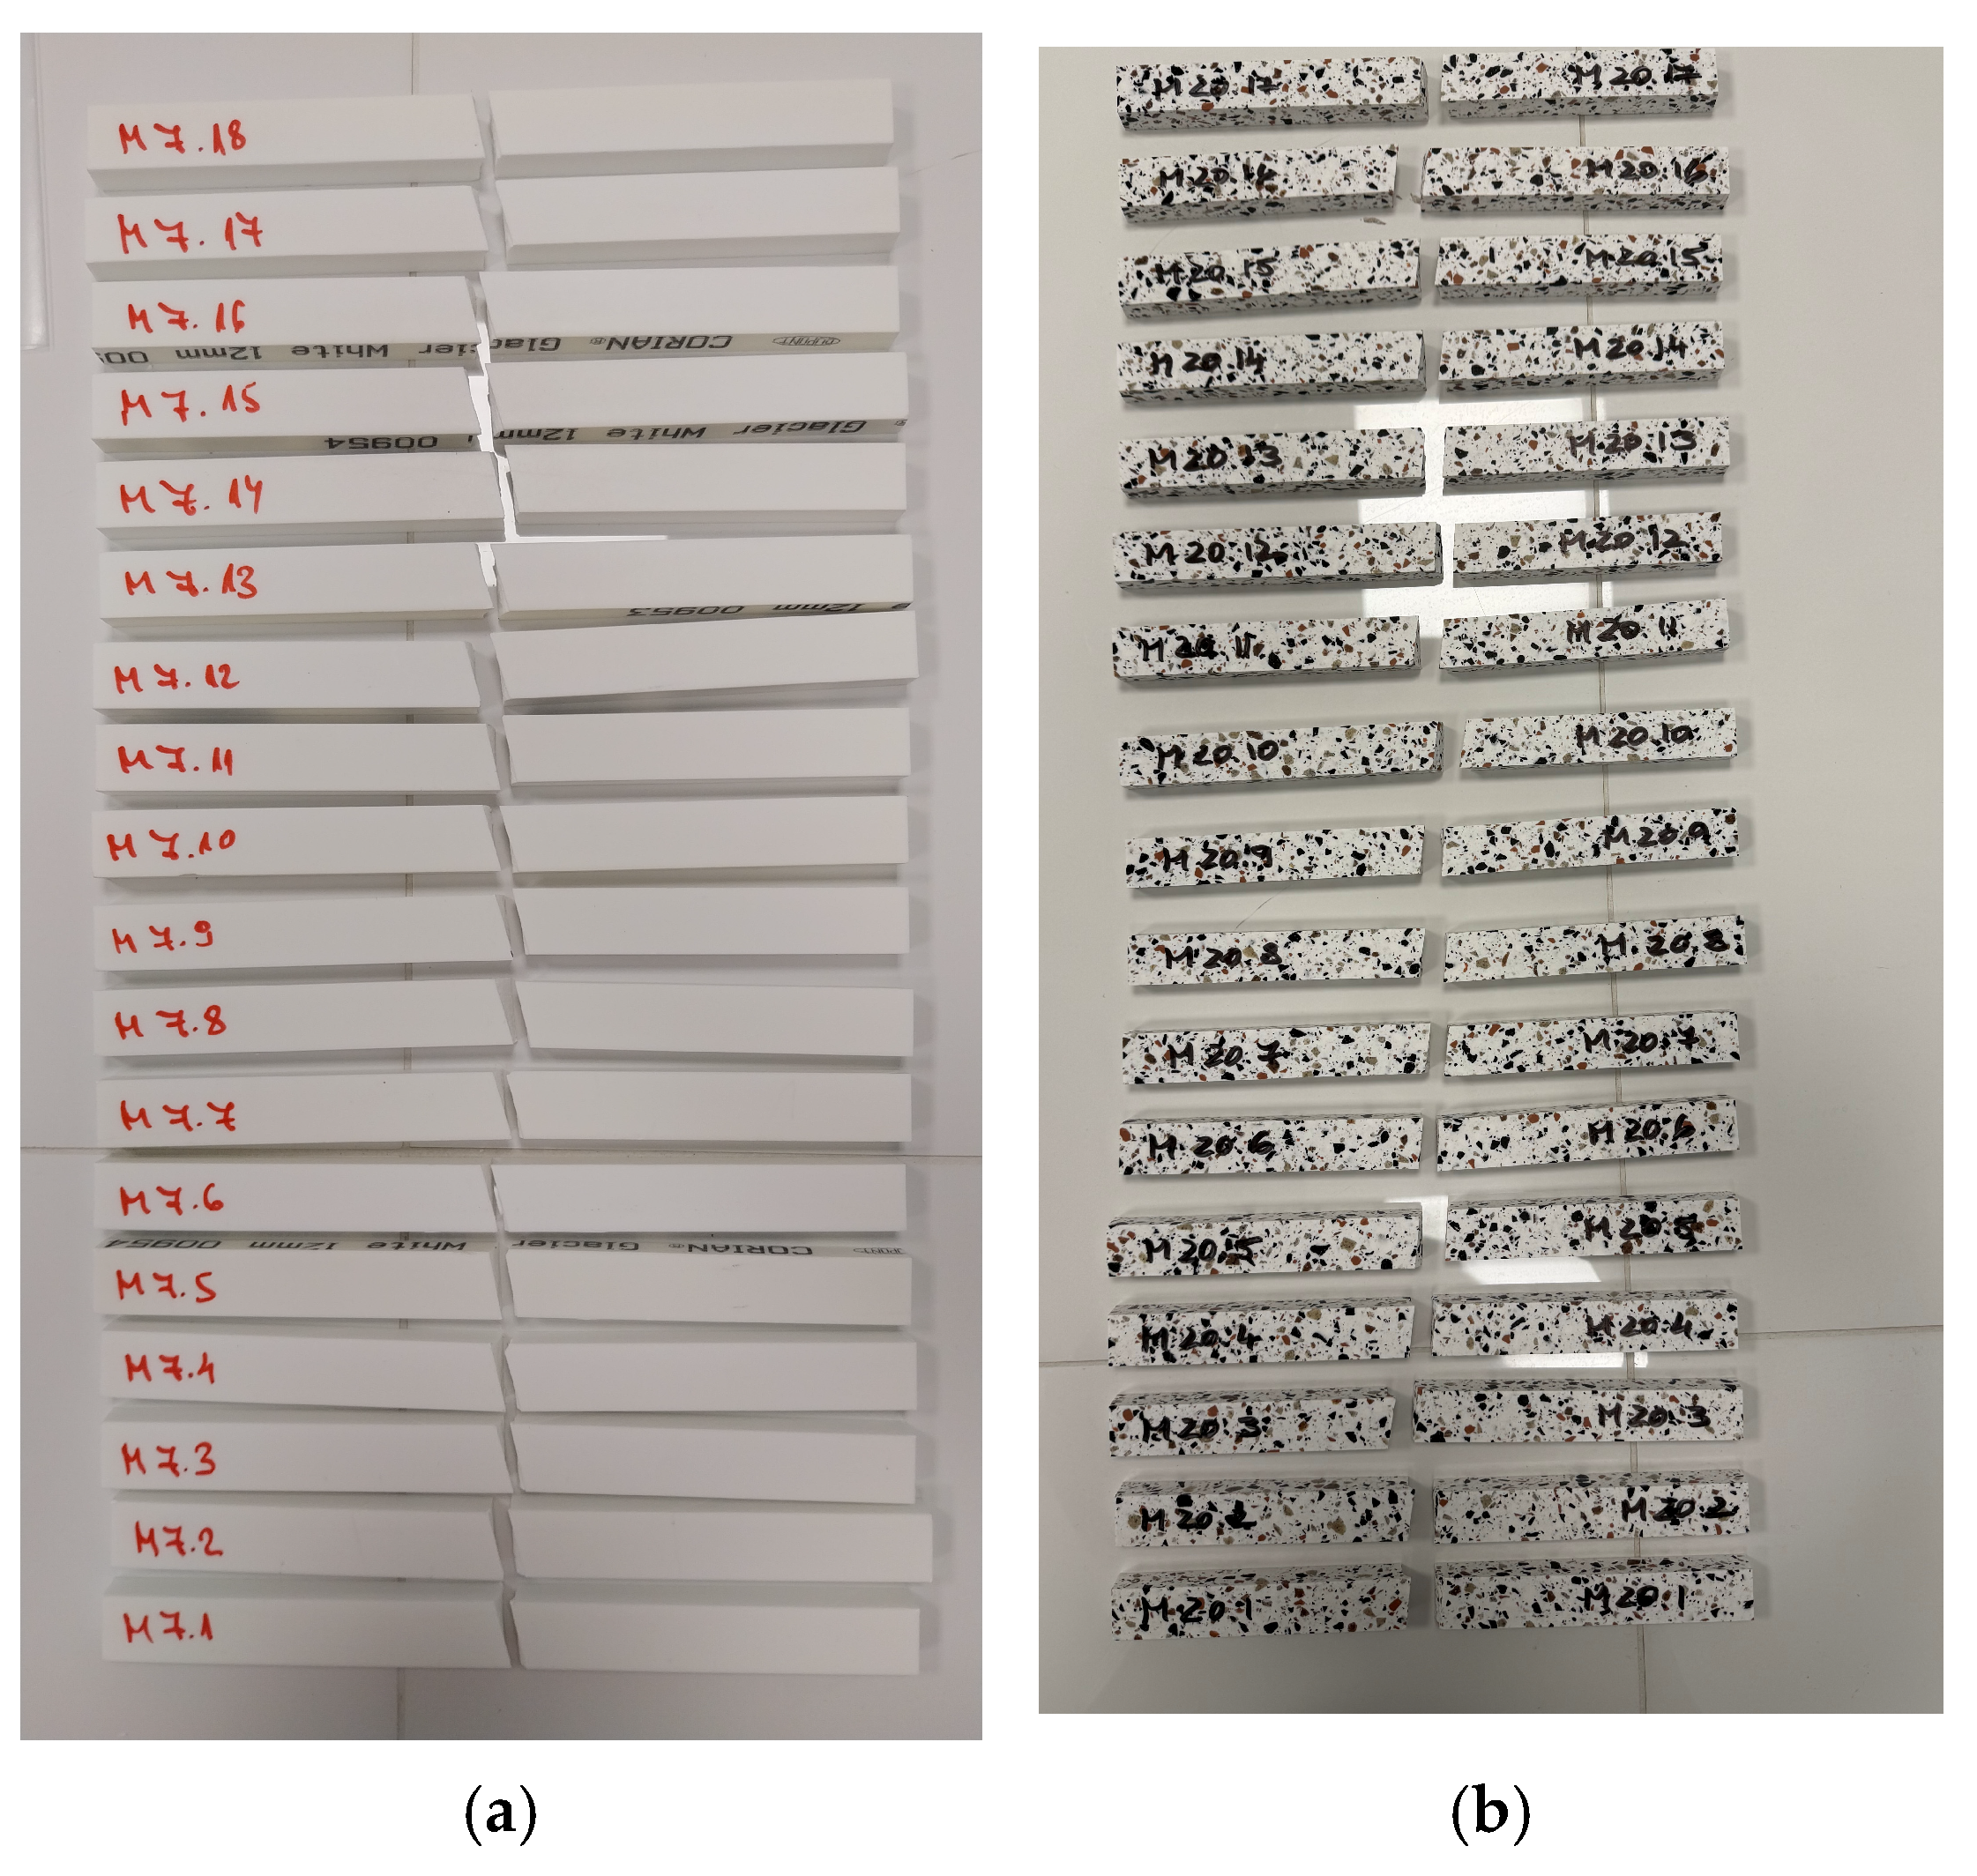
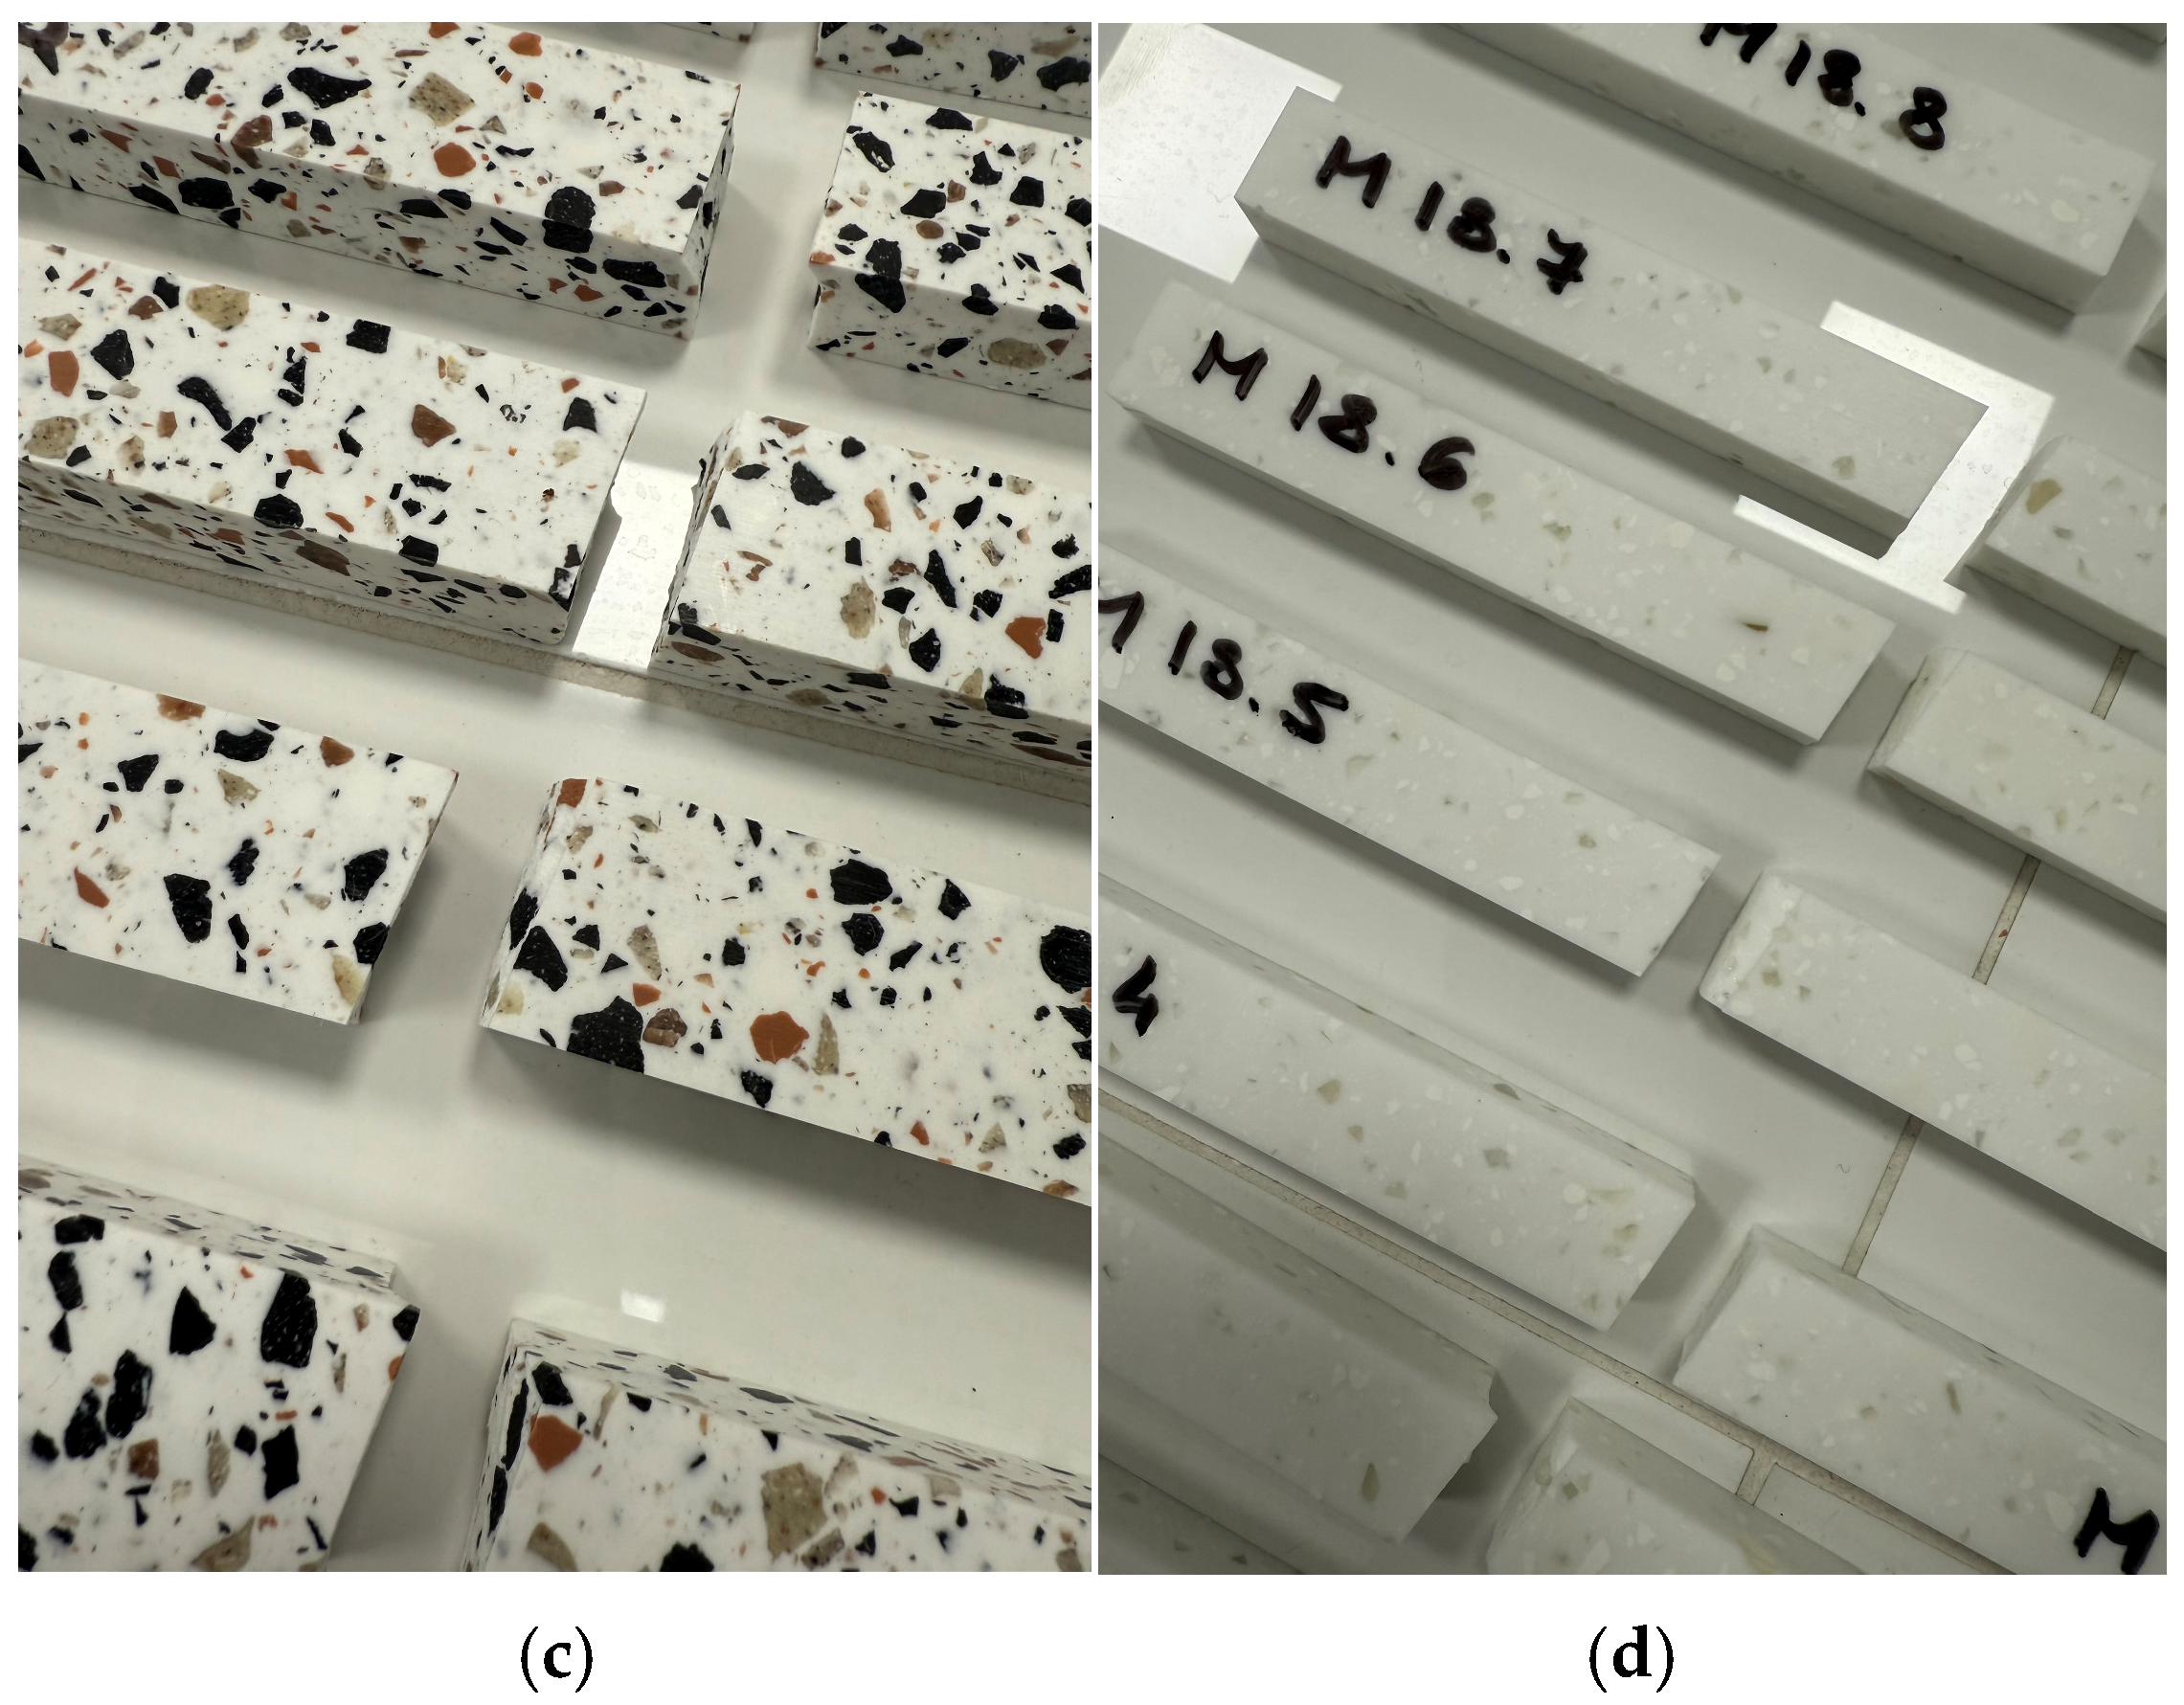
The typical mode of failure of the PMMA/ATH composites is shown in
Figure 6. Under the influence of the applied force and the resulting bending stress, the PMMA/ATH composites failed predominantly in a brittle manner. The initiation of cracks occurred sequentially on the tensile surface of the test specimens, usually in areas of stress concentration, which may be due to micro-pores or at the boundaries between the matrix and the filler around large or angular particles. After the crack appeared, it propagated along a slightly curved trajectory. A fracture occurred around the section under the loading beam in a three-point bending test. The surface of the cross-section exhibits a clearly defined graininess and matte relief, typical of a quasi-brittle fracture (
Figure 7). Small shiny dots, which are exposed ATH particles, can also be observed. Due to pressure-sensitive plasticity of the PMMA matrix and distinct damage mechanisms under tension (matrix cracking, particle–matrix debonding) versus compression (shear micro-yielding, particle packing), the composite exhibits an apparent tension–compression asymmetry. Bending failure is therefore governed by the tensile face as PMMA-based systems are viscoelastic.
The σf does not show a significant correlation with density. For example, the solid surface with the highest strength, 21_Ke8_M124 (ρ = 1697.7 kg/m3), reaches 78.68 MPa, while more dense materials such as 8_Co6 (ρ = 1748.3 kg/m3) and 17_Ke12_8101 (ρ = 1736.7 kg/m3) reach 67.09 MPa and 51.58 MPa, respectively.
One-way ANOVA revealed a significant main effect of group (WB, D, and TL) on flexural strength, F(2, 182) = 118.249,
p < 0.0001 (
Table 6). Effect size was large (η
2 = 0.565; ω
2 = 0.559; Cohen’s f = 1.14), indicating that the formulation accounts for most of the variance in flexural strength. Residuals departed from normality (Shapiro–Wilk
p = 0.007) and variances were unequal (Levene
p < 0.0001); therefore, LS means are reported with HC0-robust SE. Post-hoc Tukey HSD (α = 0.05) showed WB > D > TL (all
p < 0.0001)
Alongside
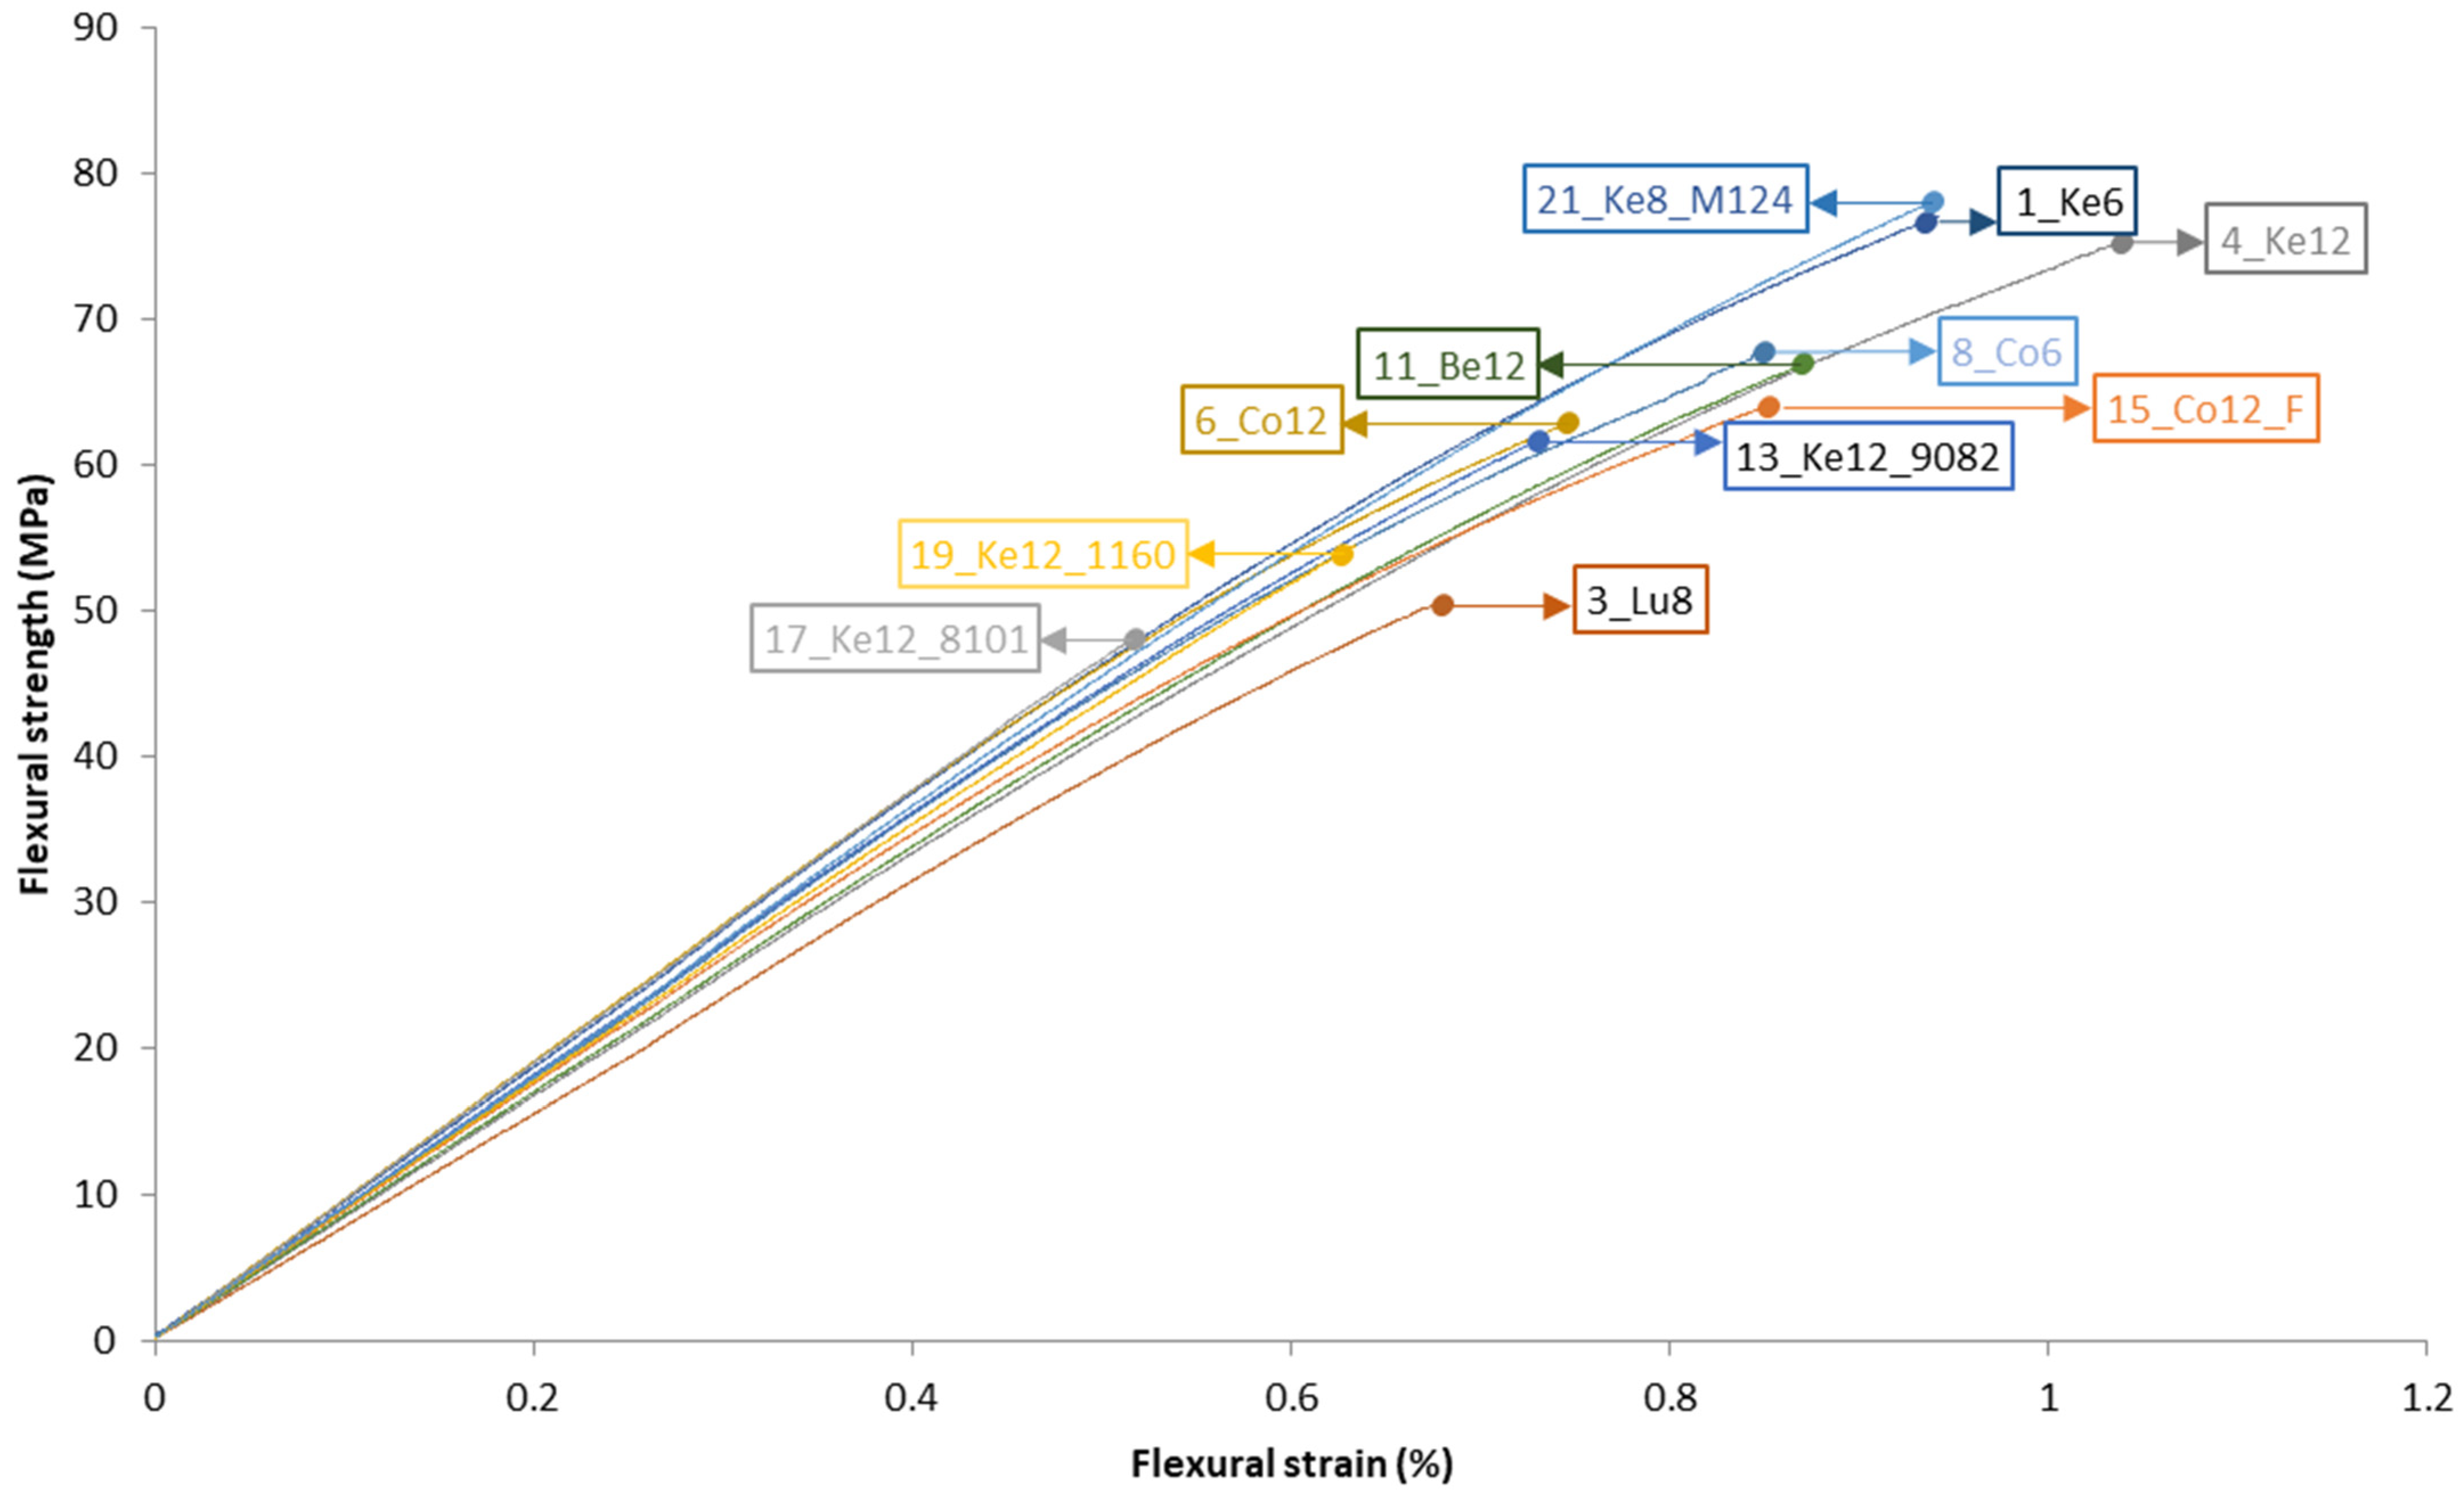
σf, the measured ε
f characterises deformability up to failure. Flexural strain at break (ε
f,b) and the maximal flexural strain (ε
fM) were identical, indicating that PMMA/ATH composites break before yielding. Mean values span 0.60–1.10%, with most series clustering around 0.80–0.95%, which is well below the conventional 3.5% for ISO 178 at L = 16 h, indicating small-strain/elastic behaviour (
Figure 7). Overall, 12-mm sheets exhibit lower ε
f (0.75–0.85%) compared to 6–8-mm sheets (0.85–0.95%); the decorative-filled series (e.g., Ke_8101, 1160) lies at the lower end, consistent with a more brittle flexural response. Conversely, series such as 4_Ke12 and Ke8_M124 exhibit higher ε
f, indicating greater deformability. Where
σf is similar across series, differences in
εf help distinguish failure mode: high
σf with low
εf suggests abrupt (brittle) failure, whereas higher
εf at comparable
σf implies a more gradual, ductile-like deflection prior to failure.
3.3. Flexural Modulus of PMMA/ATH Composites
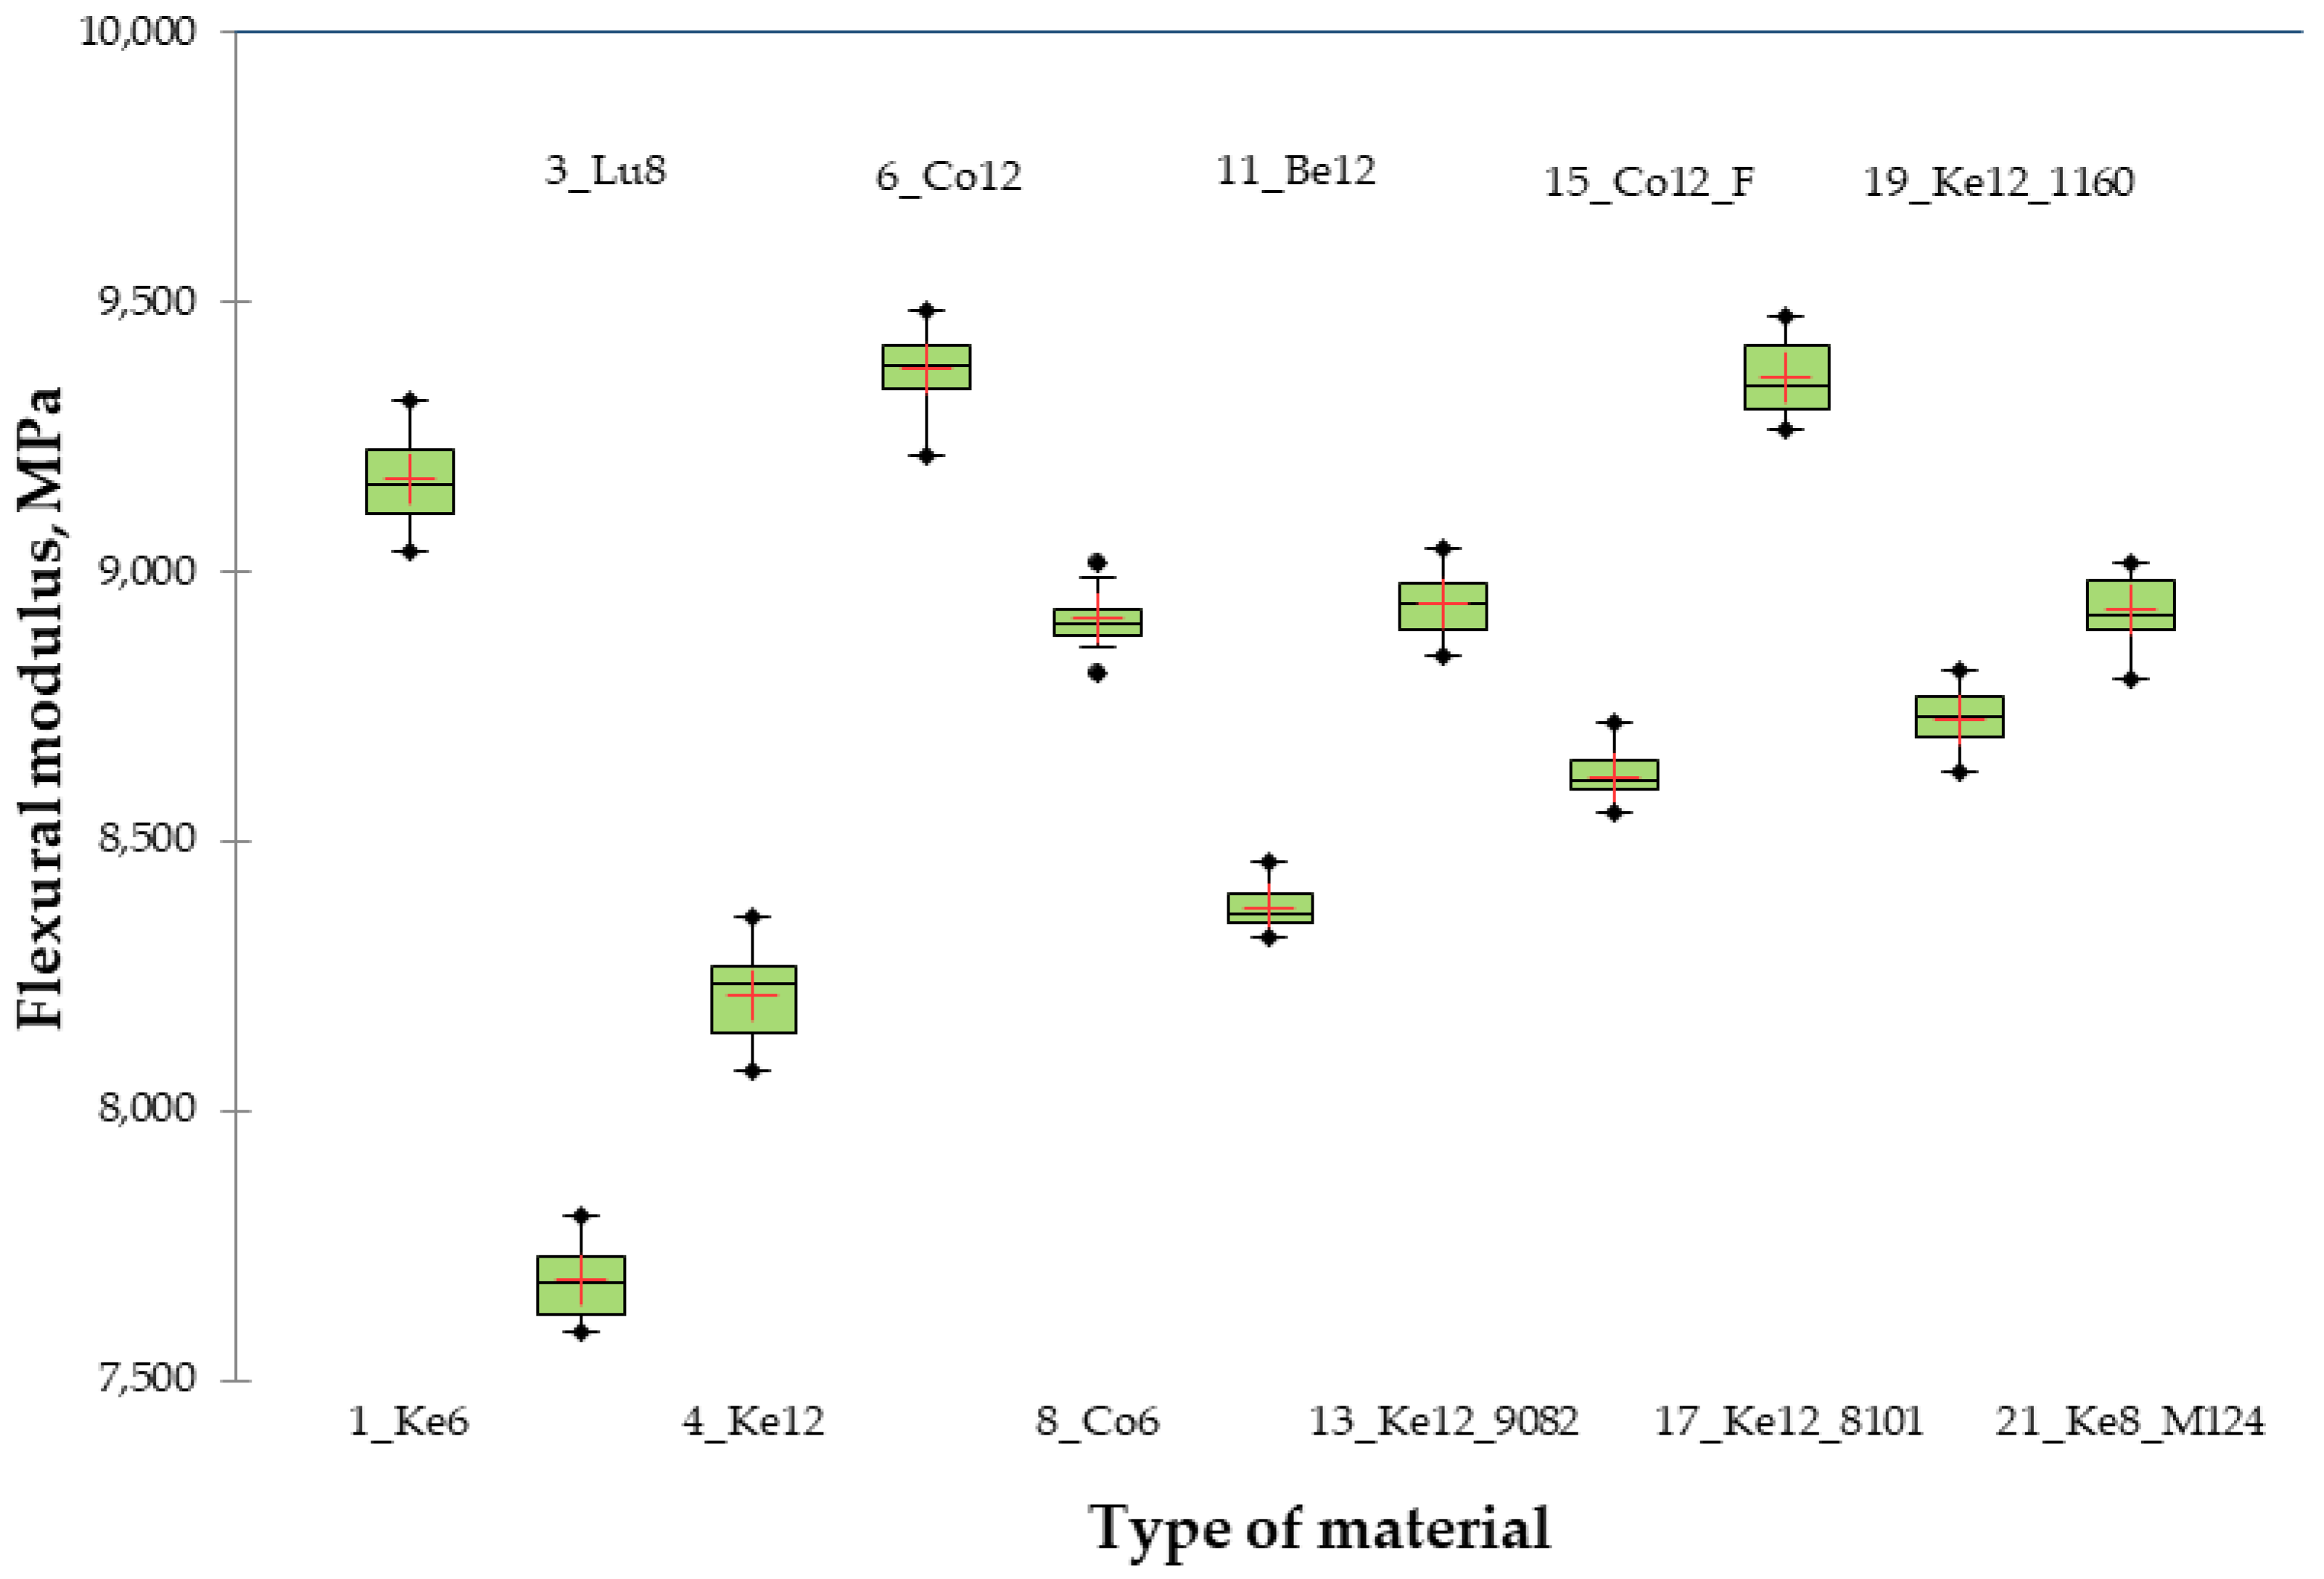
The results from the test evaluating the
Ef of PMMA/ATH composites are presented graphically in
Figure 8.
Table 7 shows the Tukey’s HSD analysis of the differences between the groups with a confidence interval of 95% of the
Ef of PMMA/ATH composites of all pairwise comparisons. The composites are ranked in descending order of the
Ef.
The box plots of the Ef (MPa) show a clear hierarchy of elasticity: 6_Co12 and 17_Ke12_8101 have the highest average values (~9400 MPa), a compact middle group including 1_Ke6, 21_Ke8_M124, 8_Co6, 19_Ke12_1160, and 13_Ke12_9082 (8900–9100 MPa), while 15_Co12_F, 11_Be12, and 4_Ke12 have lower values (8100–8700 MPa); the interquartile ranges are generally narrow, indicating high repeatability and consistency of the results.
The ANOVA on Ef revealed a tight distribution in all eleven PMMA/ATH-based composites, with a CV ranging from 0.47% to 0.99%. The highest LS mean was 6_Co12 (9377 MPa; 95% CI, 9349–9405; HG A), which was statistically indistinguishable only from 17_Ke12_8101 (9361 MPa; 95% CI, 9327–9394; HG A and B). Solid surface 1_Ke6 ranked next (9175 MPa; 9134–9216; HG B) and was significantly higher than all composites in HG C–H. An intermediate cluster (HG-C) comprised 13_Ke12_9082 (8944 MPa; 8917–8970), 21_Ke8_M124 (8930 MPa; 8899–8961), and 8_Co6 (8912 MPa; 8885–8940), which did not differ from one another but were about 5% lower than the top tier and about 3% lower than 1_Ke6. Below them, 19_Ke12_1160 formed HG-D (8712 MPa; 8676–8747), followed by 15_Co12_F (HG-E, 8618 MPa; 8598–8638). The lowest moduli were observed for 11_Be12 (HG-F, 8375 MPa; 8356–8394), 4_Ke12 (HG–G, 8214 MPa; 8174–8254), and 3_Lu8 (HG-H, 7684 MPa; 7653–7716). Overall, the span between the stiffest and least stiff PMMA/ATH composites was 1693 MPa (18% of the top value), with stiffness clustering into eight statistically distinct homogeneity groups.
One-way ANOVA for Ef across WB, D, and TL groups shows no significant group effect, F(2, 172) = 0.580, p = 0.561; trivial effect size (η2 = 0.007, ω2 ≈ 0); Tukey HSD: all groups = A. No statistically significant group effect under the present design, indicating that the type of composite is not affected by its composition in the elastic deformation zone.
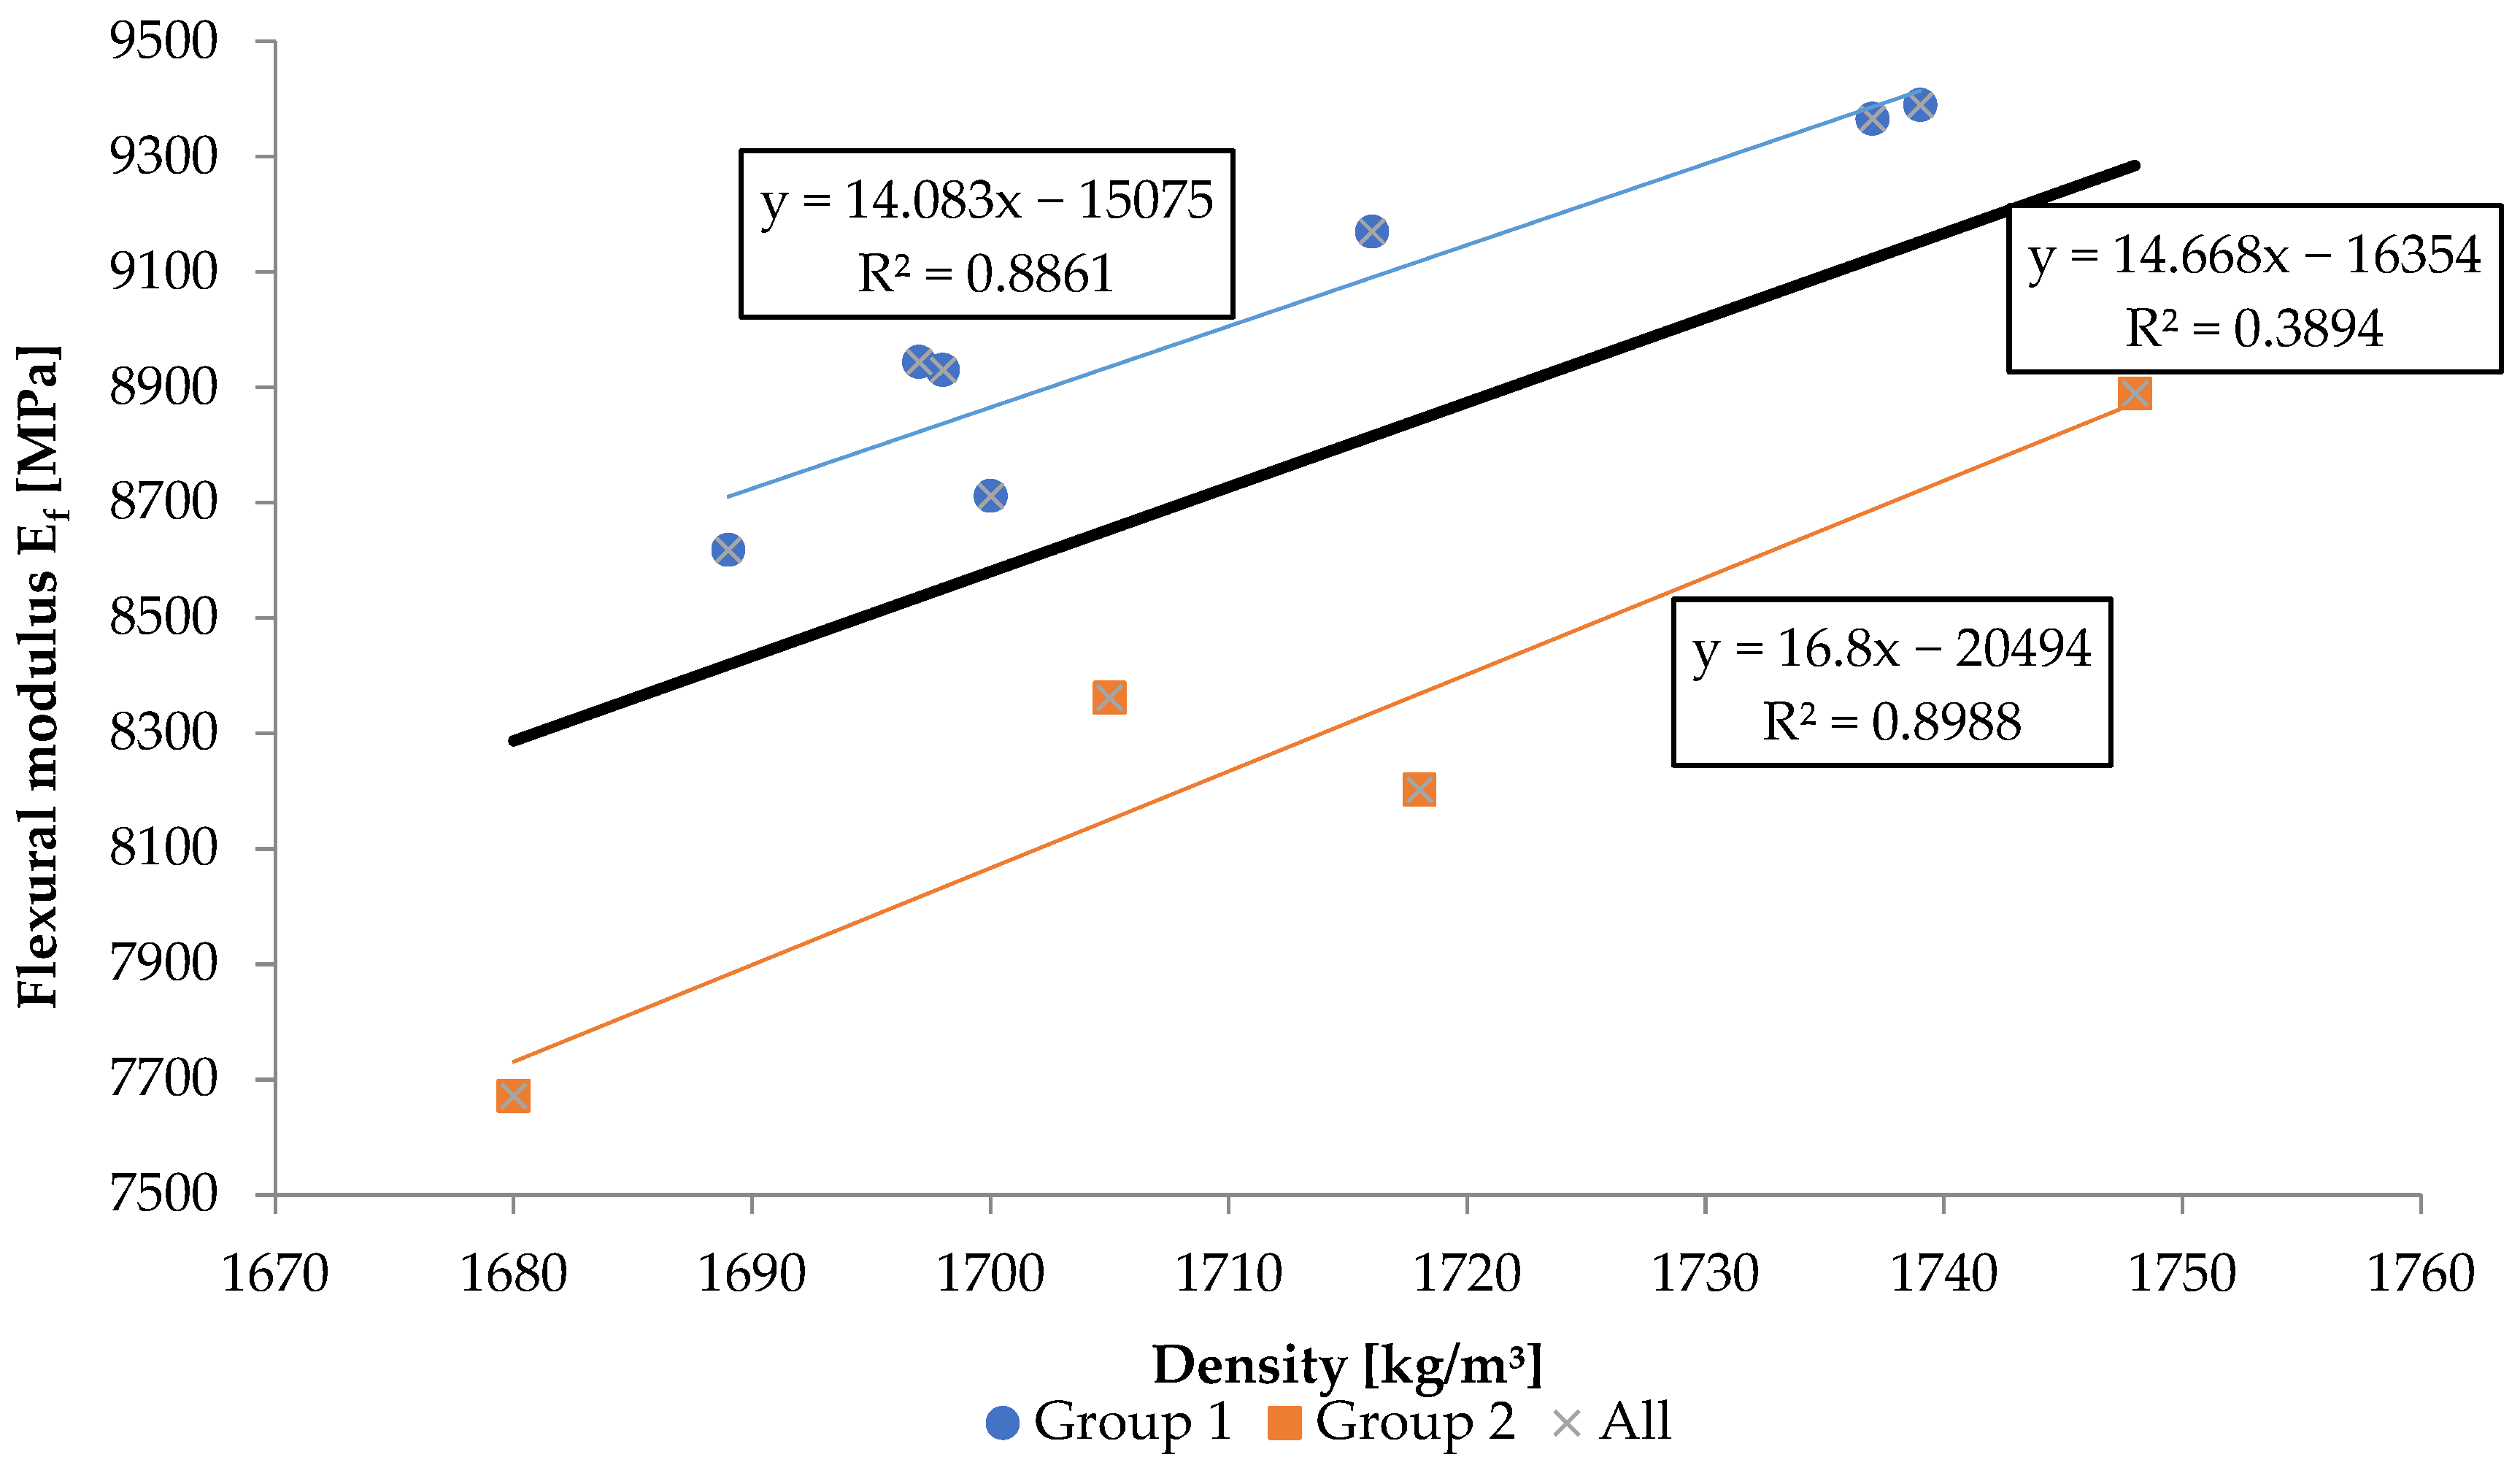
As shown in
Figure 9, the data for all series do not follow a uniform linear relationship between density and modulus of elasticity. However, two subgroups with distinctly different slopes stand out in the distribution of points, suggesting distinct mechanisms of structural compaction and load transfer. Therefore, the material was divided into two groups, and separate linear regressions were calculated. In Group 1, there are the following composites: 1_Ke6, 6_Co12, 13_Ke12_9082, 15_Co12_F, 17_Ke12_8101, 19_Ke12_1160, and 21_Ke8_M124. In Group 2, there are: 3_Lu8, 4_Ke12, 8_Co6, and 11_Be12. The combined model with two lines shows a significantly better fit (R
2 = 0.8861 and 0.8988) than a single regression (R
2 = 0.3894). The differences between the two groups can be interpreted as arising from microstructural differences—primarily matrix–filler interfacial adhesion, dispersion quality, and microporosity. For a given density range, the subgroup with better interface and more uniform dispersion (Group 1) achieves a systematically higher effective modulus than the subgroup showing signs of agglomeration, weaker adhesion, or voids (Group 2). In both sub-groups, the linear regressions are statistically significant, and their slopes are more informative than the overall trend, indicating that microstructural effects dominate over bulk density alone. Practically, this means that controlling interface quality and dispersion can deliver larger modulus gains at the same density than would be predicted by the “average” (pooled) relationship.
Within Group 1, Ef increases strongly with density: r = 0.9413, R2 = 0.8861, p < 0.001, with an estimated slope of +15–16 MPa per 1 kg/m3 (95% CI roughly +12 to +19 MPa·(kg/m3)). Over the observed density window (50 kg/m3), this corresponds to about +770 MPa higher modulus for the denser materials.
Within Group 2, Ef also rises markedly with density: r = 0.9480, R2 = 0.8988, p < 0.001, with an estimated slope of +13–14 MPa per 1 kg/m3 (95% CI roughly +11 to +17 MPa·(kg/m3)). Across the 68 kg/m3 window, this implies approximately +1218 MPa higher modulus.
3.4. The Effect of Heat Treatment on the Flexural Behaviour of PMMA/ATH Composites
One of the significant advantages of PMMA/ATH composites is their thermoformability, which allows for the creation of virtually unlimited 3D shapes. The process involves heating the material, placing it in a mould, and pressing it, most often using vacuum presses. It is then left to cool to room temperature. As the temperature approaches and exceeds the T
g of the PMMA matrix (~105 °C), the matrix softens, leading to a pronounced drop in
Ef and a reduction in
σf [
28]. However, after cooling, the initial flexural strength is expected to be restored.
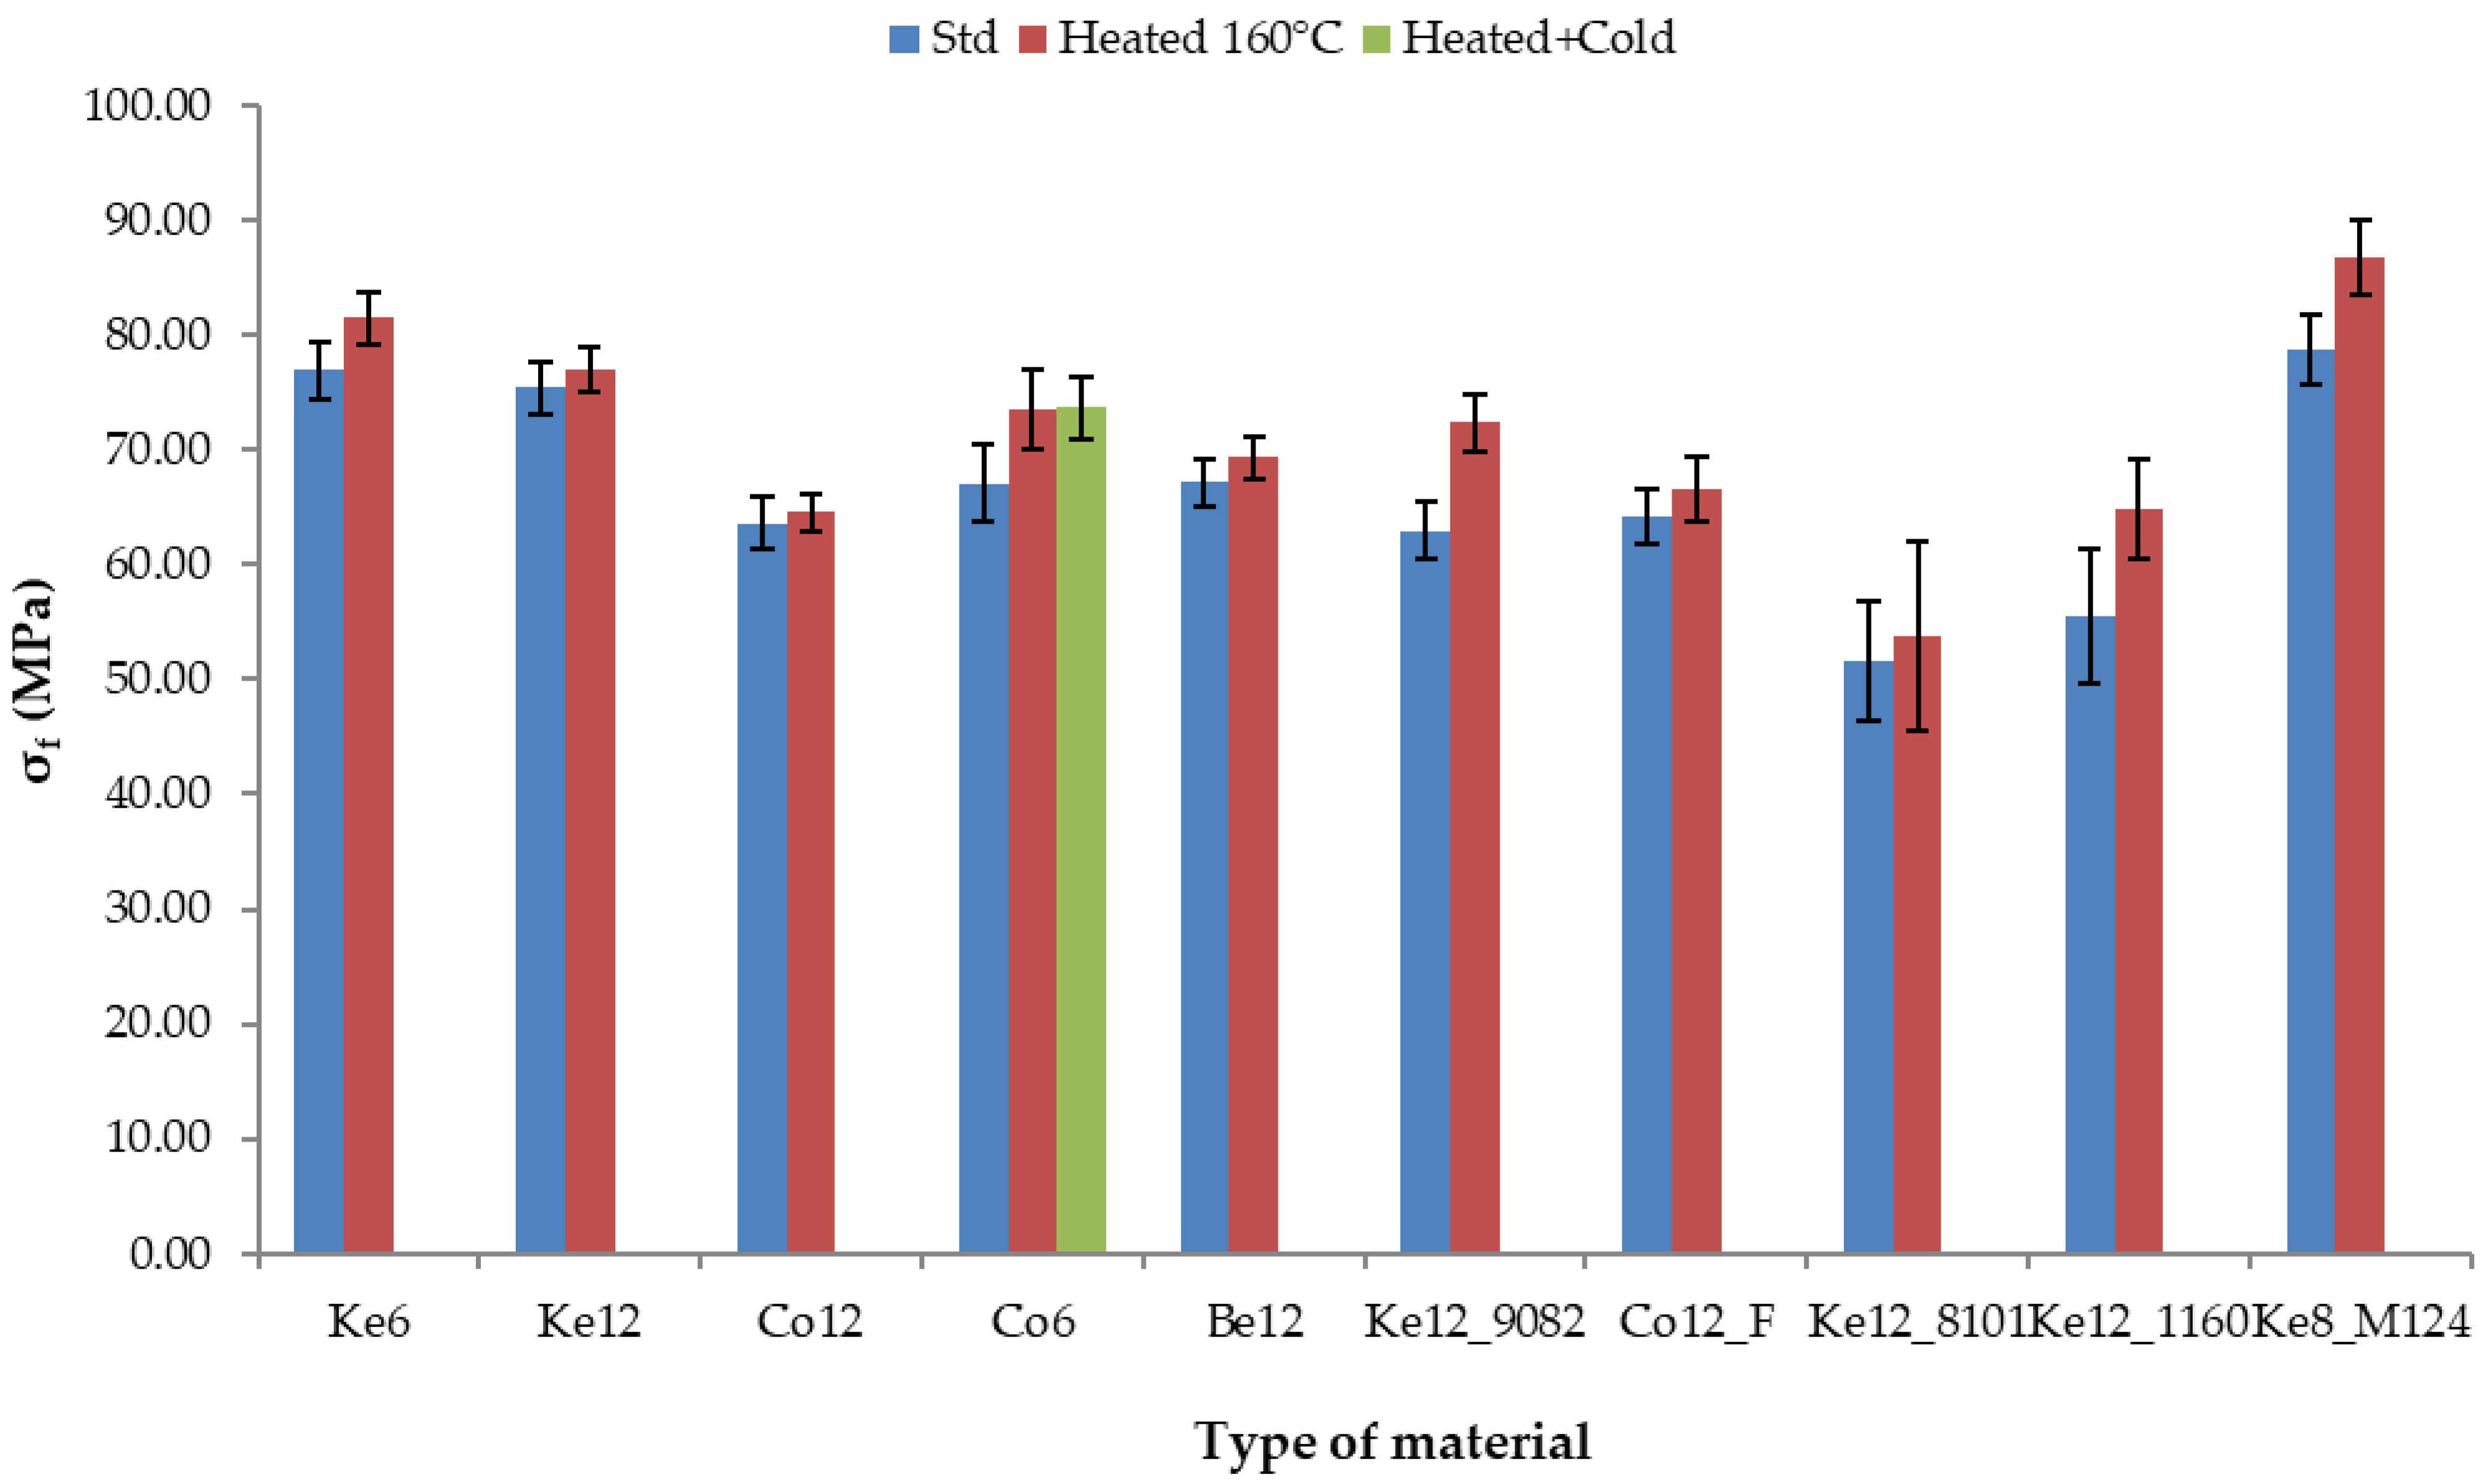
A follow-up experiment was conducted with the eleven PMMA/ATH series studied above. A new series of materials identical to those listed in
Table 1 was heated to 160 °C and then cooled to room temperature. For Co6, a third condition was added: after heating, they were shock-cooled in cold water. The statistics are based on the mean values of the samples, using Welch’s
t-tests (α = 0.05). The results are shown graphically in
Figure 10.
Heating at 160 °C generally increases the σf of PMMA/ATH solid surface composites by approximately 7% on average, but the response is grade-dependent. The largest and most significant gains were observed in Ke12_1160 (+16.7%), Ke12_9082 (+15.0%), Ke8_M124 (+10.3%), and Co6 (+9.6%). Moderate gains (significant) show Ke6 (+5.9%), Be12 mm (+3.2%), Co12_F (+3.7%). Neutral changes (not significant) show Ke12 (+2.0%), Co12 (+1.4%), and Ke12_8101 (+4.3%). Shock-cooling after heating does not improve strength beyond the heated state for Co6. Density shows no significant correlation with the heating gain, indicating that formulation and thermal history dominate the response.
Unlike σf, the Ef is essentially stable after the 160 °C thermal treatment and cooling for PMMA/ATH solid surface composites. A few materials show statistically detectable (Ke8_M124 and Ke12_8101), but with practically small changes (±0.3–0.5%). For Corian 6 mm, adding shock-cooling reduces Ef by about 1%, while other grades remain within measurement scatter.
Heating at 160 °C and subsequent cooling increases
εf by 11.8% on average across the eleven Standard–Heated pairs, clearly seen in
Figure 11. The effect is generally positive and statistically reliable, with some variation from grade to grade. Largest, significant gains: Ke12_1160 (+21.7%), Ke12_9082 (+18.1%), Be_12 mm (+16.5%), Ke8_M124 (+13.4%). Moderate, significant gains: Ke6 (+7.8%), Ke12 (+7.0%), Co12 (+7.7%), Co12_F (+7.3%). Small and not significant is Ke12_ 8101 (+6.7%) with higher scatter. Shock cooling after heating (Co6) adds only a small, statistically non-decisive increment.
3.5. SEM Micrograph Analysis of the Surface of Unheated and Heated PMMA/ATH Composite
The SEM micrograph (500×) of the plain surface of the unheated and heated PMMA/ATH composite (
Figure 12) demonstrates a relatively uniform distribution of ATH filler particles within the PMMA matrix. The heated material exhibits a smoother PMMA matrix obtained by heat treatment above Tg, and light halos are visible around the ATH particles, corresponding to optical scattering from very fine microparticles. It may also result in brighter/whiter spots under oblique light due to scattering.
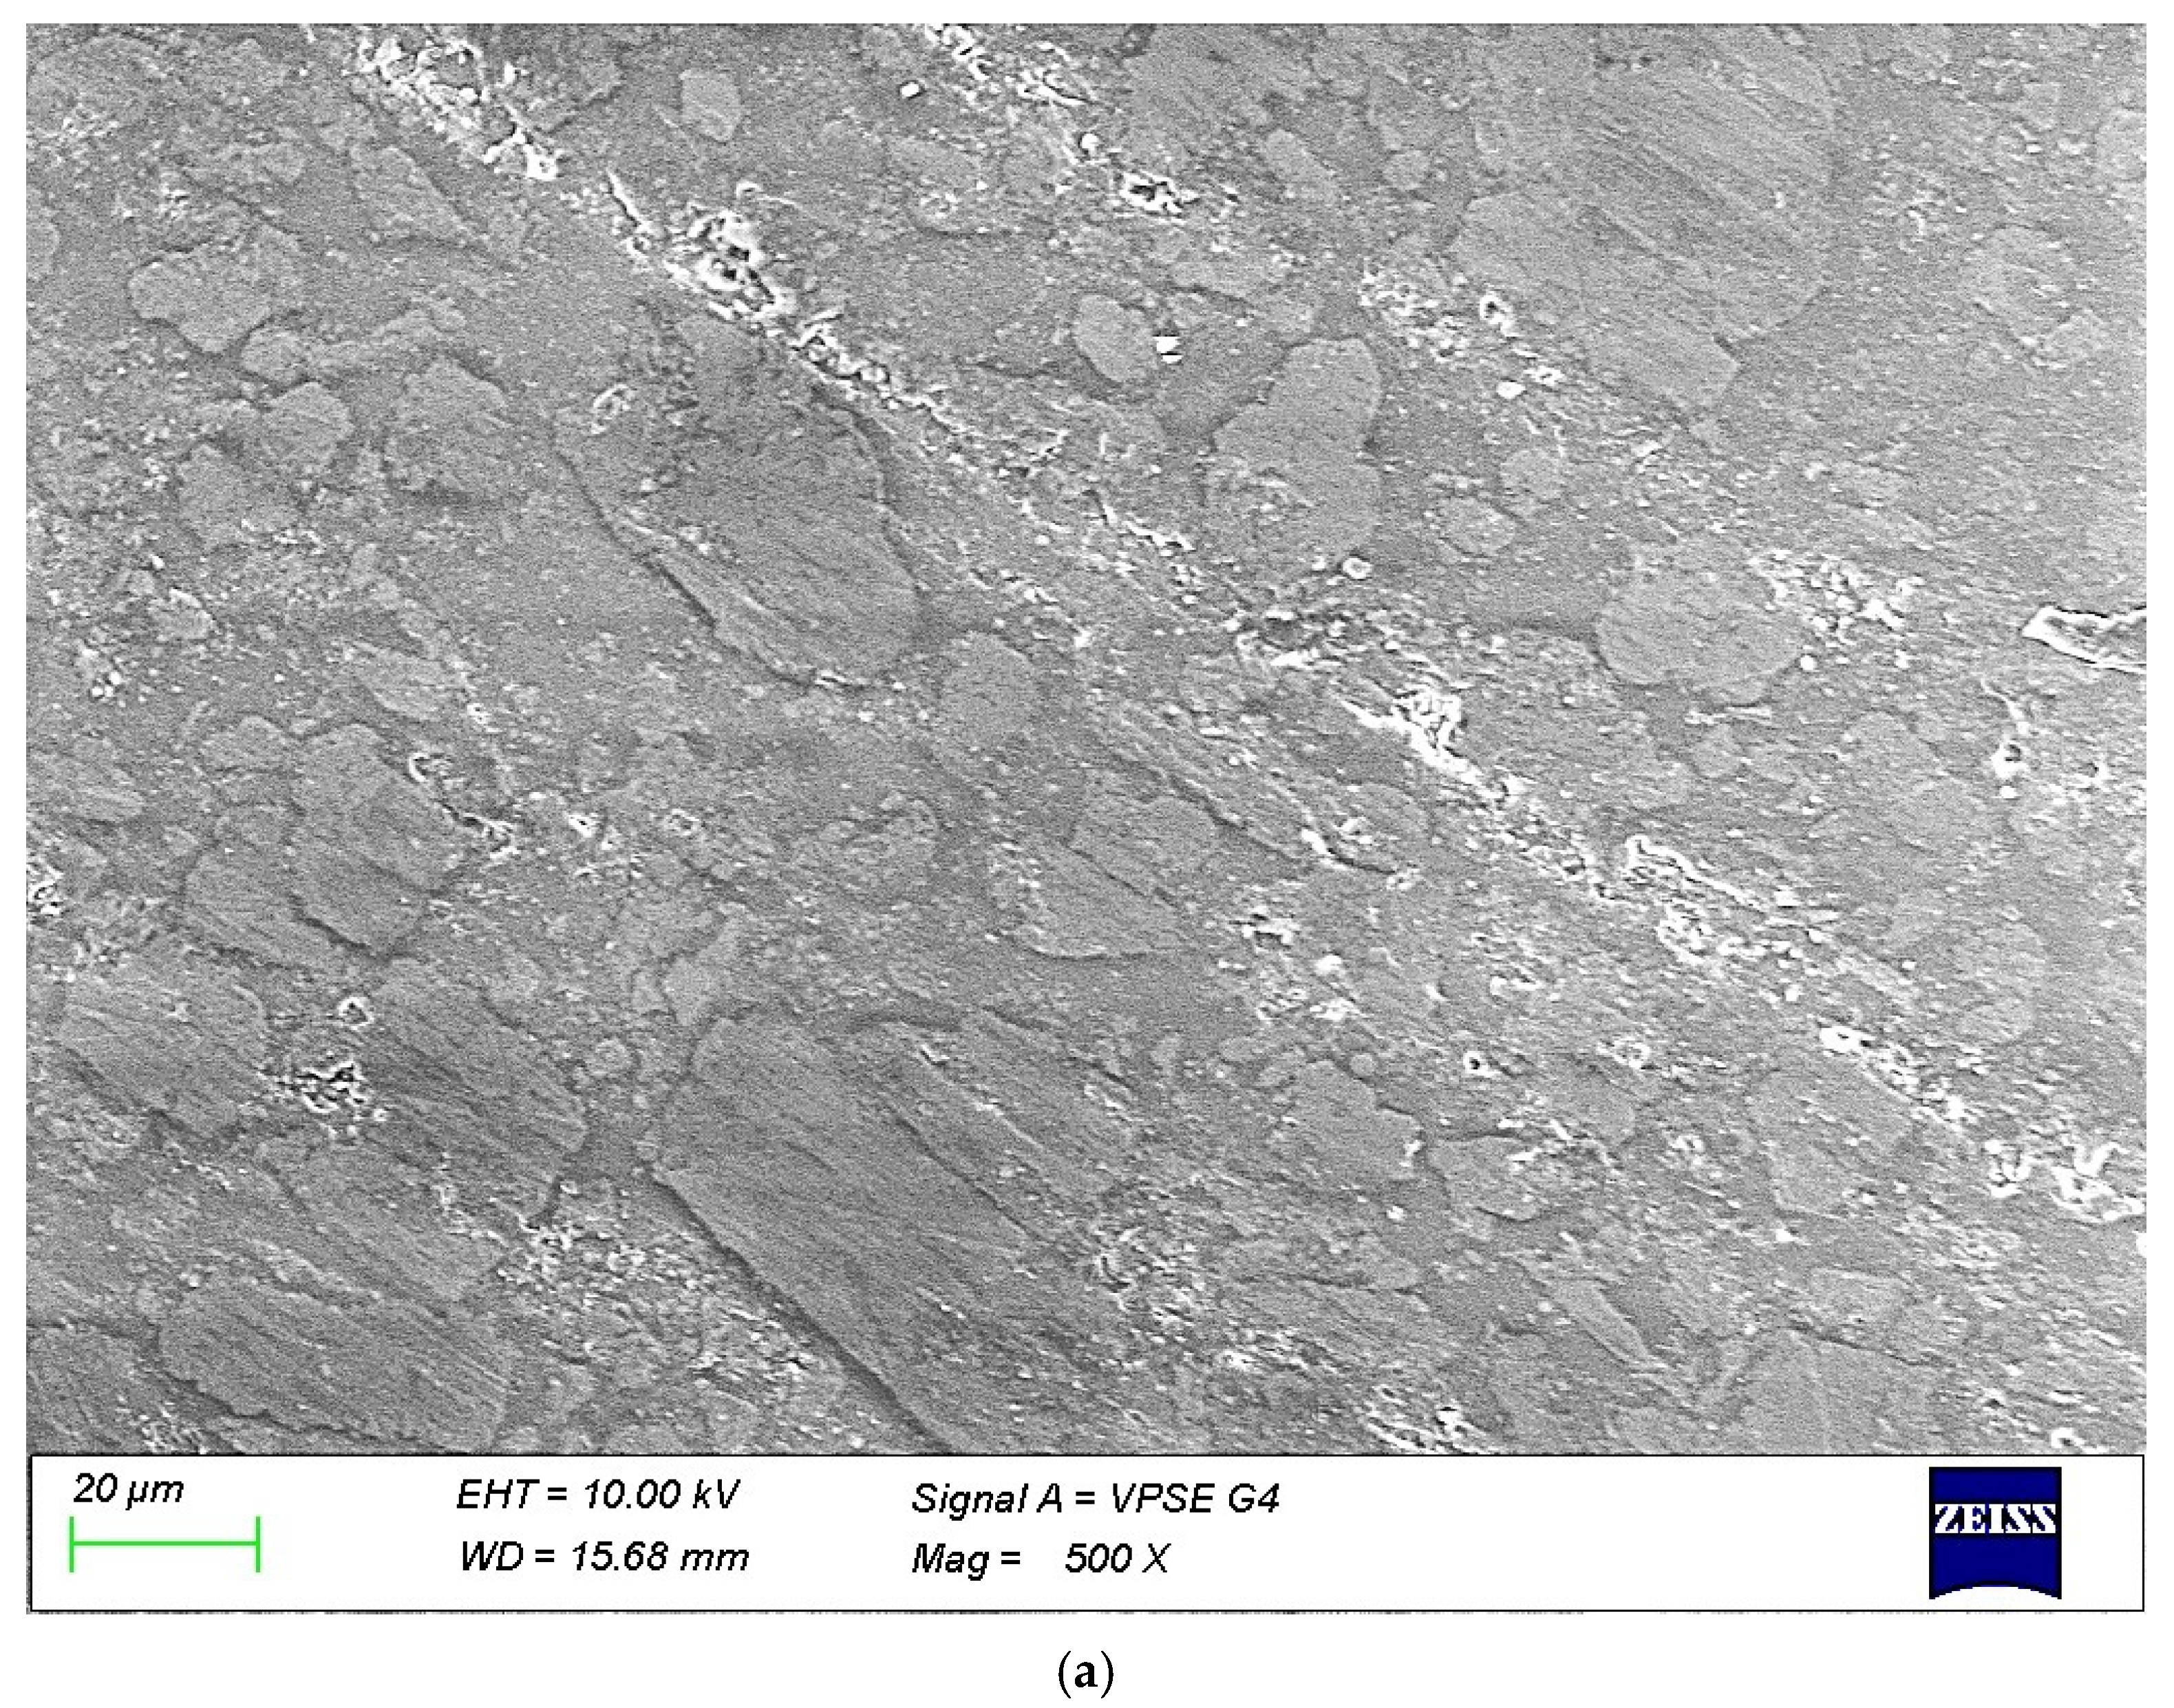
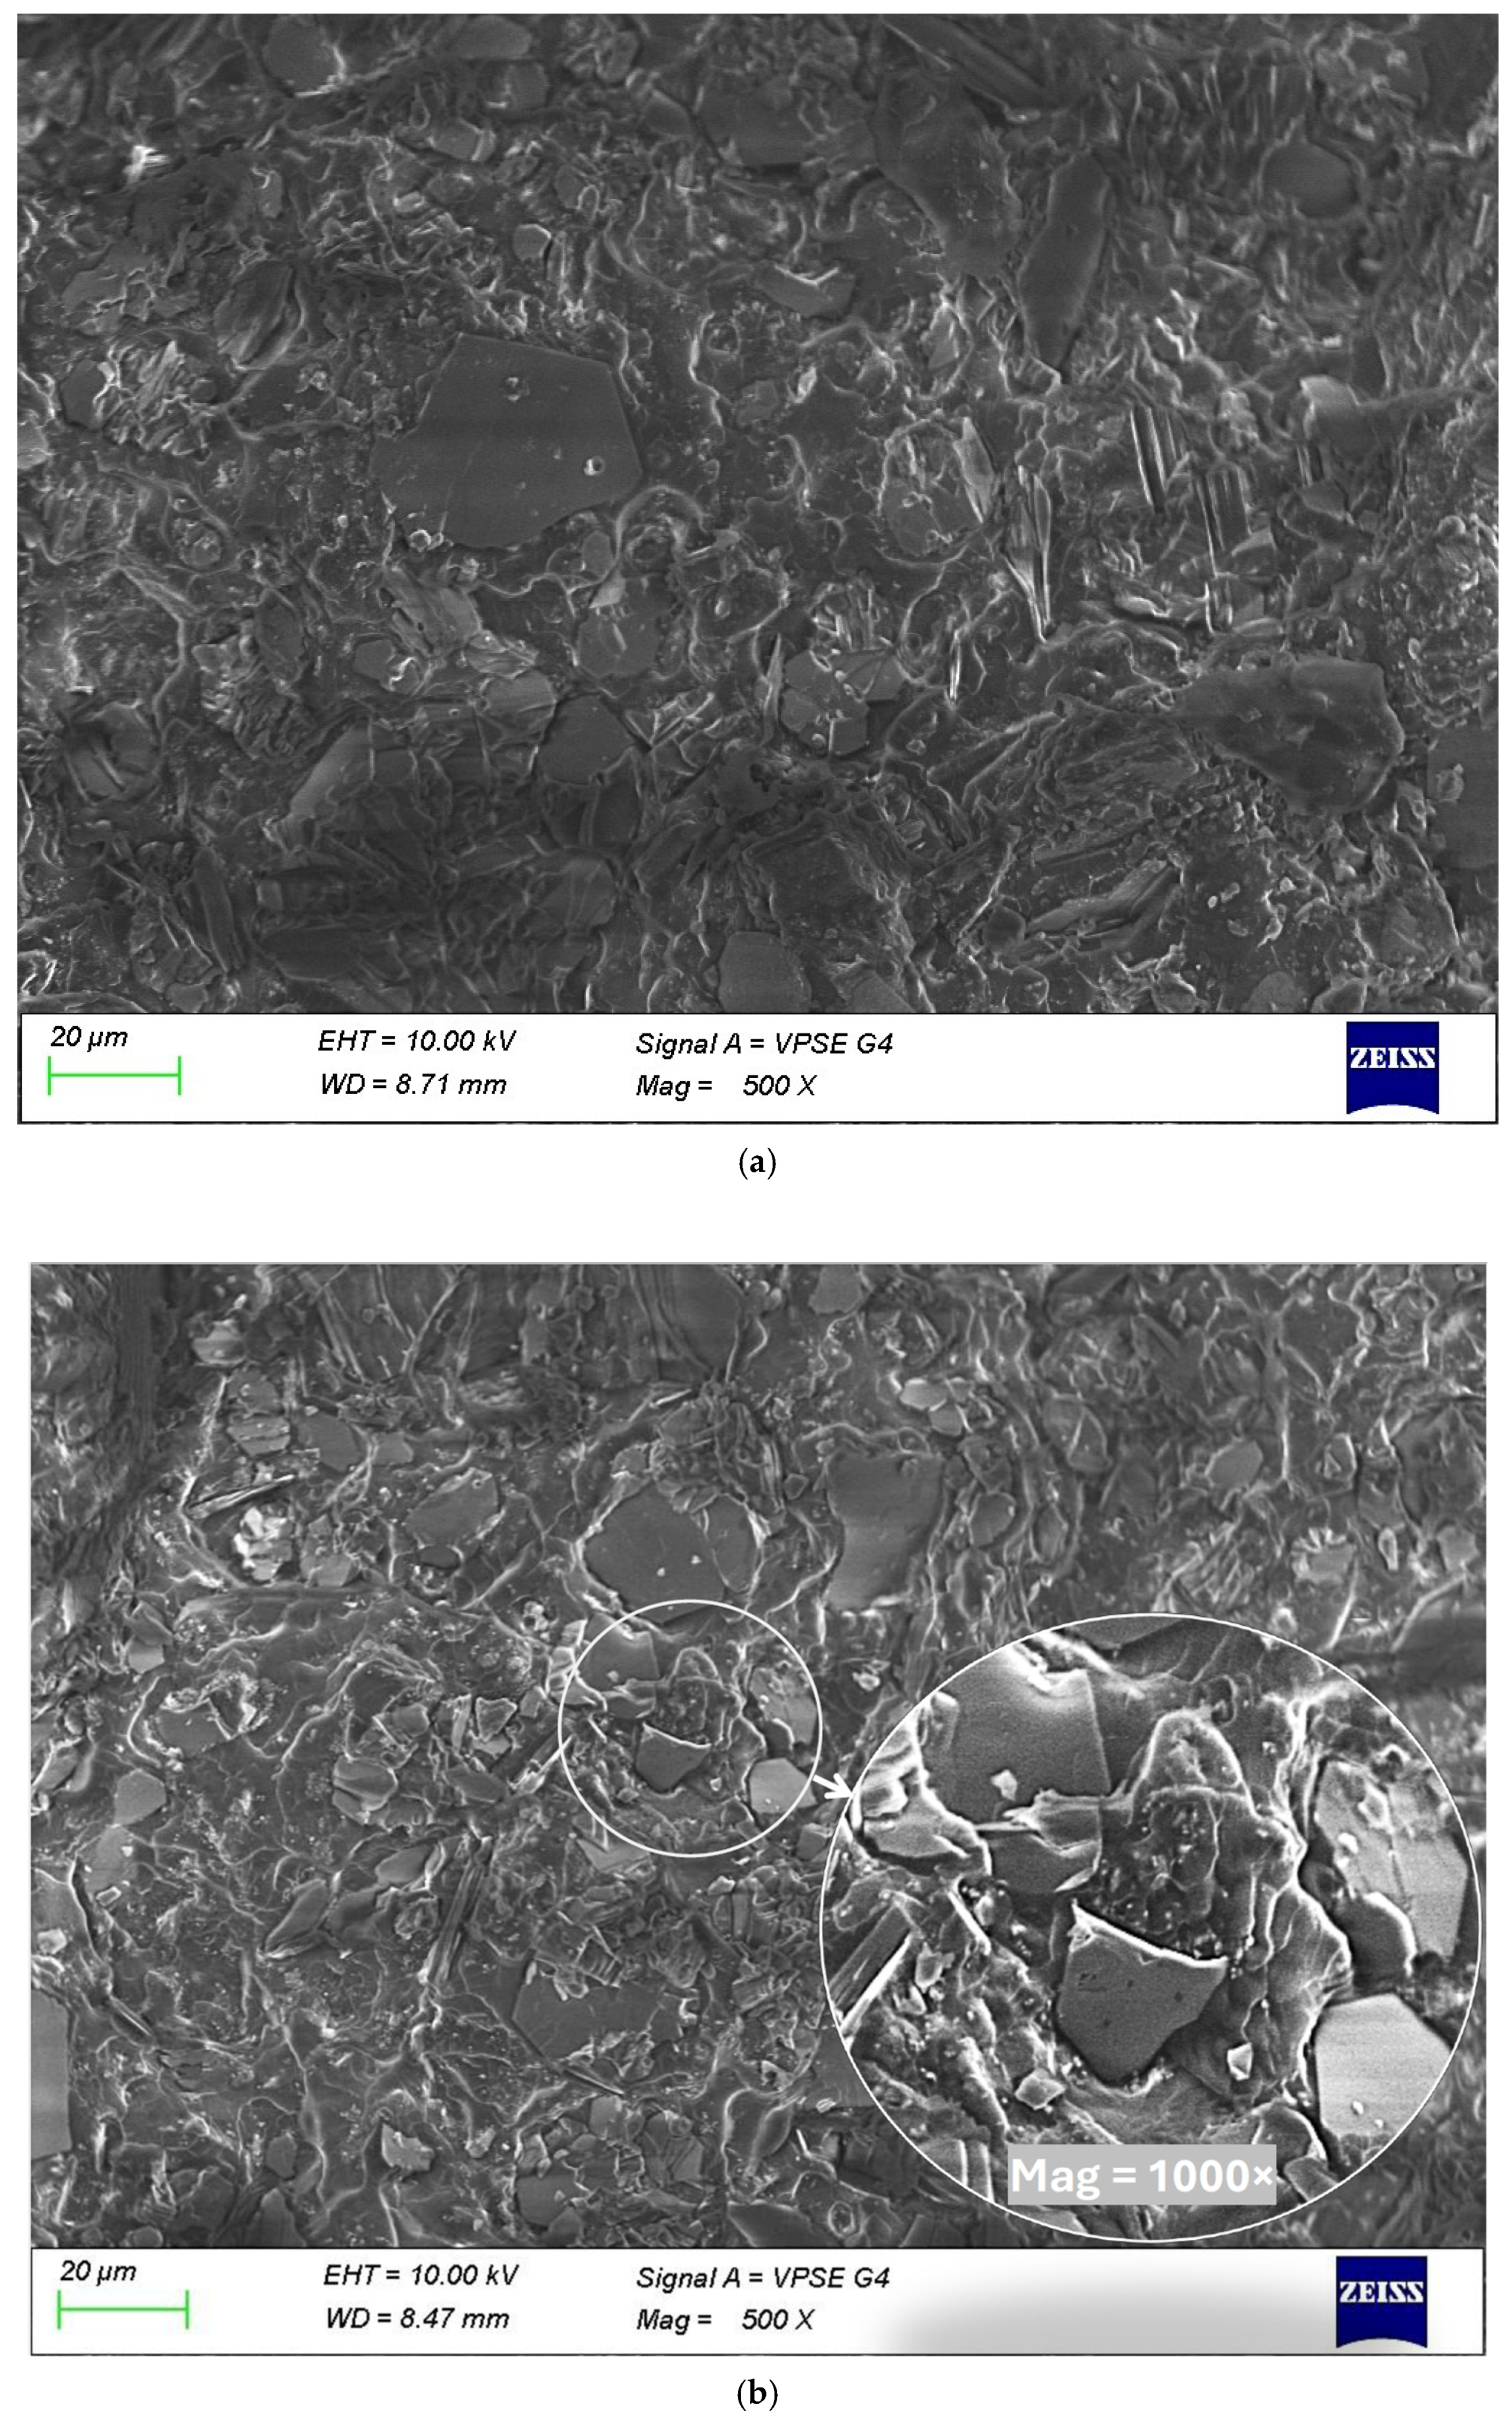
The SEM micrograph (500×) of the fracture surface of the unheated PMMA/ATH composite (
Figure 13a) shows that the particles appear well integrated into the polymer phase, with minimal evidence of interfacial voids or debonding. The fracture morphology consists of smooth regions, indicative of brittle failure, and localized, rougher areas associated with filler–matrix interactions. The overall good adhesion between ATH and PMMA suggests efficient stress transfer, which is consistent with the observed flexural strength of the material.
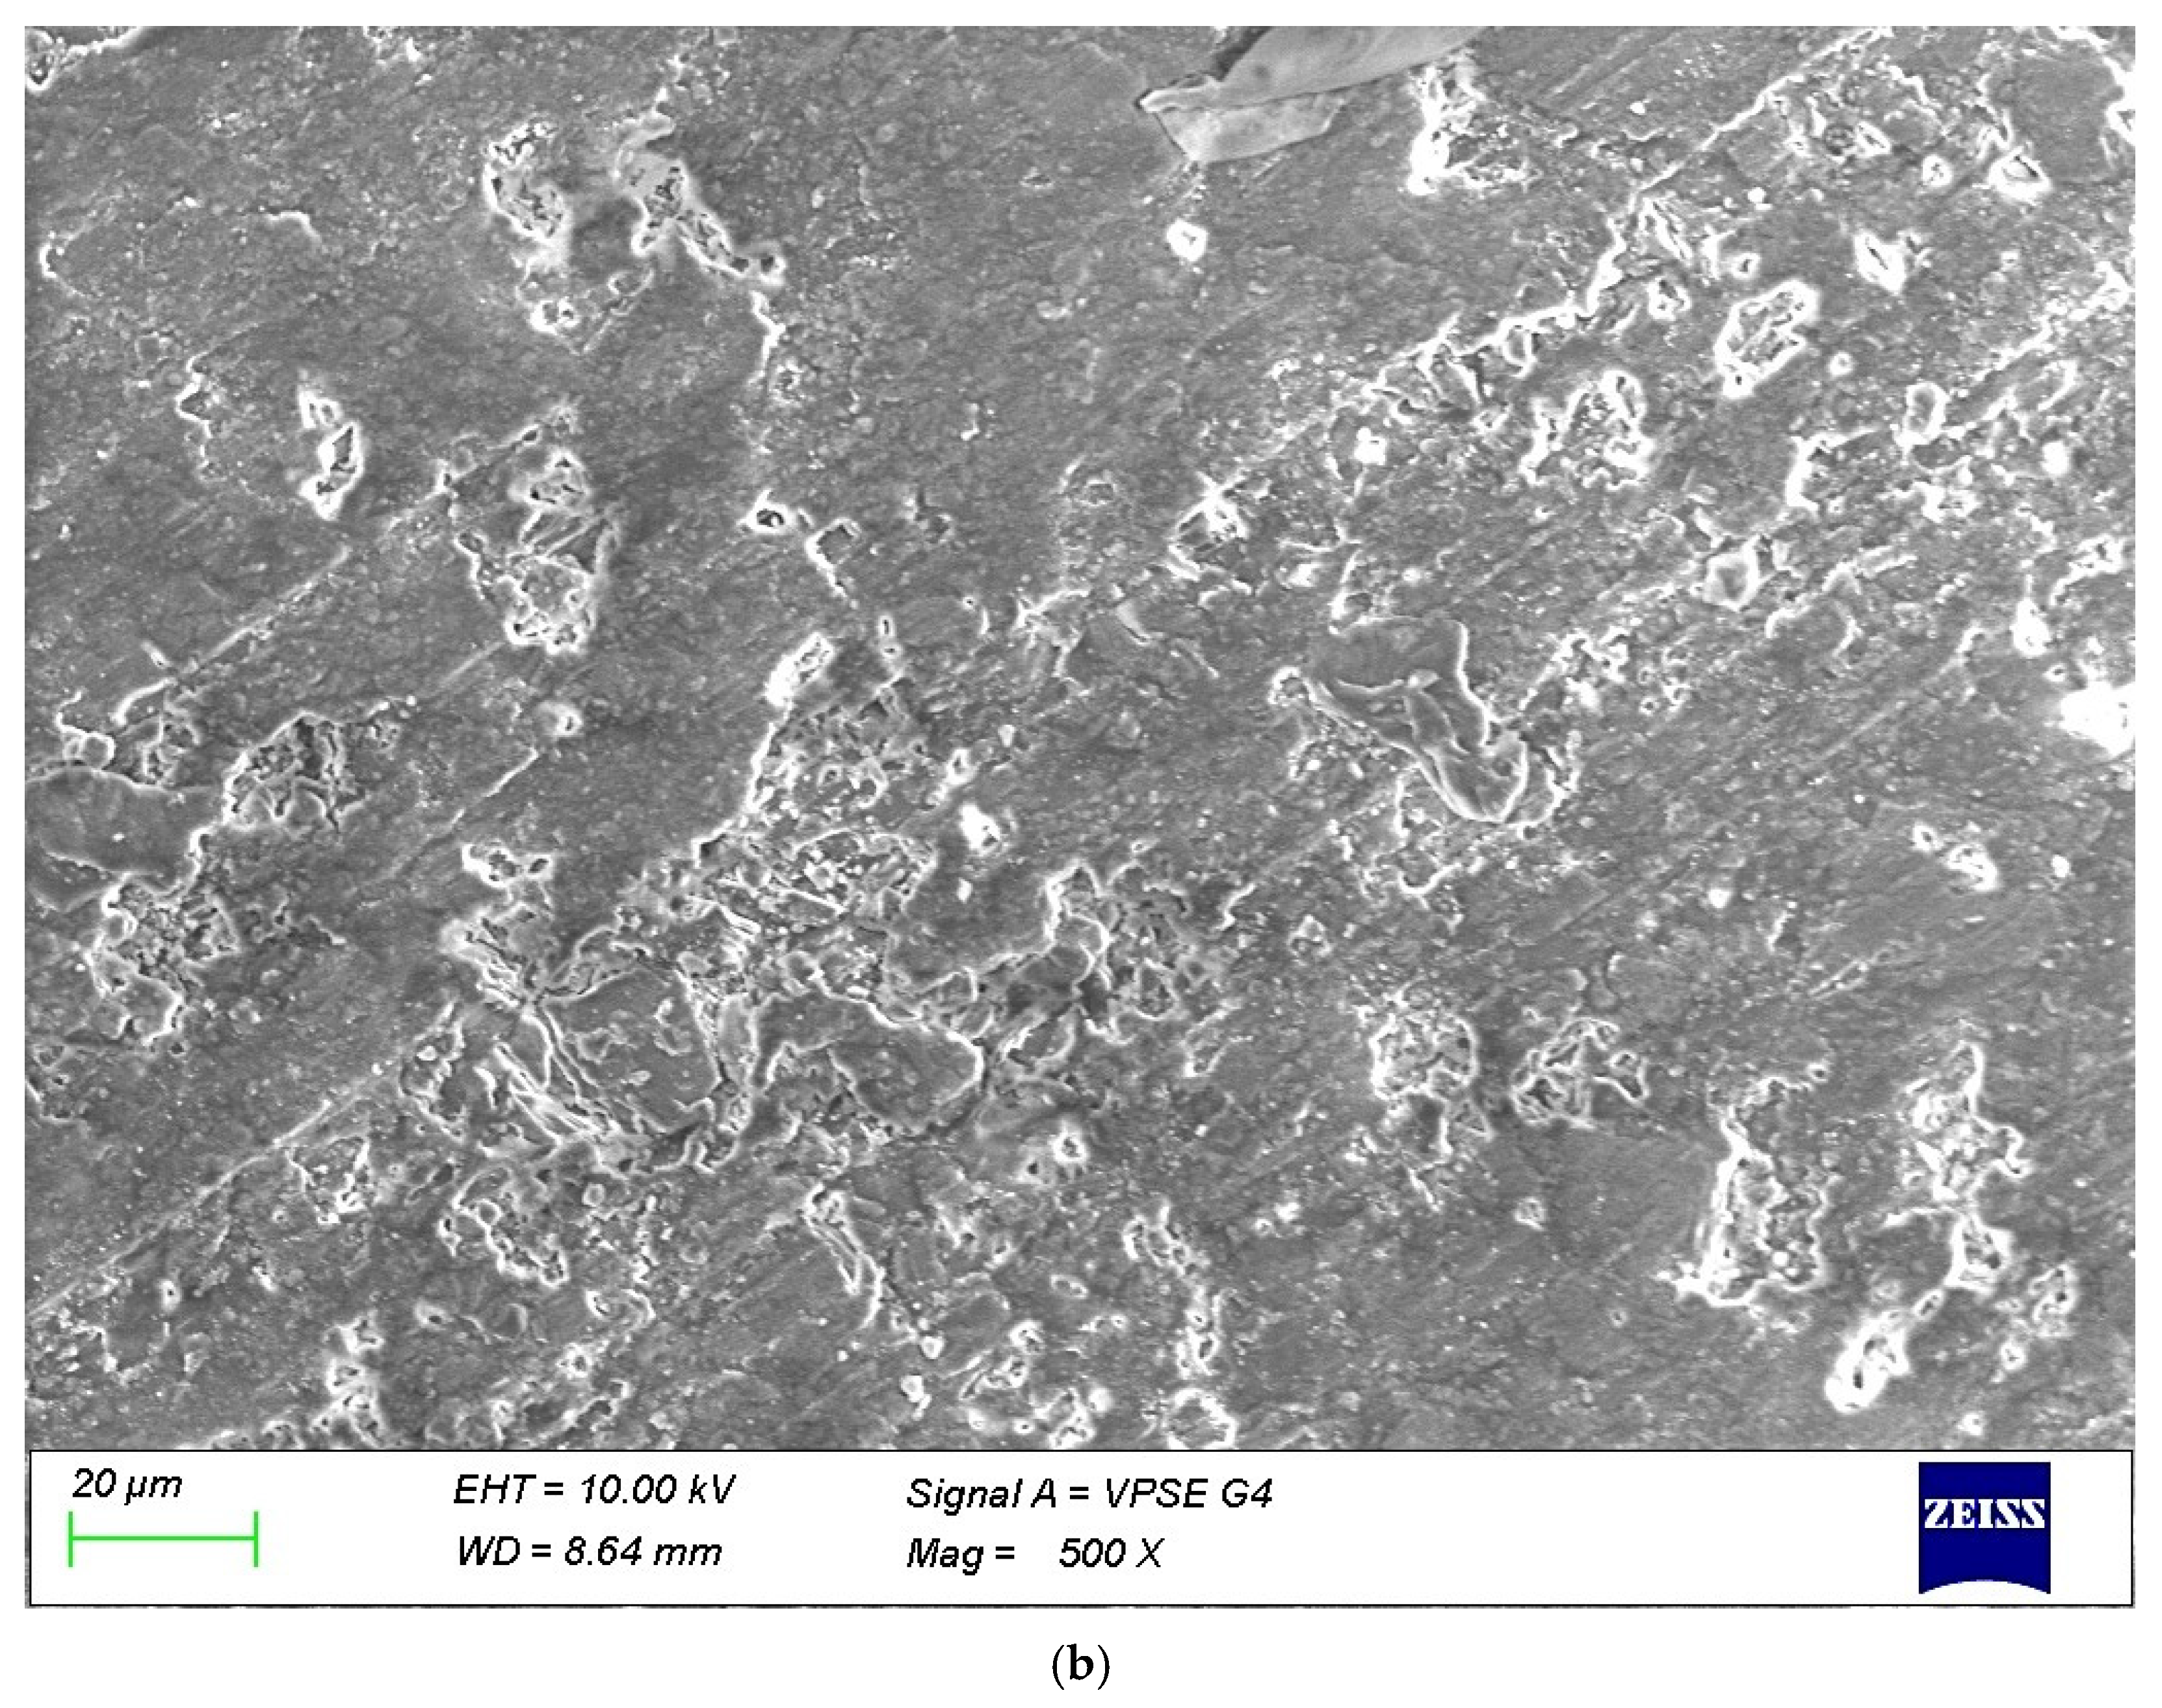
In contrast, the thermally treated composite (
Figure 13b) shows clear signs of microstructural separation between the particles and the resin after failure. Several ATH particles exhibit partial detachment from the surrounding matrix, resulting in visible gaps at the interface. This most likely occurred due to a mismatch in thermal expansion between PMMA and ATH during heating and cooling. The fracture surface is markedly rougher, with the presence of microcracks, indicating an increased tendency toward brittle failure. The appearance of voids and cracks should indicate a reduced ability of the composite to redistribute stress, which would worsen its bending characteristics. However, this is not confirmed by the results for determining the flexural strength, and the likely explanation is that, as a result of heat treatment, the fracture occurs at the boundary between the matrix and filler without reducing the adhesion between them.
However, it should be noted that post-fracture SEM analysis (10 kV, ~1000×) visualizes the fracture surface rather than the undamaged microstructure; therefore, increased porosity at the fracture surface does not necessarily indicate weakening of the fracture surface in the volume. We assumed that when heated, the resin envelops the particles better (homogenization) and when cooled, they cool together, which is probably why the boundary between resin and particles is more clearly visible upon breakage.
4. Discussion
The density of the two main groups (Kerrock and Corian) included in the PMMA/ATH composites studied corresponds to that declared by the manufacturers. No declared density was found for BetaCryl; however, the results indicate that it falls within the range of densities reported by other manufacturers. All types of Kerrock composites exceed the declared lower limit of 1680 kg/m3. For Corian, only Fossil, with a thickness of 12 mm, is slightly below the declared 1700 kg/m3, with a measured value of 1689 kg/m3.
Six of the materials examined are slightly below nominal thickness, while five are above nominal thickness. The differences range from +0.098 to −0.229 mm.
Overall, the measured flexural properties fall within the industry window reported for PMMA/ATH solid surface materials. For Kerrock, all flexural strengths from this study (51–79 MPa; LS means) lie inside the declared 49–80 MPa range. The flexural moduli are mainly within the specified range of 8600–9200 MPa. One solid surface is slightly below (4_Ke12: 8214 MPa; −4.6% vs. the lower bound), and one is slightly above (Ke12_8101: 9361 MPa; +1.8% vs. the upper bound); the remainder are within range. For Corian, the established strengths in this study are 2.7–7.7% lower than the catalog value (68.95 MPa), whereas moduli are 4.2–13.5% higher than the catalog 8273 MPa—differences plausibly explained by test-method details (ISO/ASTM, secant vs. tangent modulus), thickness/colour formulation, conditioning, and edge preparation. For BetaCryl, catalog flexural data are not provided, and the results from this study (σf = 67.2 MPa, Ef = 8360 MPa at ρ = 1705 kg/m3) are consistent with the ranges reported for other brands of similar composition. The published data on σf and Ef for HI-MACS, Hanex, Krion, etc. (σf = 64–78 MPa; Ef = 8300–12,000 MPa) clearly outline the data from the current study. In this study, the flexural strength (51–79 MPa) overlaps with the ranges reported by manufacturers, and the obtained modulus (7700–9400 MPa) falls within the low to medium range of the brands that declare very high stiffness (≥10,000 MPa).
The results of the PMMA/ATH flexural strength test in this study are within the range of data cited in the literature. For Kerrock, the flexural strength and modulus differ from the data obtained according to EN 310 for 6 and 12 mm (MOR 70–71 MPa; MOE 9800–9900 MPa) [
18,
37]. The flexural strength is higher when tested according to ISO 178, while the flexural modulus is lower. For Corian, the flexural strength (64–67 MPa) is below the value obtained according to EN 310 (91 MPa), but corresponds to the data according to ISO 178 (
Ef, = 8000–9200 MPa;
σf = 57–74 MPa) [
21] and 75 MPa reported according to the same standard [
23]. A slight decrease in flexural strength with an increase in thickness from 6 to 12 mm, as reported in the literature according to EN 310, is also observed in the present study for the Kerrock series [
18].
The density of PMMA/ATH composites (depending on the amount of ATH) reliably increases the stiffness of the solid surface as expected. However, it does not improve their strength, which is determined by crack formation/propagation—surface and edge quality, micropores, particle size/shape distribution, and adhesion between the matrix and filler. In practice, moderate densification is effective for increasing Ef, while increasing σf requires microstructure control (defect suppression, optimised particle morphology, and improved interfacial bonding, e.g., silane treatment).
When comparing the Ef with σf, only a weak correlation was observed between the PMMA/ATH composites (Pearson r ≈ 0.14): the most rigid (6_Co12, 17_Ke12_8101) is not the strongest in terms of σf. In contrast, the composites with the highest strength (21_Ke8_M124, 1_Ke6, 4_Ke12) showed an average or lower modulus. This distinction suggests that microstructural factors determining crack initiation/propagation (e.g., defect population, matrix-filler) control strength more strongly than overall hardness, which is determined by composition and filler loading/distribution.
The mechanical tests and SEM observations together provide a coherent explanation of the thermo-mechanical response of PMMA/ATH composites. The measured increase in flexural strength of approximately 7% and ultimate strain of approximately 12% after heating indicates stress relaxation and enhanced plasticity, without compromising stiffness, which is consistent with the demands of thermoforming. Our observation that post-heating does not reduce Ef yet increases σf and εf is consistent with glassy-polymer mechanics, where strain-rate and temperature effects near and above Tg, along with the underlying crazing vs. shear-yielding asymmetry, rationalize the grade-dependent strength/strain gains after thermal exposure and cooling. Taken together, the results highlight an effect that controlled heating can be used beneficially to improve formability and modestly increase strength.
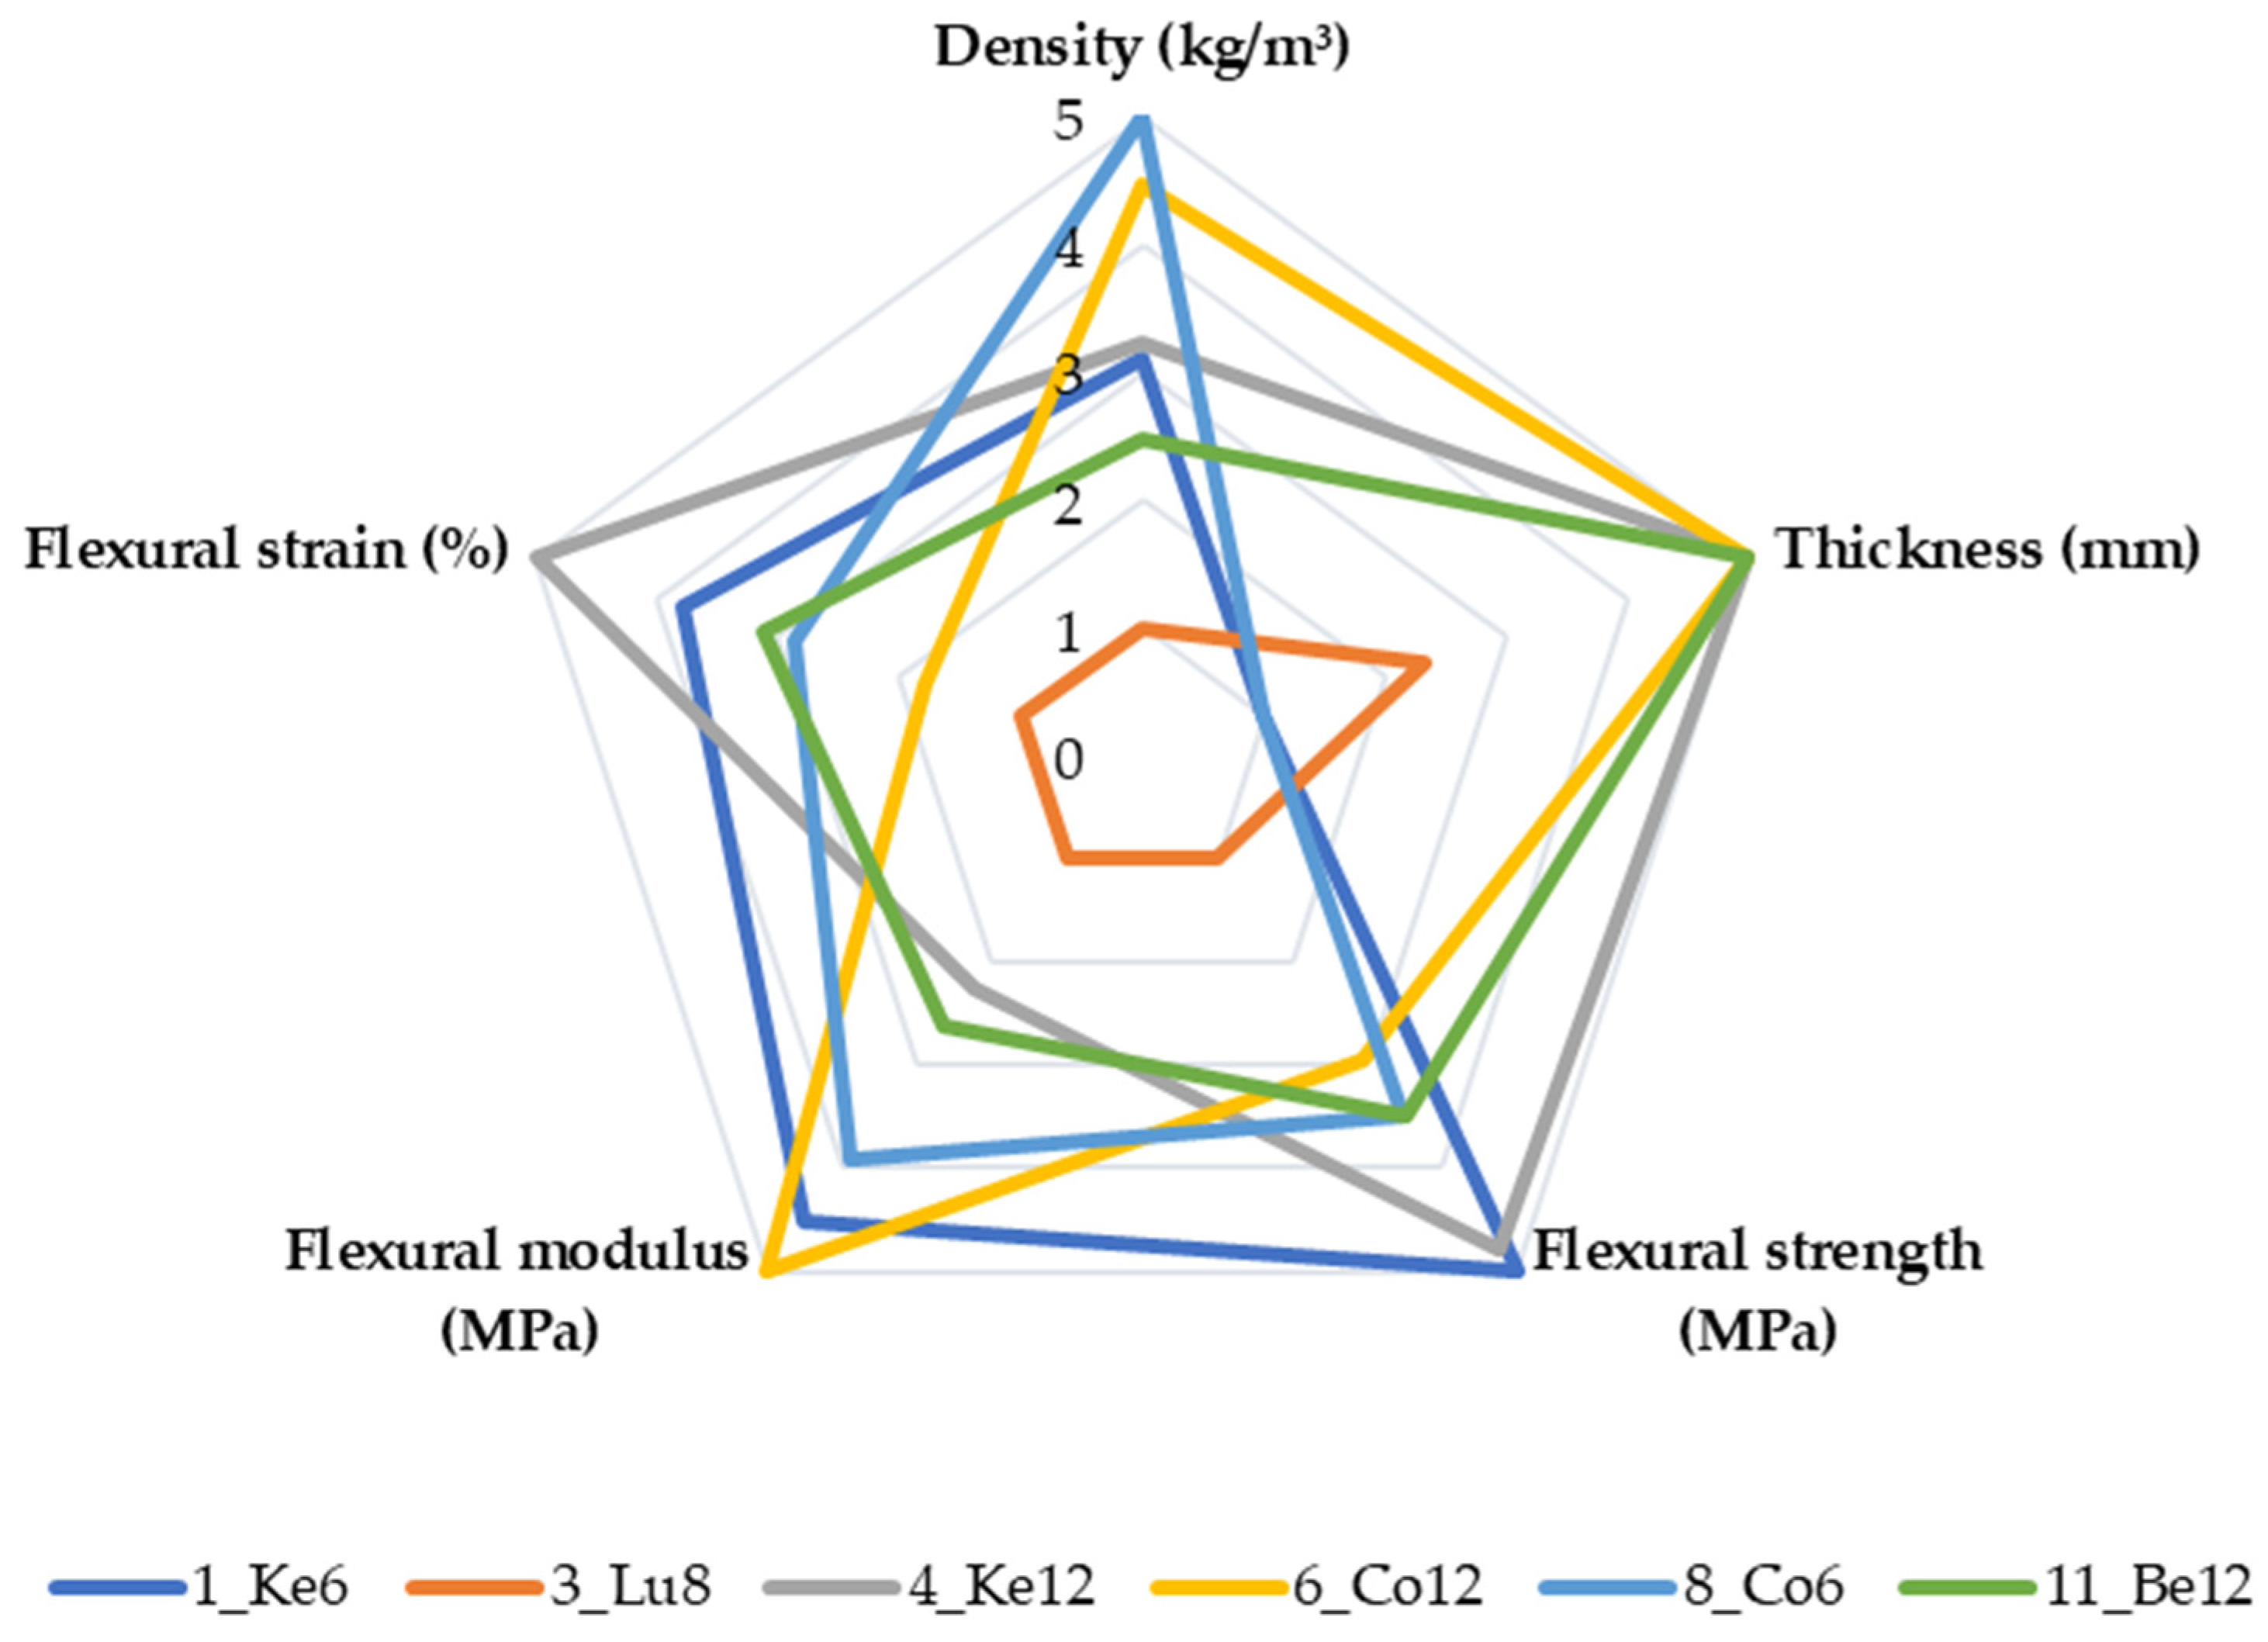
The radar chart in
Figure 14 compares the PMMA/ATH composites based on several physical and mechanical indicators. Density, thickness, flexural strength, flexural modulus, and flexural strain were mapped to a standard 1–5 scale using fixed reference limits (density: 1650–1800 kg/m
3; thickness: 6–12 mm; flexural strength: 50–100 MPa; flexural modulus: 7000–10,000 MPa; flexural strain: 0.80–1.60%). The minimum of each range corresponds to 1 and the maximum to 5; the same scaling is applied to all materials and figures for comparability. A separate coloured polygon represents each material; the further out the line is on a given axis, the higher the relative value of that parameter. The shape of the polygon highlights the strengths and compromises of each material, while overlaps indicate similarities between them.
5. Conclusions
The results of the study indicate that PMMA/ATH composites are suitable for both load-bearing and decorative elements, with the choice of brand and thickness being crucial for achieving a balance between elasticity and strength. The increased deformability after heating provides additional opportunities for complex 3D shapes without compromising strength.
Taken together, the laboratory results are broadly consistent with manufacturers’ declarations. Minor deviations—lower σf for Corian and a few Kerrock moduli marginally outside the 8600–9200 MPa window—are likely attributable to methodological and formulation differences rather than substantive inconsistencies.
The tested PMMA/ATH composites are statistically grouped into three clearly distinguishable strength levels: high (76–79 MPa), medium (63–67 MPa), and low (51–55 MPa). This classification is important when selecting materials for load-bearing furniture or architectural elements.
Higher density increases the flexural modulus but does not lead to higher flexural strength. This shows that σf is mainly controlled by the microstructure (micropores, morphology, and adhesion of ATH particles) and not only by the amount of filler.
Heat treatment and subsequent cooling significantly influence flexural strength and strain. An increase of an average of 7% is observed for σf, and an increase of approximately 12% for εf. The effect is most strongly expressed in Kerrock 12 mm (1160, 9082), Kerrock 8 mm (M124), and BetaCryl 12 mm, where the increase is between 10 and 17% for flexural strength and between 13 and 22% for flexural strain. This indicates a relaxation of residual stresses and an increase in plasticity, consistent with an annealing-driven increase in ductility. Ef remains effectively unchanged after heating and cooling, which is important for maintaining structural rigidity after thermoforming. Shock cooling does not provide any additional benefits.
The group of materials with homogeneous white colors (Corian 6 and 12 mm, Kerrock 6 and 12 mm, and Betacryl 12 mm) is balanced, reliable in terms of mechanical properties, and has predictable thermal advantages. In contrast, the group of materials that contain decorative chips—Kerrock 12 mm (1160, 8101, and 9082) and Corian 12 (Fossil) exhibits lower strength and more variable reactions to thermal treatment. This group is most suitable when decorative effects are a top priority.
In conclusion, beyond furnishing brand-comparative data for interior/furniture applications, this study contributes to polymer composite science by providing an independent dataset of specific flexural properties (σ/ρ, E/ρ) across commercial PMMA/ATH grades under an ISO-178 framework and demonstrating that Ef scales with density while microstructural/interfacial defects govern σf, thus separating stiffness from strength controls. The results showed that heat treatment (160 °C) and cooling relax residual stresses and increase σf and εf, with no measurable loss in Ef, offering a processing lever for tuning performance. These findings, supported by SEM fracture-surface observations, are directly relevant to micromechanical modeling and interface engineering in polymer–mineral particulate composites. This study yields practical guidance and a reusable dataset of specific properties for polymer composite research and design. Practitioners should therefore use strain-rate- and temperature-appropriate allowables for design.
