Article

Enhanced FDM Printing Accuracy in Low-Carbon Production Mode Using RSM-NSGA-II and Entropy Weight TOPSIS Method

1
School of Automotive and Mechanical Engineering, Lu’an Vocational Technical College, Lu’an 237000, China
2
College of Materials Science and Engineering, Jiangsu University, Zhenjiang 212013, China
3
Jingjiang College, Jiangsu University, Zhenjiang 212028, China
*
Author to whom correspondence should be addressed.
J. Compos. Sci. 2025, 9(11), 621; https://doi.org/10.3390/jcs9110621 (registering DOI)
Submission received: 9 October 2025 / Revised: 31 October 2025 / Accepted: 4 November 2025 / Published: 10 November 2025
(This article belongs to the Special Issue 3D Printing and Additive Manufacturing of Composites)

Abstract

Compared to traditional processes, fused deposition modeling 3D printing can manufacture parts of various shapes without the need for additional equipment, moulds, fixtures, or other tools. Its excellent characteristics have been widely applied in many industries. However, balancing product quality with low-carbon production has always been a pressing issue for 3D printing companies to address. To improve the stability of 3D printing in terms of part size accuracy and sustainable development, an orthogonal experimental design method, RSM-NSGA-II, and an entropy weight TOPSIS method were employed to optimise the factors affecting size accuracy and carbon emissions. The layer height, nozzle temperature, filling density, first layer height, and printing pattern were selected as factor variables, and the circular runout tolerance value and carbon emissions of printed parts were set as optimisation objectives. An L18 orthogonal experimental design was established. The influence of process parameters on quality indicators and the optimal combination of process parameters were analysed through range calculation. In addition, the NSGA-II-based optimisation model was constructed using the experimental design method in response surface methodology, and combined with the entropy weight TOPSIS method, to determine the optimal FDM 3D printing process parameter scheme with the best comprehensive performance. The results indicate that the response surface model established in this paper has good adaptability. When the layer height is 0.2 mm, the nozzle temperature is 243 °C, the filling density is 70%, and the first layer height is 0.15 mm, the circular runout tolerance value and carbon emissions are reduced by 64.29% and 53.45% respectively, compared to the original values. This study provides a theoretical basis and technical support for optimising the FDM manufacturing process in low-carbon and environmentally friendly production.

1. Introduction

Climate change has become one of the most critical and urgent environmental challenges of this century, posing a significant threat to human survival and socio-economic activities. Given the increasing tension between the need to address climate change and the necessity of economic development, adopting a balanced approach to these issues remains a crucial consideration in global climate governance [1,2,3]. We must address this challenge in depth and rigorously to promote sustainable solutions. It is urgent to reduce carbon emissions during the manufacturing process to implement sustainable development strategies [4,5,6].
Additive manufacturing is undergoing a noteworthy transformation from prototype development to mass production. This technology has several advantages, including design flexibility, efficient material utilization, and the ability to customize solutions [7,8]. The global additive manufacturing market shows strong growth potential, with a compound annual growth rate exceeding 20%. The forecast suggests that by 2030, this number may exceed $100 billion, indicating a promising future for this innovative field [9]. In addition, the share of industrial-grade applications is expected to expand, especially in high-end manufacturing and rapid maintenance scenarios, which is crucial for improving operational efficiency. FDM has attracted attention due to its cost-effectiveness, user friendliness, and material diversity [10,11]. Looking ahead, the integration of sustainable materials and hybrid manufacturing systems is expected to enhance the importance of FDM in promoting sustainable manufacturing practices and distributed production, thereby supporting economic and environmental goals [12]. AM is a new manufacturing technology that utilizes computer-aided design data to deposit materials layer by layer, thereby manufacturing solid objects. This method is in sharp contrast to traditional subtractive manufacturing techniques, which involve removing material from the blank [13,14,15]. The “bottom-up” approach of additive manufacturing offers significant advantages, including shortened manufacturing cycles and reduced production costs, making it an ideal solution for rapidly producing small batches, customized components, and complex geometries. Currently, additive manufacturing has been effectively applied in various fields. Additive manufacturing is positioned as a key force for the sustainable development of the manufacturing industry. Among numerous additive manufacturing technologies, fused deposition modeling is one of the most widely used methods [16,17,18].
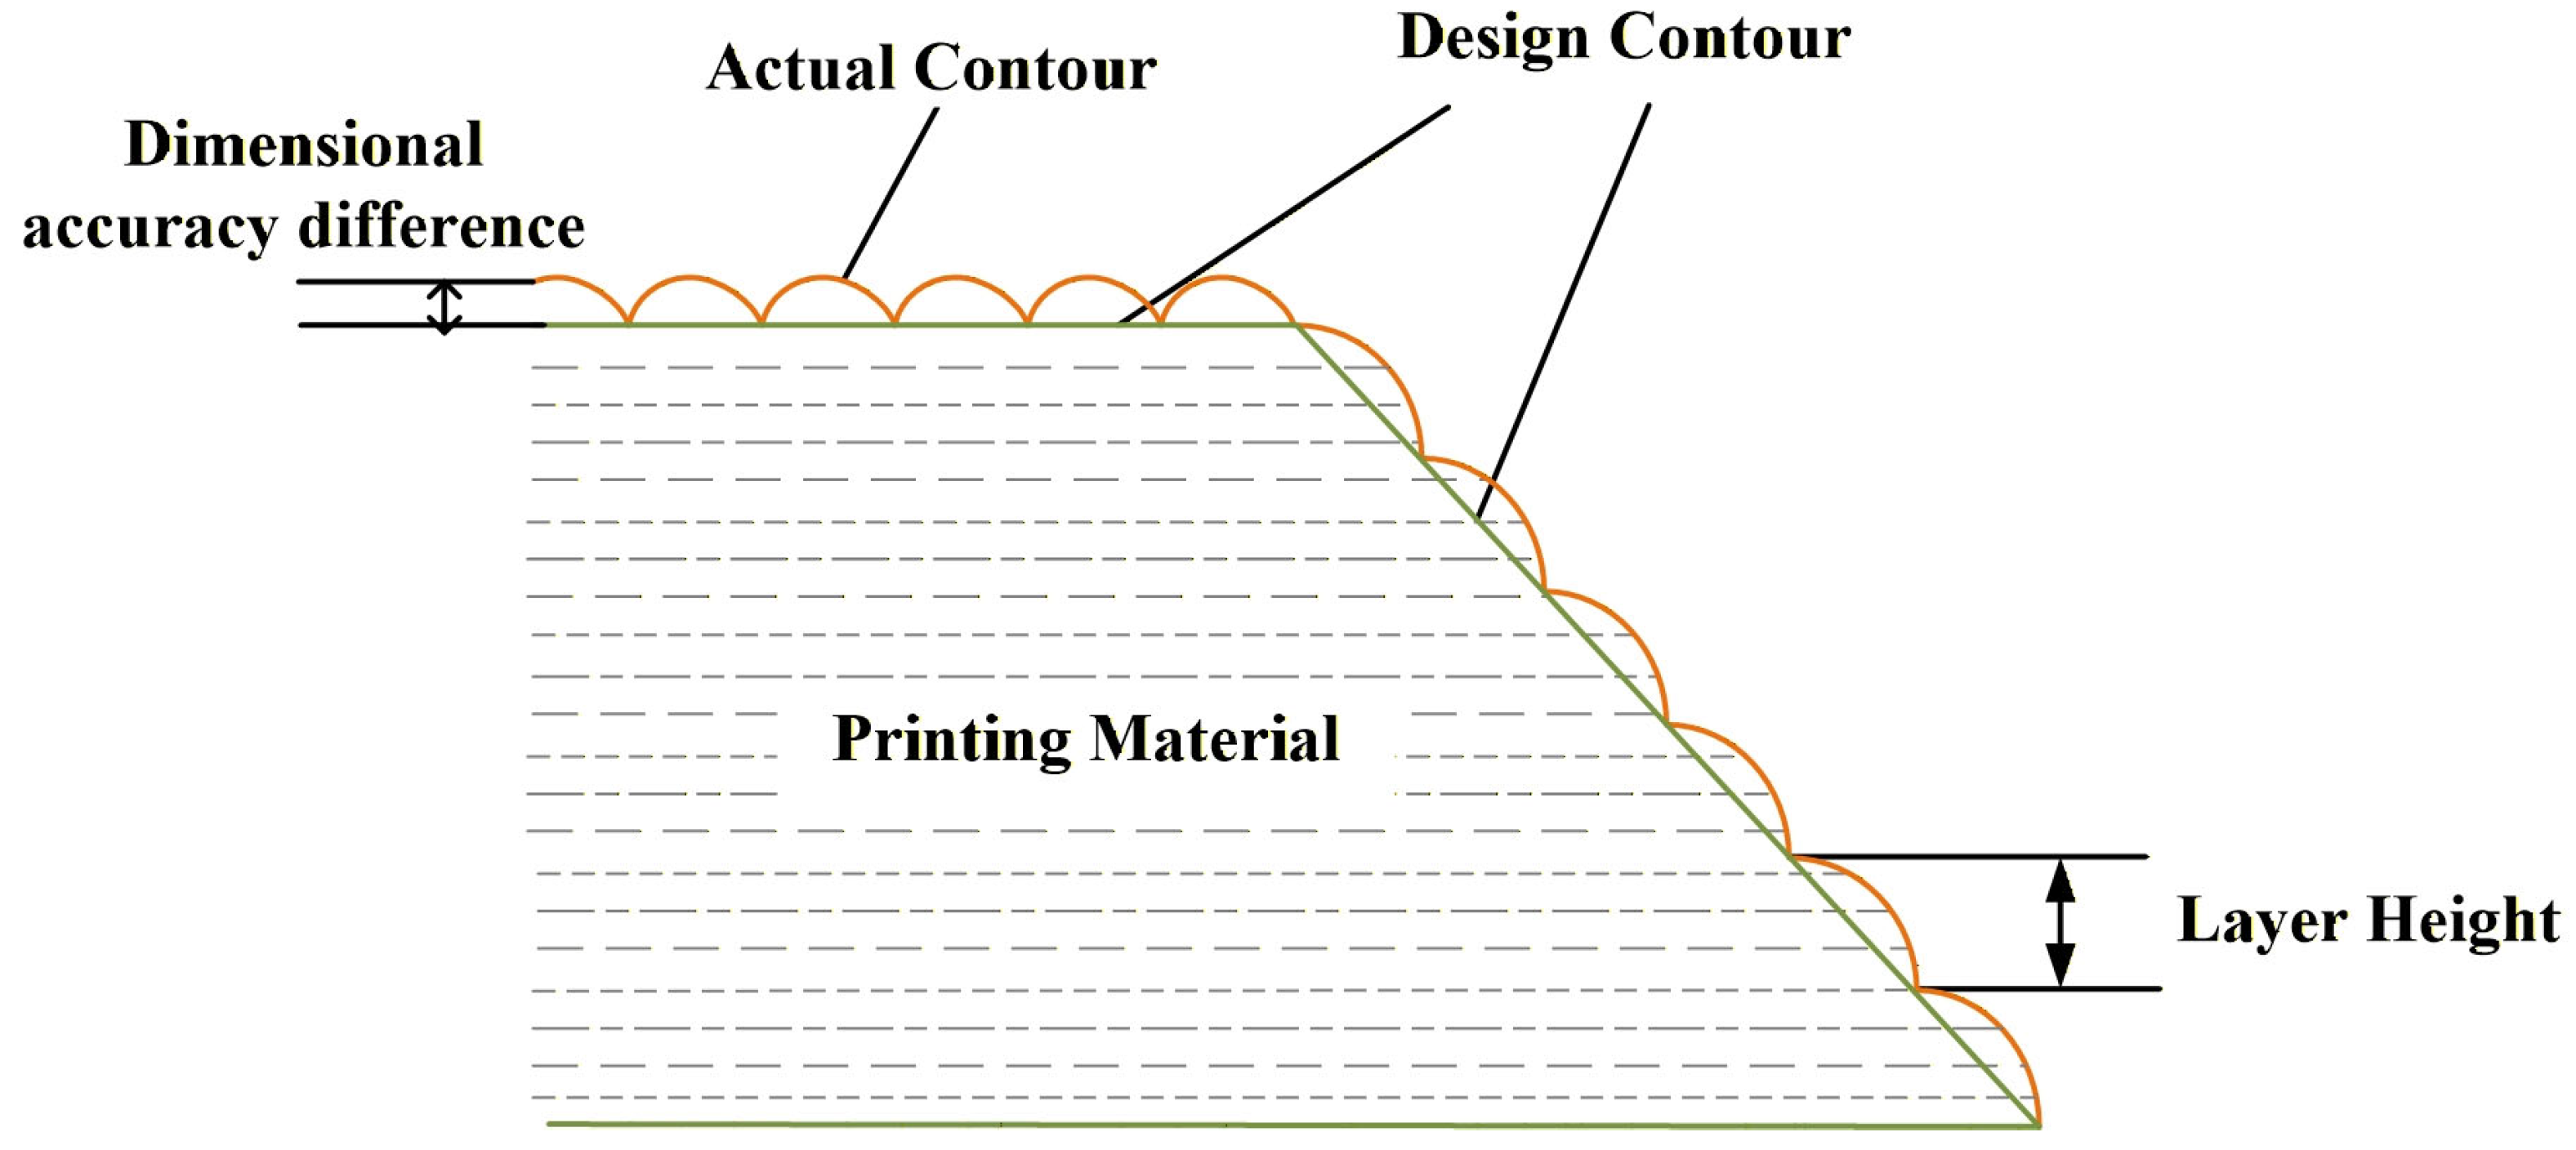
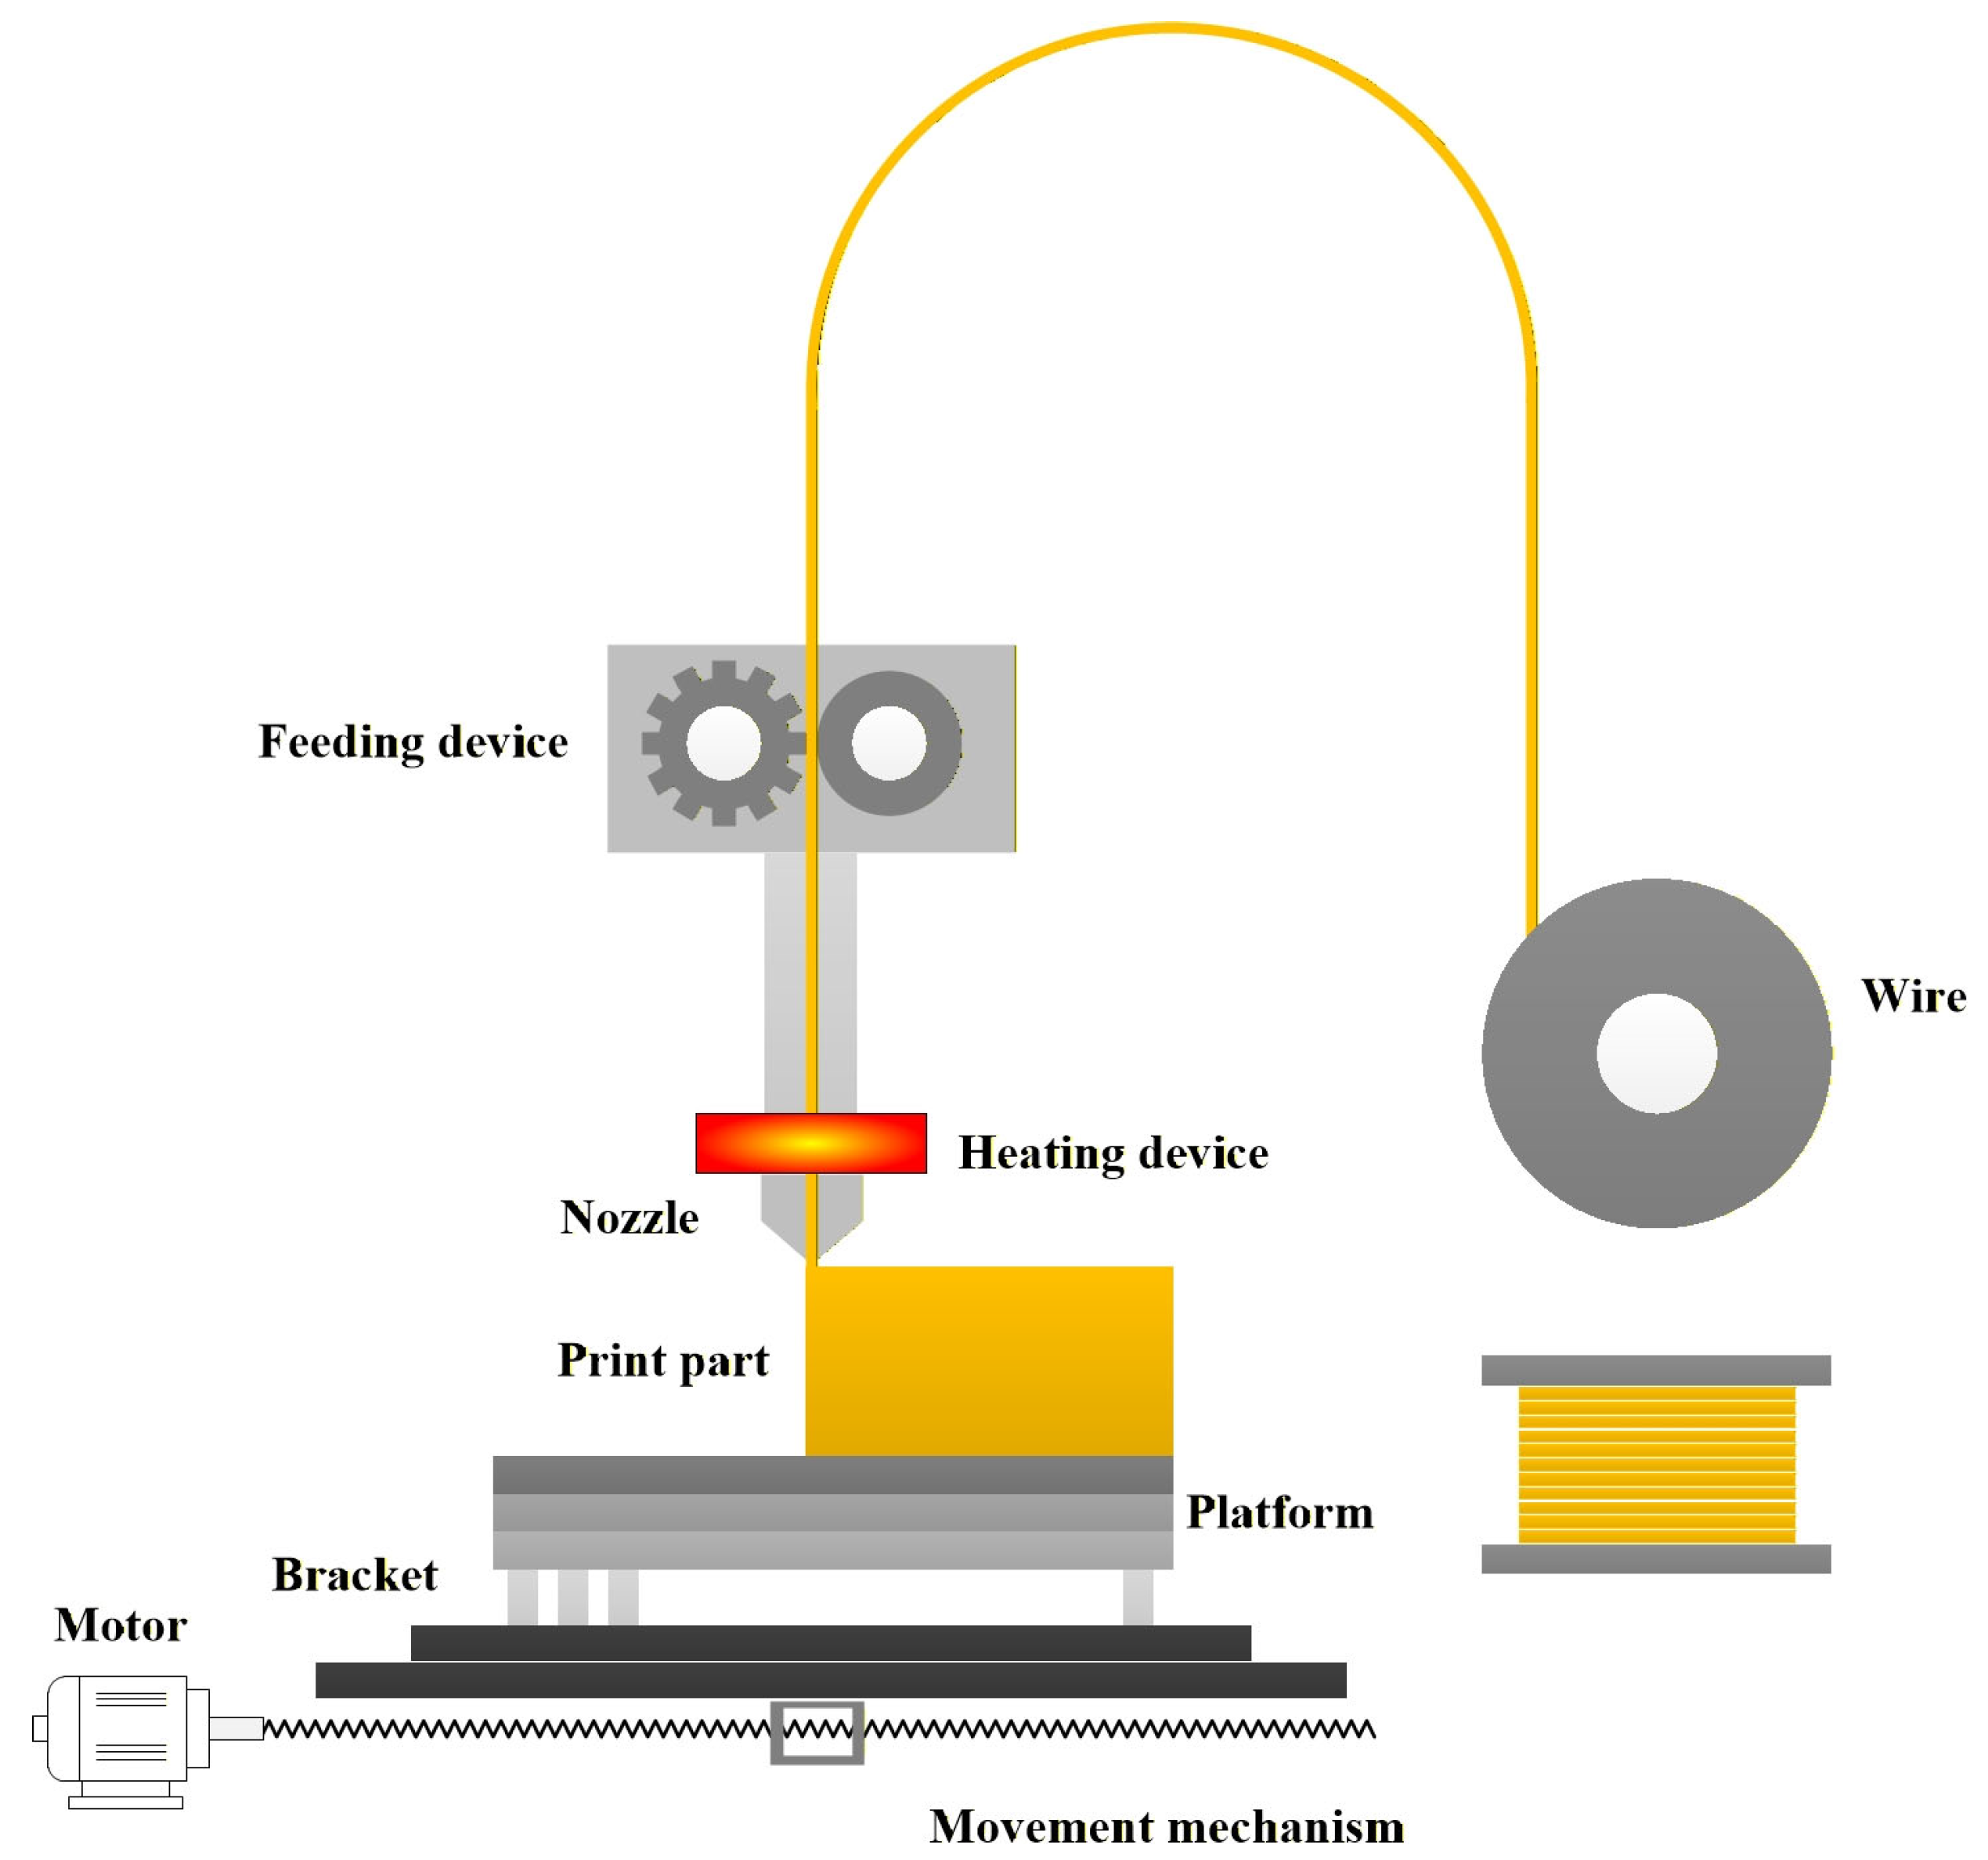
FDM 3D printing technology is a digital manufacturing technique that produces three-dimensional entities by stacking materials layer by layer, enabling the rapid transformation of designs into physical objects and accelerating production cycles [19,20,21,22]. The schematic diagram of FDM 3D printing is shown in Figure 1. Compared with traditional manufacturing techniques, it can achieve precise material usage and reduce waste. Due to its high degree of production freedom and resource utilization, 3D printing has become a widely used manufacturing technology, with its applications in aerospace, medical, automotive, and precision manufacturing fields becoming increasingly widespread [23,24,25]. The FDM printing process can be primarily divided into three stages: feeding, melt extrusion, and deposition moulding [26,27]. Each stage is not only closely related to printing materials, but also inseparable from printing equipment and pre-printing preparation work [28].
The characteristics of FDM include its economic efficiency, simplicity of operation, compatibility with various materials, and high production efficiency. Although FDM technology has significant advantages, it also faces some challenges that may hinder its long-term effectiveness [29]. The limited dimensional accuracy, insufficient surface quality, and poor mechanical performance pose significant obstacles. Therefore, improving the quality of FDM-manufactured parts is an urgent issue that requires attention. Addressing these challenges is crucial for fully unleashing the potential of this innovative technology and advancing its application in the manufacturing industry [30]. The process parameters related to fused deposition modeling play a crucial role in determining the quality of plastic parts during layer-by-layer printing [31,32]. These parameters are interrelated and jointly affect fundamental performance indicators, including dimensional accuracy, mechanical strength, surface smoothness, and overall component durability. By setting reasonable process parameters, it is possible to improve the quality of parts significantly, meet the requirements of various specific applications, and expand the application scope of FDM technology across multiple industries [33,34].
In studies conducted by numerous scholars, Marsavina et al. [35] investigated the performance characteristics of various FDM printers in generating tensile and fracture specimens from PLA. Their analysis carefully considered several manufacturing parameters, including forming direction, structural direction, and printer type. It evaluated the influence of process parameters on the tensile and fracture properties of the specimens. The results emphasise the importance of each parameter in influencing performance outcomes, highlighting the complexity of the FDM process. The work of Daly et al. [36] demonstrated a significant contribution to the effect of different FDM printing speeds on the tensile strength of ABS specimens. Similarly, Ouazzani et al. [37] identified printing speed, layer thickness, and extrusion temperature as key variables. They attempted to analyse the influence of FDM (Fused Deposition Modeling) process parameters on the surface quality of ABS parts using Taguchi experiments. The research results indicate that layer thickness has the most significant impact on surface quality. To improve surface quality, it is recommended to implement higher scanning speeds, reduce layer thickness, and select appropriate extrusion temperatures. In addition, Yankin et al. [38] employed orthogonal experiments and finite element analysis methods to investigate the effects of internal geometry, printing speed, and nozzle diameter on the fatigue life of FDM-printed ABS and nylon. Their analysis emphasises that nylon typically has better fatigue performance than ABS.
Figure 2 shows the surface microstructure of FDM melt deposition [39]. Additionally, printing platforms are typically designed with preset temperatures to enhance interlayer fusion and minimise the risk of warping. To improve the printing process, a fan cooling system is usually combined to cool the printing layer and protect the equipment [40,41].
The quality of fused deposition modeling products is closely related to the specific printing conditions used in the manufacturing process. The traditional printing configuration encompasses several key factors, including nozzle temperature, platform temperature, printing speed, grating angle, filling density, and layer thickness [42]. These factors are interrelated and collectively affect the mechanical strength and lifespan of the final product. Raising the temperature of the nozzle and platform can increase the available energy of the printing process, thereby enhancing the flowability and formability of the material [43]. This enhancement can improve the infiltration and diffusion of sedimentary filaments between layers, promote adequate interlayer adhesion, and significantly reduce the risk of warping [44]. In contrast, excessively high printing speeds may lead to incomplete and intermittent filament deposition, which can have adverse effects on the adhesion properties of the material [45]. In addition, the grating angle and filling density are key factors determining the mechanical strength of the final product. Higher filling density is usually associated with a smoother surface finish. In addition, specific porosity and filling structures help improve the damping and energy absorption capacity of printed components [46]. A significant advancement by Benié et al. [47]. The use of innovative dynamic simulations to correlate printing parameters with the diffusion, entanglement, and crystallisation phenomena of polymer chains. This method can predict the microstructure of printed products, enabling the accurate evaluation of their mechanical properties.
The dimensional accuracy of 3D-printed products is an essential indicator of whether they can be put into production use [26,29,48]. The moulding process parameters of plastic parts often affect their strength and stiffness, determining their service life [49,50]. Many researchers have conducted extensive research on improving the performance of 3D printed products [51,52,53]. Wang et al. [54] found through experiments that FDM process parameters can affect the quality of printed materials, including interlayer adhesion strength, air gap, and other factors, which are the main reasons for the different mechanical properties of printed materials. Hsueh et al. [55] found that printing angle and grating angle significantly affect the tensile properties of PLA materials. At the same time, UV curing reduces their ductility and increases brittleness. This rule was verified through experiments with different parameters. Rodríguez Panes et al. [56] conducted a comparative analysis of the tensile properties of PLA and ABS, two commonly used thermoplastic materials in FDM additive manufacturing. The study focused on investigating the influence of layer height, filling density, and layer direction on the mechanical properties of the materials. Yadav et al. [57] investigated the effects of filling density, material density, and extrusion temperature on the mechanical properties of multi-material parts printed using ME technology. In recent years, many researchers have studied the process parameters of FDM. To study the influence of process parameters on dimensional accuracy, a large number of experiments are required [58,59,60,61,62,63]. Reasonable experimental design is conducive to reducing experimental errors [64].
Fused Deposition Modeling (FDM) printing utilizes various materials, primarily derived from thermoplastic polymers. In industrial applications, commonly used materials include PEEK, PLA, acrylonitrile butadiene styrene (ABS), and polyvinyl alcohol (PVA) [65,66,67,68]. ABS has several beneficial properties, with a printing temperature range of 215 to 250 °C [68]. It has significant strength, high modulus, high temperature resistance, and UV radiation resistance, making it an ideal choice for shell applications. PVA is considered a water-soluble material, characterized by a printing temperature range of 160 to 230 °C, which allows for effective utilization at relatively low nozzle temperatures [67]. This material is mainly used as a support structure for hanging components during the printing process. On the contrary, PEEK requires a higher nozzle temperature of 340 to 440 °C [66]. It is known for its excellent mechanical properties, lubrication ability, and chemical resistance, making it an excellent choice for high-temperature environments, such as those encountered in aerospace applications and competitive racing. Polylactic acid (PLA) is a wholly organic and environmentally sustainable material recognized for its excellent biocompatibility and biodegradability [69]. It operates within a printing temperature range of 160 to 230 °C, making it highly suitable for processing. PLA is suitable for a wide range of applications, including basic applications and advanced fields such as biosensors and tissue engineering. The biological and chemical production technology of PLA has been established and demonstrated to be a low-cost, biodegradable, and recyclable material. Its utilization rate is showing a continuous upward trend, indicating that PLA has excellent potential for widespread use as a 3D printing material in the industrial field [70].
With the continuous development of modern processing technology, it is necessary to achieve sustainable development strategies, reduce carbon emissions during the manufacturing process, and enhance FDM printing accuracy. FDM printing equipment and printing moulding process parameters have become key factors in the manufacturing process. To enhance the stability of 3D printing in terms of dimensional accuracy and carbon emissions, this study optimised and analysed the influencing factors of dimensional accuracy and carbon emissions using the orthogonal experimental method, NSGA-II, and the entropy weight method. Taking layer height, nozzle temperature, filling density, first layer height, and filling pattern as factor variables, and plastic part circular runout tolerance and carbon emissions as optimization objectives, an L18 orthogonal experimental design was established to explore the effects of various parameters on tolerance and carbon emissions at different factor levels. Using the Box-Behnken experimental design method in RSM, a prediction model for jump tolerance and carbon emissions is established. The NSGA-II coupled entropy weight TOPSIS method is then employed to determine the optimal combination scheme for comprehensive performance. This article aims to develop a production system that reduces greenhouse gas emissions and improves FDM printing accuracy.

2. Materials and Methods

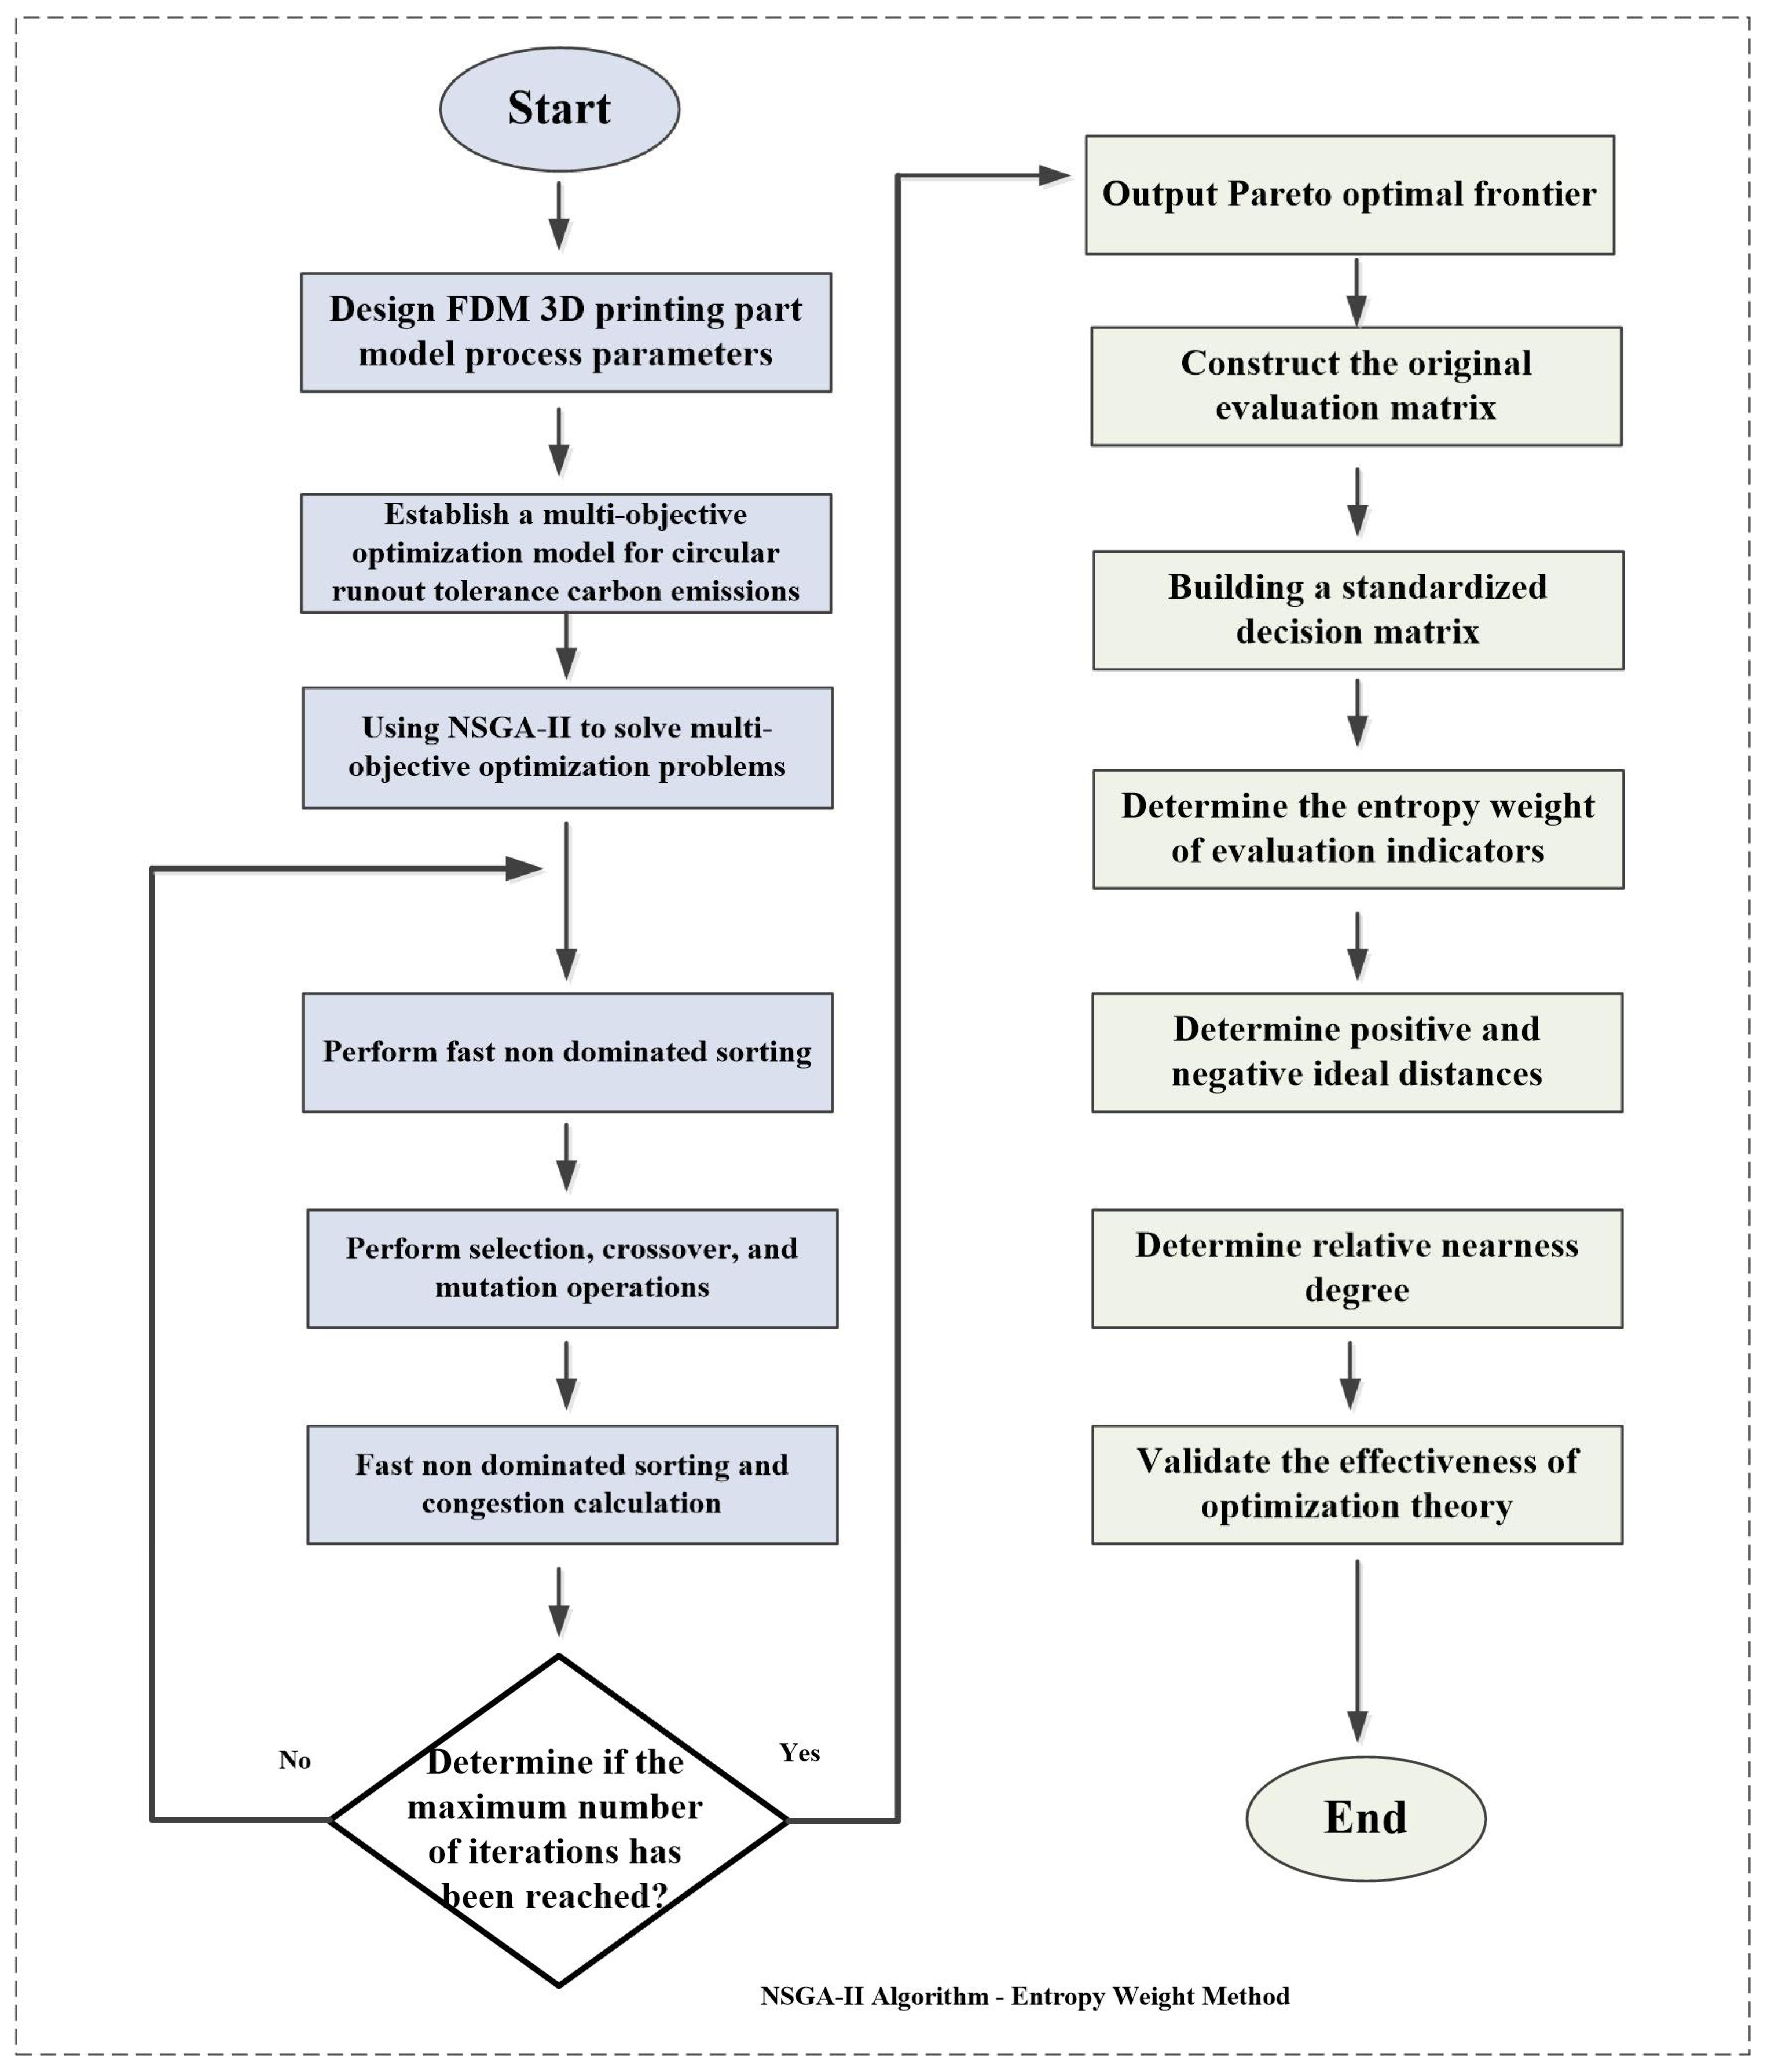
The flowchart of the specific experimental procedure is shown in Figure 3.
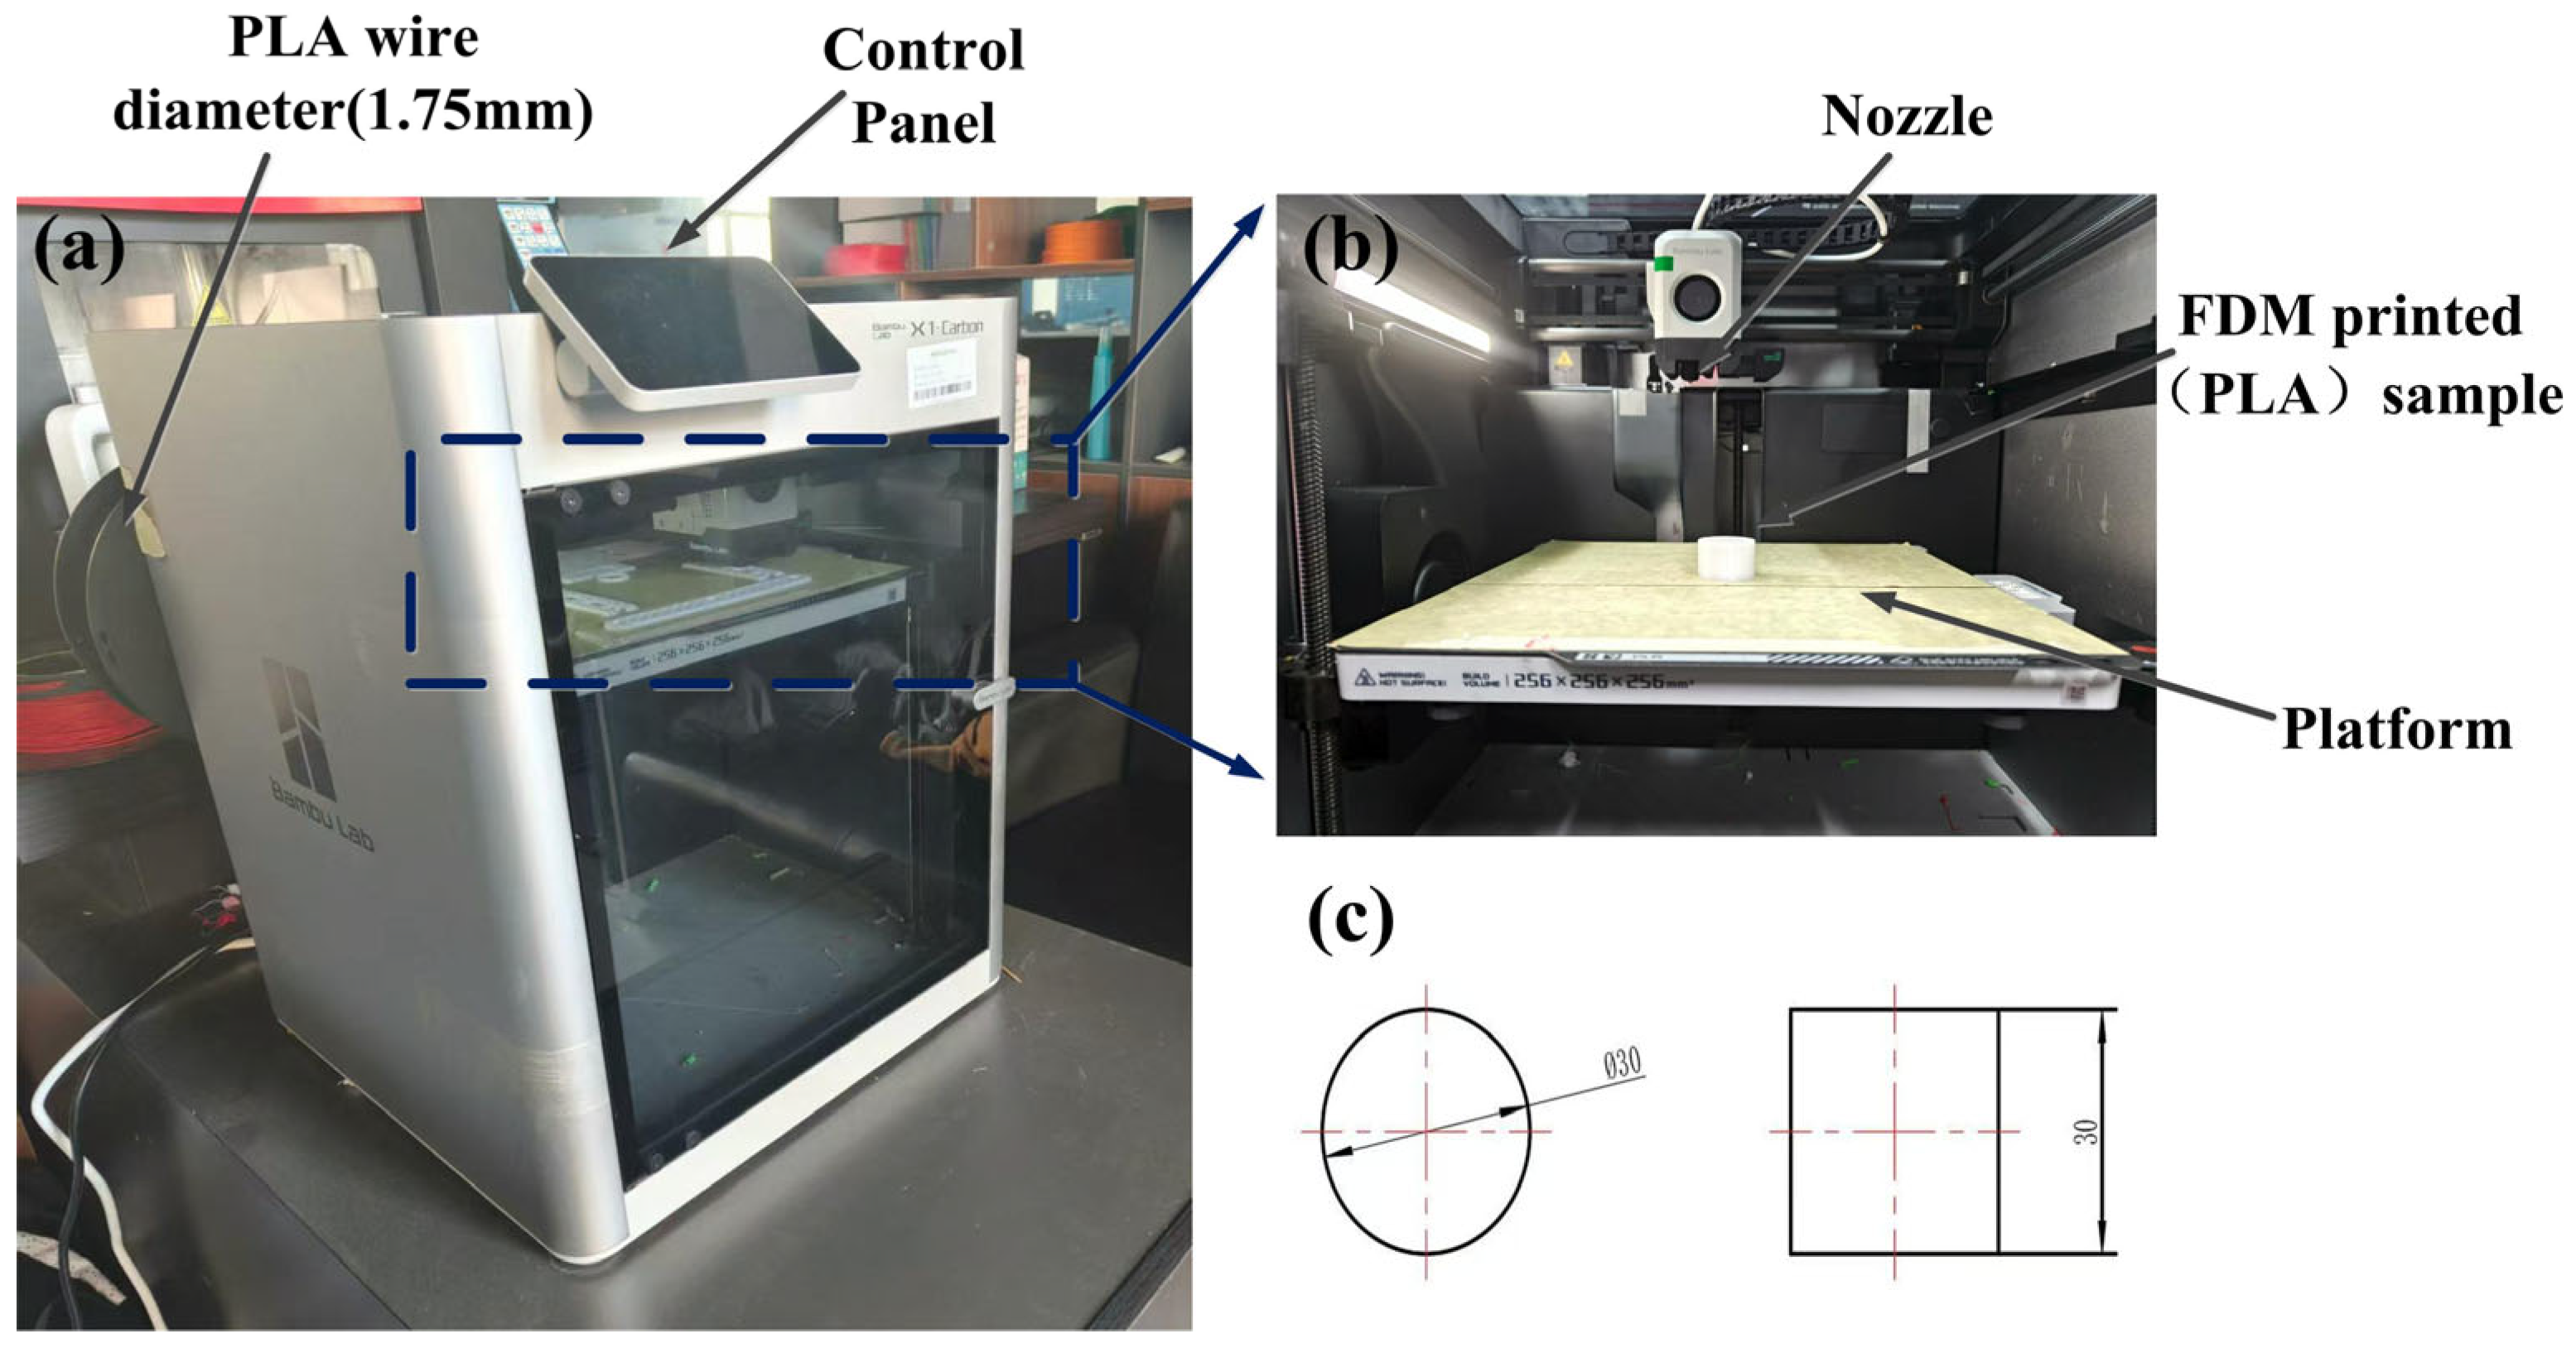
The experiment used Bambu Lab X1 FDM 3D printing equipment, as shown in Figure 4a. The main components of the FDM 3D printer include the bed, nozzle, and stepper motor, as shown in Figure 4b. The 3D printing consumables used are PLA with a diameter of 1.75 mm. Three-dimensional printing requires designing and printing parts in modeling software, with dimensions of 30 mm in diameter and 30 mm in height, as shown in Figure 4c, and importing files from modeling software into Bambu Studio slicing software (Linux version) in STL format. After completing the parameter settings, the automatically generated G-code file should be saved to the 3D printer for printing.
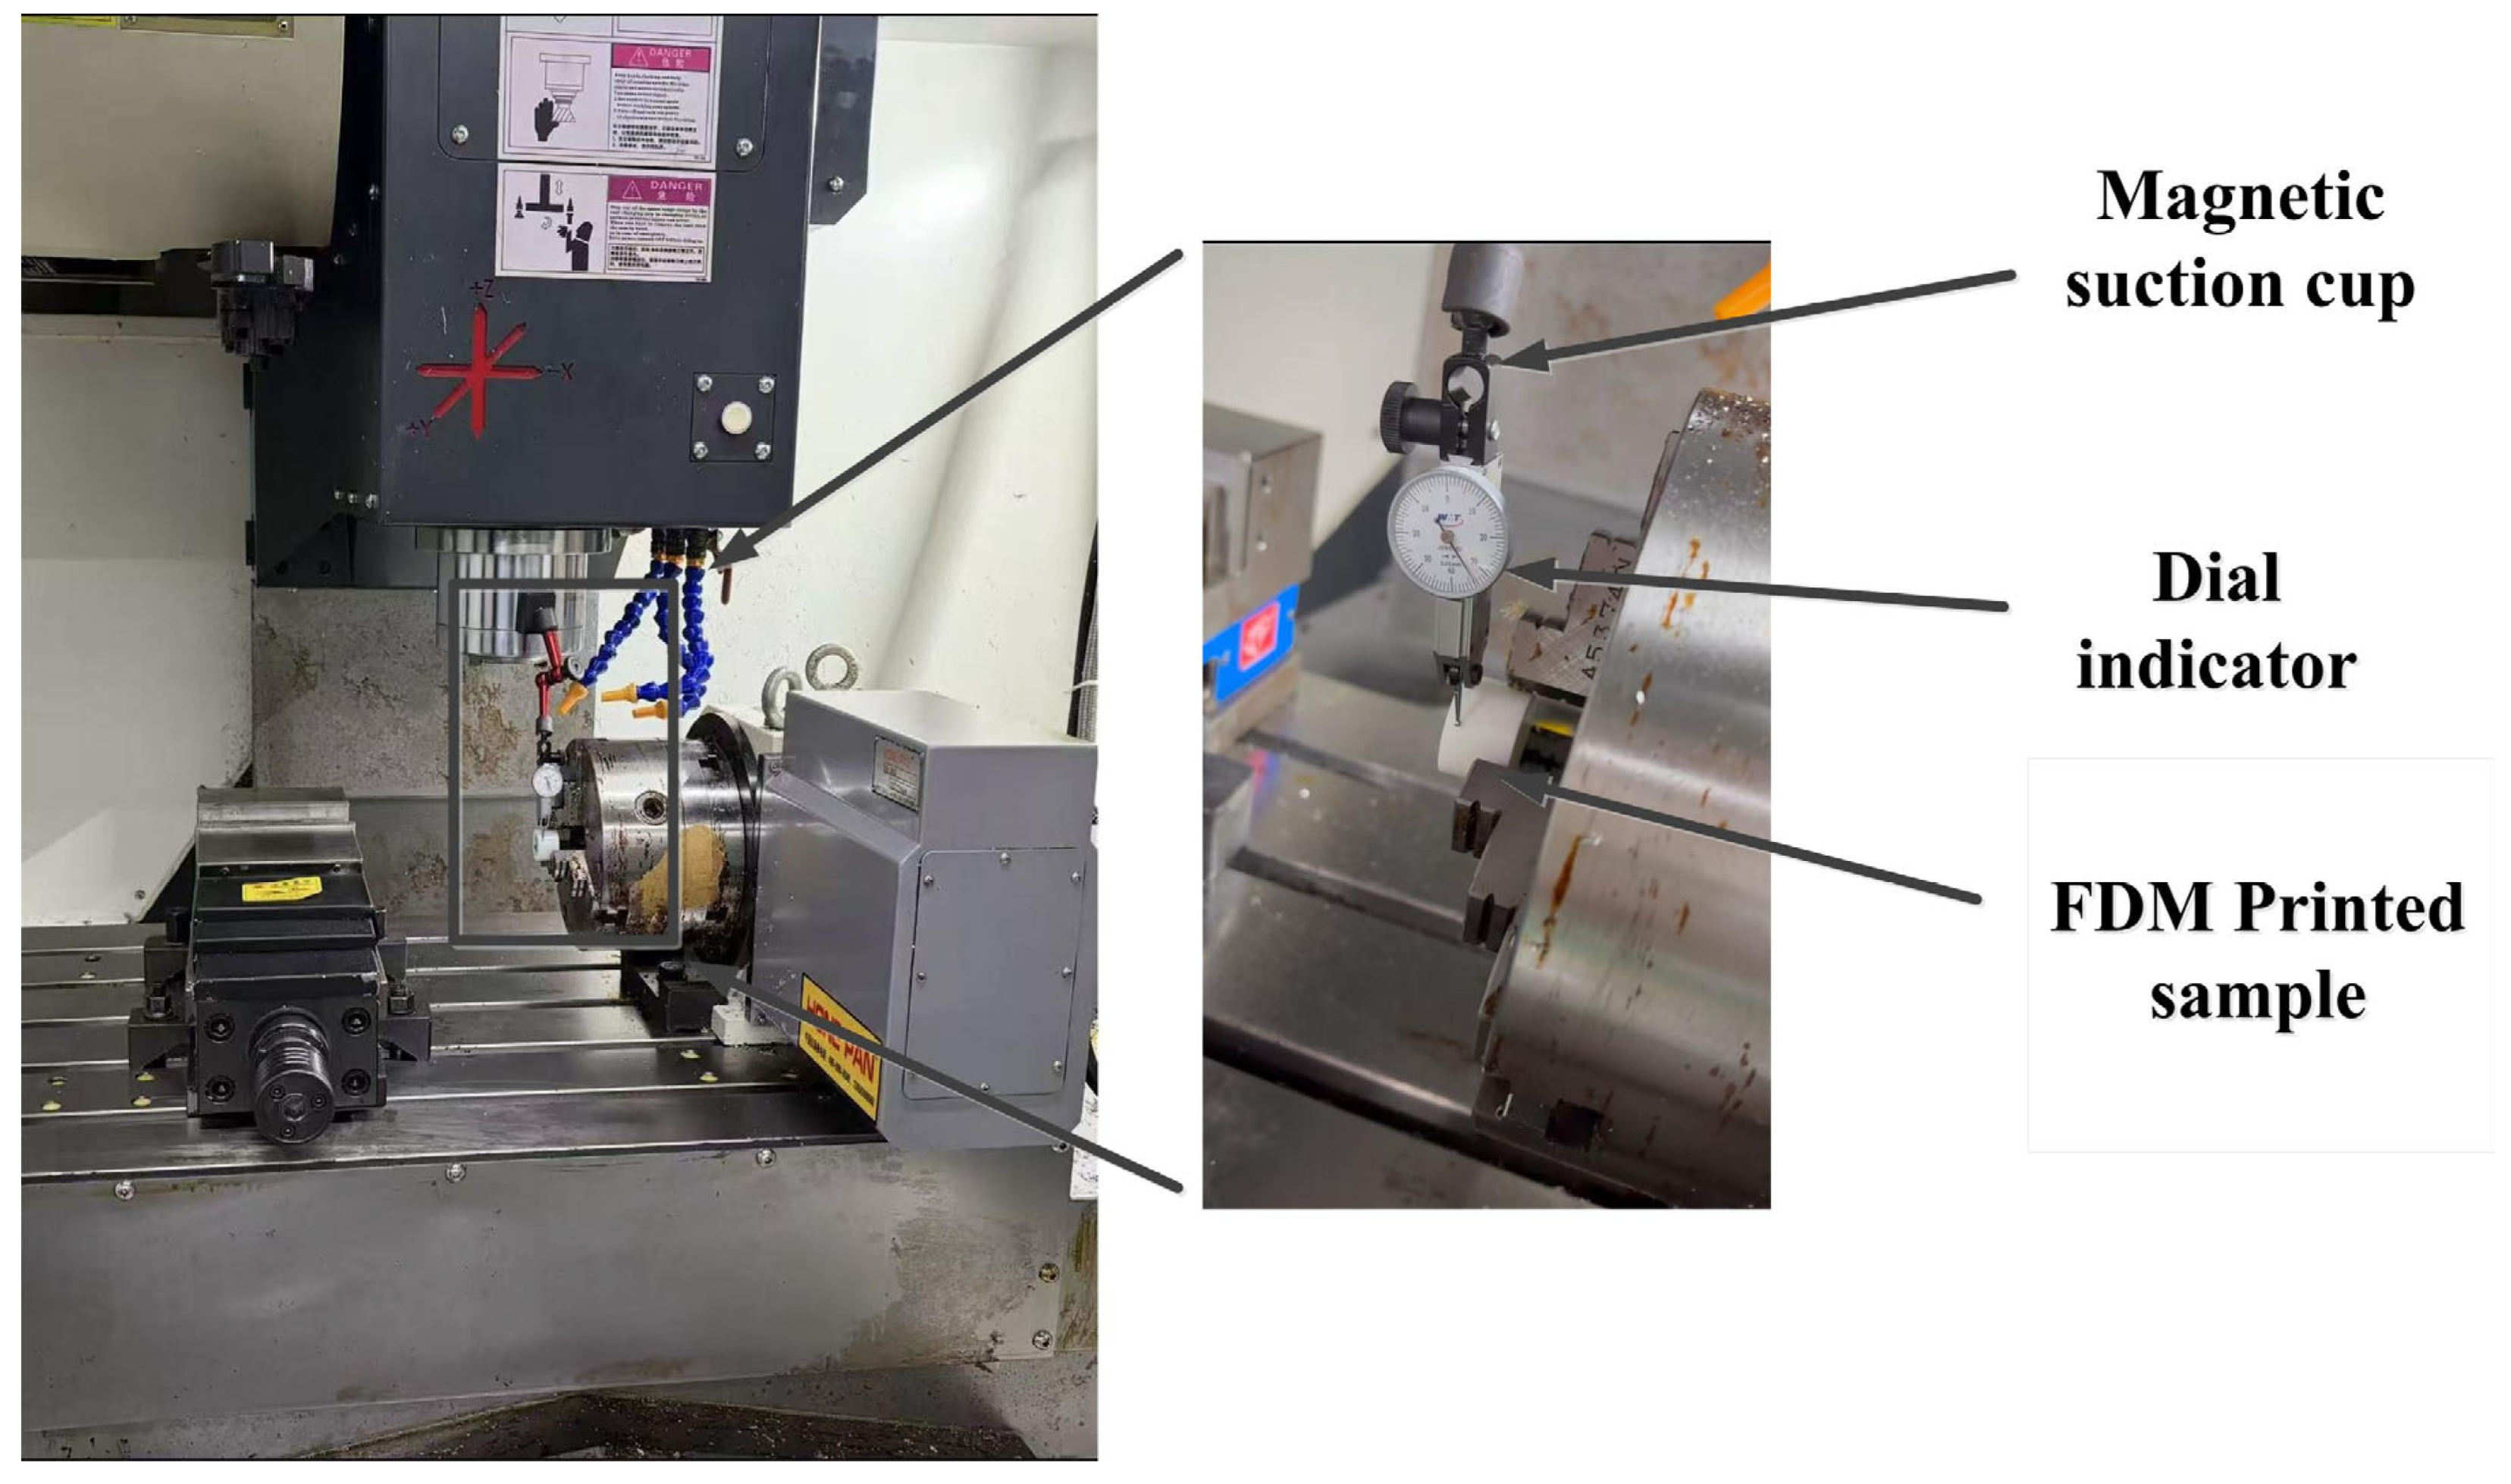
The printer has four main stages throughout the entire printing process: standby, preheating, printing, and cooling. After printing, all samples were left at room temperature for 5 h and allowed to cool naturally to a stable state. As shown in Figure 5, the FDM printed part is fixed onto the chuck fixture with a wrench, and a dial gauge is used to measure the circular runout tolerance value of the workpiece. Magnetic suction cups are used to fix the dial gauge on the spindle lifting platform and adjust the spindle lifting platform to select the appropriate measurement angle (perpendicular to the C-axis direction). As shown in Figure 6, the power consumption of each FDM 3D printed part was measured using a WiFi intelligent socket monitoring device (Shenzhen Juwei Technology Co., Ltd., Shenzhen, China), which is made of PCB/ABS, and the device model is S1BW.
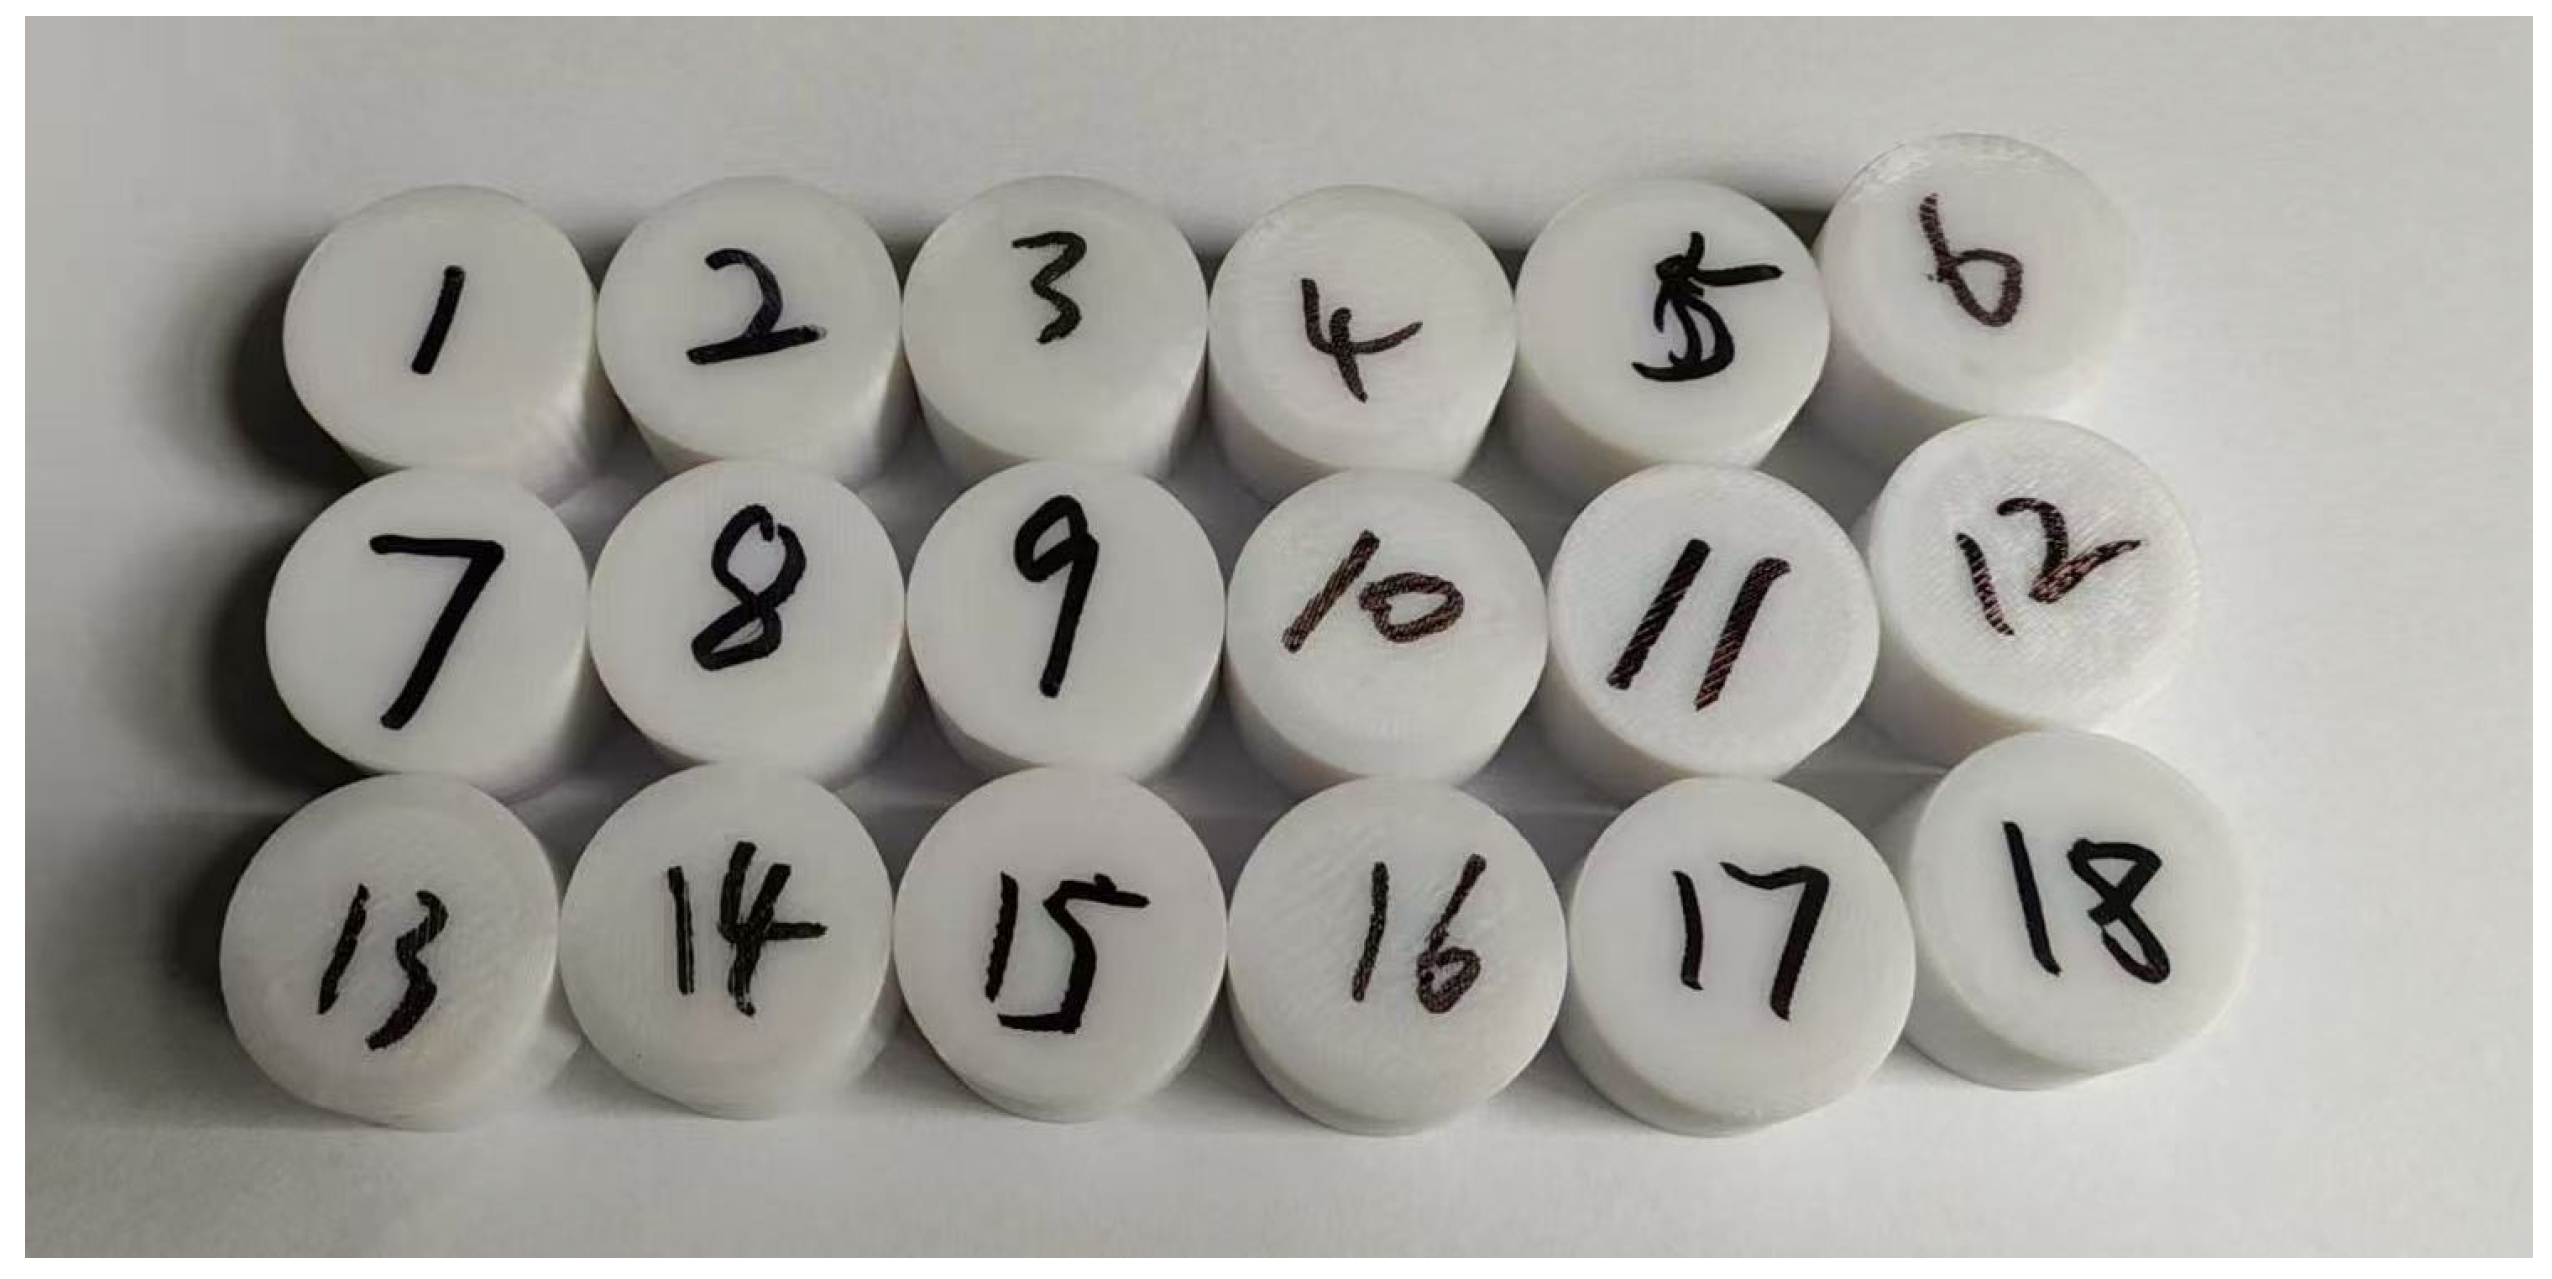
During FDM printing, uneven cooling of the printing material can lead to severe dimensional warping of the printed components. Therefore, it is necessary to choose appropriate process parameter values to maximize the dimensional accuracy and quality stability of the parts. The following factors were selected for the experiment: layer height (A), nozzle temperature (B), filling density (C), first layer layer height (D), and printing pattern (E), with circular runout tolerance value and carbon emissions as the main objectives, and an orthogonal experimental design was adopted. The orthogonal experimental factor level table is shown in Table 1. The L18 orthogonal experimental platform was selected, orthogonal experiments were designed according to Table 1, and 18 experimental schemes were obtained as shown in Table 2. The actual printed sample is shown in Figure 7.
3. Results and Discussion

3.1. Analysis of Orthogonal Experiment Results

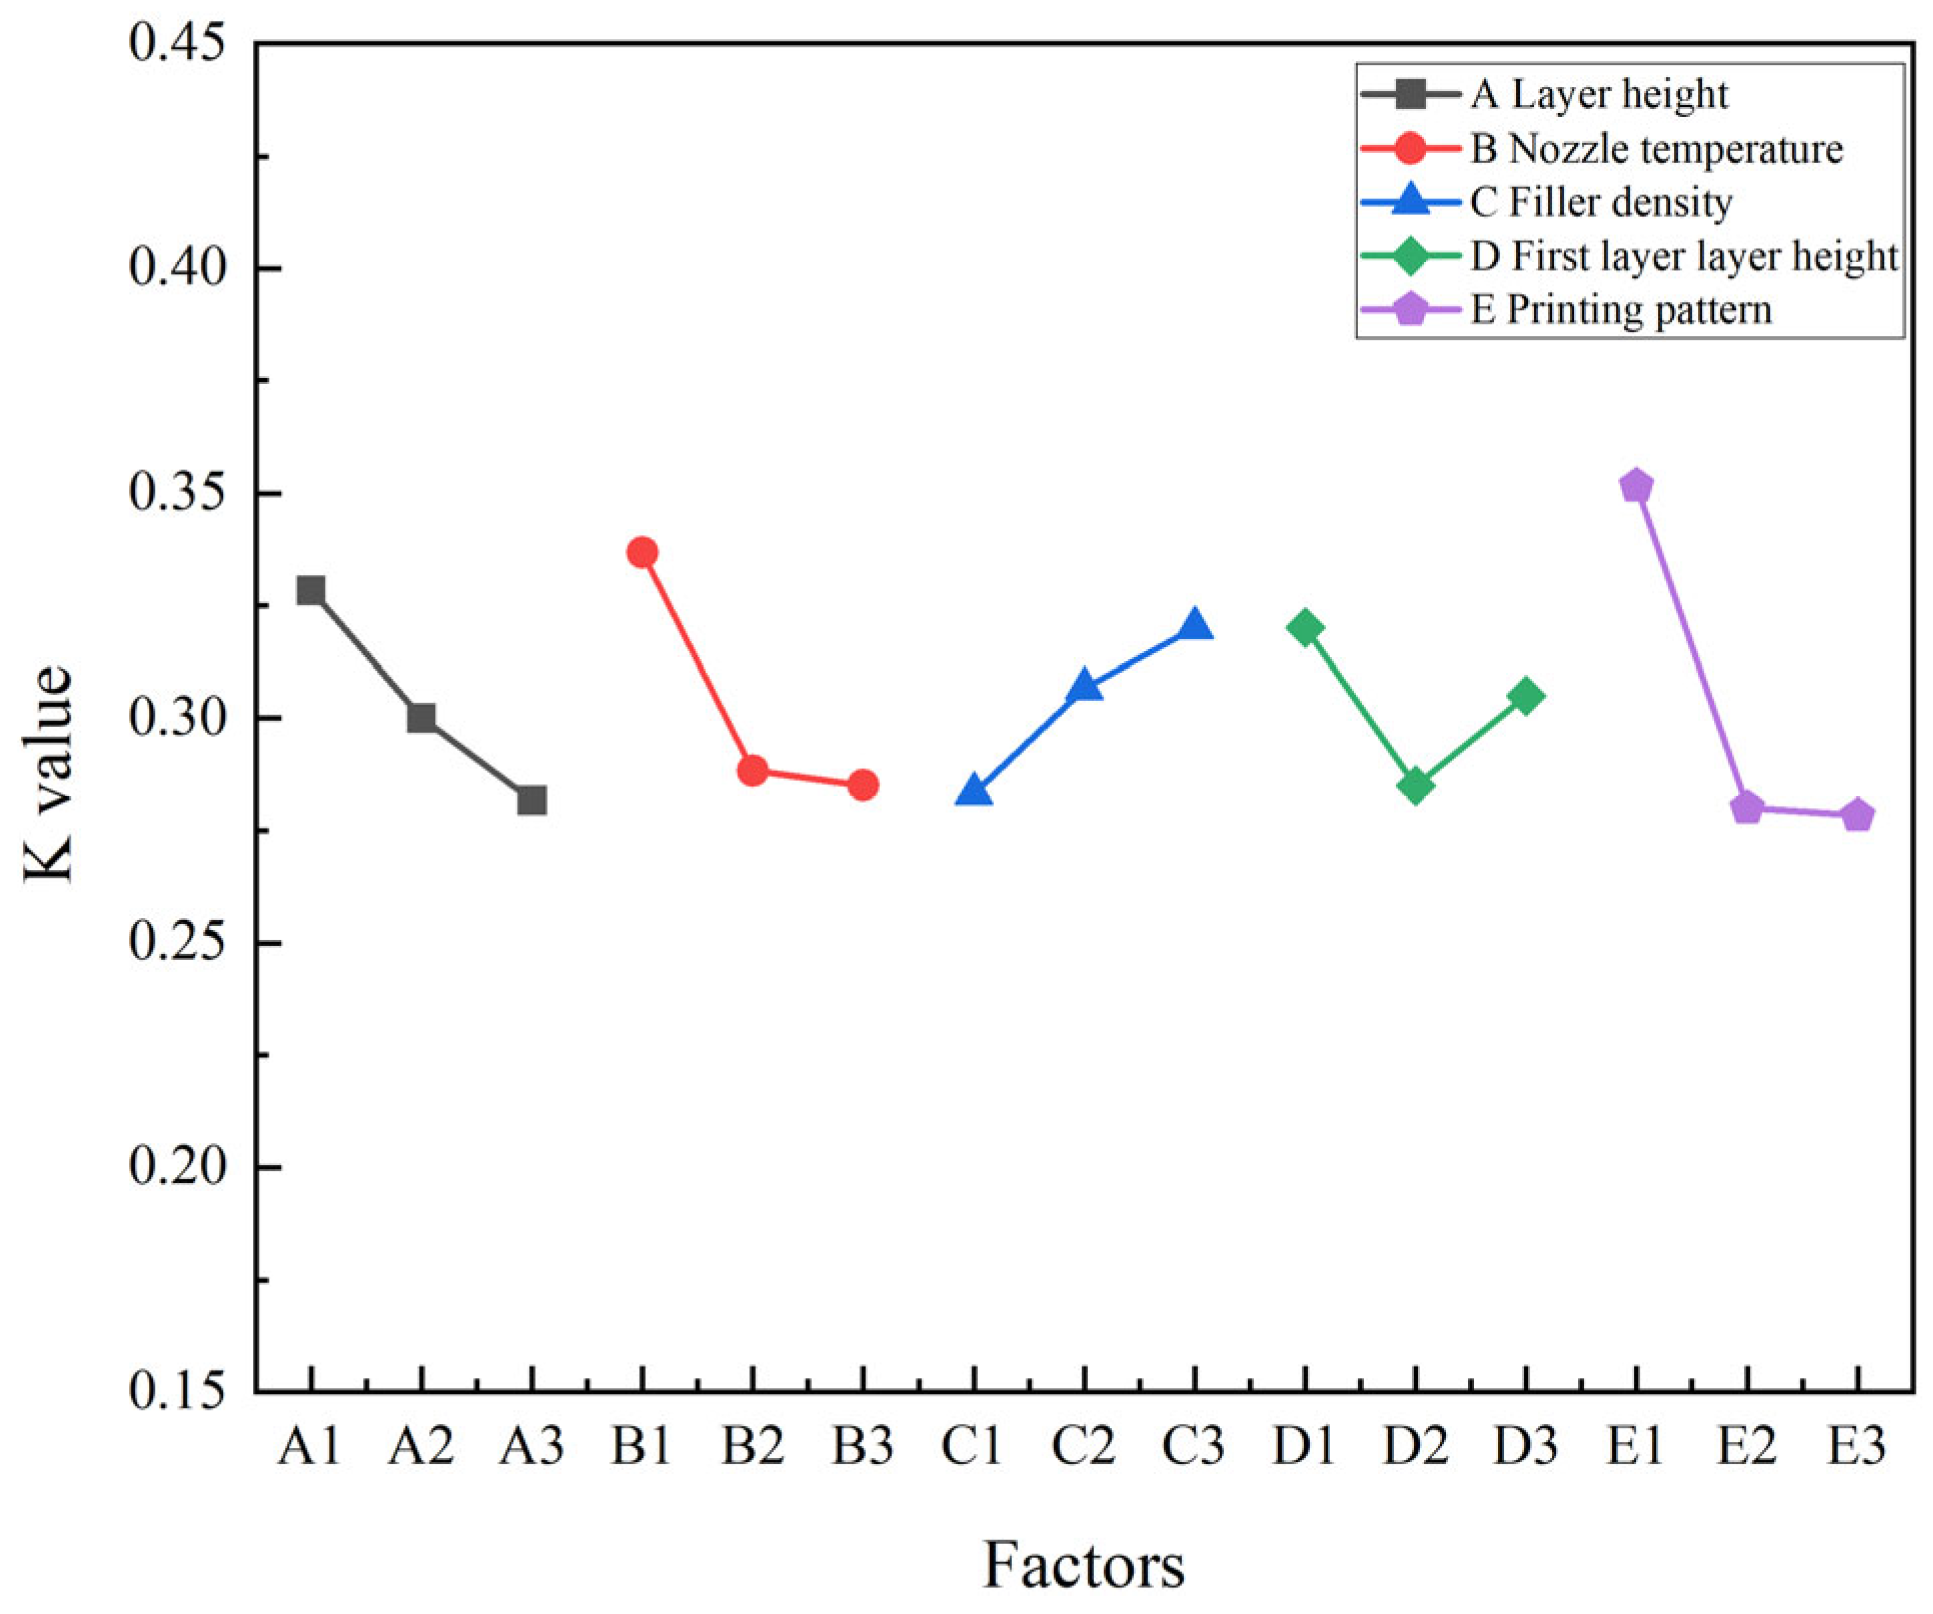
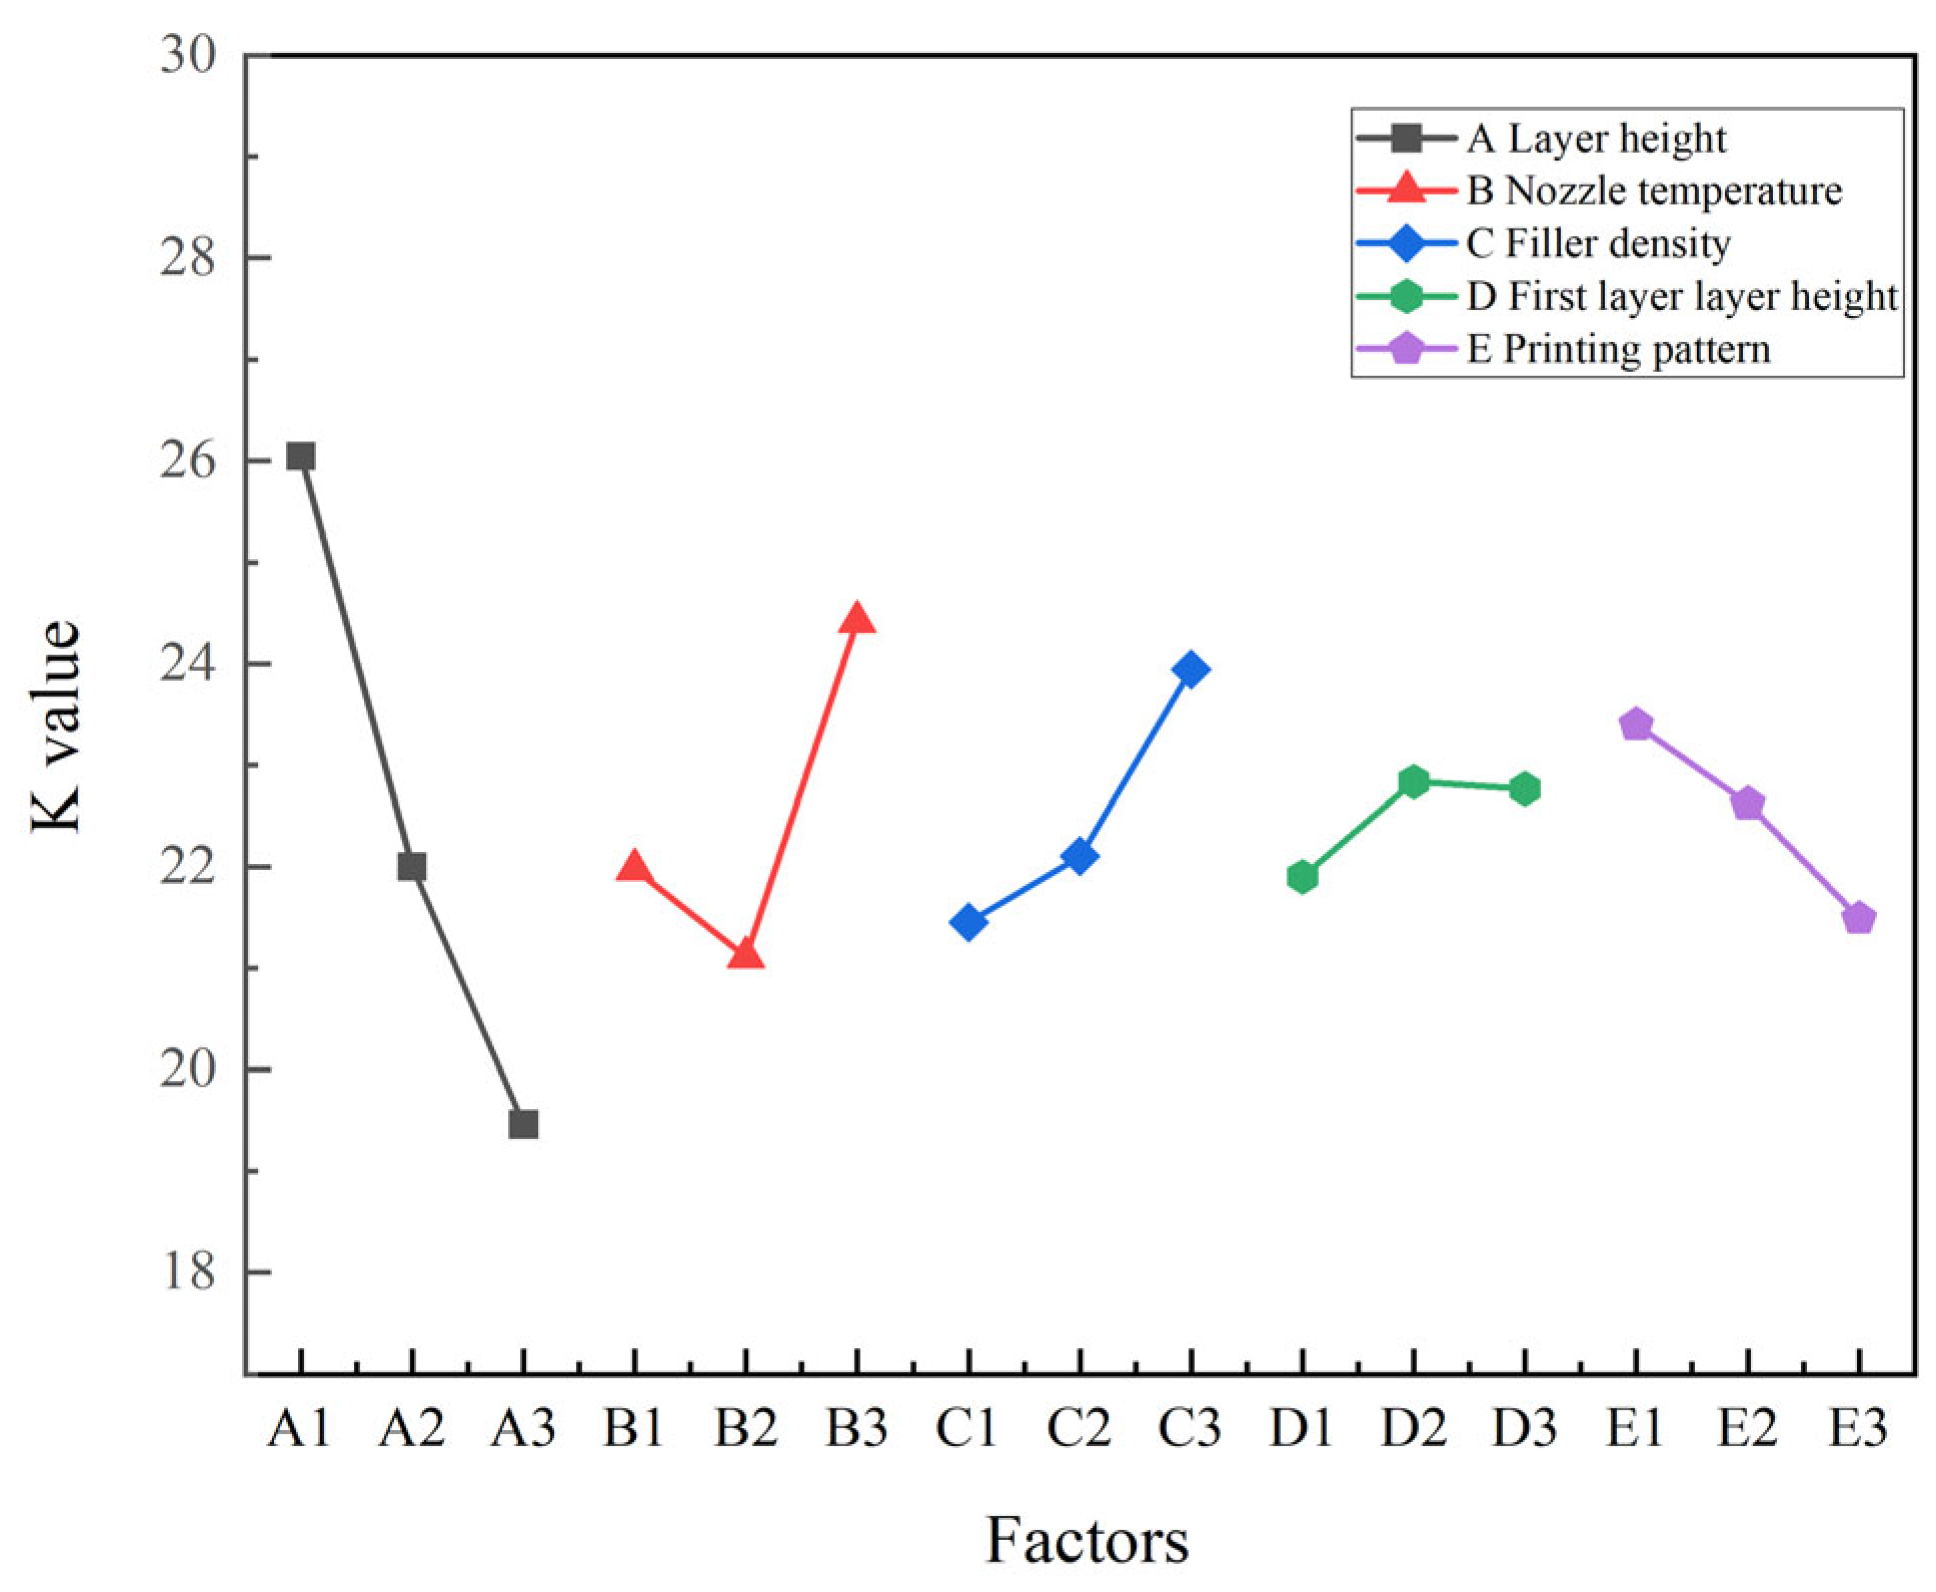
Figure 8 and Figure 9 illustrate the impact of various parameters on shrinkage depth and price at different factor levels. From the figure, it can be seen that under the principle of prioritizing circular runout tolerance, the combination of forming parameters A3-B3-C1-D2-E3 obtained using the orthogonal experimental method exhibits the smallest tolerance. The order of influence of each factor from high to low is E > B > A > C > D. Under the principle of prioritising carbon emissions, the combination of moulding parameters A3-B2-C1-D1-E3 is optimal. The order of factor influence from high to low is: A > B > C > E > D.

3.2. Analysis of Response Surface Test Results

The layer height (A), nozzle temperature (B), filling density (C), and first layer height (D) are selected as factors with print circular runout tolerance and carbon emissions as optimization objectives. The response surface experimental design method optimized the model, with three levels assigned to each factor, as shown in Table 3, using the Design Expert software (13 version) for Box–Behnken design optimization. A quadratic polynomial response surface model was established using an L29 orthogonal array, and the experimental data are shown in Table 4.
Design Export software (13 version) was used to process experimental data from response surface methodology (Table 4) to investigate the effects of layer height, nozzle temperature, filling density, and first layer height on circular runout tolerance and carbon emissions. The data was fit to a polynomial model using analysis of variance (ANOVA). The variance analysis results for the response surface model, regarding circular runout tolerance and carbon emissions, are presented in Table 5 and Table 6. According to the results, the quadratic model has been proven to be the most significant. Equations (1) and (2) were used to calculate the regression equation model for circular runout tolerance and carbon emissions.
Y α = 19 . 167 + 5.24 A + 0.180017 B 0.03405 C 19.40667 D 0.07 A B + 0.17 A C + 6 A D + 0.0005 B C + 0.045 B D + 0.135 C D 9.46667 A 2 0.000449 B 2 0.000774 C 2 11.46667 D 2
Y β = + 351.38450 205.44 A 2.81443 B + 0.519883 C + 2.59 D + 0.375 A B 0.465 A C 16 A D 0.002425 B C 0.195 B D + 0.71 C D + 222.46667 A 2 + 0.006174 B 2 + 0.001637 C 2 13.03333 D 2
The layer height, nozzle temperature, filling density, and first layer height are represented as A, B, C, and D, respectively. The responses of circular runout tolerance (α) and carbon emissions (β) are used for multiple regression fitting.
The significance of establishing a second-order polynomial model was demonstrated by analysing the variance of the constructed model. The smaller the p-value in the analysis of variance, the more significant the impact of the corresponding factors. When the p-values are all less than 0.05, it indicates significance, and p-values less than 0.0001 indicate extreme importance, as shown in Table 5 and Table 6. The p-values of the regression model are all less than 0.0001, indicating that the regression model has statistical significance and is highly significant. The p-values of missing fitting terms (p = 0.1962 in Table 5 and p = 0.6529 in Table 6) are all greater than 0.05, indicating that the lack of fitting terms is not significant and the model fits well.
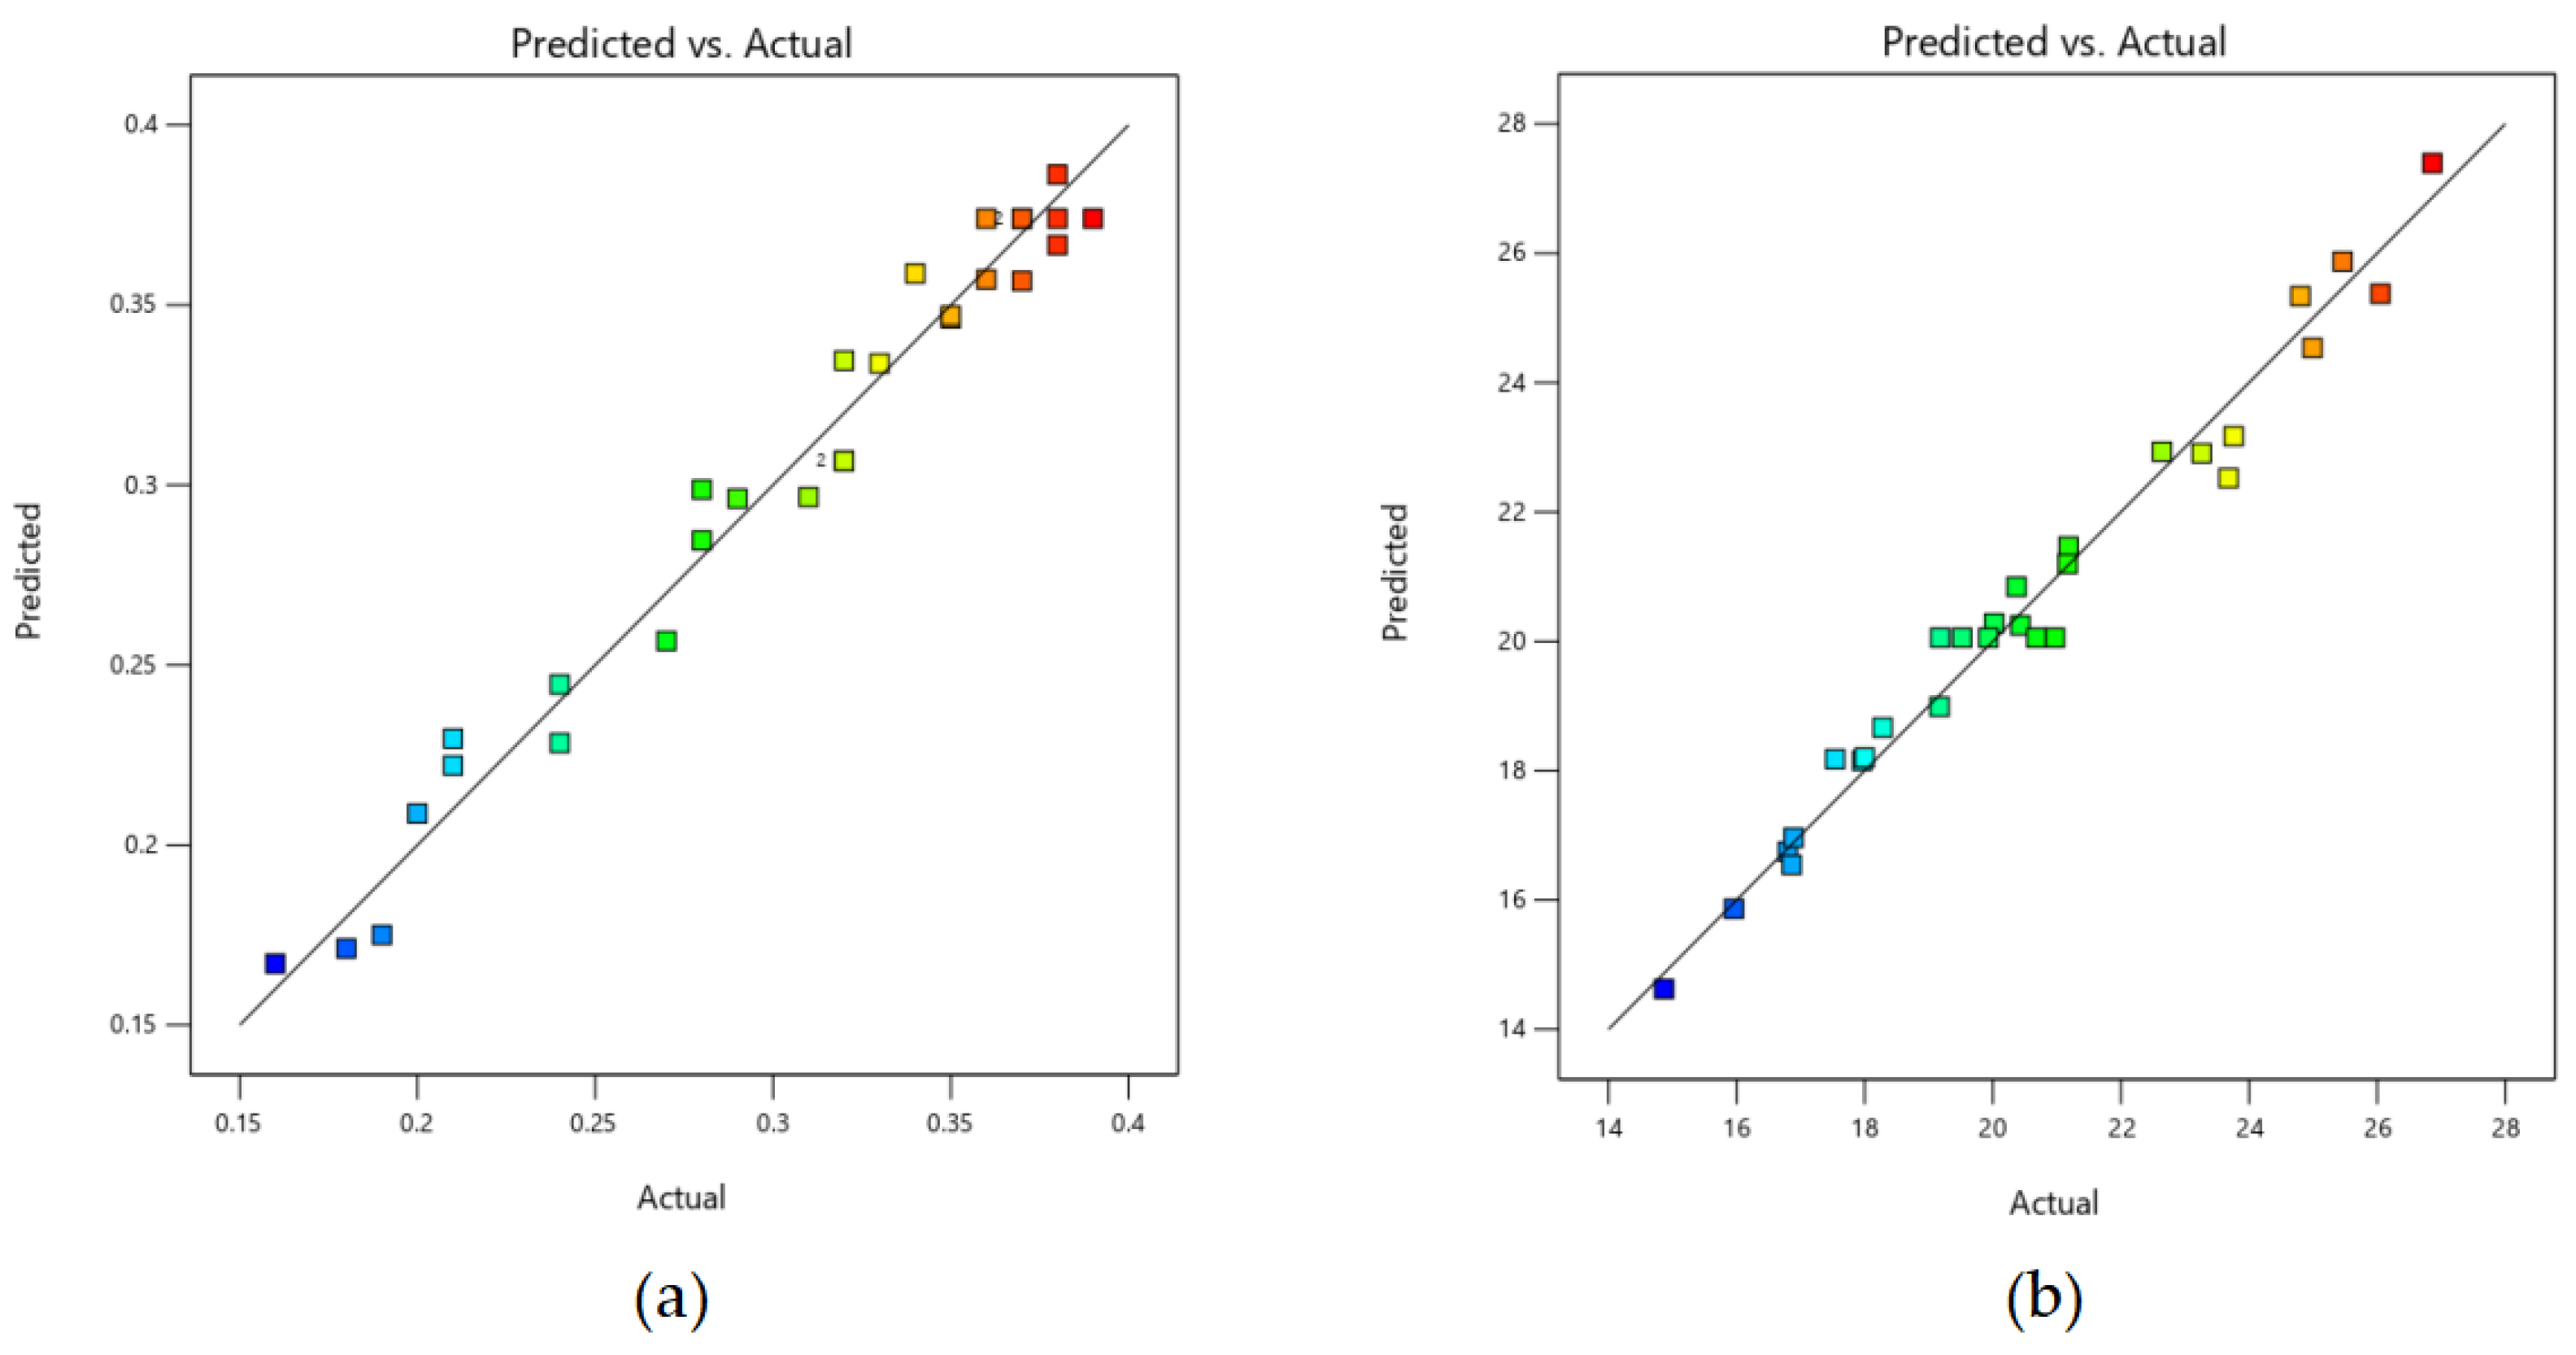
Figure 10a,b show that the predicted values and experimental values of the response surface model are almost on a straight line. The model number is used to check and evaluate the correlation, goodness of fit, and prediction accuracy of all models. The multiple correlation coefficients R2 are 0.9730 and 0.9766, respectively, which are close to 1, indicating that the response surface model established in this paper has good adaptability.

3.3. Analysis of NSGA-II Global Optimization Results

NSGA-II is a multi-objective optimisation algorithm based on the Pareto optimal solution concept, which performs multi-objective optimisation on the circular runout tolerance value and carbon emissions of printed parts. The optimisation problem function and constraint interval are shown in Formula (3).
Min Y 1   X 1 ,   X 2 ,   X 3 ,   X 4   Min Y 2   X 1 ,   X 2 ,   X 3 ,   X 4 0.1   m m X 1 0.2   m m 230   ° C X 2 250   ° C 70 % X 3 90 % 0.05   m m X 4 0.15   m m
where Y1/Y2 represent the function objective value (circular runout tolerance value and carbon emissions), X1, X2, X3 and X4 are layer height, nozzle temperature, filling density, and first layer height, respectively.
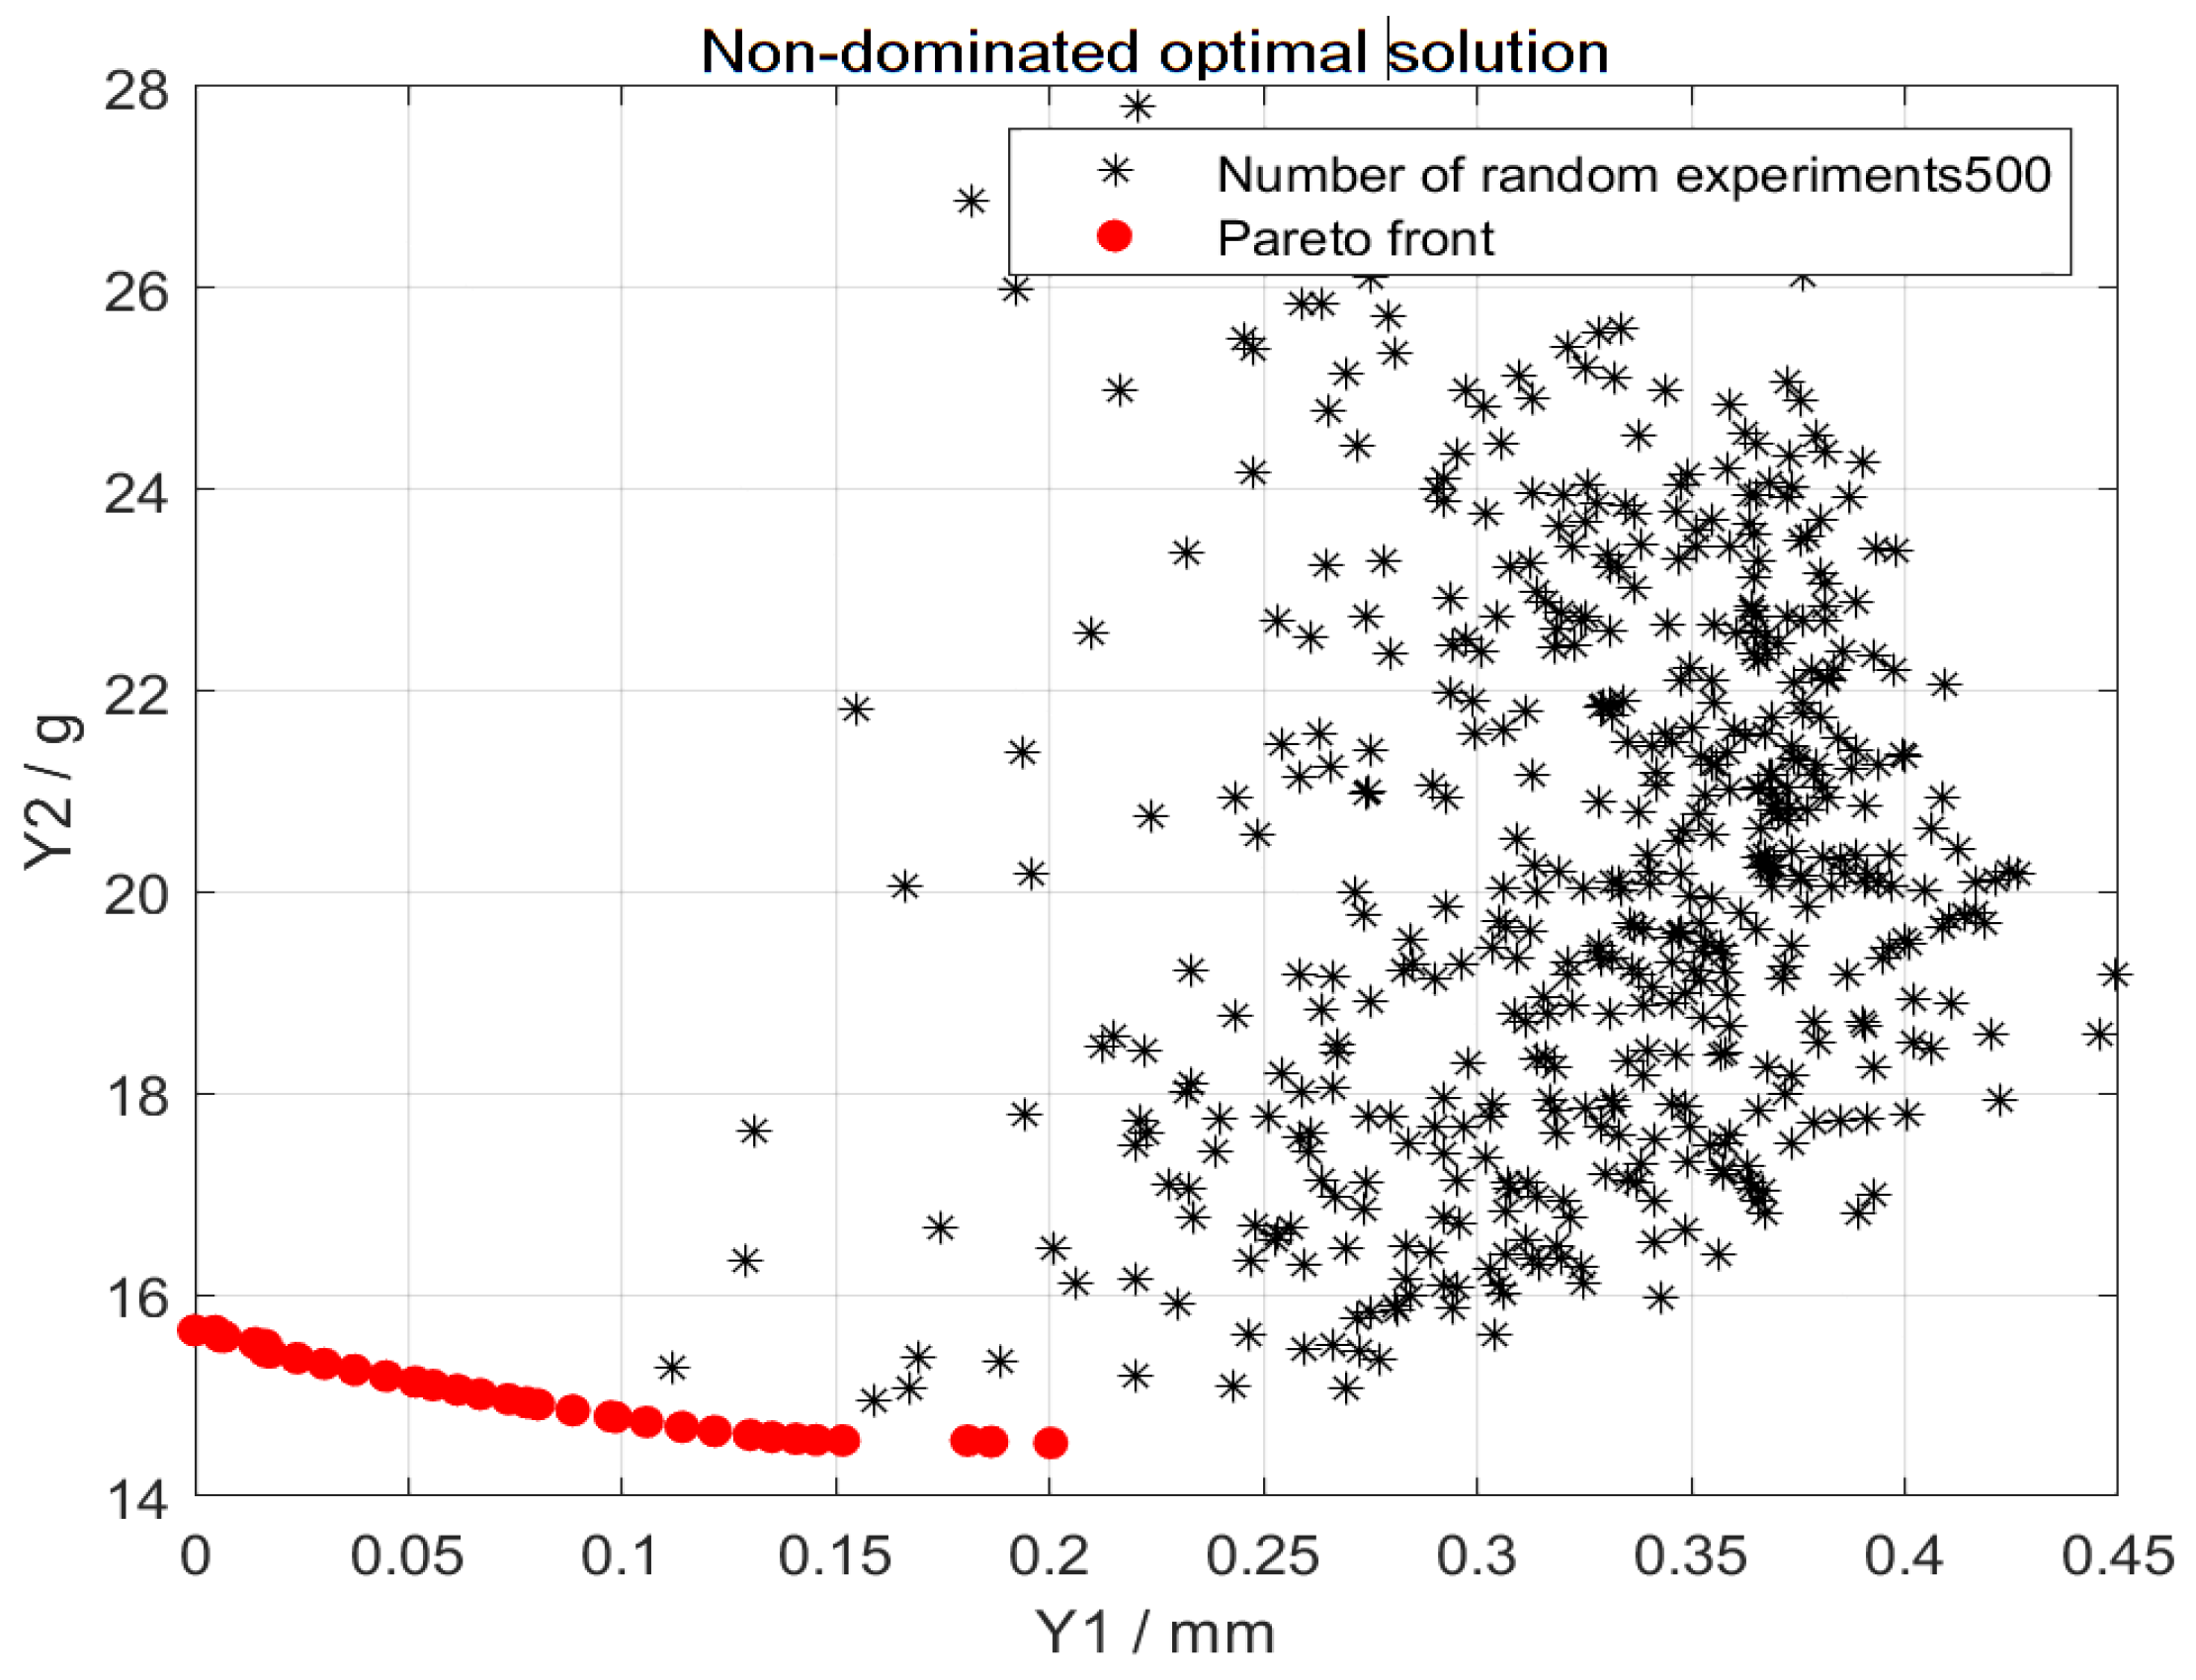
Using MATLAB (2024a) software, Equation (3) is solved based on NSGA-II. The operating parameters of the algorithm are set as follows: the population size is 50, the maximum number of generations is 400, the crossover probability is 0.9, and the mutation probability is 0.1. The Pareto optimal frontier obtained by solving is shown in Figure 11. To verify the convergence of the Pareto optimal solution, 500 random experiments were conducted to validate the results of the Pareto front, as shown in Figure 12.

3.4. Analysis of the Results Obtained from the Entropy Weight TOPSIS Method

Based on the entropy weight TOPSIS method, comprehensive evaluation and decision analysis are conducted for 50 population individuals and 50 mix proportion optimisation schemes on the Pareto optimal frontier, aiming to identify the ideal solution within this frontier. The entropy weight TOPSIS method is a multi-objective comprehensive optimisation analysis method based on a dimensionless decision matrix. It introduces the concept of information entropy to determine the objective weights of indicators, calculates the Euclidean distance between the evaluated object and the idealised target, sorts based on relative closeness, and extracts the optimal solution. The steps of this method are summarised as follows:
Construct an evaluation matrix as shown in Equation (4).
X = x i j m × n = x 11 x 12 x 13 x 1 n x 21 x 22 x 23 x 2 n x 31 x 32 x 33 x 3 n x m 1 x m 2 x m 3 x m n
where X is the evaluation Matrix.
Dimensionless processing was performed on matrix X, and each indicator was normalized. The positive indicator formula is shown in Equation (5).
b i j = x i j x j m i n x j m a x x j m i n
The reverse indicator formula is shown in Equation (6).
b i j = x j m a x x i j x j m a x x j m i n
where b i j is the elements in the standardized decision matrix.
The formula for calculating entropy weight is shown in Equation (7).
w j = 1 e j j = 1 n ( 1 e j )
where w j is the entropy weight for the jth evaluation metric.
The formula for calculating information entropy is shown in (8)–(10).
e j = k [ i = 1 m f i j ln f i j ]
k = 1 / ln m
f i j = ( 1 + b i j ) / i = 1 m ( 1 + b i j )
where e j represents the information entropy of the jth evaluation metric.
The calculation formula for constructing a weighted decision matrix is shown in (11).
c i j = w j × b i j
where c i j is an element in the weighted decision matrix.
The formulas for determining the optimal vector and the worst vector are shown in (12).
C + =   { c 1 + ,   c 2 + ,   ,   c n + } C =   { c 1 ,   c 2 ,   ,   c n }
where C + and C , respectively, represent the positive ideal solution set and the negative ideal solution set.
Using the Euclidean distance calculation formula, the formula for calculating the positive and negative ideal solution sets for each sample is shown in (13).
D i + = j = 1 n c i j + c i j 2 D i = j = 1 n c i j c i j 2
where D i + and D i represent the distances between the i-th optimization solution and the positive and negative ideal solutions, respectively.
The relative closeness of each optimization scheme to the ideal solution is determined as shown in Formula (14).
O i = D i D i + D i +
where O i is the relative closeness of the i-th mix proportion optimization scheme, and the closer the value is to 1, the better the evaluation effect of the scheme.
The objective weights of each evaluation index in the Pareto optimal frontier were calculated, and the results are shown in Table 7.
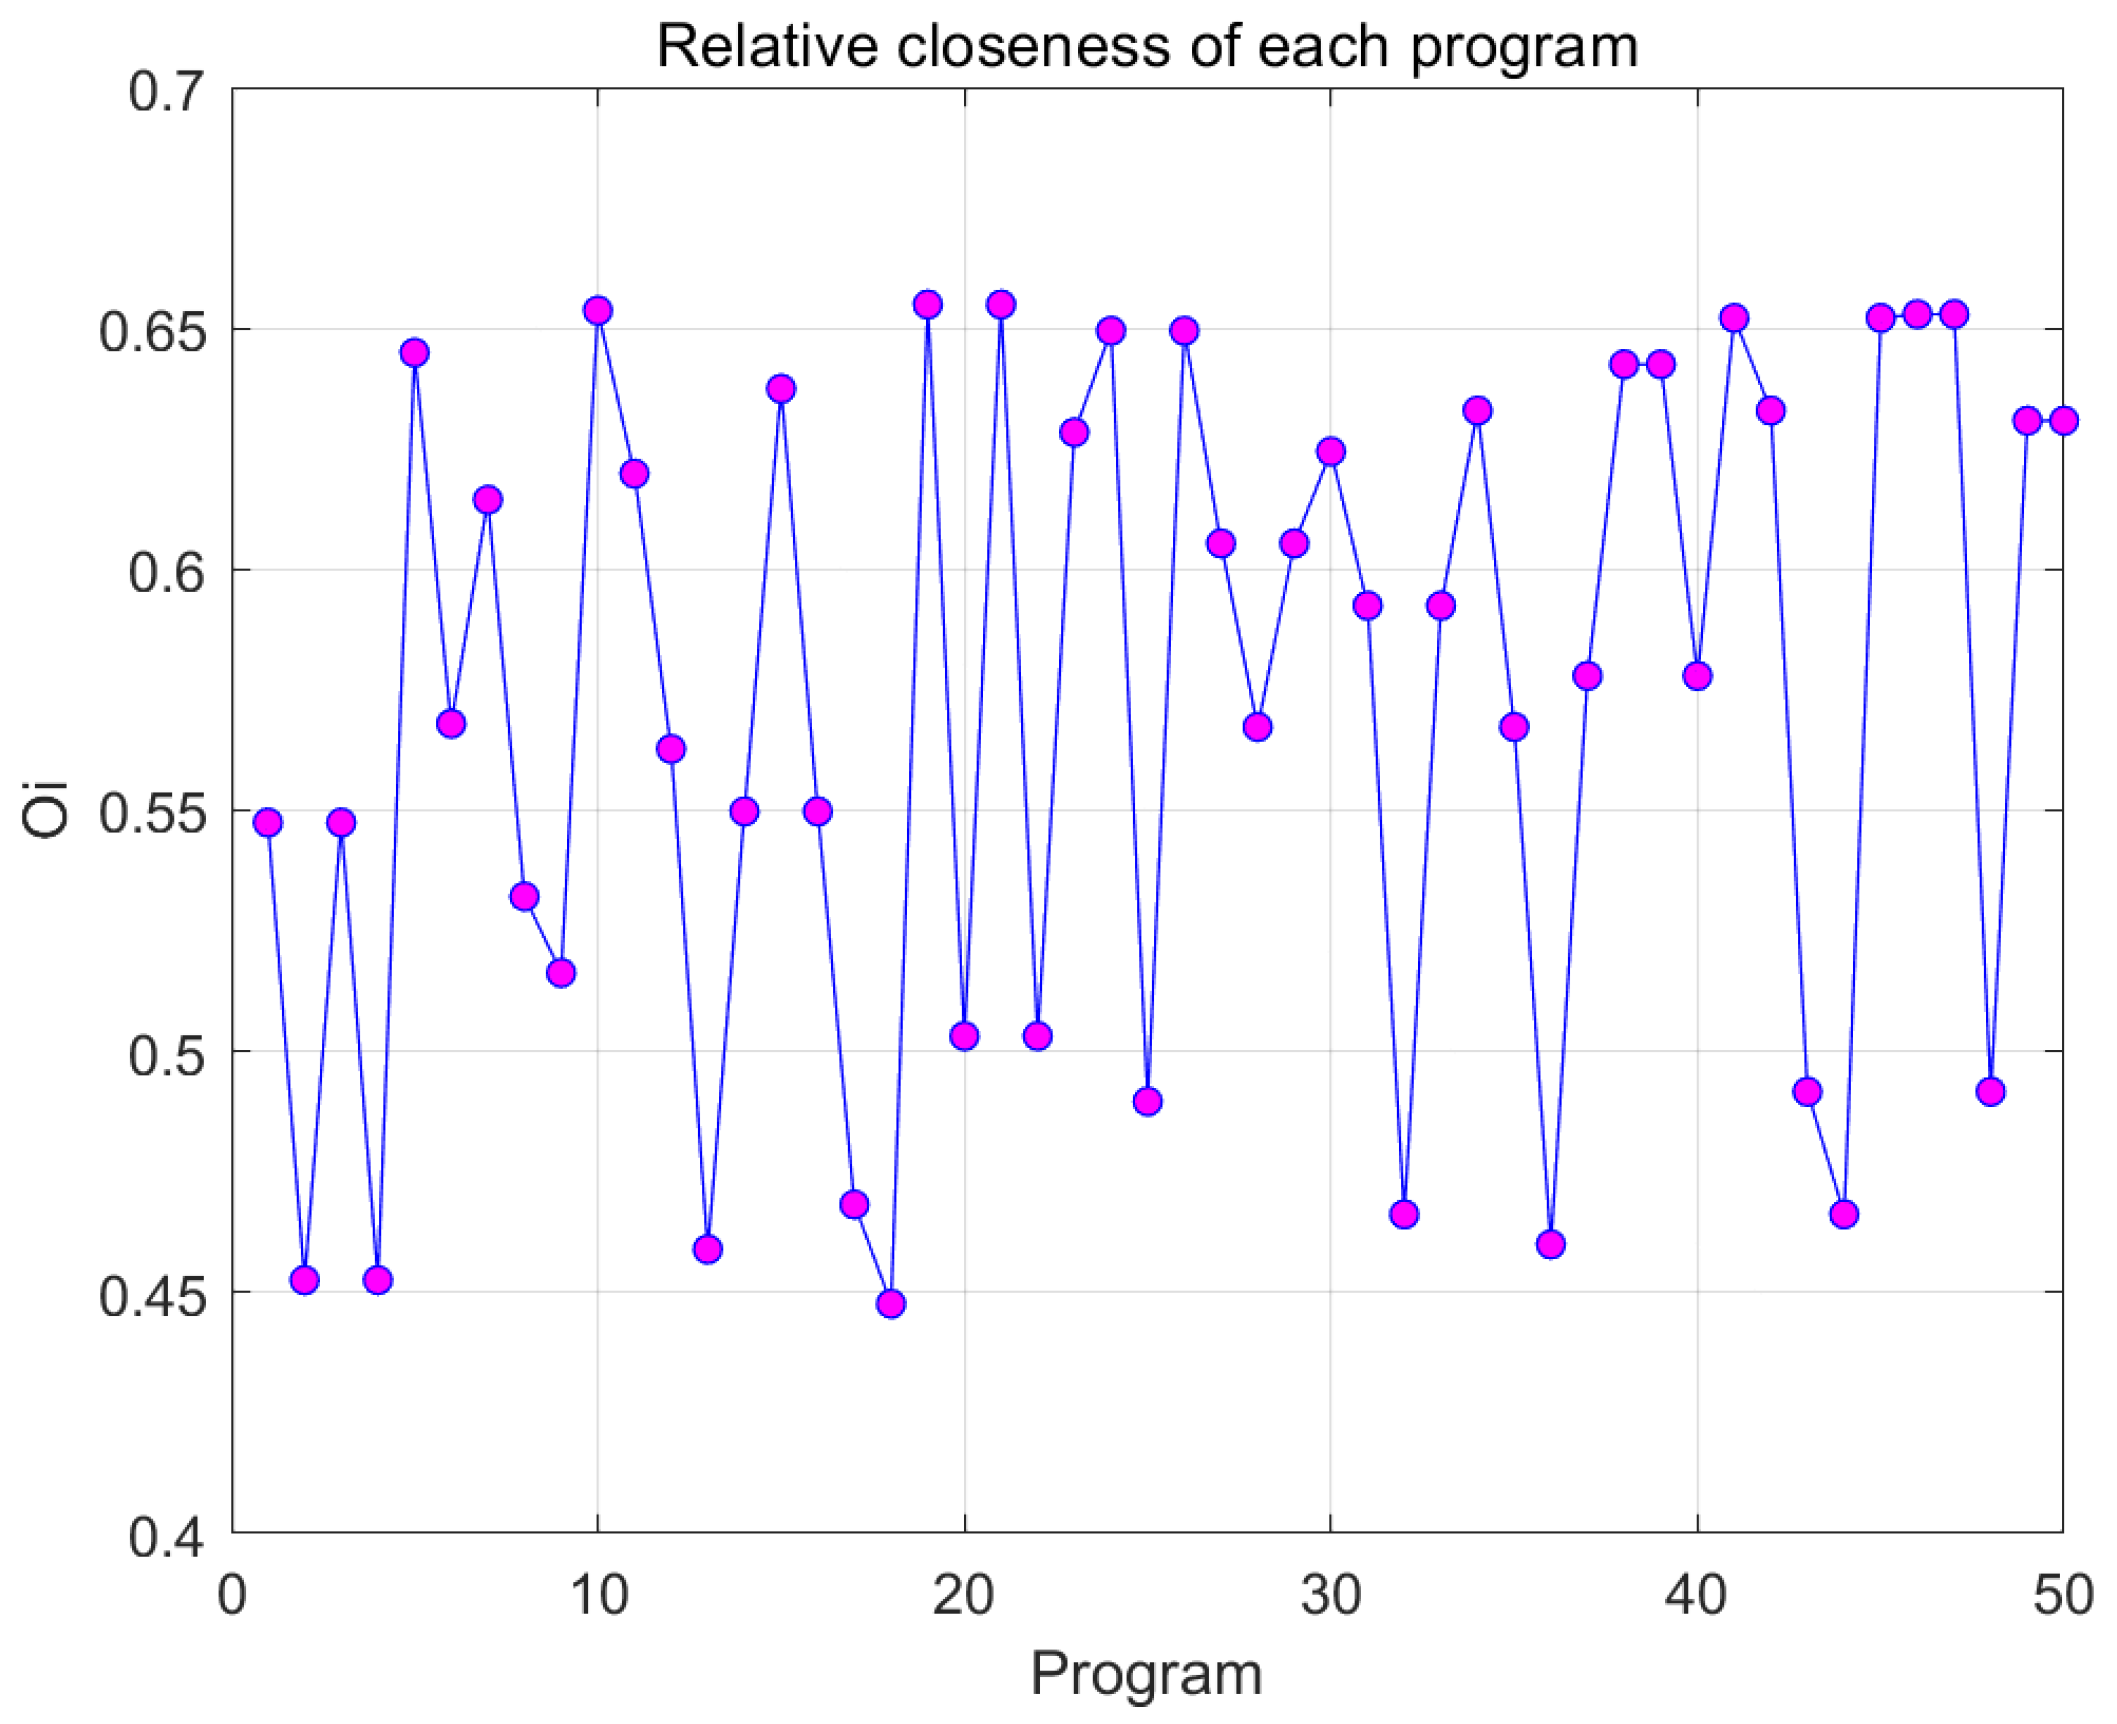
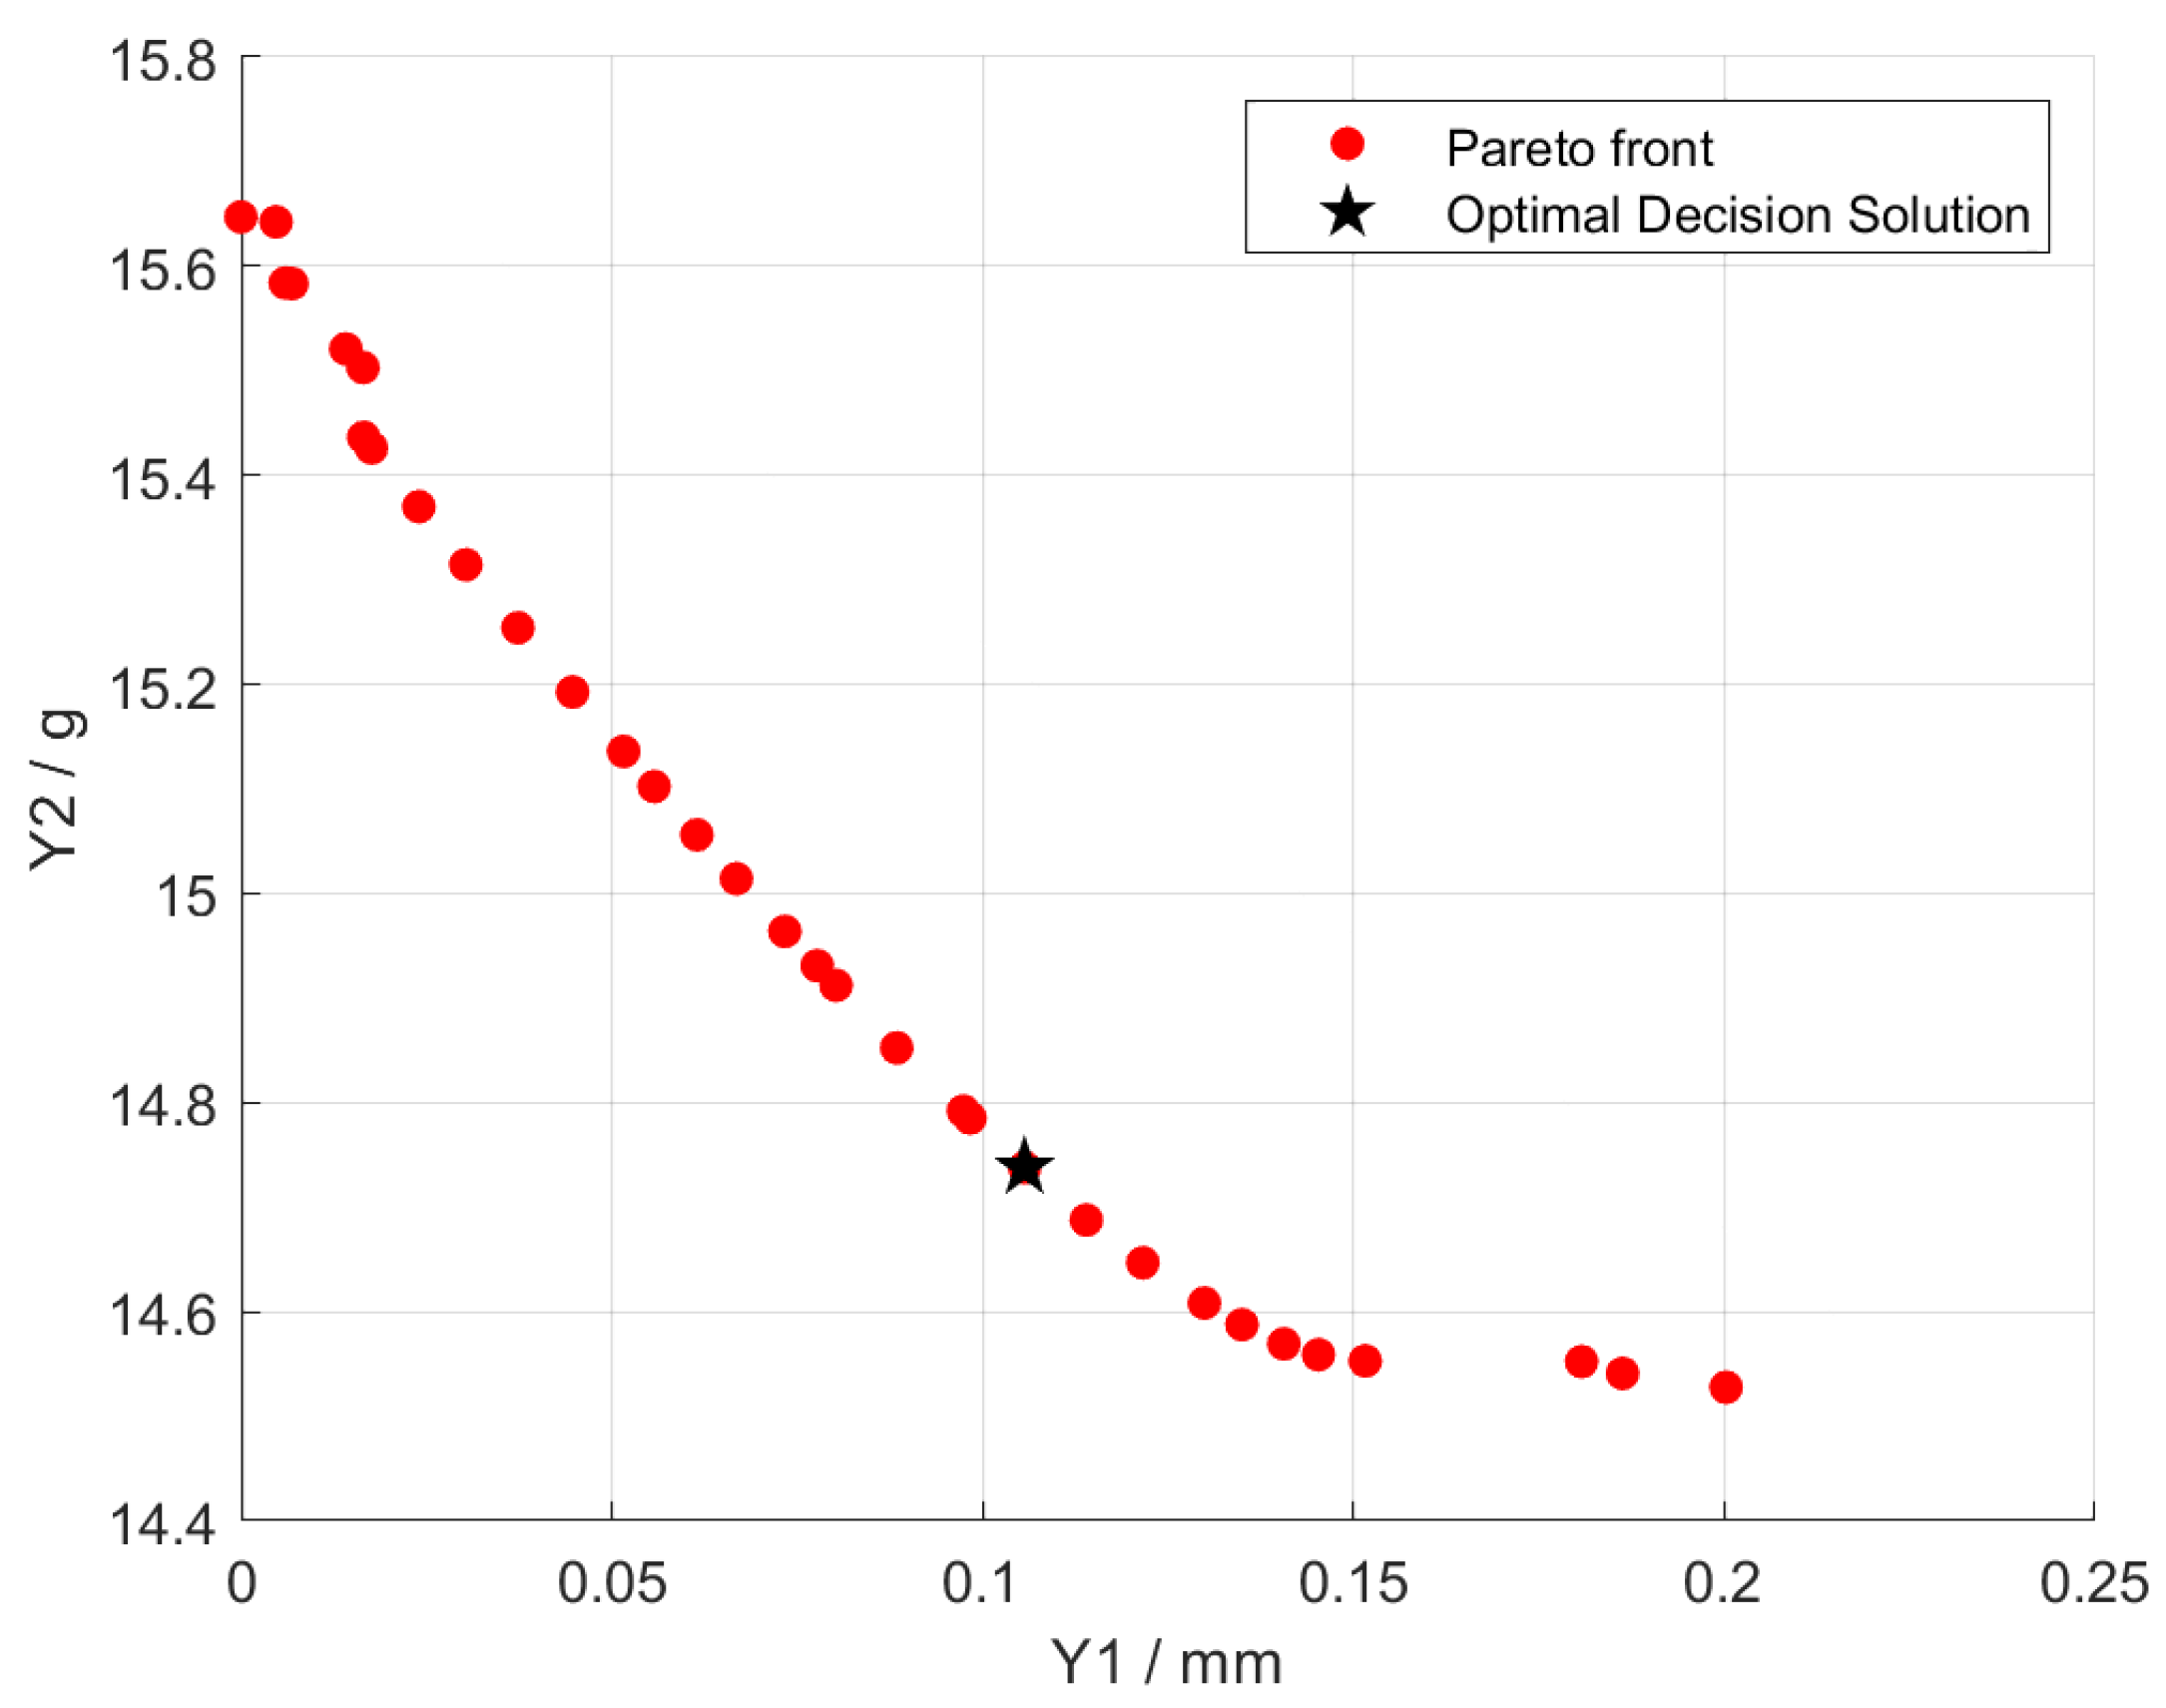
From Figure 13, it can be seen that the 19th scheme has the highest relative closeness and is closest to the ideal solution, indicating that its comprehensive performance is the best. The optimal decision solution is shown in Figure 14. Using this scheme as the operating condition for testing, the circular runout tolerance values and carbon emissions obtained are shown in Table 8.
According to Table 8, the experimental values decreased by 64.29% and 53.45% respectively, compared to the original values. The effectiveness and reliability of the RSM-NSGA-II coupled entropy weight TOPSIS method for multi-objective optimisation design of FDM 3D printing process parameters have been verified. This study provides a theoretical basis and technical support for optimising the FDM manufacturing process in low-carbon and environmentally friendly generation.

4. Conclusions

This article aims to develop a production system that reduces greenhouse gas emissions and improves FDM printing accuracy. The following progress conclusions were obtained through the RSM-NSGA-II coupled entropy weight TOPSIS method:
(1)
Under the principle of prioritising circular runout tolerance, the combination of forming parameters A3-B3-C1-D2-E3 obtained using the orthogonal experimental method exhibits the smallest tolerance. The order of influence of each factor from high to low is E > B > A > C > D. Under the principle of prioritising carbon emissions, the combination of moulding parameters A3-B2-C1-D1-E3 is optimal. The order of factor influence from high to low is: A > B > C > E > D.
(2)
The multiple correlation coefficients R2 are 0.9730 and 0.9766, respectively, which are close to 1, indicating that the response surface model established in this paper has good adaptability.
(3)
When the layer height is 0.2 mm, the nozzle temperature is 243 °C, the filling density is 70%, and the first layer height is 0.15 mm, the circular runout tolerance value and carbon emissions are reduced by 64.29% and 53.45% respectively, compared to the original values.

Author Contributions

Conceptualization, Y.W. and Z.T.; methodology, Y.W. and Z.T.; software, Y.W. and Z.T.; validation, Y.W. and Z.T.; formal analysis, Y.W. and Z.T.; investigation, Y.W. and Z.T.; resources, Y.W. and Z.T.; data curation, Y.W. and Z.T.; writing—original draft preparation, Z.T.; writing—review Y.W. and Z.T.; visualization, Y.W. and Z.T.; supervision, Z.T.; project administration, Y.W.; funding acquisition, Y.W. and Z.T. All the authors have read and agreed to the published version of the manuscript. All authors have read and agreed to the published version of the manuscript.

Funding

This research was funded by Anhui Provincial Department of Education 2025 Action Project for the Training of Young and Middle aged Teachers in Higher Education Institutions (Backbone Teachers’ Domestic and Overseas Visiting and Training Funding Project) and Anhui Provincial Quality Engineering Project for Higher Education Institutions: Teaching Innovation Team for Additive Manufacturing Technology, grant number JNFX2025124, and 2024cxtd255.

Institutional Review Board Statement

Not applicable.

Informed Consent Statement

Not applicable.

Data Availability Statement

The original contributions presented in this study are included in the article. Further inquiries can be directed to the corresponding author.

Acknowledgments

Authors acknowledge the support of Anhui Province.

Conflicts of Interest

The authors declare no conflicts of interest.

References

  1. Hauck, S.; Greif, L.; Benner, N.; Ovtcharova, J. Advancing Sustainable Additive Manufacturing: Analyzing Parameter Influences and Machine Learning Approaches for CO2 Prediction. Sustainability 2025, 17, 3804. [Google Scholar] [CrossRef]
  2. Wiedmann, T.; Minx, J. A Definition of ‘Carbon Footprint’. In Ecological Economics Research Trends; Nova Science Publisher: Hauppauge, NY, USA, 2008; pp. 1–11. [Google Scholar]
  3. World Resources Institute (WRI). Greenhouse Gas Protocol: A Corporate Accounting and Reporting Standard; World Resources Institute: Washington, DC, USA, 2004. [Google Scholar]
  4. Jung, S.; Kara, L.B.; Nie, Z.; Simpson, T.W.; Whitefoot, K.S. Is Additive Manufacturing an Environmentally and Economically Preferred Alternative for Mass Production? Environ. Sci. Technol. 2023, 57, 6373–6386. [Google Scholar] [CrossRef]
  5. Yu, S.; Liu, H.; Zhao, G.; Zhang, H.; Hou, F.; Xu, K. A code-based method for carbon emission prediction of 3D printing: A case study on the fused deposition modeling (FDM) 3D printing and comparison with conventional approach. J. Clean. Prod. 2024, 484, 144341. [Google Scholar] [CrossRef]
  6. Ford, S.; Despeisse, M. Additive manufacturing and sustainability: An exploratory study of the advantages and challenges. J. Clean. Prod. 2016, 137, 1573–1587. [Google Scholar] [CrossRef]
  7. Elhadad, A.A.; Rosa-Sainz, A.; Caete, R.; Peralta, E.; Begines, B.; Balbuena, M.; Alcudia, A.; Torres, Y. Applications and multidisciplinary perspective on 3D printing techniques: Recent developments and future trends. Mater. Sci. Eng. R Rep. 2023, 156, 100760. [Google Scholar] [CrossRef]
  8. He, T.; Yip, W.S.; Yan, E.H.; Tang, J.; Rehan, M.; Teng, L.; Wong, C.H.; Sun, L.; Zhang, B.; Guo, F. 3D printing for ultra-precision machining: Current status, opportunities, and future perspectives. Front. Mech. Eng. 2024, 19, 23. [Google Scholar] [CrossRef]
  9. Ali, S.; Deiab, I.; Pervaiz, S. State-of-the-art review on fused deposition modeling (FDM) for 3D printing of polymer blends and composites: Innovations, challenges, and applications. Int. J. Adv. Manuf. Technol. 2024, 135, 5085–5113. [Google Scholar] [CrossRef]
  10. Ahn, S.J.; Lee, H.; Cho, K.J. 3D printing with a 3D printed digital material filament for programming functional gradients. Nat. Commun. 2024, 15, 3605. [Google Scholar] [CrossRef]
  11. Behseresht, S.; Park, Y.H.; Love, A.; Valdez Pastrana, O.A. Application of Numerical Modeling and Finite Element Analysis in Fused Filament Fabrication: A Review. Materials 2024, 17, 4185. [Google Scholar] [CrossRef]
  12. Vyavahare, S.; Teraiya, S.; Panghal, D.; Kumar, S. Fused Deposition Modelling: A Review. Rapid Prototyp. J. 2019, 26, 176–201. [Google Scholar] [CrossRef]
  13. Mallikarjuna, B.; Bhargav, P.; Hiremath, S.; Jayachristiyan, K.G.; Jayanth, N. A review on the melt extrusion-based fused deposition modeling (FDM): Background, materials, process parameters and military applications. Int. J. Interact. Des. Manuf. 2025, 19, 651–665. [Google Scholar] [CrossRef]
  14. Beigzadeh, S.; Shield, J.E. Utilizing Local Orientation Image Analysis for Microstructure Quantification in Additive Manufacturing. Mater. Charact. 2024, 210, 113761. [Google Scholar] [CrossRef]
  15. Qi, X.; Chen, G.; Li, Y.; Cheng, X.; Li, C. Applying Neural-Network-Based Machine Learning to Additive Manufacturing: Current Applications, Challenges, and Future Perspectives. Engineering 2019, 5, 721–729. [Google Scholar] [CrossRef]
  16. Penumakala, P.K.; Santo, J.; Thomas, A. A Critical Review on the Fused Deposition Modeling of Thermoplastic Polymer Composites. Compos. Part B Eng. 2020, 201, 108336. [Google Scholar] [CrossRef]
  17. Ahmad, N.N.; Wong, Y.H.; Ghazali, N.N.N. A systematic review of fused deposition modeling process parameters. Soft Sci. 2022, 2, 11. [Google Scholar] [CrossRef]
  18. Enemuoh, E.U.; Duginski, S.; Feyen, C.; Menta, V.G. Effect of Process Parameters on Energy Consumption, Physical, and Mechanical Properties of Fused Deposition Modeling. Polymers 2021, 13, 2406. [Google Scholar] [CrossRef]
  19. Tunçel, O.; Tüfekci, K.; Kahya, Ç. Multi-objective optimization of 3D printing process parameters using gray-based Taguchi for composite PLA parts. Polym. Compos. 2024, 45, 12870–12884. [Google Scholar] [CrossRef]
  20. Morvayová, A.; Contuzzi, N.; Fabbiano, L.; Casalino, G. Multi-Attribute Decision Making: Parametric Optimization and Modeling of the FDM Manufacturing Process Using PLA/Wood Biocomposites. Materials 2024, 17, 924. [Google Scholar] [CrossRef]
  21. Gao, G.; Xu, F.; Xu, J.; Tang, G.; Liu, Z. A Survey of the Influence of Process Parameters on Mechanical Properties of Fused Deposition Modeling Parts. Micromachines 2022, 13, 553. [Google Scholar] [CrossRef]
  22. Gordelier, T.J.; Thies, P.R.; Turner, L.; Johanning, L. Optimising the fdm additive manufacturing process to achieve maximum tensile strength: A state-of-the-art review. Rapid Prototyp. J. 2019, 25, 953–971. [Google Scholar] [CrossRef]
  23. Sheoran, A.J.; Kumar, H. Fused deposition modeling process parameters optimization and effect on mechanical properties and part quality: Review and reflection on present research. Mater. Today Proc. 2020, 21, 1659–1672. [Google Scholar] [CrossRef]
  24. Rajan, K.; Samykano, M.; Kadirgama, K.; Wan Harun, W.S.; Rahman, M. Fused deposition modeling: Process, materials, parameters, properties, and applications. Int. J. Adv. Manuf. Technol. 2022, 120, 1531–1570. [Google Scholar] [CrossRef]
  25. Ranjan, R.; Saha, A. A novel hybrid multi-criteria optimization of 3D printing process using grey relational analysis (GRA) coupled with principal component analysis (PCA). Eng. Res. Express 2024, 6, 015080. [Google Scholar] [CrossRef]
  26. Tunçel, O. Optimization of Charpy Impact Strength of Tough PLA Samples Produced by 3D Printing Using the Taguchi Method. Polymers 2024, 16, 459. [Google Scholar] [CrossRef]
  27. Tüfekci, K.; Çakan, B.G.; Küçükakarsu, V.M. Stress Relaxation of 3D Printed PLA of Various Infill Orientations under Tensile and Bending Loadings. J. Appl. Polym. Sci. 2023, 140, e54463. [Google Scholar] [CrossRef]
  28. Chokshi, H.; Shah, D.B.; Patel, K.M.; Joshi, S.J. Experimental investigations of process parameters on mechanical properties for PLA during processing in FDM. Adv. Mater. Process. Technol. 2021, 8, 696–709. [Google Scholar] [CrossRef]
  29. Tutar, M. A Comparative Evaluation of the Effects of Manufacturing Parameters on Mechanical Properties of Additively Manufactured PA and CF-Reinforced PA Materials. Polymers 2023, 15, 38. [Google Scholar] [CrossRef]
  30. Ulkir, O.; Kuncan, F.; Alay, F.D. Experimental Study and ANN Development for Modeling Tensile and Surface Quality of Fiber-Reinforced Nylon Composites. Polymers 2025, 17, 1528. [Google Scholar] [CrossRef]
  31. Vidakis, N.; Petousis, M.; Velidakis, E.; Liebscher, M.; Mechtcherine, V.; Tzounis, L. On the Strain Rate Sensitivity of Fused Filament Fabrication (FFF) Processed PLA, ABS, PETG, PA6, and PP Thermoplastic Polymers. Polymers 2020, 12, 2924. [Google Scholar] [CrossRef]
  32. Kharate, N.; Anerao, P.; Kulkarni, A.; Abdullah, M. Explainable AI Techniques for Comprehensive Analysis of the Relationship between Process Parameters and Material Properties in FDM-Based 3D-Printed Biocomposites. J. Manuf. Mater. Process. 2024, 8, 171. [Google Scholar] [CrossRef]
  33. Prajapati, A.R.; Dave, H.K.; Raval, H.K. Effect of Fiber Volume Fraction on the Impact Strength of Fiber Reinforced Polymer Composites Made by FDM Process. Mater. Today Proc. 2021, 44, 2102–2106. [Google Scholar] [CrossRef]
  34. Sundar Singh Sivam, S.P.; Saravanan, K.; Harshavardhana, N.; Kumaran, D. Multi response optimization of setting input variables for getting better cylindrical cups in sheet metal spinning of Al 6061–T6 by Grey relation analysis. Mater. Today Proc. 2021, 45, 1464–1470. [Google Scholar] [CrossRef]
  35. Marsavina, L.; Valean, C.; Märghitas, M.; Linul, E.; Razavi, N.; Berto, F.; Brighenti, R. Effect of the manufacturing parameters on the tensile and fracture properties of FDM 3D-printed PLA specimens. Eng. Fract. Mech. 2022, 274, 108766. [Google Scholar] [CrossRef]
  36. Daly, M.; Tarfaoui, M.; Chihi, M.; Linul, E.; Razavi, N.; Berto, F.; Brighenti, R. FDM technology and the effect of printing parameters on the tensile strength of ABS parts. Int. J. Adv. Manuf. Technol. 2023, 126, 5307–5323. [Google Scholar] [CrossRef]
  37. Ouazzani, K.; El Jai, M.; Akhrif, I.; Radouani, M.; El Fahime, B. An experimental study of FDM parameter effects on ABS surface quality: Roughness analysis. Int. J. Adv. Manuf. Technol. 2023, 127, 151–178. [Google Scholar] [CrossRef]
  38. Yankin, A.; Serik, G.; Danenova, S.; Alipov, Y.; Temirgali, A.; Talamona, D.; Perveen, A. Optimization of Fatigue Performance of FDM ABS and Nylon Printed Parts. Micromachines 2023, 14, 304. [Google Scholar] [CrossRef]
  39. Bol, R.J.M.; Šavija, B. Micromechanical Models for FDM 3D-Printed Polymers: A Review. Polymers 2023, 15, 4497. [Google Scholar] [CrossRef]
  40. Paul, S. Finite element analysis in fused deposition modeling research: A literature review. Measurement 2021, 178, 109320. [Google Scholar] [CrossRef]
  41. Silva, M.; Pinho, I.S.; Covas, J.A.; Alves, N.M.; Paiva, M.C. 3D printing of graphene-based polymeric nanocomposites for biomedical applications. Funct. Compos. Mater. 2021, 2, 8. [Google Scholar] [CrossRef]
  42. Edwards, D.A. Dependence of fused filament fabrication weld strength on experimental parameters: A numerical study. J. Manuf. Process. 2023, 85, 1066–1076. [Google Scholar] [CrossRef]
  43. Wang, P.; Zou, B.; Ding, S.; Li, L.; Huang, C. Effects of FDM-3D printing parameters on mechanical propertiesand microstructure of CF/PEEK and GF/PEEK. Chin. J. Aeronaut. 2021, 34, 236–246. [Google Scholar] [CrossRef]
  44. Li, Y.; Lou, Y. Tensile and Bending Strength Improvements in PEEK Parts Using Fused Deposition Modelling 3D Printing Considering Multi-Factor Coupling. Polymers 2020, 12, 2497. [Google Scholar] [CrossRef]
  45. Srinivasan, R.; Ruban, W.; Deepanra, A.; Bhuvanesh, R.; Bhuvanesh, T. Effect on infill density on mechanicalproperties of PETG part fabricated by fused deposition modelling. Mater. Today Proc. 2020, 27, 1838–1842. [Google Scholar] [CrossRef]
  46. León-Calero, M.; Reyburn Valés, S.C.; Marcos-Fernández, Á.; Rodríguez-Hernandez, J. 3D Printing of Thermoplastic Elastomers: Role of the Chemical Composition and Printing Parameters in the Production of Parts with Controlled Energy Absorption and Damping Capacity. Polymers 2021, 13, 3551. [Google Scholar] [CrossRef]
  47. Benié, K.; Barrière, T.; Placet, V.; Cherouat, A. Introducing a new optimization parameter based on diffusion, coalescence and crystallization to maximize the tensile properties of additive manufacturing parts. Addit. Manuf. 2023, 69, 103538. [Google Scholar] [CrossRef]
  48. Tang, C.; Liu, J.W.; Yang, Y.; Liu, Y.; Jiang, S.; Hao, W. Effect of process parameters on mechanical properties of 3D printed PLA lattice structures. Compos. Part C Open Access 2020, 3, 100076. [Google Scholar] [CrossRef]
  49. Singh, J.; Goyal, K.K.; Kumar, R. Influence of process parameters on mechanical strength, build time, and material consumption of 3D printed polylactic acid parts. Polym Compos. 2022, 43, 5908–5928. [Google Scholar] [CrossRef]
  50. Cicek, U.I.; Johnson, A.A. Multi-objective optimization of FDM process parameters for 3D-printed polycarbonate using Taguchi-based Gray Relational Analysis. Int. J. Adv. Manuf. Technol. 2025, 137, 3709–3725. [Google Scholar] [CrossRef]
  51. Al-Tamimi, A.A.; Tlija, M.; Abidi, M.H.; Anis, A.; Abd Elgawad, A.E.E. Material Extrusion of Multi-Polymer Structures Utilizing Design and Shrinkage Behaviors: A Design of Experiment Study. Polymers 2023, 15, 2683. [Google Scholar] [CrossRef]
  52. Yang, H.; Ji, F.; Li, Z.; Tao, S. Preparation of Hydrophobic Surface on PLA and ABS by Fused Deposition Modeling. Polymers 2020, 12, 1539. [Google Scholar] [CrossRef]
  53. Brancewicz-Steinmetz, E.; Sawicki, J. Bonding and Strengthening the PLA Biopolymer in Multi-Material Additive Manufacturing. Materials 2022, 15, 5563. [Google Scholar] [CrossRef] [PubMed]
  54. Wang, S.; Ma, Y.; Deng, Z.; Zhang, S.; Cai, J. Effects of fused deposition modeling process parameters on tensile, dynamic mechanical properties of 3D printed polylactic acid materials. Polym. Test. 2020, 86, 106483. [Google Scholar] [CrossRef]
  55. Hsueh, M.-H.; Lai, C.-J.; Chung, C.-F.; Wang, S.-H.; Huang, W.-C.; Pan, C.-Y.; Zeng, Y.-S.; Hsieh, C.-H. Effect of Printing Parameters on the Tensile Properties of 3D-Printed Polylactic Acid (PLA) Based on Fused Deposition Modeling. Polymers 2021, 13, 2387. [Google Scholar] [CrossRef] [PubMed]
  56. Rodríguez-Panes, A.; Claver, J.; Camacho, A.M. The Influence of Manufacturing Parameters on the Mechanical Behaviour of PLA and ABS Pieces Manufactured by FDM: A Comparative Analysis. Materials 2018, 11, 1333. [Google Scholar] [CrossRef]
  57. Yadav, D.; Chhabra, D.; Kumar Garg, R.; Ahlawat, A.; Phogat, A. Optimization of FDM 3D printing process parameters for multi-material using artificial neural network. Mater. Today Proc. 2020, 21, 1583–1591. [Google Scholar] [CrossRef]
  58. Panico, A.; Corvi, A.; Collini, L.; Sciancalepore, C. Multi objective optimization of FDM 3D printing parameters set via design of experiments and machine learning algorithms. Sci. Rep. 2025, 15, 16753. [Google Scholar] [CrossRef]
  59. Layeb, N.; Barhoumi, N.; Oldal, I.; Keppler, I. Improving the strength properties of PLA acetabular liners by optimizing FDM 3D printing: Taguchi approach and finite element analysis validation. Int. J. Adv. Manuf. Technol. 2025, 137, 2649–2664. [Google Scholar] [CrossRef]
  60. Sharifi, J.; Jubinville, D.; Mekonnen, T.H.; Fayazfar, H.R. Systematic Optimization of FDM 3D Printing Parameters for PLA: PBAT–Hemp Composites Using Taguchi Design. J. Polym. Environ. 2025, 33, 3663–3676. [Google Scholar] [CrossRef]
  61. Jabeur, M.; Souissi, S.; Jerbi, A.; Elloumi, A. Optimization of FDM 3D printing parameters of PLA and composite materials using definitive screening design. Int. J. Adv. Manuf. Technol. 2025, 139, 3989–3998. [Google Scholar] [CrossRef]
  62. Kidie, F.M.; Ayaliew, T.G.; Mekonone, S.T. Optimizing 3D printing process parameters to improve surface quality and investigate the microstructural characteristics of PLA material. Int. J. Adv. Manuf. Technol. 2025, 138, 457–470. [Google Scholar] [CrossRef]
  63. Bharat, N.; Kumar, V.; Mishra, V.; Veeman, D.; Vellaisamy, M. Influence of 3D Printing FDM Process Parameters on Compressive Strength of PLA/Carbon Fiber Composites: ANOVA and Backpropagation Neural Network Approach. J. Mater. Eng. Perform. 2025, 34, 20830–20843. [Google Scholar] [CrossRef]
  64. Zheng, H.; Zhu, S.; Chen, L.; Wang, L.; Zhang, H.; Wang, P.; Sun, K.; Wang, H.; Liu, C. 3D Printing Continuous Fiber Reinforced Polymers: A Review of Material Selection, Process, and Mechanics-Function Integration for Targeted Applications. Polymers 2025, 17, 1601. [Google Scholar] [CrossRef] [PubMed]
  65. Turker, B. Redesigning FDM Platforms for Bio-Printing Applications. Micromachines 2025, 16, 226. [Google Scholar] [CrossRef] [PubMed]
  66. Zhang, H.; Duan, M.; Qin, S.; Zhang, Z. Preparation and Modification of Porous Polyetheretherketone (PEEK) Cage Material Based on Fused Deposition Modeling (FDM). Polymers 2022, 14, 5403. [Google Scholar] [CrossRef]
  67. Saviano, M.; Bowles, B.J.; Penny, M.R.; Ishaq, A.; Muwaffak, Z.; Falcone, G.; Russo, P.; Hilton, S.T. Development and analysis of a novel loading technique for FDM 3D printed systems: Microwave-assisted impregnation of gastro-retentive PVA capsular devices. Int. J. Pharm. 2022, 613, 121386. [Google Scholar] [CrossRef]
  68. Alaimo, G.; Marcon, I.S.; Costato, L.; Auricchio, F. Influence of meso-structure and chemical composition on FDM 3D-printed parts. Compos. Part B Eng. 2017, 113, 371–380. [Google Scholar] [CrossRef]
  69. Chaunier, L.; Guessasma, S.; Belhabib, S.; Della Valle, G.; Lourdin, D.; Leroy, E. Material extrusion of plant biopolymers: Opportunities & challenges for 3D printing. Addit. Manuf. 2018, 21, 220–233. [Google Scholar] [CrossRef]
  70. Crapnell, R.D.; Kalinke, C.; Silva, L.R.G.; Stefano, J.S.; Williams, R.J.; Abarza Munoz, R.A.; Bonacin, J.A.; Janegitz, B.C.; Banks, C.E. Additive manufacturing electrochemistry: An overview of producing bespoke conductive additive manufacturing filaments. Mater. Today 2023, 71, 73–90. [Google Scholar] [CrossRef]
Figure 1. FDM process schematic.
Jcs 09 00621 g001
Figure 2. Surface microstructure of FDM melt deposition.
Jcs 09 00621 g002
Figure 3. Flowchart of the FDM experimental methodology.
Jcs 09 00621 g003
Figure 4. FDM printing of PLA samples. (a) FDM 3D printing equipment; (b) The main components of the FDM 3D printer; (c) Printing parts.
Jcs 09 00621 g004
Figure 5. Physical picture of the measurement platform.
Jcs 09 00621 g005
Figure 6. Monitoring Equipment.
Jcs 09 00621 g006
Figure 7. The actual printed sample (the orthogonal experiment).
Jcs 09 00621 g007
Figure 8. The effects of various parameters on circular runout tolerance.
Jcs 09 00621 g008
Figure 9. The effects of various parameters on carbon emissions.
Jcs 09 00621 g009
Figure 10. Diagnostic Plots: (a) Predicted versus actual graph of circular runout tolerance; (b) Predicted versus actual graph of carbon emissions.
Jcs 09 00621 g010
Figure 11. Pareto front of non-dominated solutions.
Jcs 09 00621 g011
Figure 12. Pareto front validation with 500 random experiments.
Jcs 09 00621 g012
Figure 13. Relative closeness of each program.
Jcs 09 00621 g013
Figure 14. The optimal decision solution.
Jcs 09 00621 g014
Table 1. Control factors and levels.
Factor LevelA: Layer HeightB: Nozzle TemperatureC: Filler DensityD: First Layer HeightE: Printing Pattern
10.10230700.05Grid type (1)
20.15240800.10Linear type (2)
30.20250900.15Concentric type (3)
Table 2. The results of the orthogonal experiment.
No.A/mmB/°CC/%D/mmE
10.1230700.051
20.1240800.12
30.1250900.153
40.15230700.12
50.15240800.153
60.15250900.051
70.2230800.053
80.2240900.11
90.2250700.152
100.1230900.152
110.1240700.053
120.1250800.11
130.15230800.151
140.15240900.052
150.15250700.13
160.2230900.13
170.2240700.151
180.2250800.052
Table 3. Design of the experimental factor level.
Control FactorsLevel
−101
A. Layer height/mm0.100.150.20
B. Nozzle temperature/°C230240250
C. Filler density/%708090
D. First layer layer height/mm0.050.100.15
Table 4. Response surface optimization, experimental design, and results.
No.Control FactorsQuality Index
ABCDCircular Runout Tolerance/mmCarbon Emissions/g
10.15240900.050.1821.18
20.15240800.10.3819.52
30.15250800.150.3520.37
40.1230800.10.2925.46
50.15240900.150.3822.64
60.15230900.10.2423.76
70.15240800.10.3919.93
80.1240900.10.2026.86
90.15240800.10.3719.18
100.2240700.10.1614.87
110.2240900.10.3417.54
120.1250800.10.3224.8
130.15250700.10.1919.17
140.2250800.10.2416.89
150.1240800.150.3726.05
160.15230700.10.3218.28
170.15240700.050.2817.96
180.1240700.10.3623.26
190.15240700.150.2118.00
200.15240800.10.3620.68
210.1240800.050.3224.99
220.2240800.150.3816.86
230.15240800.10.3720.97
240.15250900.10.3123.68
250.15230800.050.2820.43
260.15230800.150.3321.17
270.2230800.10.3516.80
280.2240800.050.2715.96
290.15250800.050.2120.02
Table 5. Regression analysis of variance for circular runout tolerance.
SourceSum of SquaresdfMean SquareF-Valuep-ValueSignificant
Model0.1355140.009736.01<0.0001**
A0.001210.00124.470.0530
B0.003010.003011.200.0048
C0.001410.00145.240.0381
D0.019210.019271.46<0.0001**
AB0.004910.004918.240.0008
AC0.028910.0289107.56<0.0001**
AD0.000910.00093.350.0886
BC0.010010.010037.22<0.0001**
BD0.002010.00207.540.0158
CD0.018210.018267.83<0.0001
A20.003610.003613.520.0025
B20.013110.013148.70<0.0001**
C20.038910.0389144.69<0.0001**
D20.005310.005319.840.0005
Residual0.0038140.0003
Lack of Fit0.0032100.00032.490.1962ns
Pure Error0.000540.0001
Cor Total0.139228
Note: p < 0.01 is highly significant and is denoted by **, p > 0.05 is not significant and is denoted by ns. R2 = 0.9730, Adj R2 = 0.9460.
Table 6. Regression analysis of variance for carbon emissions.
SourceSum of SquaresdfMean SquareF-Valuep-ValueSignificant
Model285.221420.3741.68<0.0001**
A229.691229.69469.90<0.0001**
B0.078410.07840.16040.6948
C48.48148.4899.18<0.0001**
D1.7311.733.530.0813
AB0.140610.14060.28770.6001
AC0.216210.21620.44240.5168
AD0.006410.00640.01310.9105
BC0.235210.23520.48120.4992
BD0.038010.03800.07780.7844
CD0.504110.50411.030.3271
A22.0112.014.100.0623
B22.4712.475.060.0411
C20.173810.17380.35550.5606
D20.006910.00690.01410.9072
Residual6.84140.4888
Lack of Fit4.55100.45480.79260.6529ns
Pure Error2.3040.5738
Cor Total292.0628
Note: p < 0.01 is highly significant and is denoted by **, p > 0.05 is not significant and is denoted by ns. R2 = 0.9766, Adj R2 = 0.9531.
Table 7. Information entropy and entropy weight of each evaluation index.
Evaluation IndexInformation EntropyEntropy Weight
Circular runout tolerance0.99610.4059
Carbon emissions0.99430.5941
Table 8. Verification test results.
Evaluation IndexCircular Runout Tolerance/mmCarbon Emissions/g
Original value0.4232.07
Test value (Optimization)0.1514.93
Disclaimer/Publisher’s Note: The statements, opinions and data contained in all publications are solely those of the individual author(s) and contributor(s) and not of MDPI and/or the editor(s). MDPI and/or the editor(s) disclaim responsibility for any injury to people or property resulting from any ideas, methods, instructions or products referred to in the content.