Article

Impact of Cement Storage Temperature on the Mechanical, Microstructural, and Chemical Properties of Sustainable Mortars

by
Heliana C. B. Nascimento
1,2,
Bruno S. Teti
1,
Rafael C. Manta
1,
Delma G. Rocha
1,2,
José Allef F. Dantas
1,
Sanderson D. Jesus
1,
Paulo R. L. Souza
1,
Nathan B. Lima
1,3,* and
Nathalia B. D. Lima
1,2,*
1
Brazilian Institute for Material Joining and Coating Technologies (INTM), Federal University of Pernambuco, Recife 50740-540, Brazil
2
Department of Fundamental Chemistry, Federal University of Pernambuco, Recife 50740-560, Brazil
3
Department of Mechanical Engineering, Federal University of Pernambuco, Recife 50740-530, Brazil
*
Authors to whom correspondence should be addressed.
J. Compos. Sci. 2025, 9(11), 583; https://doi.org/10.3390/jcs9110583 (registering DOI)
Submission received: 30 September 2025 / Revised: 13 October 2025 / Accepted: 23 October 2025 / Published: 1 November 2025
(This article belongs to the Special Issue Sustainable Cementitious Composites)

Abstract

The present work investigated the effect of different storage temperatures (10 °C, 30 °C, and 50 °C) on the mechanical, structural, chemical, and microstructural properties of a set of sustainable mortars with gray waste. Three types of mortar were investigated: (1) Type A, prepared from a proportion of 1 part cement: 1 part hydrated lime: 6 parts sand; (2) Type B, prepared from a proportion of 1 part cement: 1 part hydrated lime: 6 parts sand: 0.1 part waste; and (3) Type C, prepared from a proportion of 0.9 part cement: 1 part hydrated lime: 6 parts sand: 0.1 part waste. The waste incorporation reduced compressive strength by 8%, while partial cement replacement reduced by 33%. The cement storage at 10 °C preserved the compressive strength, whereas storage at 50 °C increased it by 8.8%. In type B mortar, the waste incorporation improved compressive strength by 19% at 50 °C. The most substantial enhancement occurred in type C mortar, where cement replacement with residue and storage at 50 °C led to a 27% increase. These results highlight the potential of higher storage temperatures to mitigate cement degradation in humid environments. Furthermore, XRD analysis revealed that cement storage temperature did not affect the formation of primary cement phases, as degradation products were chemically similar to hydration products. However, sustainable mortars exhibited changes in the C-S-H phase signal when the cement is stored for 90 days at 30 °C. Finally, SEM and EDS analyses identified variations in Ca, Si, and O proportions depending on storage conditions.

1. Introduction

Hydraulic cement is a material made by heating, at approximately 1450 °C, a mixture of calcium carbonate (CaCO3, limestone), a compound containing hydrated aluminum oxides and silica (clay), Al2O3 • 2 SiO2 • H2O [1], and may even include other materials of similar sizes and sufficient reactivities, to which it is subsequently subjected to the addition of calcium sulfate (CaSO4) [2], generally in the form of CaSO4 • 1/2H2O (gypsum) [3], to that it plays its role in controlling the course of its hardening as well as the associated resistance [2,4].
Hydraulic cement combines several minerals that form a paste-like substance when heated and mixed with water. This paste sets and hardens over time, providing a solid material for construction projects [5,6]. It is used to produce concrete, mortar, and grout, and later to construct structures [7].
The hydraulic cement hydration process is a complex system and one of several individual hydration processes [8,9]. Follows characteristic laws of reactions, including nucleation and growth, interaction at phase boundaries, and diffusion. The process is heterogeneous and involves the production of heat. It is affected by several factors, including the water-cement ratio, curing temperature [10], aluminum, and sulfate concentration, aluminate/SO3 ratio [11], the application of complex additives [9], cement ratio [12], temperature [13], and specific surface area [12]. Nano silica, active pozzolanic materials, and Portlandite [14] are some factors that can also influence the hydration process of Portland cement.
Some measures are implemented to extend the useful life of Portland cement, such as storing it in dry, well-ventilated environments and protecting it from humidity and extreme temperature variations [15,16,17]. It is also recommended that Portland cement be stored and mixed according to the manufacturer’s instructions [18,19]. To reduce the environmental impact of cement production, the Chinese government has increased food and environmental safety regulations [20].
Employing a waste glass-based activator to produce alkali-activated concrete can further reduce environmental impacts [21]. The adoption of alkali-activated concrete can significantly reduce these ecological impacts, with an average reduction of 64% for Alkali-Activated Blast Furnace Slag Concrete (AABC) and 70% for Alkali-Activated Fly Ash Concrete (AABR) in global warming potential, 23%, and 35%, respectively, in acidification potential, and 53% and 60% in terrestrial eutrophication. However, its sustainability is still reduced by the high embodied energy of the chemicals used in activation [21].
Kryvenko et al. [22] critically analyzed alkali-activated cement (AAC) as a sustainable material, demonstrating its advantages over traditional Portland cement in terms of environmental and technical aspects. Alkali-activated cement usually consists of two components: a cementitious component and alkaline activators. These materials include granulated blast furnace slag, granulated phosphorus slag, steel slag, coal fly ash, volcanic glass, zeolite, metakaolin, silica fume, and non-ferrous slag [23].
AAC has higher physical and mechanical properties and durability than conventional cement. The advantages of AAC result from the composition of the phases of its hydrates, without portlandite or ettringite [22]. Ecological advantages are associated with reducing or eliminating non-renewable raw materials from Portland cement clinker, application waste, and low specific energy consumption in cement production [22]. For these reasons, Alkali-activated materials are a viable alternative to the traditional production of Portland Cement and are essential for the building construction industry.
Japan was selected as an exemplary case for achieving improved environmental performance in cement production [24]. Cement production is associated with a considerable environmental burden. Therefore, it is essential to fully understand the ecological impacts of applying Portland cement before effective measures can be taken [25].
Sustainable cement-based materials have been reported, including the incorporation of glass waste [26,27], fly ash [28], blast furnace slag [29], construction and demolition waste [30], and polymers [31] in mortars and concretes. These wastes have demonstrated the potential to partially replace cement or conventional aggregates partially, reducing the consumption of natural resources and mitigating the environmental impact associated with the inappropriate disposal of these materials [27,32]. Recent studies indicate that adding these residues can improve concrete’s mechanical and thermal properties, such as compressive strength, and promote excellent durability and resistance to degrading factors [33,34].
The use of cement in tropical regions is subject to several problems, including corrosion caused by the penetration of saline water. In such coastal areas with high humidity and temperatures, concrete and reinforced concrete structures become highly corroded, making Portland cement an ineffective material for these regions [35,36]. Therefore, it is necessary to incorporate mineral additions, such as silica fume, to enhance the properties of the cement paste [37]. This would reduce cement usage and CO2 emissions [38], and improve corrosion and abrasion resistance [37].
Concrete is the world’s most consumed artificial material globally [39]. According to the World Cement Association, global cement production is expected to reach 8.2 billion tons by 2030 [40]. Cement production accounts for about 7% of industrial energy use and 7% of global carbon dioxide emissions [41,42]. The large amounts of CO2 emissions are mainly due to the high-temperature firing of raw materials in production [41]. The substantial consumption of Portland cement and the rapid growth rate of its global production have raised concerns regarding the sustainability of its manufacturing process. The relatively high carbon footprint and energy intensity associated with Portland cement have driven efforts to modify the chemistry of cement, its production methods, and the use and storage conditions [41].
Significant advances in the characteristics of Portland cement were reported by Liu et al. [43] In this work, Portland cement was kinetically and thermodynamically simulated. The results suggest that increasing the specific surface area to an appropriate level could be a solution to accelerate hydration that is delayed due to low temperatures. In addition, Juilland et al. reported characteristics in dissolution understanding and their implications for cement hydration [5]. The authors reported that the most hydration kinetic regimes of alite can be evaluated from a dissolution perspective.
Despite notable progress in research on construction materials, a gap remains in understanding the optimal storage conditions for Portland cement in tropical environments. While previous studies have primarily focused on the mechanical properties and durability of cement, many do not sufficiently address the challenges posed by humid and hot climates [41]. In this sense, the novelty of this work is to evaluate the impact of different storage temperatures of Portland cement on the microstructural and mechanical properties of a set of sustainable mortars prepared with the incorporation of gray waste. Due to the demand for cement in tropical regions and its environmental impacts, it is necessary to explore alternative solutions that offer the same properties.
In this article, different storage temperatures of hydraulic cement (10 °C, 30 °C, and 50 °C) were investigated over 105 days (a period longer than the cement’s validity period) in the preparation of three types of mortars (two sustainable and one reference). In this sense, sustainable mortars were prepared by adding gray waste and replacing cement stored at different temperatures with waste. The mechanical behavior of the mortars and microstructural characteristics were investigated to analyze the effects of storage temperature. For this, compressive strength tests and XRD, SEM, and SEM/EDS experiments were performed.

2. Materials and Methods

2.1. Materials

The hydraulic Portland cement, type II Z-32 (source POTY, Pernambuco/Brazil), was stored under a meticulously designed set of varying conditions, each of which significantly impacted the quality and performance of the cement during the construction process. A fraction corresponding to 1/3 of the total weight was stored in refrigeration equipment, at a temperature of 10 °C, in a plastic bag sealed with adhesive tape; another third was kept in the same type of plastic bag, also sealed, but at room temperature (30 °C); the final third was placed in open beakers, with a capacity of 500 mL, in an oven at a constant temperature of 50 °C. Table 1, presented below, contains data on the chemical composition of cement type II Z-32. For the present work, Type I lime was chosen for its high purity and lower moisture content compared to other available categories, as well as its specific chemical characteristics and physical properties. Table 2 details the chemical characteristics and physical properties of the hydrated lime (source Megaó, Pernambuco/Brazil).
The sand employed was meticulously prepared natural fine sand. Before preparing the samples, they were carefully dried in an oven at 100 °C to ensure their purity and consistency.
Furthermore, the solid waste used was construction and demolition (gray waste) type ‘A’ concrete, with a mechanical compressive strength of 30 MPa. A total of 350 kg of material was later taken to a recycling center located in the metropolitan region of Recife to be crushed. As shown in Figure 1a, the process is shown, and Figure 1b shows the waste ready to use.

2.2. The Production of Mortars

Three types of mortar were investigated: (1) Type A, prepared from a proportion of 1 part cement: 1 part hydrated lime: 6 parts sand; (2) Type B, prepared from a proportion of 1 part cement: 1 part hydrated lime: 6 parts sand: 0.1 part waste; and (3) Type C, prepared from a proportion of 0.9 part cement: 1 part hydrated lime: 6 parts sand: 0.1 part waste. This design has been previously reported [39]. The hydraulic cement used in each mortar type was stored for 105 days. In general, it is considered a 90-day validity period from the dispatch date for bagged cement. However, some manufacturers adopt shorter timeframes, taking into account each region’s climatic conditions to ensure cement quality. From then on, intervals of 15 days were adopted for this research, starting from day zero up to 105 days (15 days after the validity period). The mortars were prepared every 15 days to evaluate the impact of cement storage temperature on the materials’ mechanical performance. As shown in Table 3 below, the following quantities of cement, lime, sand, residue, and water/cement ratio were used in each situation to produce six specimens of mortar. Materials were weighed and mixed in a 5 L automatic mortar mixer. Then, the mortar was placed in cylindrical molds 5 cm in diameter and 10 cm in height in four layers of approximately equal height, with each layer receiving 30 uniform and evenly distributed blows with the socket to homogenize the mortar inside the molds. After 24 h, it was demolded and submerged in a water container for a moist cure for 28 days.
The investigation covered the production of three types of mortar, with dosages carefully adjusted to include the reference, the addition, and the partial replacement of cement with residue. The periodic preparation of mortars and monitoring of cement storage conditions aimed at understanding the effects of these variables on the mechanical performance of the materials. Table 3 highlights the specific proportions of precursors used in each mortar type, reflecting the consistency in the parameters and the water/cement ratio. This experimental planning allows for a precise comparative analysis of the impact of different proportions and storage conditions on the final properties of the mortars produced.

2.3. X-Ray Diffraction (XRD)

X-ray diffraction tests were performed in a Shimadzu XRD–7000 diffractometer (Kyoto/Japan) with the following configuration: angular step = 0.01°; scan range: 5 to 70° (2θ); rotation speed: 15 rpm; scan speed: 0.5°/min; current: 30 mA; tension: 30 kV; divergence slit: 1.0°; scattering slit: 1.0°; receiving slit: 0.3 mm, as shown in Figure 2.
As shown in Figure 2, the X-ray diffractometer operates by exposing a sample to high-intensity X-rays, which, when interacting with the atomic planes of the material, are diffracted at specific angles, as Bragg’s Law describes. The generated diffraction pattern, characterized by peaks at angles, is then recorded and analyzed, allowing the identification of the crystalline phases present and the structural organization of the material. The samples’ phases were identified using the Highscore Plus software 4.5. A database centered on the reliable Crystallography Open Database system was employed for qualitative analysis.

2.4. Scanning Electron Microscopy (SEM) and Energy Dispersive Spectroscopy (EDS)

According to Figure 3, Scanning Electron Microscopy with Energy Dispersive Spectroscopy (SEM/EDS) experiments were carried out on a TESCAN MIRA 3 microscope (Brno/Czech Republic) using a main electron beam generated from a tungsten filament with an acceleration voltage of 15 kV.
Samples of cement-based materials were fixed to carbon supports using carbon adhesive tape to minimize electrostatic interference and subsequently metalized with a thin layer of gold to increase surface conductivity. The images were obtained with magnifications of up to 50,000 times (50 kx), allowing a detailed analysis of the microstructure and distribution of chemical elements in the cement matrix.

2.5. Compressive Strength Measurements

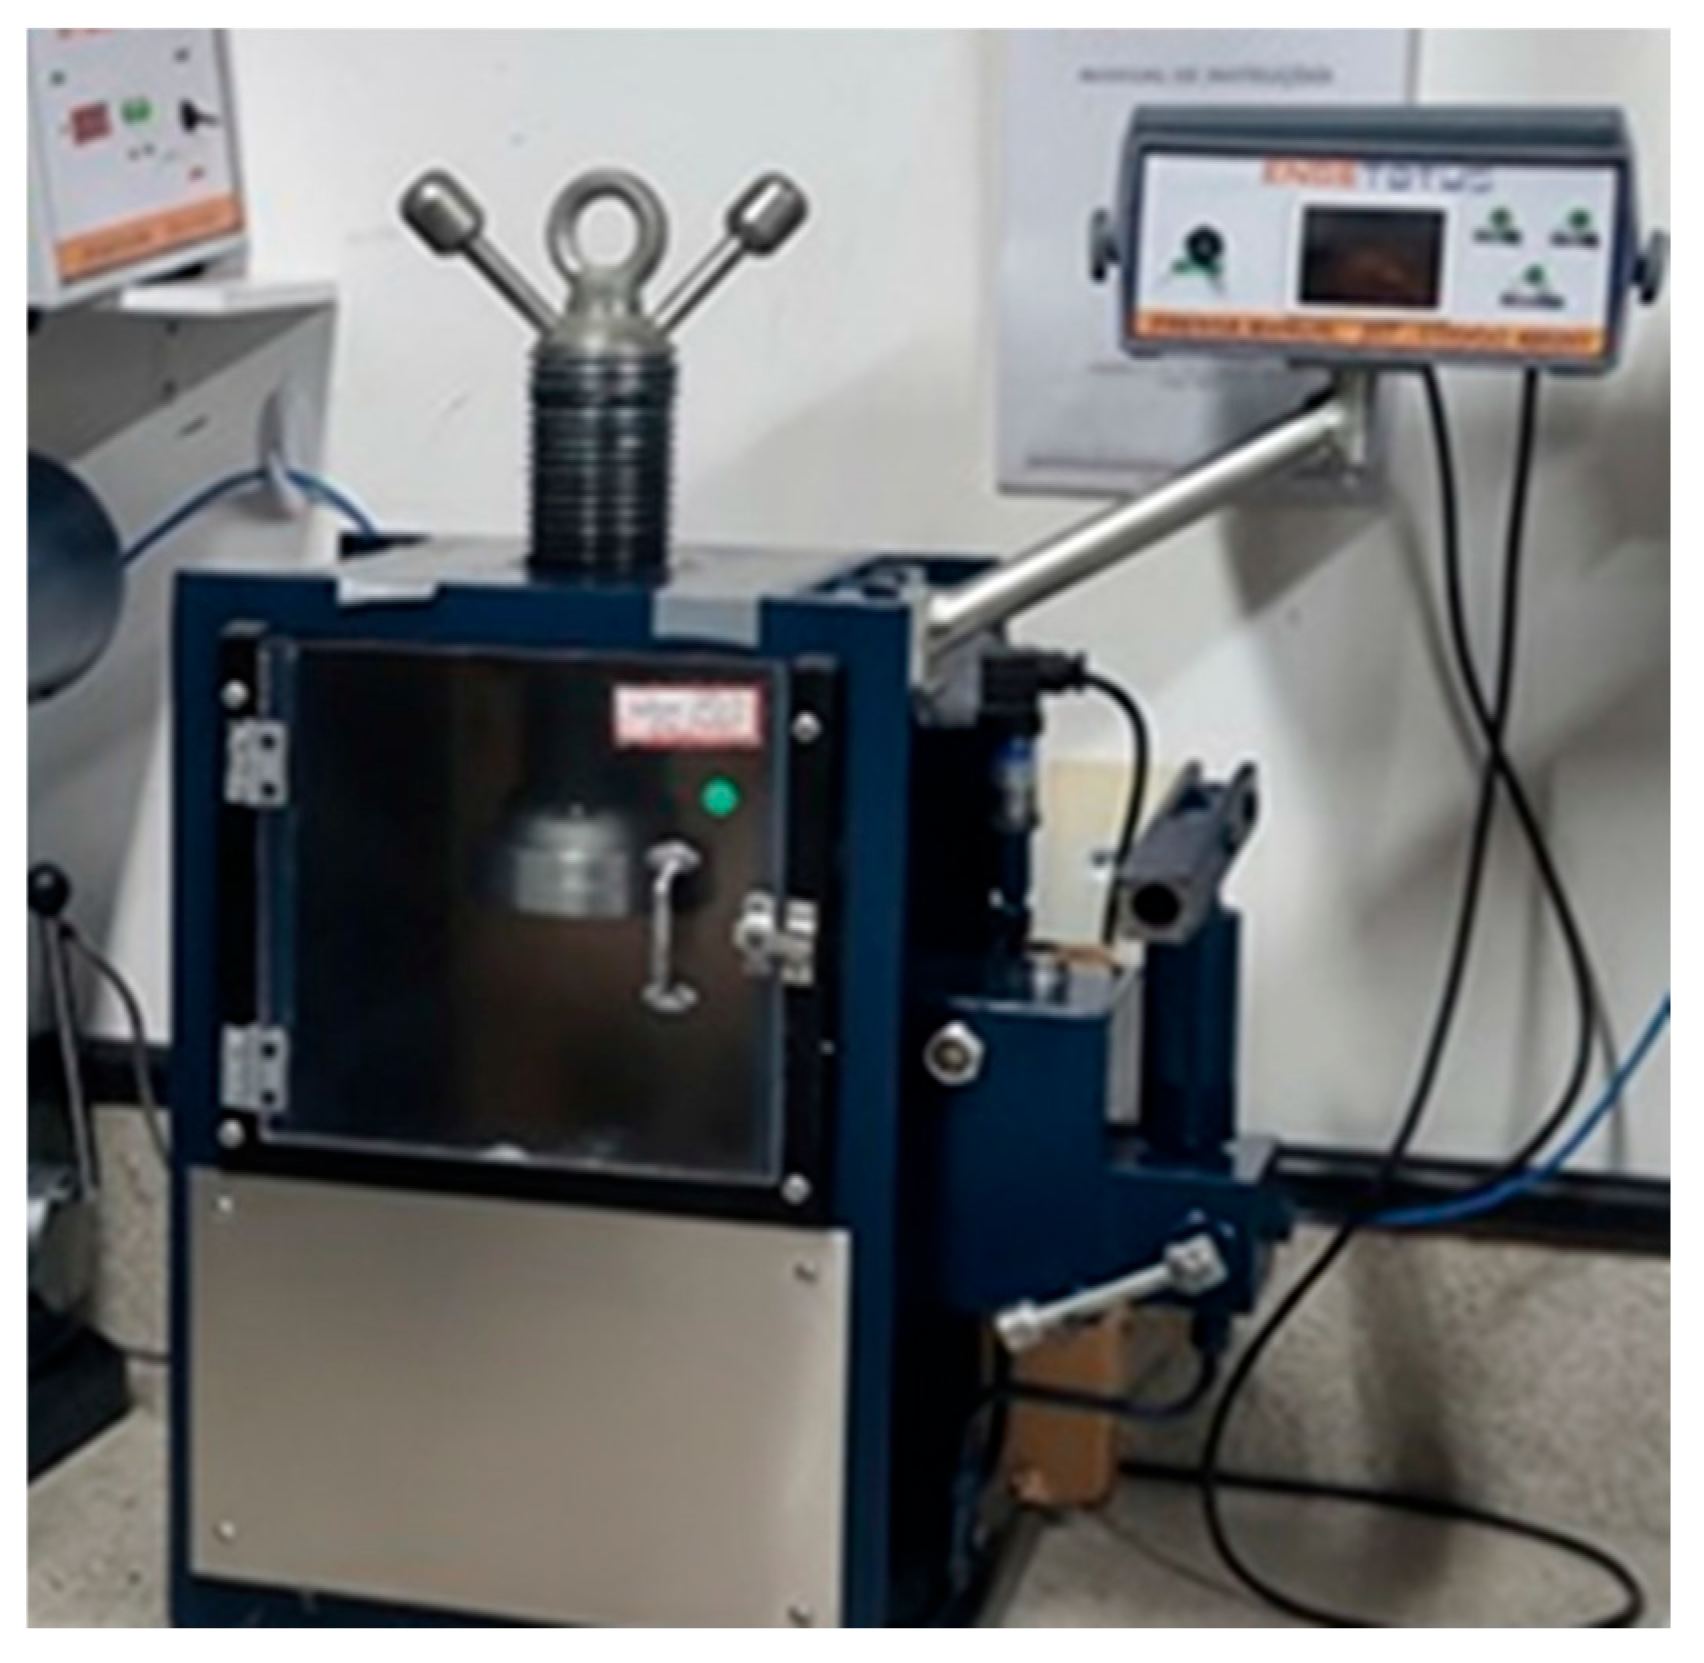
Compressive strength tests were conducted using an Engetotus model hydraulic press (São Paulo/Brazil, Figure 4), which has a maximum load application capacity of 20 tons. Six cylindrical specimens were molded for each type of cement-based material, and the cement was previously stored at different temperatures.
The cement was stored at environmental temperature, and the first ten samples were made with the material stored at 30 °C and subjected to wet curing for 28 days. Subsequently, the cement was stored at two additional temperatures (10 °C and 50 °C) for 105 days, being used to manufacture mortar specimens for compressive strength tests at intervals of 15 days.

3. Results and Discussion

3.1. The Impact of the Temperature Storage on the Mechanical Behavior of the Mortars

A comprehensive analysis was carried out to evaluate the effect of varying storage temperatures on the mechanical properties of the investigated mortars. The compressive strengths of mortars of types A, B, and C were determined using new cement. Type A was considered the reference, while type B involved the addition of materials to the mixture, and type C consisted of the partial replacement of cement with construction and demolition waste. The resistance results for each situation are presented in Figure 5, allowing a detailed and thorough analysis of the thermal effects on the performance of the mortars, instilling confidence in the robustness of this research.
As shown in Figure 5, the average compressive strength values obtained were 7.2 MPa, 6.6 MPa, and 4.8 MPa for mortars of types A, B, and C, respectively [39]. It was observed that the incorporation of ash residue in the form of addition resulted in a reduction of approximately 8% in the compressive strength of commercial mortar (type A). Despite this reduction, using waste in cement matrices is a sustainable strategy that mitigates environmental impacts [42,43,44,45,46,47]. In the case of type C mortar, which partially replaced cement with aggregate, there was a more pronounced drop of 33% in compressive strength. This inferior performance can be attributed to the lower amount of cement in the mixture, which compromises the mortar’s mechanical resistance [40].
The results in Table 4, Table 5 and Table 6 show the average compressive strength values of mortars of types A, B, and C, prepared with Portland cement stored at different temperatures: 10 °C, 30 °C, and 50 °C, and on various days. Considering the reference mortar, as shown in Figure 5 (Type A), the storage condition at 10 °C maintained compressive strength. However, when the 50 °C condition was considered a storage strategy, it proved more effective than in a colder environment. As expected by the kinetic formalism, there was an increase in compressive strength of 8.8%.
The standard deviation indicates that the data dispersion is highest at 10 °C (0.845), followed by 30 °C (0.789), and lowest at 50 °C (0.743). Similarly, the variance follows this trend. This suggests that a storage temperature of 30 °C yields the highest average strength, albeit with considerable variation, while 50 °C exhibits the lowest dispersion of values, thereby ensuring greater stability in the results.
With the addition of residue (Table 5), compressive strength increased in all types of type B mortar. In particular, the increase was 19% in mortar prepared with Portland cement stored at 50 °C.
For type B mortar, the data analysis indicates that compressive strength varies with temperature. The highest average strength was recorded at 50 °C (8.1 MPa), followed by 30 °C (7.6 MPa) and 10 °C (6.8 MPa). Regarding data dispersion, the highest standard deviation was observed at 10 °C (0.948), indicating greater variability in the results, while the lowest dispersion occurred at 30 °C (0.854), suggesting better stability. The variance reinforces this trend, with values of 0.899 at 10 °C, 0.730 at 30 °C, and 0.752 at 50 °C. Thus, 50 °C presented the highest average strength but with considerable variation, whereas 30 °C showed lower dispersion, ensuring greater predictability in the results.
Table 6 shows that the greatest increases in compressive strength were observed for type C mortar (in which the cement was replaced with residue). When the mortar was prepared with cement stored at 50 °C, a 27% increase was observed.
The 50 °C temperature exhibited the highest average strength (6.6 MPa), but with significant variability (1.106 standard deviations). On the other hand, 30 °C achieved slightly lower strength (6.3 MPa) but with the least data dispersion (0.680 standard deviation and 0.462 variance), ensuring greater predictability. Conversely, 10 °C showed the lowest average strength (5.9 MPa) and the highest dispersion, indicating greater instability in the results. In this sense, Nascimento et al. [39] investigated the effects of different temperatures (10 °C, 30 °C, and 50 °C) on the deterioration of hydraulic cement, as well as its microstructural and mechanical behaviors. Kinect investigations were carried out to advance a chemical formalism deterioration of cement stored at different temperatures in a tropical climate. It was concluded that sustainable mortars exhibited better mechanical performance than traditional ones, especially when the cement was stored at 50 °C, as predicted by the kinetic formalism. These results show a mortar with performance equivalent to the reference mortar prepared with the addition and replacement of 10% solid residue. Therefore, as a strategy to minimize the rate of deterioration of cement stored in humid conditions, warm temperatures are promising to be applied instead of ambient conditions, which are often used [39].

3.2. Structural and Microstructural Characteristics

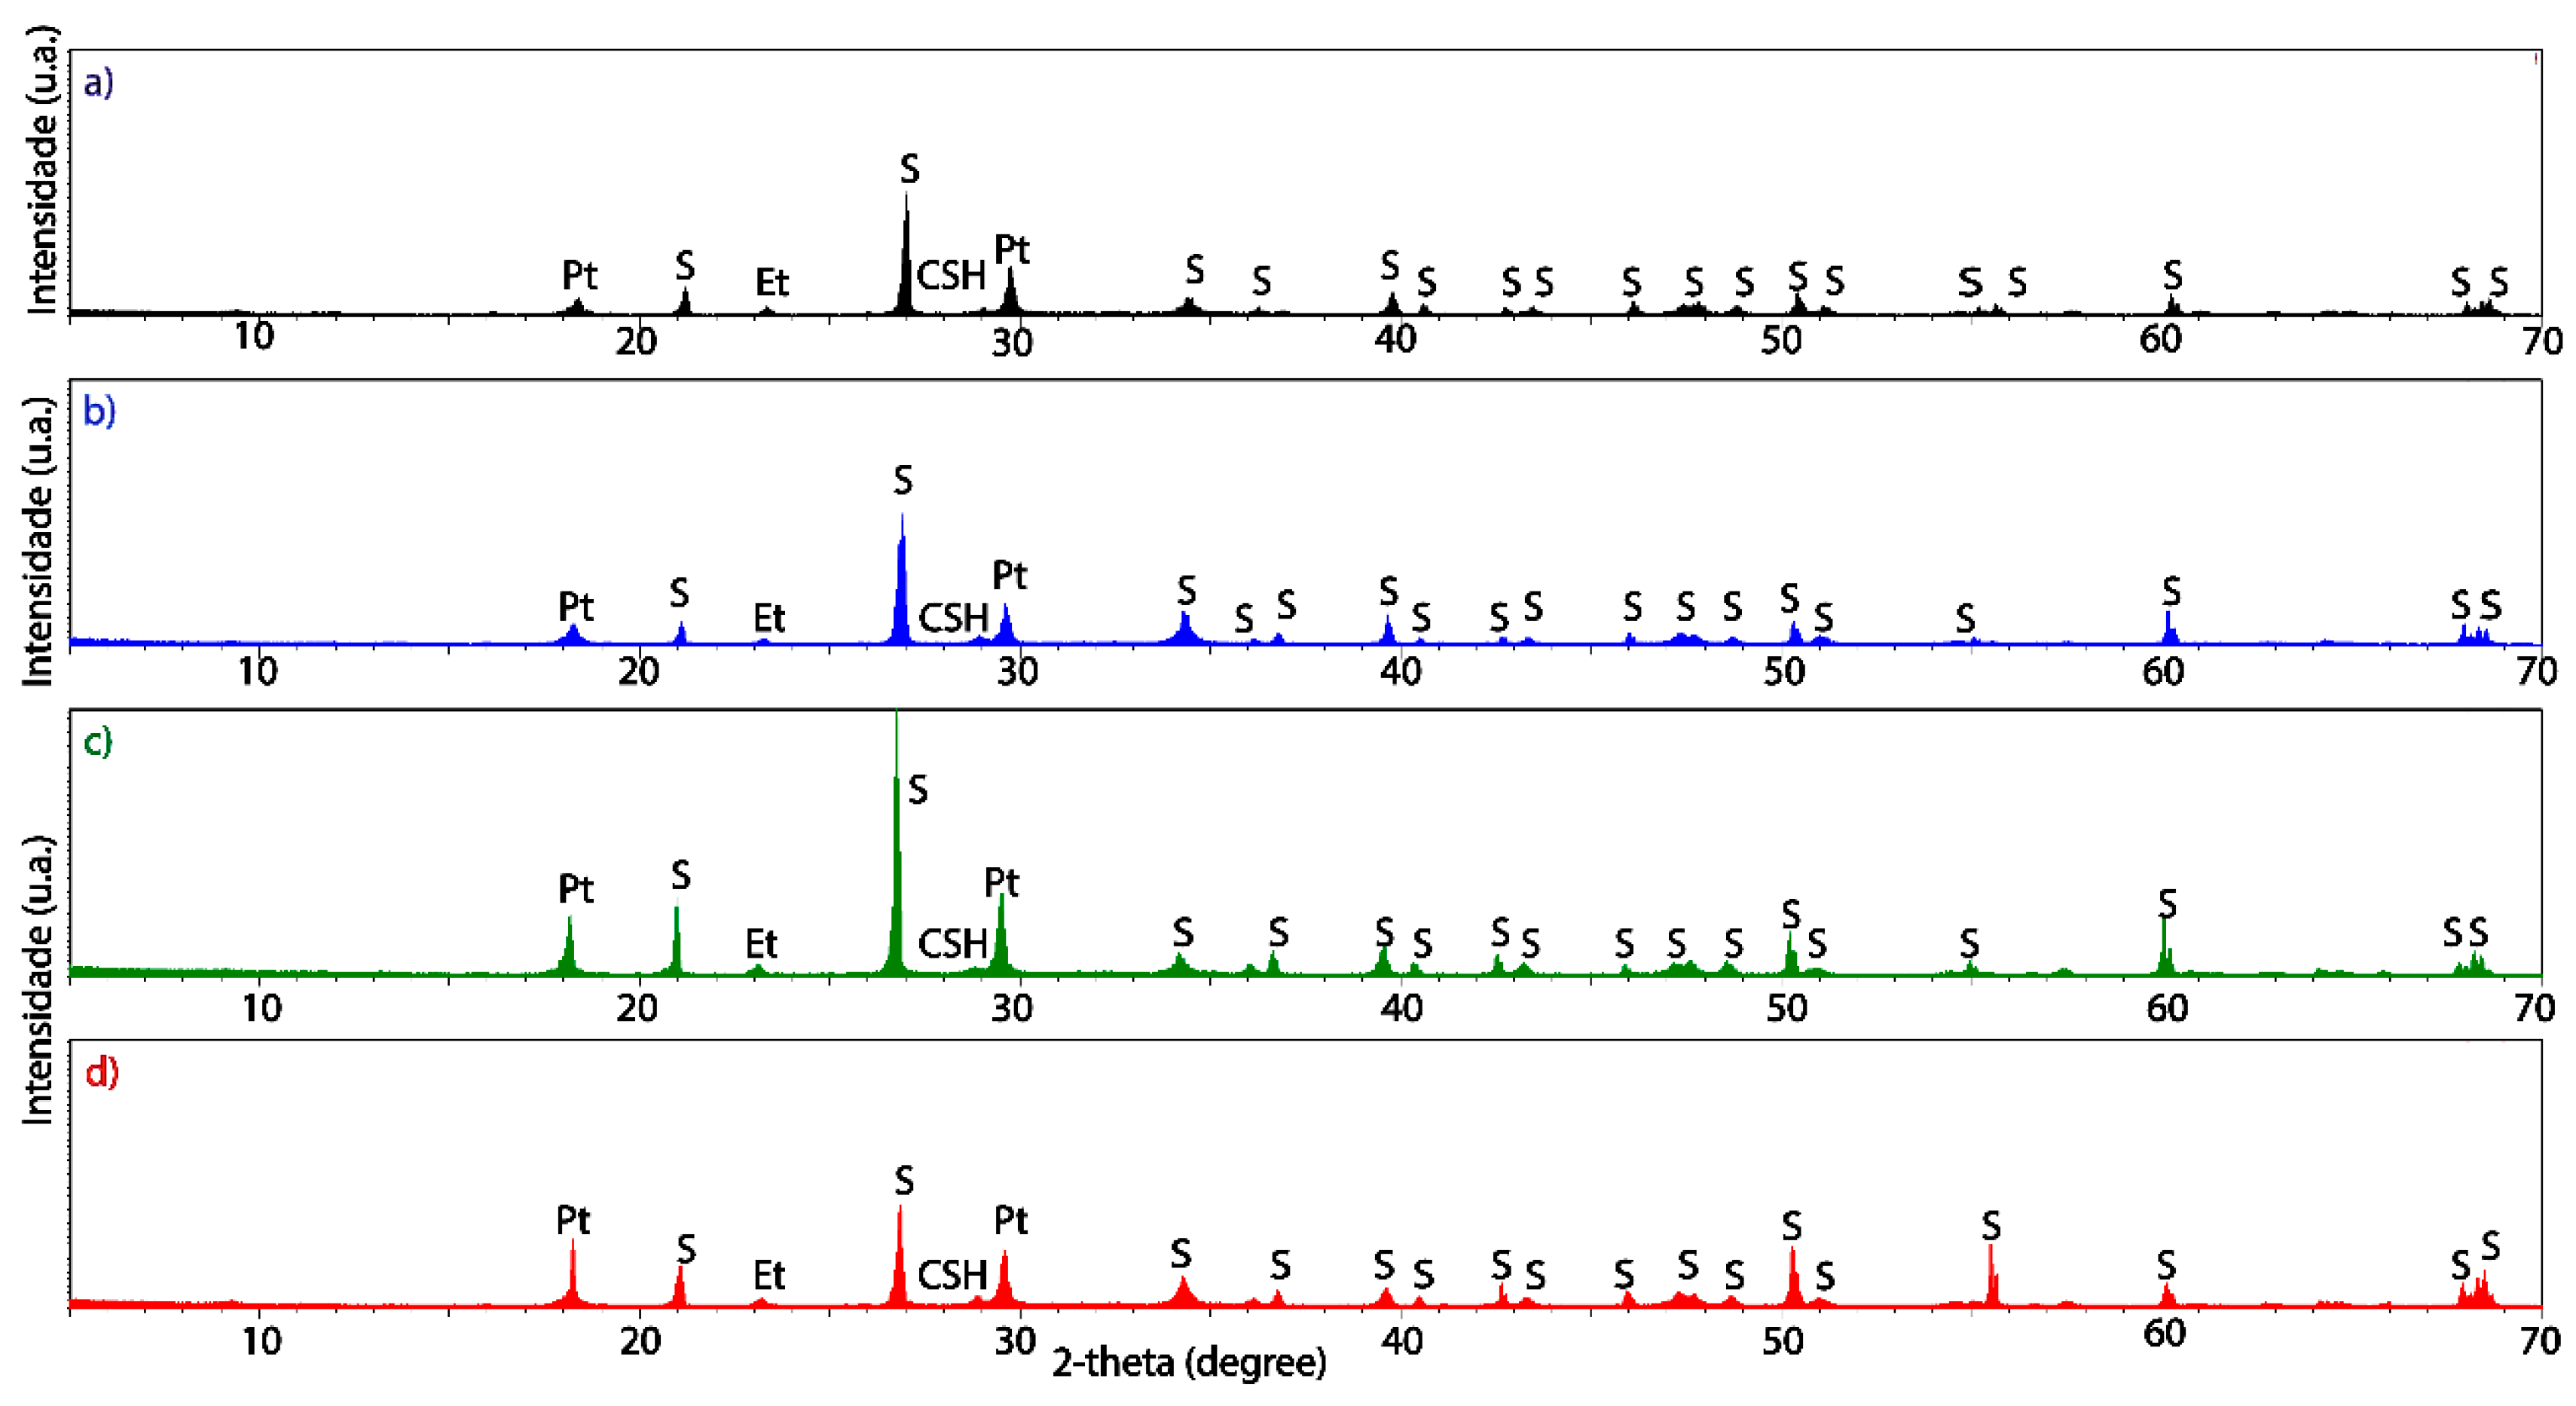
Figure 6 shows the X-ray diffractograms referring to type A mortar prepared with cement stored at different temperatures for 90 days. The diffractogram corresponding to type A mortar made with newly manufactured cement was also included for comparison purposes.
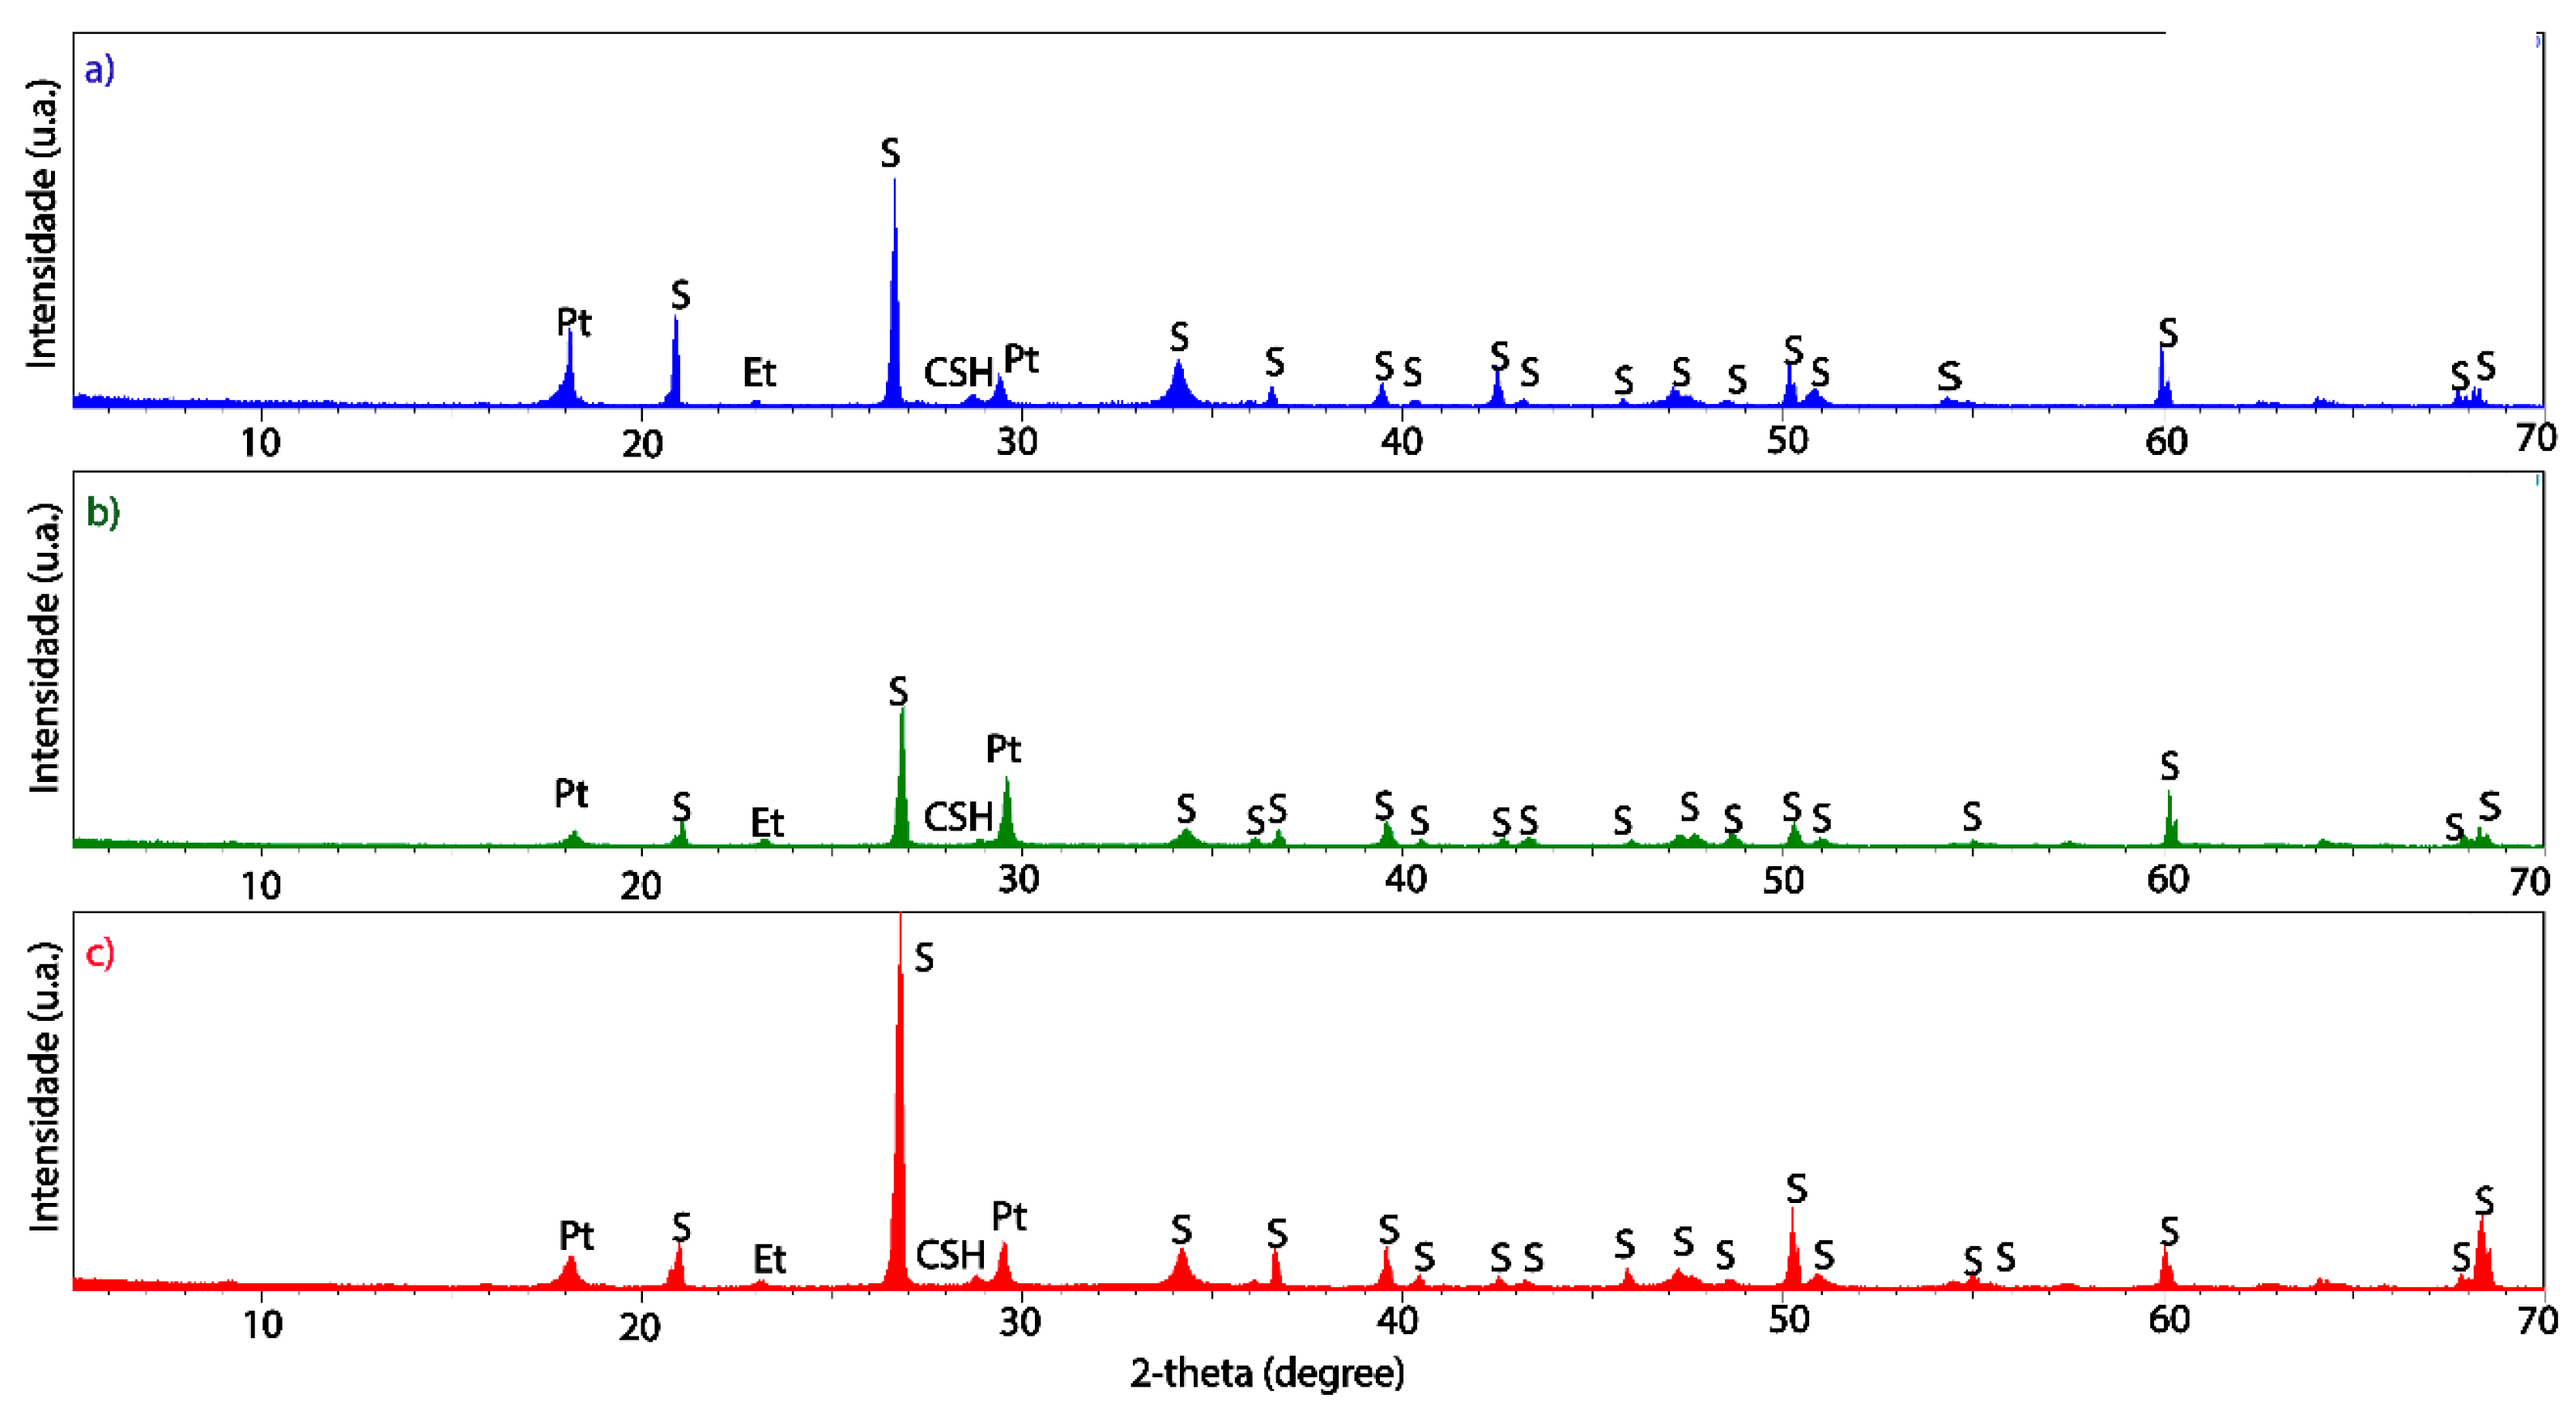
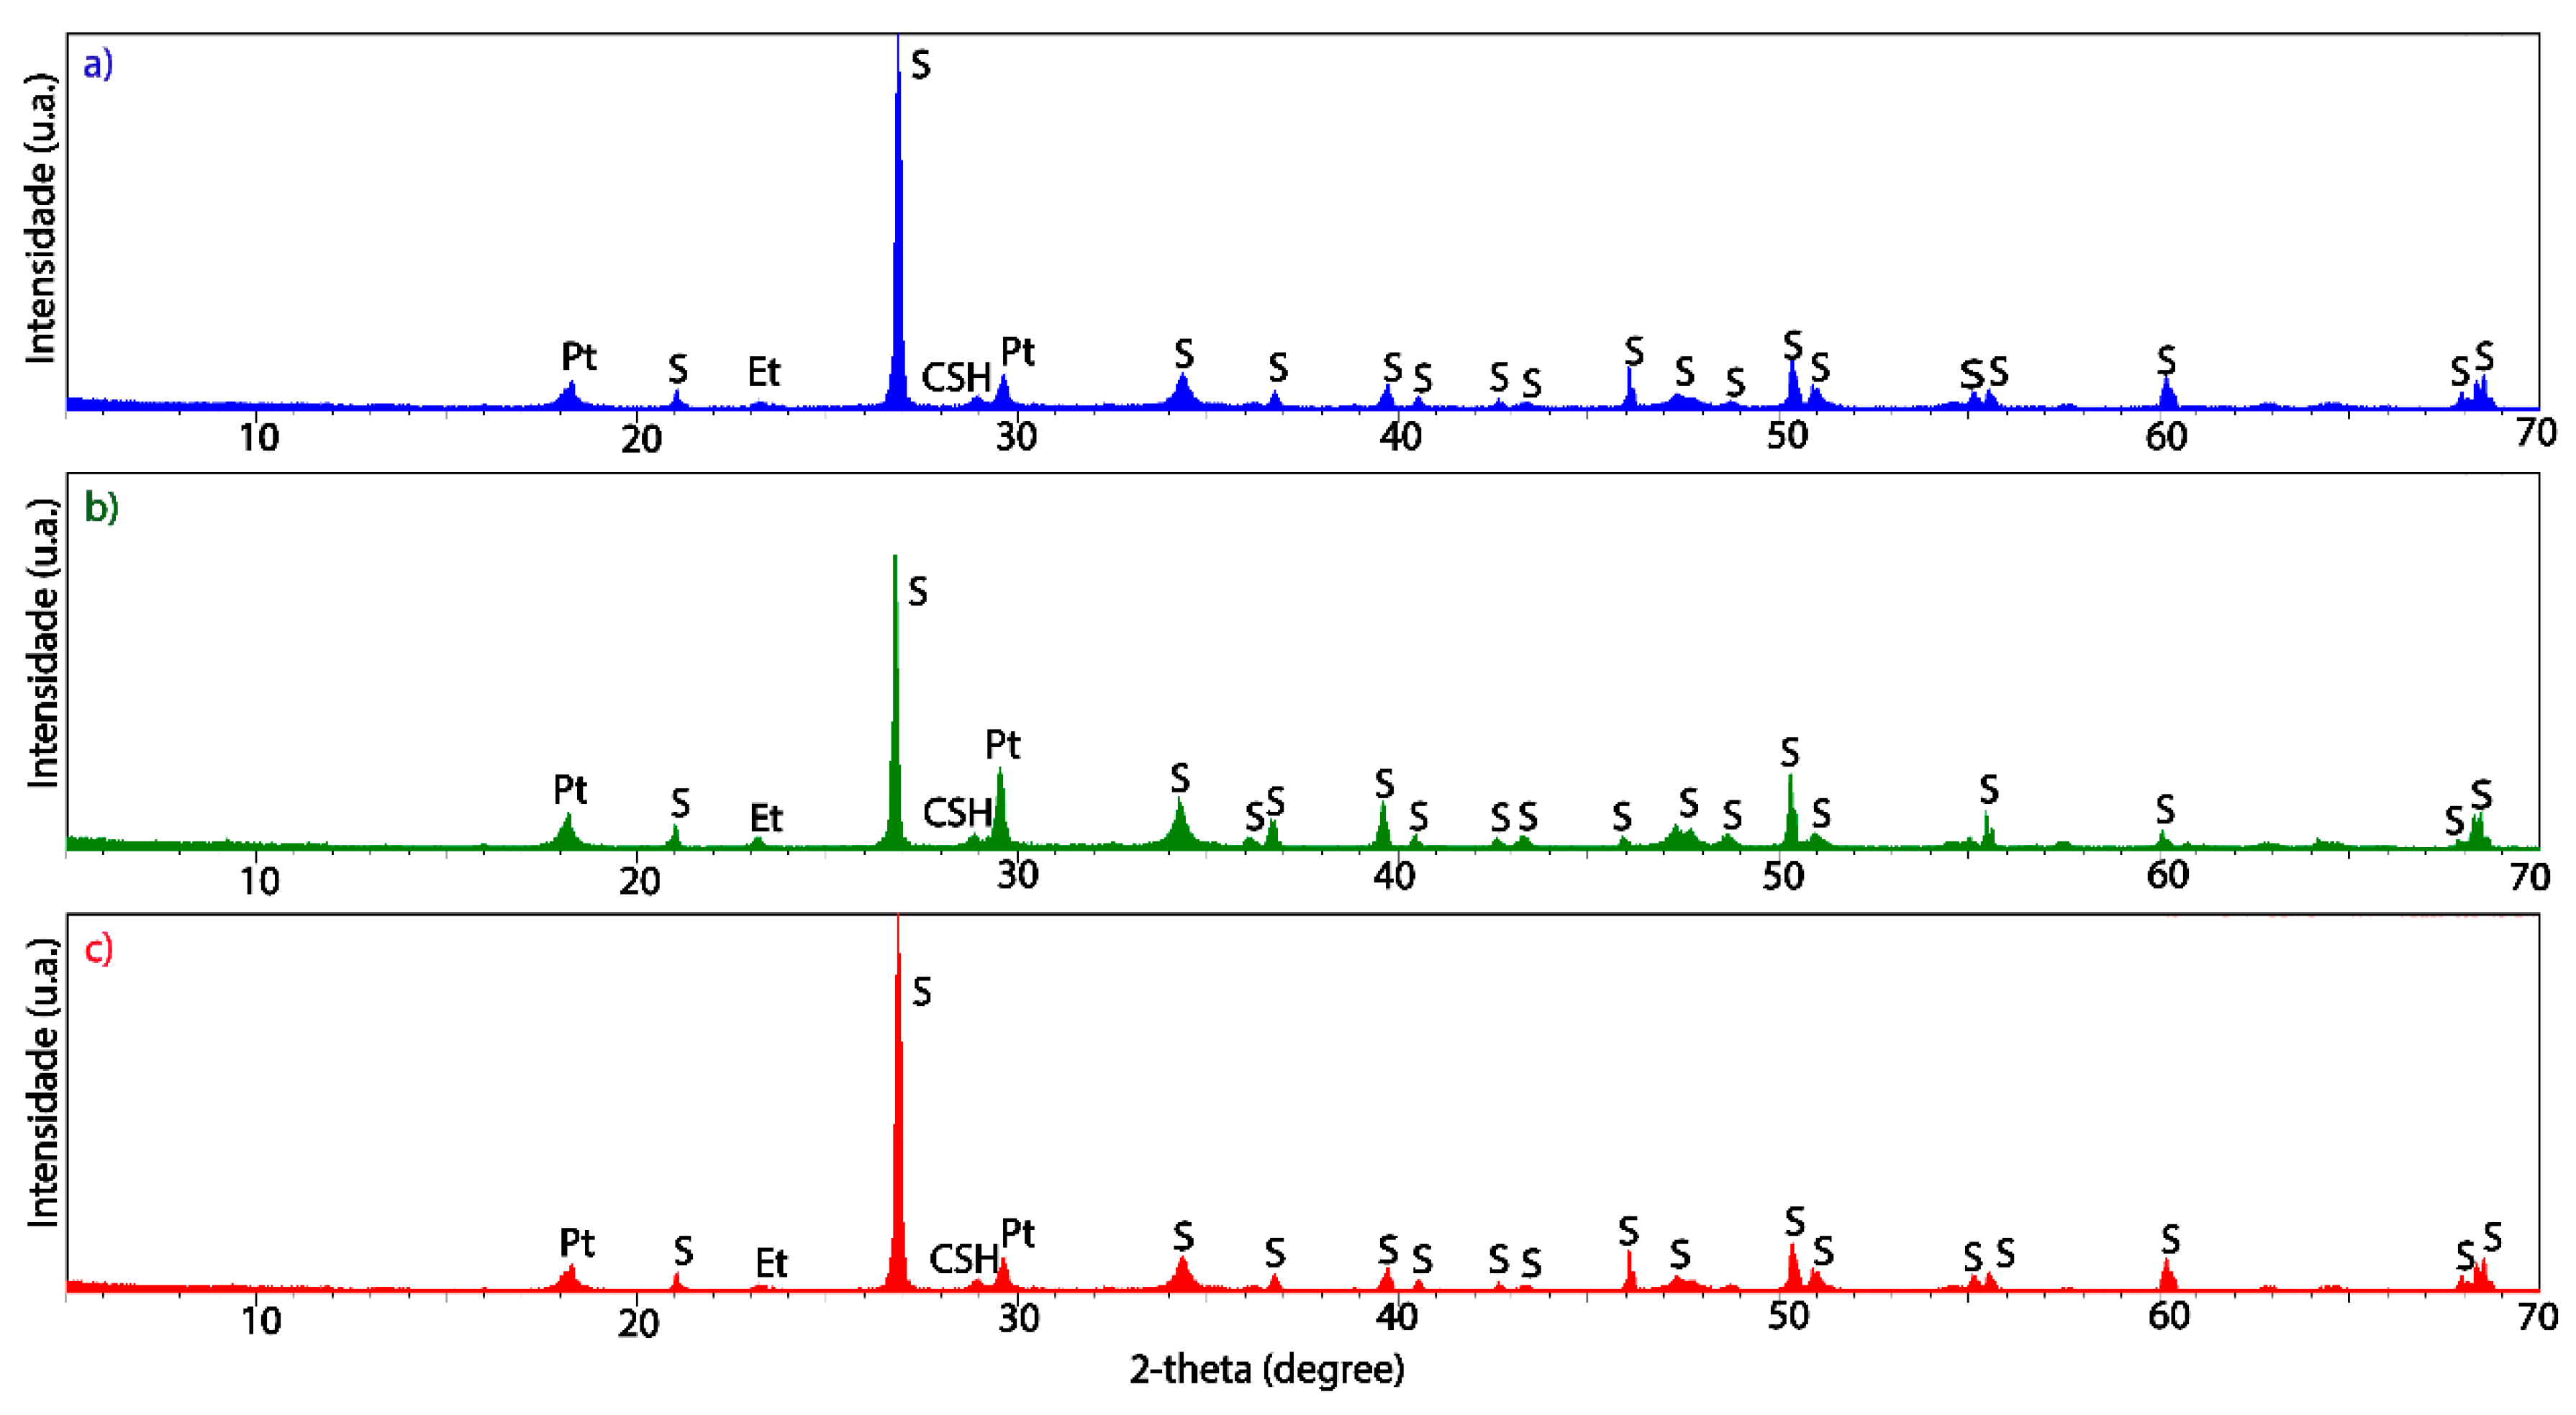
From Figure 6, the same inorganic phases identified in the reference mortar are also present in mortars prepared with Portland cement stored at different temperatures for 90 days of storage. The ettringite phase was observed in 2-theta peaks between 23.1° (reference commercial mortar) and 23.2° (type A mortar, prepared with cement stored at 10 °C for 90 days). The inorganic phase Portlandite presented peaks with 2-theta values ranging between 18.1° and 18.3°. Furthermore, several signals corresponding to the Quartz phase of silica (SiO2) were identified in all mortars, with the highest intensity peak between 26.6° and 26.8° of 2-theta. Finally, the amorphous phase of CSH presented a constant value of 2-theta in type A mortars, located at 28.7°. In the case study of type A (commercial) mortar, no significant structural differences were identified between the inorganic material prepared with new cement and those prepared with cement stored at different temperatures for 90 days. Based on this result, the analysis was expanded to include the structural characteristics of sustainable mortars of types B and C, as shown in Figure 7 and Figure 8.
From Figure 7, the same inorganic phases in the reference mortar were identified and observed in mortars prepared with Portland cement stored at different temperatures for 90 days. The ettringite phase was detected in peaks with 2-theta values between 23.1° and 23.2°. The Portlandite phase, in turn, appeared in peaks with 2-theta values between 18.1° and 18.3°. Signals corresponding to the Quartz phase of silica (S, SiO2) were recorded in all mortars analyzed, with the highest intensity peak between 26.7° and 26.8° of 2-theta. Regarding the CSH phase, 2-theta values varied between 28.7° and 29.0°.
Similar to the previous systems, the analysis of type C sustainable mortar (Figure 8) revealed the presence of the ettringite phase, with peaks between 23.2° and 23.4° of 2-theta. The inorganic phase Portlandite was identified in peaks with 2-theta values between 18.1° and 18.3°. Several signals corresponding to the Quartz silica phase (SiO2) were also recorded in all type C sustainable mortars, with the highest intensity peak between 26.9° and 27.0° of 2-theta. Regarding the CSH phase, 2-theta values varied between 28.8° and 29.1°. Compared to commercial mortar (type A), sustainable mortars (types B and C) demonstrated changes in the CSH phase signal, especially when the cement was stored for 90 days, particularly at a temperature of 30 °C. These changes may be due to the incorporation of construction and demolition waste into the cement matrix [30].

3.3. Morphology Characteristics

At this stage, Scanning Electron Microscopy (SEM) tests were initially carried out to analyze the microstructure of the type A reference mortar made with newly produced cement. Figure 9 presents the results obtained, providing a detailed view of the morphological characteristics of this specific composition. This initial analysis constitutes a fundamental step to understanding the behavior of the material in comparison with the mortars modified in subsequent stages of the study.
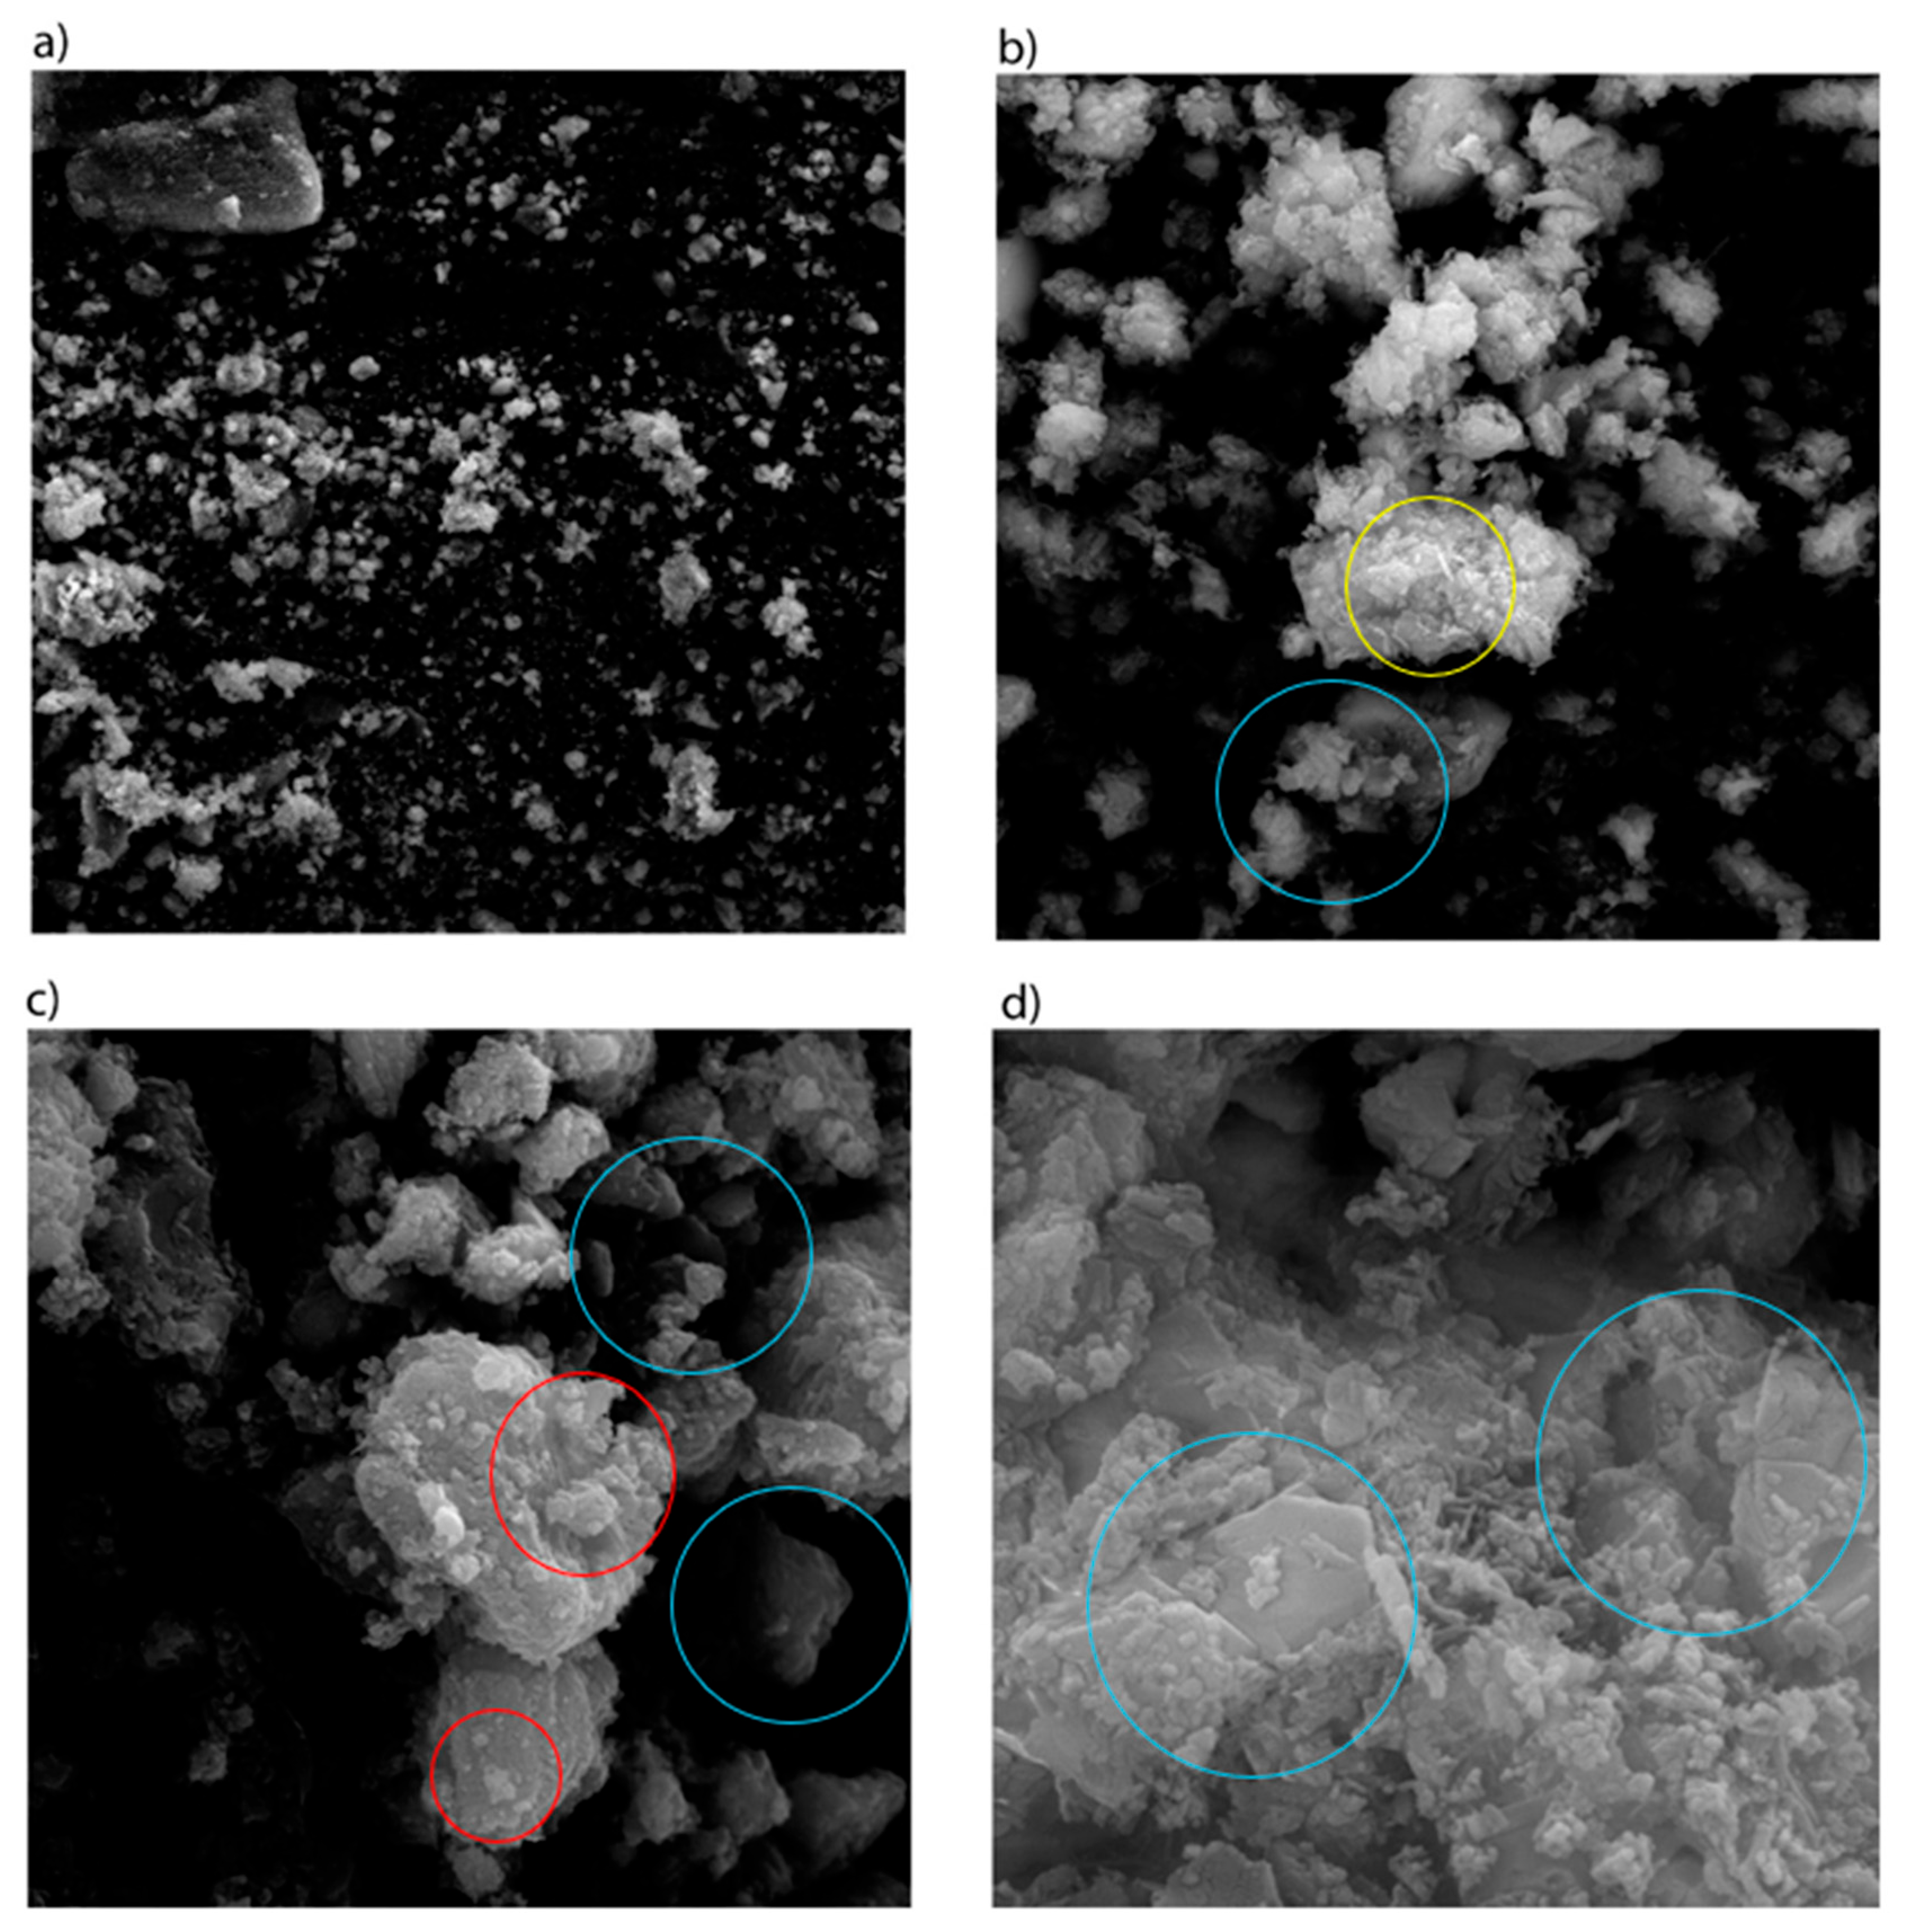
From the images shown in Figure 10, it is possible to verify the presence of the amorphous CSH phase (red circle) on the surface of the reference mortar type A (especially at 50 kx magnification). With magnifications of 10 kx and 20 kx, rods corresponding to ettringite (yellow circle) can be seen, and portlandite was identified as hexagonal crystals (blue circle).
Figure 10, Figure 11 and Figure 12 show the morphologies of the surfaces of type A mortars prepared with cement stored for 45 days at different temperatures, corresponding to half of the material’s shelf life. This period was selected based on the technical premise that, in this interval, the cement maintains its properties under suitable conditions, allowing a reliable analysis of its microstructural characteristics.
As illustrated in Figure 10, the image obtained with a magnification of 50 kx shows the presence of portlandite crystals, identified by their characteristic hexagonal shape. The pictures with magnifications of 2 kx and 10 kx corroborate this identification and present similar characteristics. At a magnification of 20 kx, the image reveals the presence of the amorphous phase C-S-H (hydrated calcium silicate) predominantly, confirming the microstructural diversity of the sample.
As shown in Figure 11, microstructural phases of type A mortar stored at 30 °C were identified. In the image obtained at 50 kx magnification, ettringite, and portlandite crystals are observed, an identification that is corroborated by image analysis with a magnification of 10 kx. In the image with a magnification of 20 kx, the amorphous phase C-S-H can be detected together with ettringite crystals. Figure 11 and Figure 12 show the hexagonal crystals characteristic of portlandite (Ca(OH)2). Hexagonal portlandite is easily identified in images obtained at 50 kx magnification. This result aligns with the data obtained by XRD, SEM analyses coupled with EDS, corroborating this identification. In addition, the presence of the amorphous phase C-S-H (hydrated calcium silicate) and ettringite crystals can be observed, complementing the analysis of the microstructural phases.
Figure 13, Figure 14 and Figure 15 show the surface morphologies for type B mortars prepared with cement stored for 45 days at different temperatures. They show the presence of portlandite (Ca(OH)2) in its characteristic hexagonal shape. These results align with the analysis performed by SEM/EDS, as previously discussed.
As shown in Figure 13, the image obtained at a magnification of 50 kx reveals the presence of portlandite crystals, characterized by their distinctive hexagonal morphology. The images captured at a magnification of 10 kx reveal rods corresponding to ettringite (yellow circle). At a magnification of 20 kx, the micrograph predominantly exhibits the amorphous phase of C-S-H (calcium silicate hydrate), further highlighting the microstructural diversity of the sample.
Figure 14 illustrates the identification of various microstructural phases in type B mortar stored at 30 °C. The micrograph at 50 kx magnification reveals the presence of ettringite (yellow circle) and portlandite crystals (blue circle), a finding further corroborated by the image analysis conducted at 10 kx magnification. The image captured at 20 kx magnification shows the amorphous C-S-H phase (red circle) alongside portlandite crystals.
Figure 13, Figure 14 and Figure 15 depict the hexagonal crystals characteristic of portlandite (blue circles), readily identifiable in micrographs obtained at 50 kx magnification. This is consistent with the DRX analyses and EDS results, further validating this identification. Moreover, the images also reveal the presence of the amorphous C-S-H phase (red circle) and ettringite crystals (yellow circles), providing additional insights into the microstructural phases. Figure 16, Figure 17 and Figure 18 show the surface morphologies of type C mortars prepared with cement stored for 45 days at different temperatures. In these images, portlandite crystals, characterized by their hexagonal shapes, ettringite crystals, and the amorphous phase C-S-H (hydrated calcium silicate) can be identified. These observations agree with the results obtained through EDS, which will be discussed later. Consistent with the data provided by the XRD analysis, the main phases of cementitious materials, including portlandite, ettringite, and the amorphous C-S-H phase, were also identified in the SEM analyses.
As shown in Figure 16, the micrograph obtained at 50 kx magnification shows the presence of portlandite crystals (blue circle), identified by their characteristic hexagonal morphology. In the images obtained at 10 kx magnification, portlandite and the amorphous C-S-H phase (red circle) can be observed. At 20 kx magnification, the micrograph confirms the previous findings.
Figure 17 illustrates microstructural phases present in type C mortar stored at 30 °C. The micrograph obtained at 50 kx magnification shows the presence of portlandite crystals, an observation corroborated by analyses on images at 10 kx magnification. In the micrograph captured at 20 kx magnification, predominantly ettringite crystals and the amorphous C-S-H phase (hydrated calcium silicate) can be seen, accompanied by portlandite crystals, highlighting the microstructural diversity of the sample.
Figure 16, Figure 17 and Figure 18 show the characteristic hexagonal crystals of portlandite (highlighted by blue circles), easily identifiable in the micrographs obtained at 50 kx magnification. This observation entirely agrees with the results of X-ray diffraction (XRD) and EDS analyses, reinforcing the validation of this identification. The thoroughness of our research is evident in the images that show the presence of the amorphous phase C-S-H (indicated by red circles), providing additional information about the sample’s microstructural phases.

3.4. Chemical Aspects

To evaluate the impact of different storage temperatures (10 °C, 30 °C, and 50 °C) of cement in a moist environment on the chemical and microstructural characteristics of inorganic cementitious composites, such as mortars of types A, B, and C), experiments and a theoretical approach were carried out at strategic points on the surfaces of each type of mortar. Figure 19, Figure 20, Figure 21, Figure 22, Figure 23, Figure 24, Figure 25, Figure 26 and Figure 27 present the results of the SEM/EDS technique. Now, it is considered, as a theoretical model, the characteristics of the complex chemistry of the investigated mortars. To evaluate the effect of cement storage temperature, we will analyze the case study of type A mortar, which was prepared with cement stored at different temperatures (10 °C, 30 °C, and 50 °C) for 45 days.
From Figure 19, it is possible to identify that there is a significant proportion of oxygen (49.7%), followed by silicon (1.4%) and calcium (34.66%). The low value associated with Si reveals that the chosen point is a region of Portlandite (Ca(OH)2), a phase previously identified by XRD. Considering the proportions between the elements O and Ca obtained from SEM/EDS, and in terms of Ca, we arrive at a proportion of 1.4 O/1.0 Ca. Although chemically, it is a ratio of 1 O/1 Ca, and the difference is attributed to the limitations of the technique.
From Figure 20, it is verified that there is a significant proportion of oxygen (42.17%), followed by silicon (2.86%), and calcium (45.06%). Again, the low value associated with Si reveals that the chosen point is a region of Portlandite (Ca(OH)2), a phase previously identified by XRD. Considering the proportions between the elements O and Ca obtained from SEM/EDS, and in terms of Ca, we arrive at a proportion of 0.9 O/1.0 Ca. This proportion was more accurate than what is chemically expected for a region corresponding to Portlandite (1 O/1 Ca) [48,49,50].
By considering Figure 21, it is possible to verify that there is a significant proportion of oxygen (34.38%), followed by silicon (3.85%) and calcium (43.72%). Again, the low value associated with Si reveals that the chosen point is a region of Portlandite (Ca(OH)2), a phase previously identified by XRD [44]. Considering the proportions between the elements O and Ca obtained from SEM/EDS and in terms of Ca, we arrive at a proportion of 0.8 O/1.0 Ca. This proportion was more accurate than chemically expected for a region corresponding to Portlandite (1 O/1 Ca).
To evaluate the effect of cement storage temperature, we analyzed Type B mortar, which was prepared with cement stored at different temperatures (10 °C, 30 °C, and 50 °C) for 45 days. The SEM/EDS results are presented in Figure 22, Figure 23 and Figure 24.
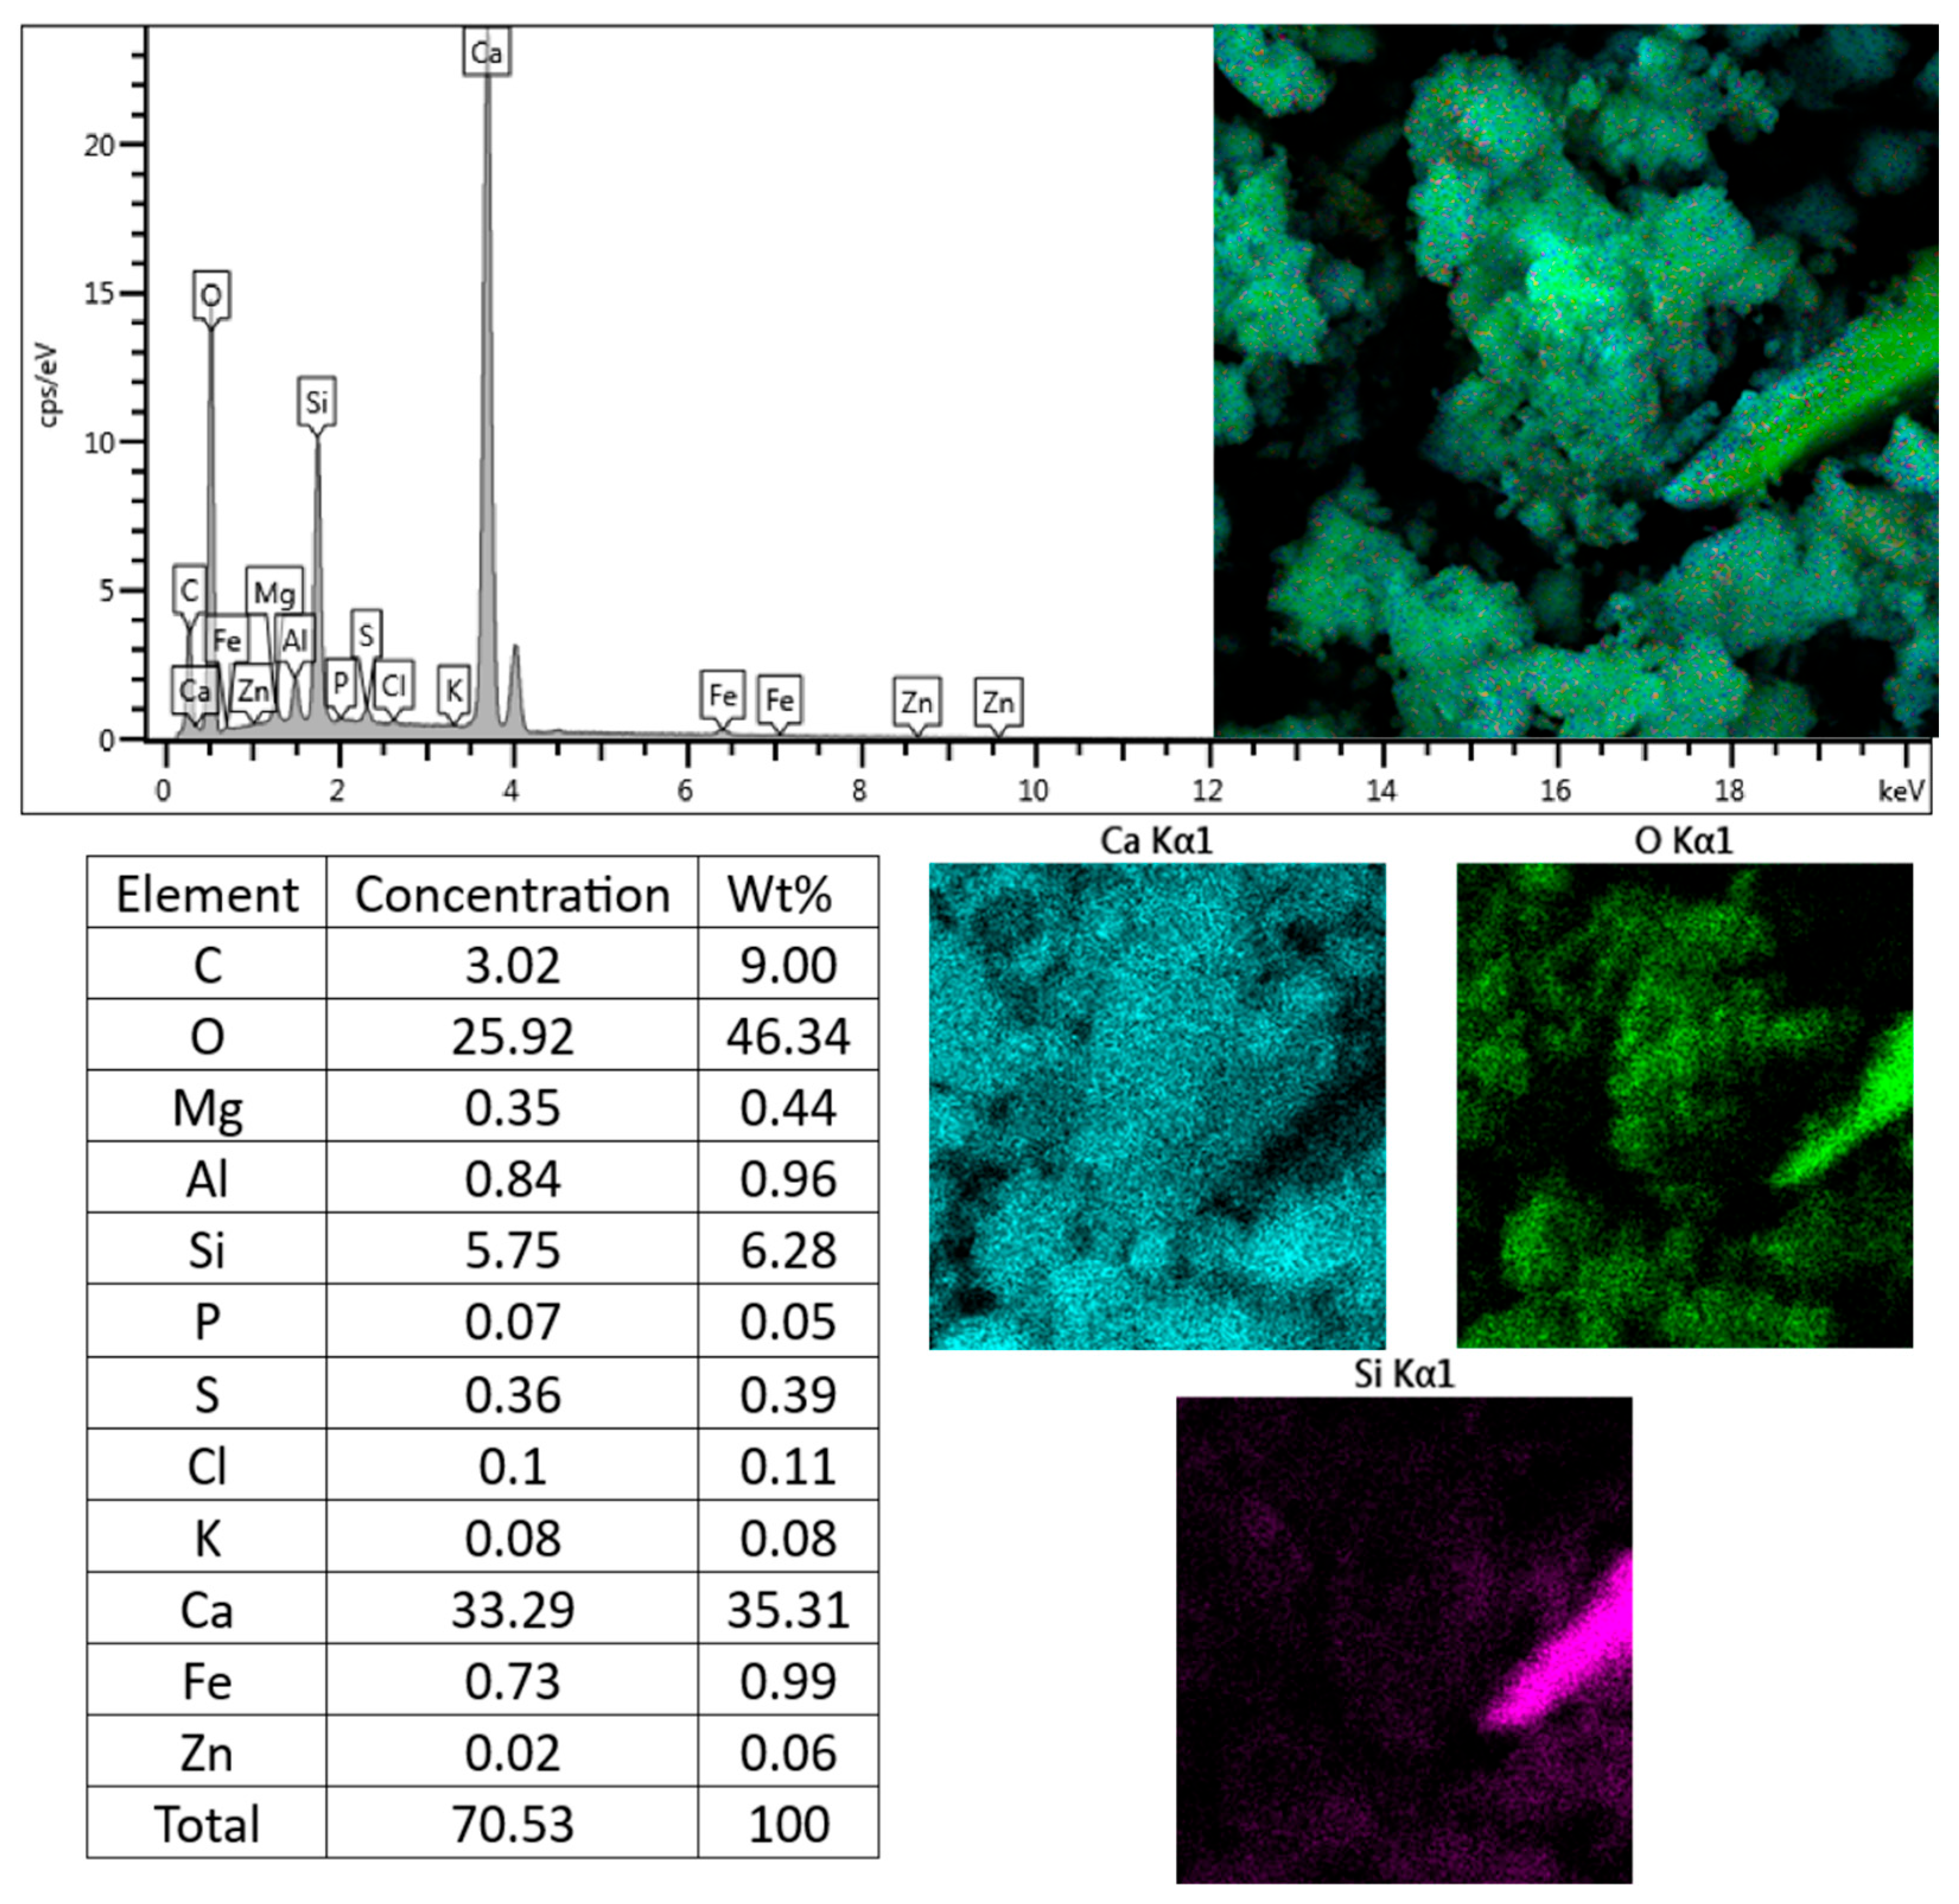
From Figure 22, it is observed that there is a significant proportion of oxygen (46.34%), followed by silicon (6.28%) and calcium (35.31%). The low value associated with Si reveals that the chosen point is a region of Portlandite (Ca(OH)2), a phase previously identified by XRD. Considering the proportions between the elements O and Ca obtained from SEM/EDS and in terms of Ca, we arrive at a proportion of 1.3 O/1.0 Ca. The difference in the expected value of the proportion of oxygen in calcium may be due to the presence of other oxide compounds in smaller quantities, such as SiO2 [51,52].
From Figure 23, it is possible to verify that there is a significant proportion of oxygen (54.18%), followed by silicon (15.63%) and calcium (15.38%). Considering the proportions between the elements O, Si, and Ca in terms of Ca, we arrive at a proportion of 3.5 O/1.0 Si/1.0 Ca. This result reveals that the analysis region corresponds to CSH (CaSiO3H2), where the expected proportion between O, Si, and Ca is 3 O/1 Si/1 Ca. The remaining amount of oxygen may be due to a different oxide compound, such as Al2O3 and Fe2O3.
Considering Figure 24, there is a significant proportion of oxygen (45.98%), followed by silicon (3.84%) and calcium (37.01%). Again, the low value associated with Si reveals that the chosen point is a region of Portlandite (Ca(OH)2), a phase previously identified by XRD. The proportions between the elements O and Ca obtained were 1.2 O/1.0 Ca. This proportion is close to what is expected for a Portlandite region (1 O/1 Ca). What remains is the presence of other oxide compounds, such as SiO2.
Finally, to evaluate the effect of cement storage temperature, the case study of type C mortar was considered, which was prepared with cement stored at different temperatures (10 °C, 30 °C, and 50 °C) for 45 days. The SEM/EDS results are presented in Figure 25, Figure 26 and Figure 27.
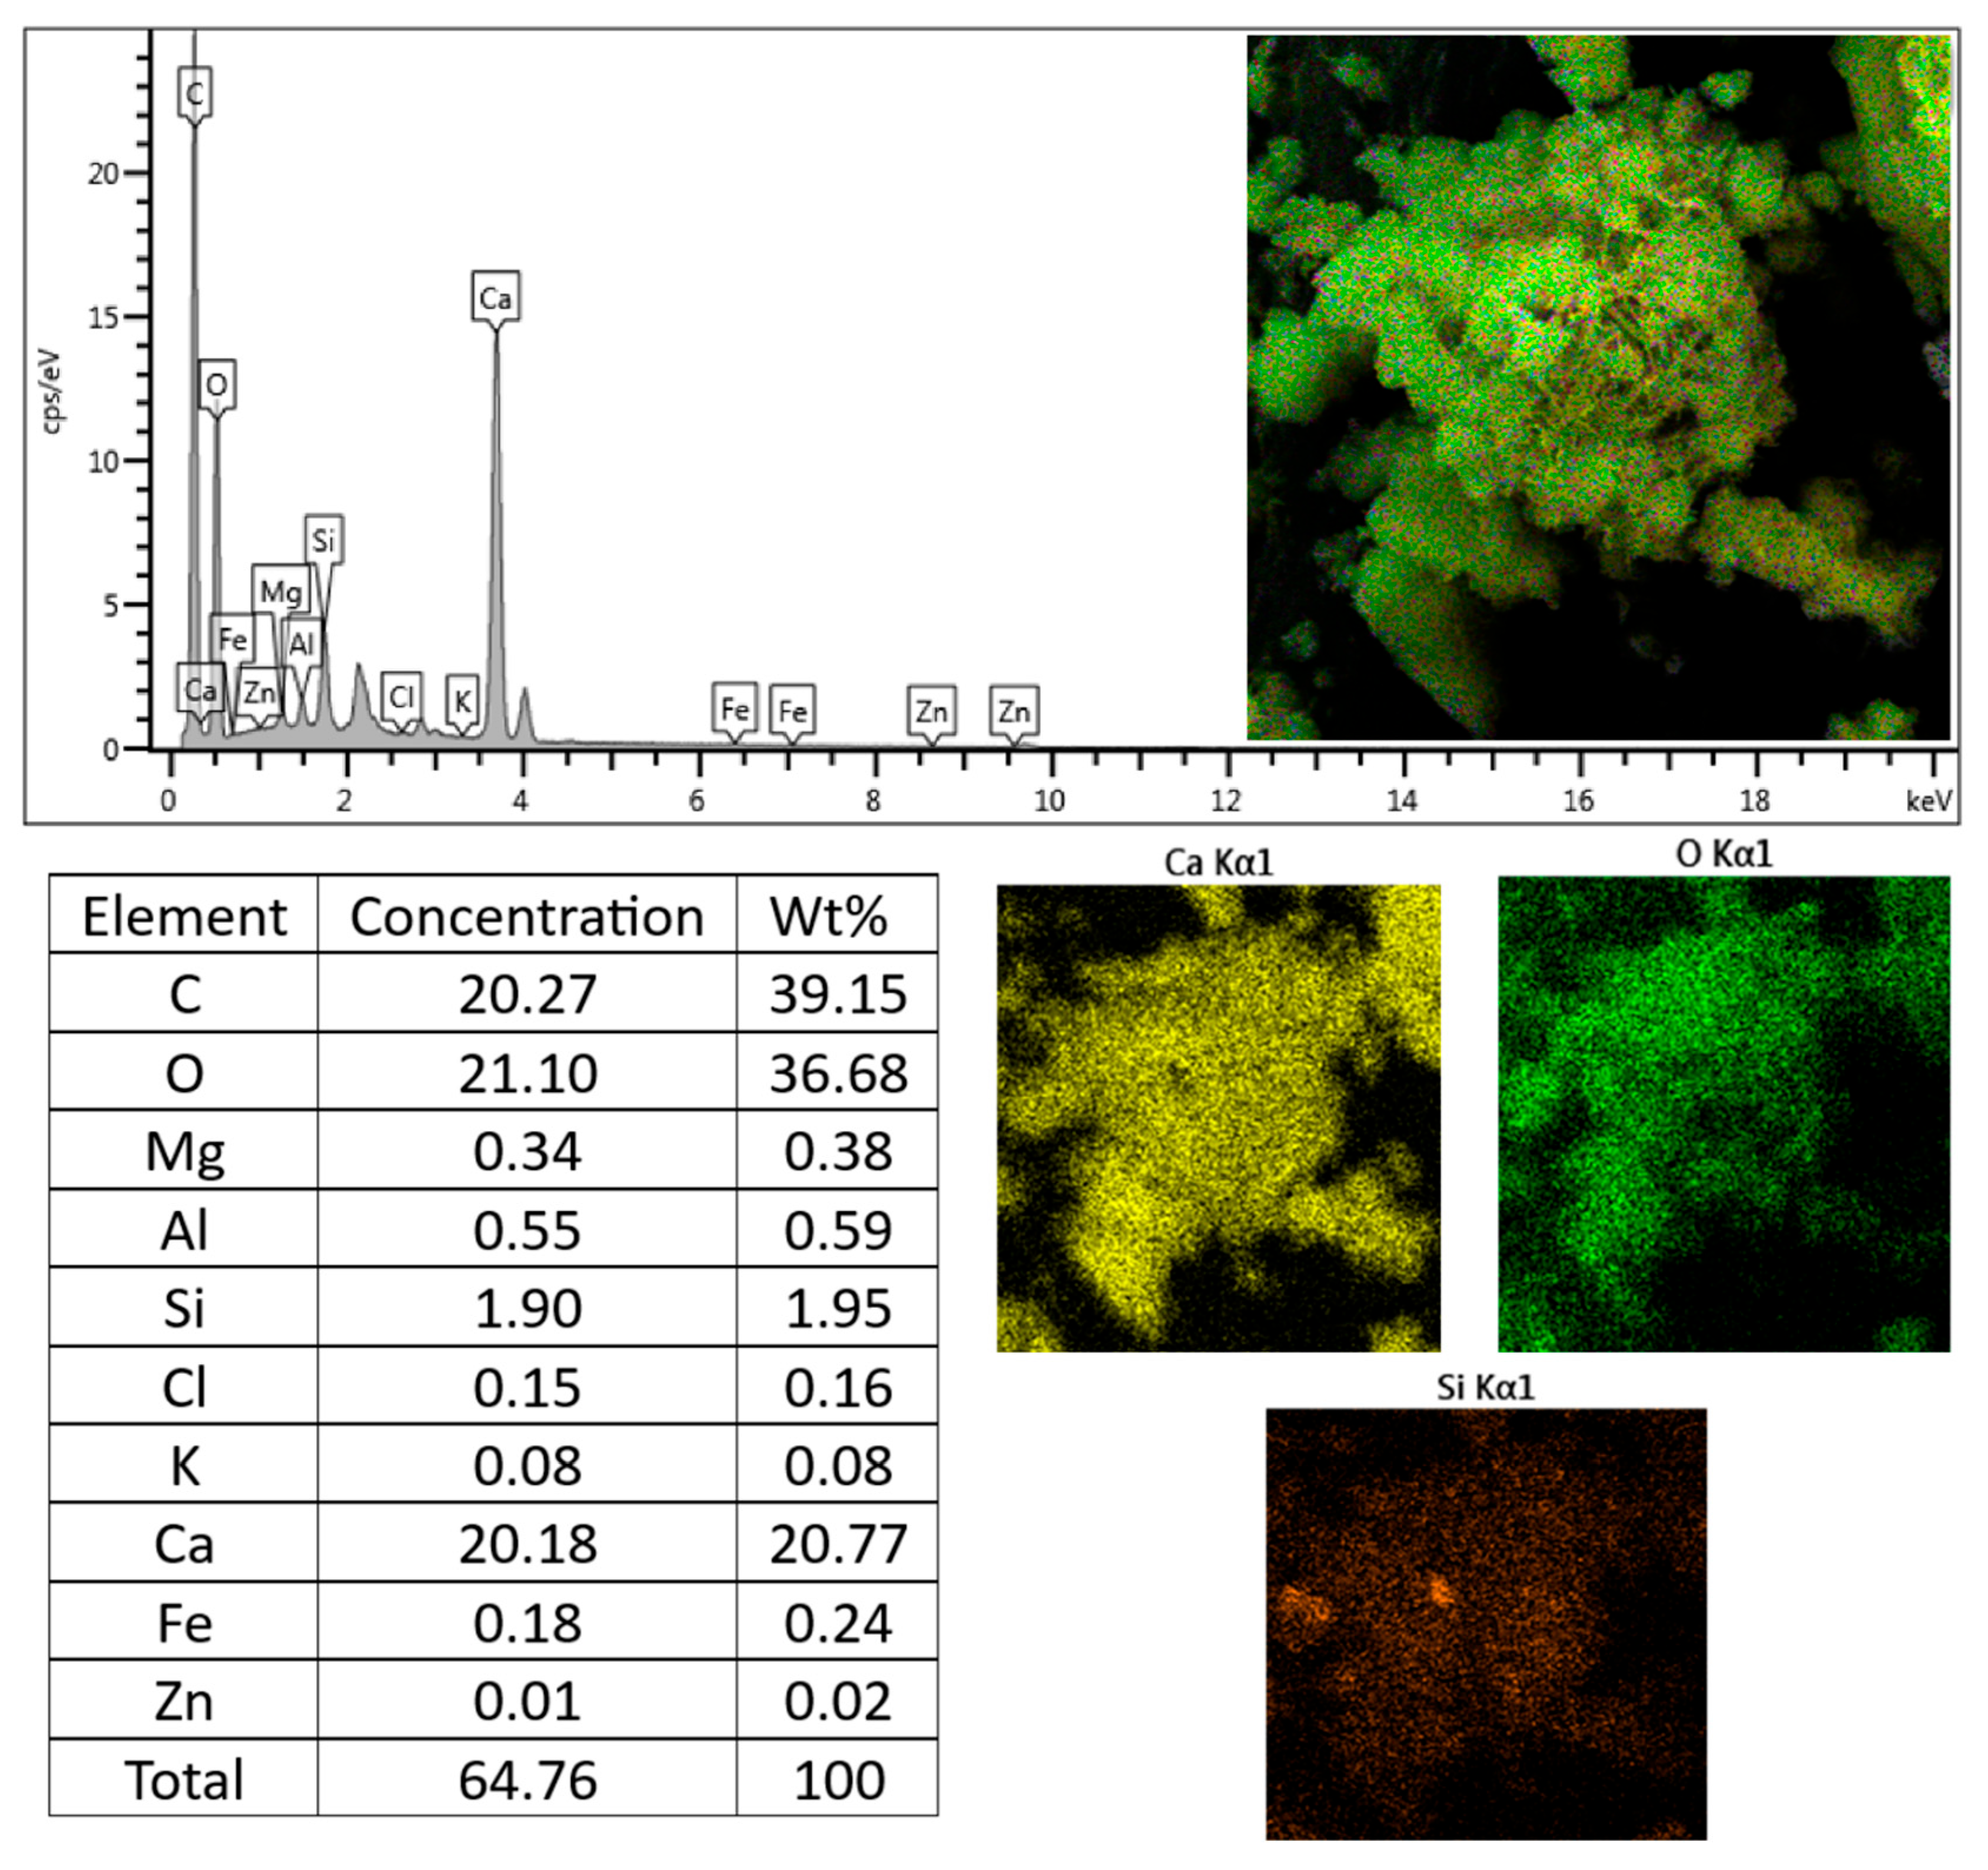
From Figure 25, there is a significant proportion of oxygen (36.68%), followed by silicon (1.95%) and calcium (20.77%). The low value associated with Si reveals that the chosen point is a region of Portlandite (Ca(OH)2), a phase previously identified by XRD. Considering the proportions between the elements O and Ca obtained from SEM/EDS and in terms of Ca, we arrive at a proportion of 1.8 O/1.0 Ca. The difference in the expected value of the proportion of oxygen in calcium may be due to the presence of other oxide compounds in smaller quantities, such as SiO2 [52,53].
From Figure 26, there is a significant proportion of oxygen (56.68%), followed by silicon (10.04%) and calcium (24.02%). Considering the proportions between the elements O, Si, and Ca in terms of Ca, we arrive at a proportion of 2.3 O/0.4 Si/1.0 Ca. This result reveals that the region of analysis probably corresponds to a mixture of CSH (CaSiO3H2), in which the expected proportion between the elements O, Si, and Ca is 3 O/1 Si/1 Ca, and Portlandite (Ca(OH)2), where the expected chemical ratio is 1 O/1 Ca.
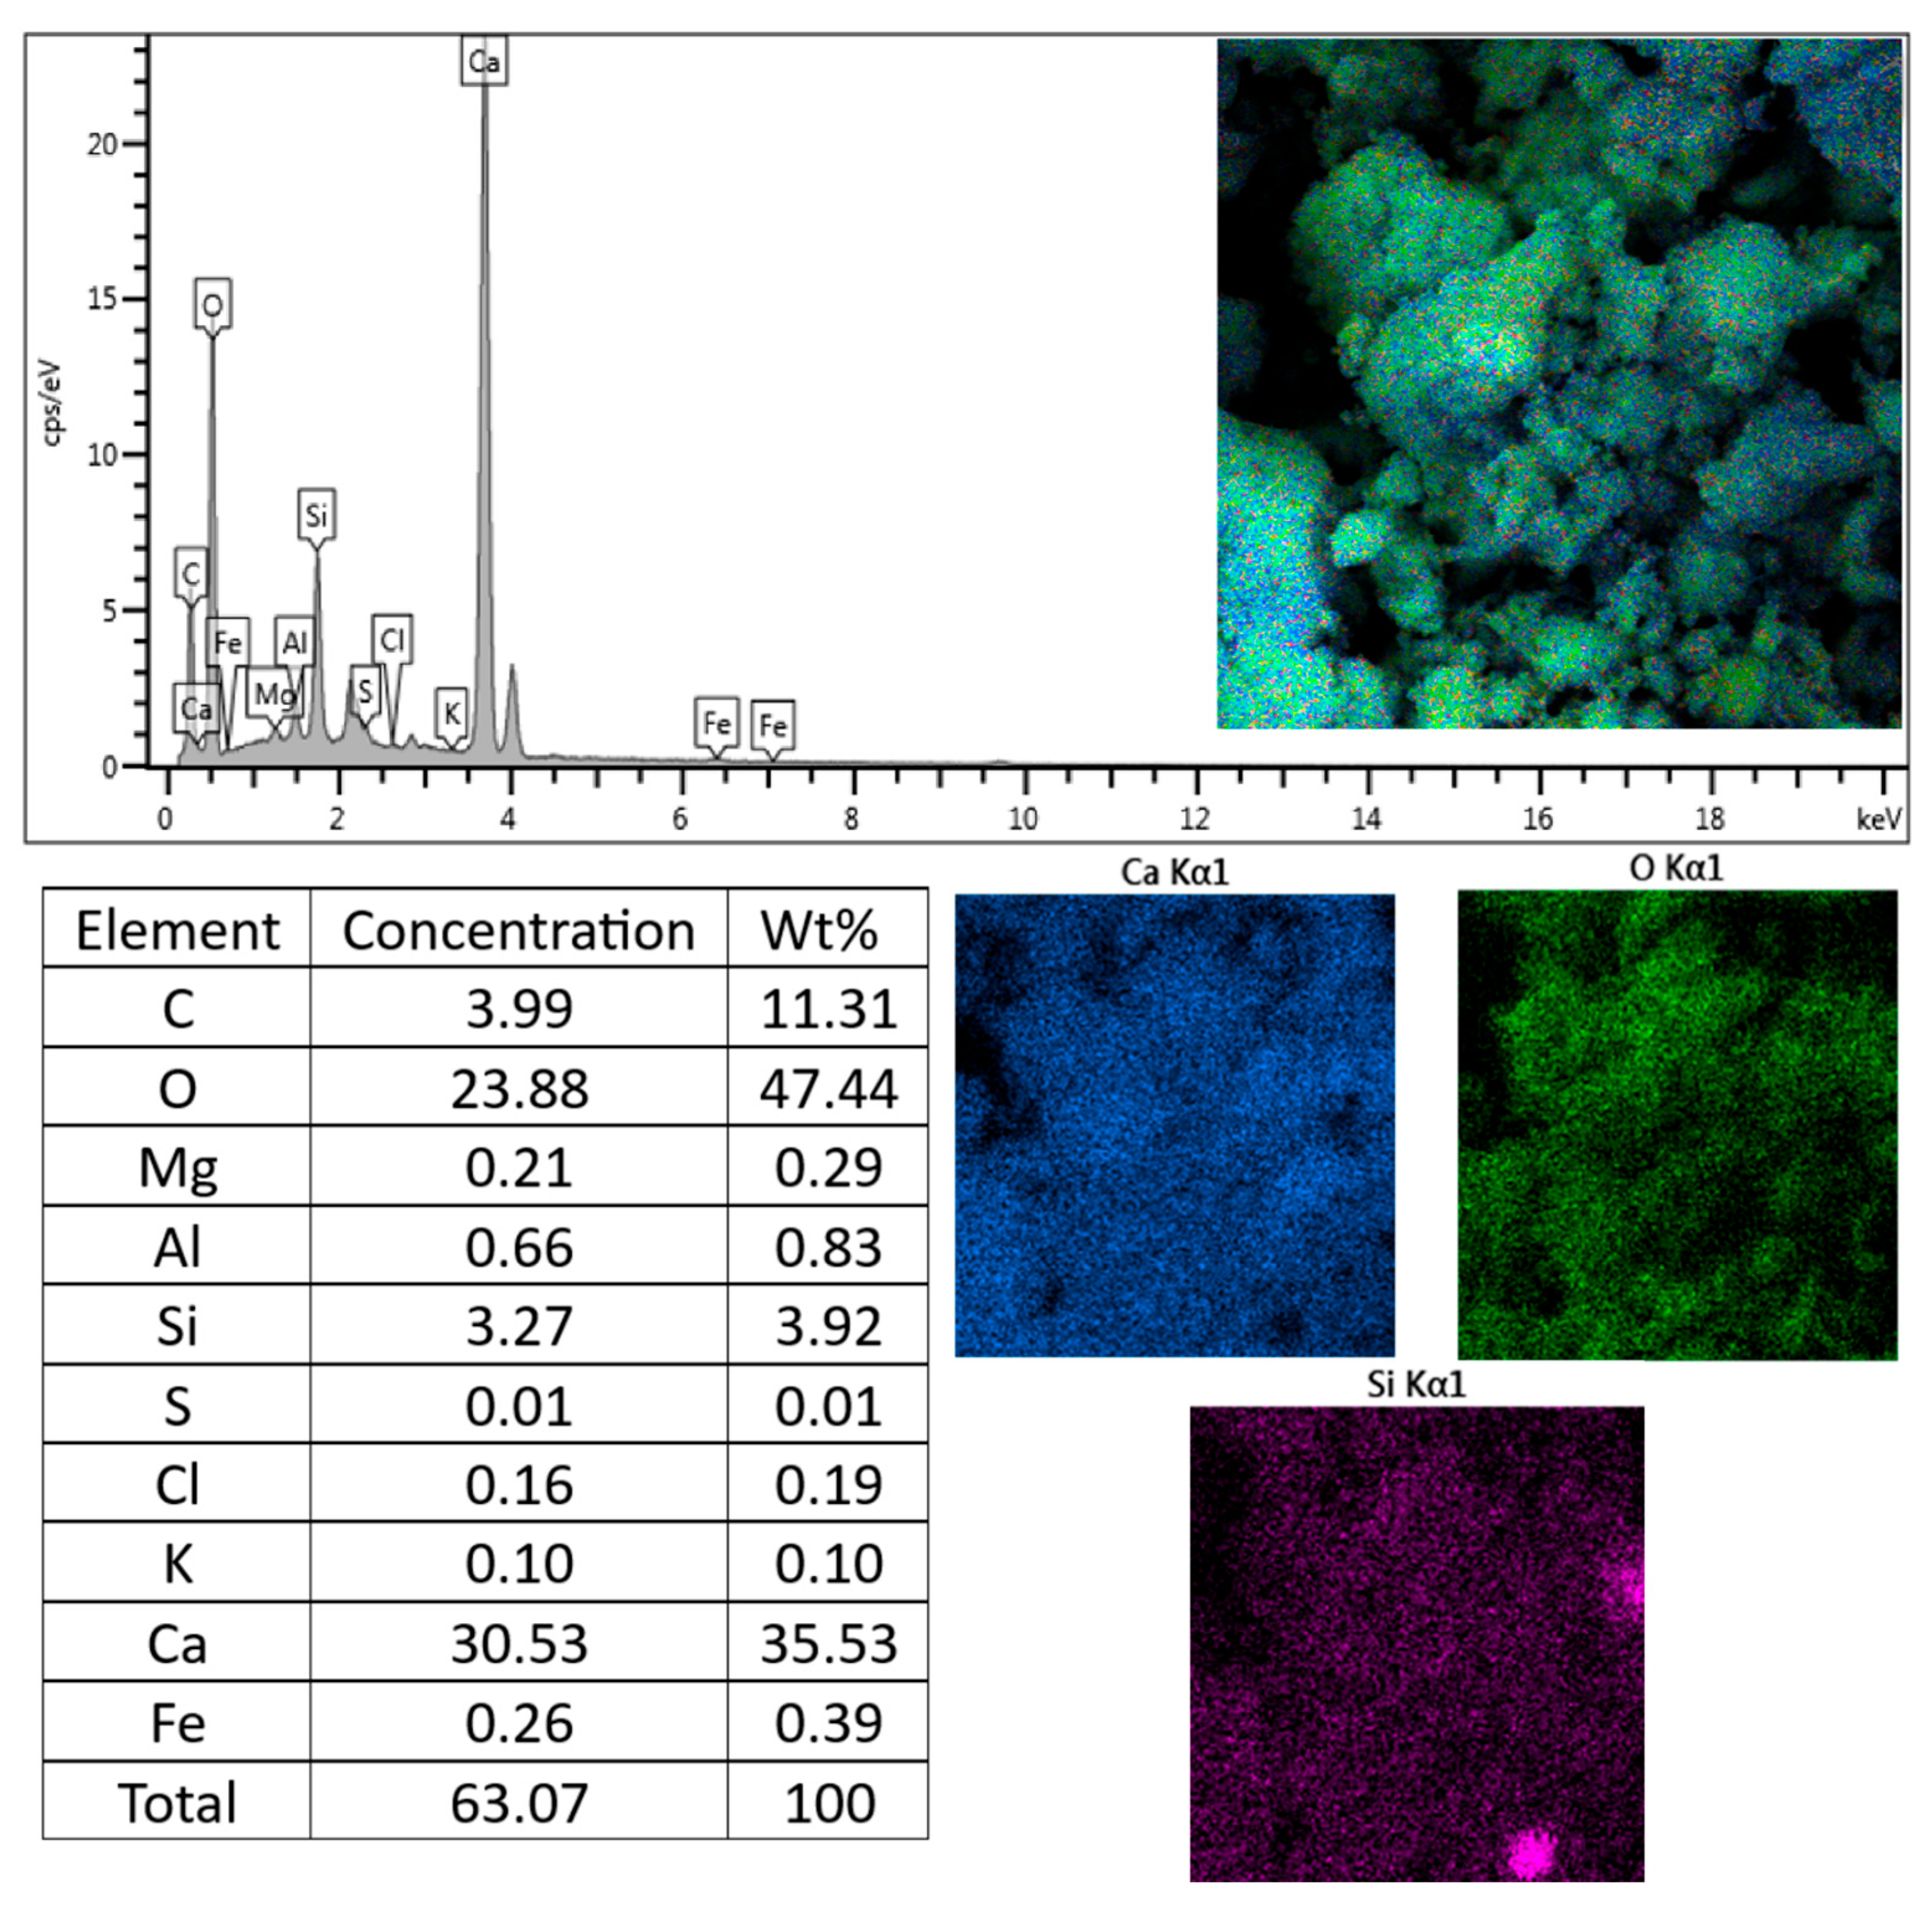
Finally, by considering Figure 27, it is possible to verify that there is a significant proportion of oxygen (47.44%), followed by silicon (3.92%) and calcium (35.53%). Again, the low value associated with Si reveals that the chosen point is a region of Portlandite (Ca(OH)2), a phase previously identified by XRD. Considering the proportions between the elements O and Ca obtained from SEM/EDS and in terms of Ca, we arrive at a proportion of 1.3 O/1.0 Ca. This proportion was more accurate than chemically expected for a region corresponding to Portlandite (1 O/1 Ca).

4. Discussion

The findings of this study highlight the importance of controlling cement storage temperature for industrial applications, particularly in regions characterized by high humidity and significant thermal variations. The strategy of using different storage temperatures not only contributes to optimizing cement durability but also plays a crucial role in the sector’s sustainability by reducing material waste and promoting a more cost-effective approach.
Additionally, the cement industry is one of the major contributors to carbon dioxide (CO2) emissions, with both cement production and inadequate storage directly impacting the material’s environmental footprint. Optimizing storage conditions can therefore serve as a complementary strategy to mitigate these environmental impacts by minimizing the need for excessive production resulting from premature cement deterioration [53].
In view of the promising results regarding the mitigation of Portland cement degradation when stored at high temperatures, the scalability of this approach in industrial environments and its applicability to large-scale construction projects should be investigated in future studies to establish guidelines for a broad implementation in the construction sector.
Future developments in this line of research may include the analysis of mechanical and microstructural aspects of cementitious composites made using type II Z-32 hydraulic Portland cement stored at a constant temperature of 50 °C or higher for a period of more than 105 days.
Another suggestion would be to verify the influence of the cement aging age on the adhesion mechanisms of mortars for coatings using type II Z-32 hydraulic Portland cement and correlate it with the mortar made with cement stored at constant temperatures of 50 °C or higher.
Finally, the influence of the age of cement aging in lightweight concretes with foaming agents, such as Ultra-light Foamed Concrete (ULFC), could be verified by correlating it with UFLC made with cement stored at constant temperatures of 50 °C or higher, thereby examining the mechanical, chemical, and microstructural aspects of the composite.

5. Conclusions

For mortars of type A, storing Portland cement at 10 °C reduced the material’s specification strength. The ambient condition is more effective than colder and more humid environments in preserving the properties of the cement, leading to superior performance compared to commercial packaging. However, the storage condition at 50 °C showed increased resistance to variation, which could have practical implications for storing type A mortar. For the sustainable mortars of type B, all cement storage conditions showed an increase in compressive strength, with a 19% increase recorded for cement stored at 50 °C being particularly significant. Similarly, for type C mortar (with partial replacement of cement by residue), the most important gains in compressive strength were observed, with an increase of 27% for the material prepared with cement stored at 50 °C. These results suggest that higher storage temperatures can be beneficial for sustainable cementitious materials, especially those produced from the partial replacement of Portland cement with solid waste, thereby highlighting the potential broader implications of the research.
The XRD data showed that the cement storage temperature does not significantly impact the formation of the leading cement phases. However, in sustainable mortars (types B and C), changes in the C-S-H phase signal were observed when considering cement storage for 90 days at 30 °C. The SEM/EDS analyses, supported by a theoretical model, indicated the presence of C-S-H and portlandite regions in the mortars studied. This is a significant validation of the importance of these phases, as C-S-H is the main phase responsible for the mechanical properties of cementitious materials, and portlandite is formed during the hydration and degradation of Portland cement.
Finally, storing cement at elevated temperatures presents a promising strategy to minimize degradation in humid conditions, offering an effective alternative to conventional environmental storage conditions. Future research suggestions include developing a protocol for optimal Portland cement storage conditions that could improve cement properties.

Supplementary Materials

The following supporting information can be downloaded at: https://www.mdpi.com/article/10.3390/jcs9110583/s1.

Author Contributions

Conceptualization, H.C.B.N. and N.B.D.L.; methodology, H.C.B.N.; validation, H.C.B.N., B.S.T. and R.C.M., formal analysis, H.C.B.N., B.S.T., R.C.M., D.G.R., J.A.F.D., S.D.J., P.R.L.S. and N.B.L.; investigation, H.C.B.N., B.S.T., R.C.M., D.G.R., J.A.F.D., S.D.J., P.R.L.S., N.B.L. and N.B.D.L.; resources, N.B.D.L.; data curation, H.C.B.N., B.S.T., R.C.M., D.G.R., J.A.F.D., S.D.J., P.R.L.S., N.B.L. and N.B.D.L. writing—original draft preparation, H.C.B.N., B.S.T., R.C.M., D.G.R., J.A.F.D., S.D.J., P.R.L.S., N.B.L. and N.B.D.L. All authors have read and agreed to the published version of the manuscript.

Funding

This research was funded by CNPq (funding number 310132/2021-5) and FACEPE (funding number APQ-0770-3.01/24).

Data Availability Statement

The original contributions presented in this study are included in the article/Supplementary Material. Further inquiries can be directed to the corresponding authors.

Acknowledgments

The authors are grateful for the financial support of the Brazilian Agencies CNPq and FACEPE. N.B.D.L. thanks the L’Oréal-UNESCO-ABC “For Women in Science”.

Conflicts of Interest

The authors declare no conflicts of interest.

References

  1. Mishra, C.R.; Yadav, D.; Sharma, P.S.; Alli, M.M. Production of Ordinary Portland Cement (OPC) from NALCO Red Mud. In Light Metals 2011; Lindsay, S.J., Ed.; TMS (The Minerals, Metals & Materials Society): Pittsburgh, PA, USA, 2011; pp. 97–100. [Google Scholar] [CrossRef]
  2. Neto, J.S.A.; De la Torre, A.G.; Kirchheim, A.P. Effects of sulfates on the hydration of Portland cement—A review. Constr. Build. Mater. 2021, 279, 122428. [Google Scholar] [CrossRef]
  3. Lv, M.; Yang, L.; Wang, F.; Hu, S.; Zhong, H.; Zhang, M.; He, J. Effect of gypsum on hydration properties, composition and kinetics of low carbon belite-ye’elimite-Q phase-ferrite clinker. Cem. Concr. Res. 2024, 178, 107466. [Google Scholar] [CrossRef]
  4. Huang, T.; Yuan, Q.; Zuo, S.; Xie, Y.; Shi, C. New insights into the effect of gypsum on hydration and elasticity development of C3S paste during setting. Cem. Concr. Res. 2022, 159, 106860. [Google Scholar] [CrossRef]
  5. Juilland, P.; Nicoleau, L.; Arvidson, R.S.; Gallucci, E. Advances in dissolution understanding and their implications for cement hydration. RILEM Tech. Lett. 2017, 2, 90–98. [Google Scholar] [CrossRef]
  6. John, E.; Lothenbach, B. Cement hydration mechanisms through time—A review. J. Mater. Sci. 2023, 58, 9805–9833. [Google Scholar] [CrossRef]
  7. Shu, X.; Huang, B. Recycling of waste tire rubber in asphalt and portland cement concrete: An overview. Constr. Build. Mater. 2014, 67, 217–224. [Google Scholar] [CrossRef]
  8. Scrivener, K.L.; John, V.M.; Gartner, E.M. Eco-efficient cements: Potential economically viable solutions for a low-CO2 cement-based materials industry. Cem. Concr. Res. 2018, 114, 2–26. [Google Scholar] [CrossRef]
  9. Karpova, E.; Skripkiūnas, G.; Barauskas, I.; Barauskienė, I.; Hodul, J. Influence of carbon nanotubes and polycarboxylate superplasticiser on the Portland cement hydration process. Constr. Build. Mater. 2021, 304, 124648. [Google Scholar] [CrossRef]
  10. Krstulović, R.; Dabić, P. A conceptual model of the cement hydration process. Cem. Concr. Res. 2000, 30, 693–698. [Google Scholar] [CrossRef]
  11. Wu, Z.; Liu, J.; Zhang, G.; Wang, Y.; Wang, Y. Effect of aluminum sulfate alkali-free liquid accelerator with compound alkanol lamine on the hydration processes of Portland cement. Constr. Build. Mater. 2021, 308, 125101. [Google Scholar] [CrossRef]
  12. Liu, Z.; Sha, A.; Hu, L.; Lu, Y.; Jiao, W.; Tong, Z.; Gao, J. Kinetic and thermodynamic modeling of Portland cement hydration at low temperatures. Chem. Pap. 2017, 71, 741–751. [Google Scholar] [CrossRef]
  13. Soriano, L.; Monzó, J.; Bonilla, M.; Tashima, M.M.; Payá, J.; Borrachero, M.V. Effect of pozzolans on the hydration process of Portland cement cured at low temperatures. Cem. Concr. Compos. 2013, 42, 41–48. [Google Scholar] [CrossRef]
  14. Land, G.; Stephan, D. The influence of nano-silica on the hydration of ordinary Portland cement. J. Mater. Sci. 2012, 47, 1011–1017. [Google Scholar] [CrossRef]
  15. Chen, W.; Brouwers, H.J.H. Mitigating the effects of system resolution on computer simulation of Portland cement hydration. Cem. Concr. Compos. 2008, 30, 779–787. [Google Scholar] [CrossRef]
  16. Ye, Q.; Yu, K.; Zhang, Z. Expansion of ordinary Portland cement paste varied with nano-MgO. Constr. Build. Mater. 2015, 78, 189–193. [Google Scholar] [CrossRef]
  17. Clark, W.E. The Isolation of Radioiodine with Portland Cement. Part I: Scoping Leach Studies. Nucl. Technol. 1977, 36, 215–221. [Google Scholar] [CrossRef]
  18. Saghiri, M.A.; Lotfi, M.; Joupari, M.D.; Aeinehchi, M.; Saghiri, A.M. Effects of Storage Temperature on Surface Hardness, Microstructure, and Phase Formation of White Mineral Trioxide Aggregate. J. Endod. 2010, 36, 1414–1418. [Google Scholar] [CrossRef]
  19. Sun, H.; Jain, R.; Nguyen, K.; Zuckerman, J. Sialite technology—Sustainable alternative to portland cement. Clean Technol. Environ. Policy 2010, 12, 503–516. [Google Scholar] [CrossRef]
  20. Li, H.; Zhao, J.; Huang, Y.; Jiang, Z.; Yang, X.; Yang, Z.; Chen, Q. Investigation on the potential of waste cooking oil as a grinding aid in Portland cement. J. Environ. Manag. 2016, 184, 545–551. [Google Scholar] [CrossRef] [PubMed]
  21. Meireles, P.D.S.; Pereira, D.S.S.; Melo, M.A.F.; Braga, R.M.; Freitas, J.C.O.; Melo, D.M.A.; Silvestre, F.R.S. Technical evaluation of calcium sulphate α-hemihydrate in oilwell application: An alternative to reduce the environmental impacts of Portland cement. J. Clean. Prod. 2019, 220, 1215–1221. [Google Scholar] [CrossRef]
  22. Kryvenko, P.; Rudenko, I.; Sikora, P.; Sanytsky, M.; Konstantynovskyi, O.; Kropyvnytska, T. Alkali-activated cements as sustainable materials for repairing building construction: A review. J. Build. Eng. 2024, 90, 109399. [Google Scholar] [CrossRef]
  23. Shi, C.; Jiménez, A.F.; Palomo, A. New cements for the 21st century: The pursuit of an alternative to Portland cement. Cem. Concr. Res. 2011, 41, 750–763. [Google Scholar] [CrossRef]
  24. Ahmed, M.; Bashar, I.; Alam, S.T.; Wasi, A.I.; Jerin, I.; Khatun, S.; Rahman, M. An overview of Asian cement industry: Environmental impacts, research methodologies and mitigation measures. Sustain. Prod. Consum. 2021, 28, 1018–1039. [Google Scholar] [CrossRef]
  25. Li, C.; Cui, S.; Nie, Z.; Gong, X.; Wang, Z.; Itsubo, N. The LCA of portland cement production in China. Int. J. Life Cycle Assess. 2015, 20, 117–127. [Google Scholar] [CrossRef]
  26. Harrison, E.; Berenjian, A.; Seifan, M. Recycling of waste glass as aggregate in cement-based materials. Environ. Sci. Ecotechnol. 2020, 4, 100064. [Google Scholar] [CrossRef] [PubMed]
  27. Yin, W.; Li, X.; Sun, T.; Chen, Y.; Xu, F.; Yan, G.; Xu, M.; Tian, K. Utilization of waste glass powder as partial replacement of cement for the cementitious grouts with superplasticizer and viscosity modifying agent binary mixtures: Rheological and mechanical performances. Constr. Build. Mater. 2021, 286, 122953. [Google Scholar] [CrossRef]
  28. Saha, A.K. Effect of class F fly ash on the durability properties of concrete. Sustain. Environ. Res. 2018, 28, 25–31. [Google Scholar] [CrossRef]
  29. Naresh, B.; Saravanan, M. Experimental study of replacement of cement with ground granulated blast furnace slag. Mater. Today Proc. 2022, 62, 3493–3496. [Google Scholar] [CrossRef]
  30. Nedeljković, M.; Visser, J.; Šavija, B.; Valcke, S.; Schlangen, E. Use of fine recycled concrete aggregates in concrete: A critical review. J. Build. Eng. 2021, 38, 102196. [Google Scholar] [CrossRef]
  31. Grigoriadis, K.; Ban, J.; Caverzan, A.; Negro, P.; Senaldi, C.; Ceccone, G. Use of irradiated PET plastic waste for partially replacing cement in concrete. Waste Manag. 2023, 170, 193–203. [Google Scholar] [CrossRef]
  32. Khankhaje, E.; Kim, T.; Jang, H.; Kim, C.S.; Kim, J.; Rafieizonooz, M. Properties of pervious concrete incorporating fly ash as partial replacement of cement: A review. Dev. Built Environ. 2023, 14, 100130. [Google Scholar] [CrossRef]
  33. Özbay, E.; Erdemir, M.; Durmuş, H.İ. Utilization and efficiency of ground granulated blast furnace slag on concrete properties—A review. Constr. Build. Mater. 2016, 105, 423–434. [Google Scholar] [CrossRef]
  34. Shahidan, S.; Azmi, M.A.M.; Kupusamy, K.; Zuki, S.S.M.; Alie, N. Utilizing Construction and Demolition (C&D) Waste as Recycled Aggregates (RA) in Concrete. Procedia Eng. 2017, 174, 1028–1035. [Google Scholar] [CrossRef]
  35. Yao, J.J.; Chu, S.H. Durability of sustainable marine sediment concrete. Dev. Built Environ. 2023, 13, 100118. [Google Scholar] [CrossRef]
  36. Yu, H.; Da, B.; Ma, H.; Zhu, H.; Yu, Q.; Ye, H.; Jing, X. Durability of concrete structures in tropical atoll environment. Ocean Eng. 2017, 135, 1–10. [Google Scholar] [CrossRef]
  37. Chu, T.; Zheng, J.; Chen, D.; Nguyen, T.; Elbashiry, E.; Tang, V. Utilization of Industrial Waste in Cement in a Marine Environment with a Tropical Climate. J. Mar. Sci. Eng. 2019, 7, 245. [Google Scholar] [CrossRef]
  38. Lemougna, P.N.; Melo, U.F.C.; Kamseu, E.; Tchamba, A.B. Laterite Based Stabilized Products for Sustainable Building Applications in Tropical Countries: Review and Prospects for the Case of Cameroon. Sustainability 2011, 3, 293–305. [Google Scholar] [CrossRef]
  39. Nascimento, H.C.B.; Lima, N.B.; Jesus, S.D.; Rocha, D.G.; Cavalcante, H.S.; Teti, B.S.; Manta, R.; Santos, L.B.T.; Campelo, S.; Lima, N.B.D. A molecular formalism of the hydraulic cement deterioration stored at different temperatures and its impact on the mechanical behavior. Cement 2025, 19, 100130. [Google Scholar] [CrossRef]
  40. Aliabdo, A.A.; Elmoaty, A.E.M.A.; Aboshama, A.Y. Utilization of waste glass powder in the production of cement and concrete. Constr. Build. Mater. 2016, 124, 866–877. [Google Scholar] [CrossRef]
  41. Tkachenko, N.; Tang, K.; McCarten, M.; Reece, S.; Kampmann, D.; Hickey, C.; Bayaraa, M.; Foster, P.; Layman, C.; Rossi, C.; et al. Global database of cement production assets and upstream suppliers. Sci. Data 2023, 10, 1–9. [Google Scholar] [CrossRef] [PubMed]
  42. Mossie, A.T.; Khatiwada, D.; Palm, B.; Bekele, G. Investigating energy saving and climate mitigation potentials in cement production—A case study in Ethiopia. Energy Convers. Manag. 2023, 287, 117111. [Google Scholar] [CrossRef]
  43. Rihan, M.A.M.; Abdalla, T.A. Factors Influencing Compressive Strength in Fly Ash-Based Geopolymer Concrete: A Comprehensive Review. Iran. J. Sci. Technol. Trans. Civ. Eng. 2024, 48, 3853–3869. [Google Scholar] [CrossRef]
  44. Navaratnam, S.; Tushar, Q.; Jahan, I.; Zhang, G. Environmental Sustainability of Industrial Waste-Based Cementitious Materials: A Review, Experimental Investigation and Life-Cycle Assessment. Sustainability 2023, 15, 1873. [Google Scholar] [CrossRef]
  45. Mahmood, R.A.; Kockal, N.U. Cementitious materials incorporating waste plastics: A Review. SN Appl. Sci. 2020, 2, 2072. [Google Scholar] [CrossRef]
  46. Catalin, S.; Daniela, M.L.; Moldovan, M.; Monica, L.M.; Borodi, G.; Petean, I.; Sorin, L. Recycled Aggregates Influence on the Mechanical Properties of Cement Lime-Based Mortars. Materials 2024, 17, 5122. [Google Scholar] [CrossRef] [PubMed]
  47. Cieri, L.; Cassese, P.; Fabbrocino, G.; Occhiuzzi, A.; Rainieri, C. Experimental Study about the Influence of Storage Conditions of Bulk Cement on the Early-Age Stiffness Evolution of Cementitious Pastes. Appl. Sci. 2023, 13, 11734. [Google Scholar] [CrossRef]
  48. Golewski, G.L.; Szostak, B. Application of the C-S-H Phase Nucleating Agents to Improve the Performance of Sustainable Concrete Composites Containing Fly Ash for Use in the Precast Concrete Industry. Materials 2021, 14, 6514. [Google Scholar] [CrossRef] [PubMed]
  49. Maciel, M.H.; Soares, G.S.; Romano, R.C.; Cincotto, M.A. Monitoring of Portland Cement Chemical Reaction and Quantification of the Hydrated Products by XRD and TG in Function of the Stoppage Hydration Technique. J. Therm. Anal. Calorim. 2019, 136, 1269–1284. [Google Scholar] [CrossRef]
  50. Jiang, J.; Li, M.; Yan, J.; Zhou, M.; Duan, P.; Zhang, Z.; Liu, J. Assessment of Early Hydration and Microstructures of Portland Cement Incorporating Calcined Attapulgite. Arab. J. Sci. Eng. 2023, 48, 12891–12902. [Google Scholar] [CrossRef]
  51. Kunther, W.; Ferreiro, S.; Skibsted, J. Influence of the Ca/Si Ratio on the Compressive Strength of Cementitious Calcium–Silicate–Hydrate Binders. J. Mater. Chem. A 2017, 5, 17401–17412. [Google Scholar] [CrossRef]
  52. Ye, H.; Radlińska, A.; Neves, J. Drying and Carbonation Shrinkage of Cement Paste Containing Alkalis. Mater. Struct. 2017, 50, 132. [Google Scholar] [CrossRef]
  53. Cheng, D.; Reiner, D.M.; Yang, F.; Cui, C.; Meng, J.; Shan, Y.; Liu, Y.; Tao, S.; Guan, D. Projecting future carbon emissions from cement production in developing countries. Nat. Commun. 2023, 14, 8213. [Google Scholar] [CrossRef] [PubMed]
Figure 1. Construction and demolition waste (gray waste), (a) in its raw form and (b) after grinding.
Jcs 09 00583 g001
Figure 2. Shimadzu XRD-7000 diffractometer.
Jcs 09 00583 g002
Figure 3. TESCAN MIRA 3 microscope, SEM/EDS.
Jcs 09 00583 g003
Figure 4. Engetotus hydraulic press, 20 tons.
Jcs 09 00583 g004
Figure 5. Compressive strength, types (a) A, (b) B, and (c) C, new cement.
Jcs 09 00583 g005
Figure 6. XRD patterns of type A, (a) reference [39], and prepared with cement stored for 90 days at (b)10 °C, (c) 30 °C, and (d) 50 °C.
Jcs 09 00583 g006
Figure 7. XRD patterns of type B mortars prepared with cement stored for 90 days at (a) 10 °C, (b) 30 °C, and (c) 50 °C.
Jcs 09 00583 g007
Figure 8. XRD patterns of type C mortars prepared with cement stored for 90 days at (a) 10 °C, (b) 30 °C, and (c) 50 °C.
Jcs 09 00583 g008
Figure 9. Scanning Electron Microscopy of the reference mortar (Type A), considering magnifications of (a) 2 kx, (b) 10 kx, (c) 20 kx [39], and (d) 50 kx. The red, yellow, and blue circles correspond to CSH phase, ettringite, and portlandite, respectively.
Jcs 09 00583 g009
Figure 10. Scanning Electron Microscopy of the mortar (Type A), storage temperature of 10 °C, considering magnifications of (a) 2 kx, (b) 10 kx, (c) 20 kx [39], and (d) 50 kx. The red and blue circles correspond to CSH phase and portlandite, respectively.
Jcs 09 00583 g010
Figure 11. Scanning Electron Microscopy of the mortar (Type A), storage temperature of 30 °C, considering magnifications of (a) 2 kx, (b) 10 kx, (c) 20 kx [39], and (d) 50 kx. The red, yellow, and blue circles correspond to CSH phase, ettringite, and portlandite, respectively.
Jcs 09 00583 g011
Figure 12. Scanning Electron Microscopy of the mortar (Type A), storage temperature of 50 °C, considering magnifications of (a) 2 kx, (b) 10 kx, (c) 20 kx [39], and (d) 50 kx. The red, yellow, and blue circles correspond to CSH phase, ettringite, and portlandite, respectively.
Jcs 09 00583 g012
Figure 13. Scanning Electron Microscopy of the mortar (Type B), storage temperature of 10 °C, considering magnifications of (a) 2 kx, (b) 10 kx, (c) 20 kx [39], and (d) 50 kx. The red, yellow, and blue circles correspond to CSH phase, ettringite, and portlandite, respectively.
Jcs 09 00583 g013
Figure 14. Scanning Electron Microscopy of the mortar (Type B), storage temperature of 30 °C, considering magnifications of (a) 2 kx, (b) 10 kx, (c) 20 kx [39], and (d) 50 kx. The red, yellow, and blue circles correspond to CSH phase, ettringite, and portlandite, respectively.
Jcs 09 00583 g014
Figure 15. Scanning Electron Microscopy of the mortar (Type B), storage temperature of 50 °C, considering magnifications of (a) 2 kx, (b) 10 kx, (c) 20 kx [39], and (d) 50 kx. The red, yellow, and blue circles correspond to CSH phase, ettringite, and portlandite, respectively.
Jcs 09 00583 g015
Figure 16. Scanning Electron Microscopy of the mortar (Type C), storage temperature of 10 °C, considering magnifications of (a) 2 kx, (b) 10 kx, (c) 20 kx, and (d) 50 kx. The red, and blue circles correspond to CSH phase and portlandite, respectively.
Jcs 09 00583 g016
Figure 17. Scanning Electron Microscopy of the mortar (Type C), storage temperature of 30 °C, considering magnifications of (a) 2 kx, (b) 10 kx, (c) 20 kx [39], and (d) 50 kx. The red, yellow, and blue circles correspond to CSH phase, ettringite, and portlandite, respectively.
Jcs 09 00583 g017
Figure 18. Scanning Electron Microscopy of the mortar (Type C), storage temperature of 50 °C, considering magnifications of (a) 2 kx, (b) 10 kx, (c) 20 kx [39], and (d) 50 kx. The red, yellow, and blue circles correspond to CSH phase, ettringite, and portlandite, respectively.
Jcs 09 00583 g018
Figure 19. SEM image, EDS spectrum, punctual chemical composition, and corresponding maps obtained in conjunction with electron microscopy of type A mortar prepared with cement stored at 10 °C for 45 days.
Jcs 09 00583 g019
Figure 20. SEM image, EDS spectrum, punctual chemical composition, and corresponding maps obtained in conjunction with electron microscopy of type A mortar prepared with cement stored at 30 °C for 45 days.
Jcs 09 00583 g020
Figure 21. SEM image, EDS spectrum, punctual chemical composition, and corresponding maps obtained in conjunction with electron microscopy of type A mortar prepared with cement stored at 50 °C for 45 days.
Jcs 09 00583 g021
Figure 22. SEM image, EDS spectrum, punctual chemical composition, and corresponding maps obtained in conjunction with electron microscopy of type B mortar prepared with cement stored at 10 °C for 45 days.
Jcs 09 00583 g022
Figure 23. SEM image, EDS spectrum, punctual chemical composition, and corresponding maps obtained with electron microscopy of type B mortar prepared with cement stored at 30 °C for 45 days.
Jcs 09 00583 g023
Figure 24. SEM image, EDS spectrum, punctual chemical composition, and corresponding maps obtained in conjunction with electron microscopy of type B mortar prepared with cement stored at 50 °C for 45 days.
Jcs 09 00583 g024
Figure 25. SEM image, EDS spectrum, punctual chemical composition, and corresponding maps obtained in conjunction with electron microscopy of type C mortar prepared with cement stored at 10 °C for 45 days.
Jcs 09 00583 g025
Figure 26. SEM image, EDS spectrum, punctual chemical composition, and corresponding maps obtained in conjunction with electron microscopy of type C mortar prepared with cement stored at 30 °C for 45 days.
Jcs 09 00583 g026
Figure 27. SEM image, EDS spectrum, punctual chemical composition, and corresponding maps obtained in conjunction with electron microscopy of type C mortar prepared with cement stored at 50 °C for 45 days.
Jcs 09 00583 g027
Table 1. Composition of Portland cement type II Z–32, as previously reported [39].
Cement TypeComponents (% by Mass)
Clinker + Calcium SulfatePozzolanaCarbonaceous Material
II Z71–946–140–15
Table 2. Chemical and physical information of the hydrated lime, as previously reported [39].
CriteriaResults of the Material UsedNormative Parameters
Loss to fire (1.000 ± 50 °C)0.59%-
Moisture (110 ± 5 °C)22.94%-
Carbonic Anhydride2.01% CO2≤7%
Sulfuric Anhydride0.12% SO3-
Total Calcium Oxide66.90% CaO-
Magnesium oxide2.96% MgO-
CaO + MgO not hydrated4.00%≤10%
Total oxides on a non-volatile basis90.70%≥90%
Fineness (% accumulated retained)sieve #30 (600 µm)0.00%≤0.5
sieve #200 (75 µm)1.80%≤10%
Table 3. Quantities of precursors used in mortar test specimens. This design has been previously reported [39].
Type of MaterialCement (g)Lime (g)Sand (g)Fine Aggregate (g)Water/Cement
Reference—Type A468468210601.25
Addition—Type B468468210646.81.25
Replacement—Type C421.2468210646.81.25
Table 4. Compression strength, type A, 10 °C, 30 °C, and 50 °C, period 0 to 105 days.
DayCompressive Strength (MPa)
10 °C30 °C50 °C
158.39.89.0
306.67.76.8
458.1 [39]8.4 [39]7.9 [39]
606.57.87.7
756.37.58.0
906.7 [39]7.7 [39]7.2 [39]
1057.88.28.5
Average7.28.27.9
Standard deviation0.8450.7890.743
Variance0.7150.6230.552
Median6.77.87.9
Table 5. Compression strength, type B, 10 °C, 30 °C, and 50 °C, period 0 to 105 days.
DayCompressive Strength (MPa)
10 °C30 °C50 °C
156.78.69.2
306.67.77.4
457.9 [39]7.7 [39]9.2 [39]
607.27.27.7
756.58.08.4
905.1 [39]6.0 [39]7.5 [39]
1057.88.37.1
Average6.87.68.1
Standard deviation0.9480.8540.867
Variance0.8990.7300.752
Median6.77.77.7
Table 6. Compression strength, type C, 10 °C, 30 °C, and 50 °C, period 0 to 105 days.
DayCompressive Strength (MPa)
10 °C30 °C50 °C
155.26.27.3
304.75.25.5
455.8 [39]6.2 [39]6.4 [39]
606.36.76.6
755.76.05.4
908.2 [39]7.4 [39]8.6 [39]
1055.76.66.2
Average5.96.36.6
Standard deviation1.1150.6801.106
Variance1.2430.4621.222
Median5.76.26.4
Disclaimer/Publisher’s Note: The statements, opinions and data contained in all publications are solely those of the individual author(s) and contributor(s) and not of MDPI and/or the editor(s). MDPI and/or the editor(s) disclaim responsibility for any injury to people or property resulting from any ideas, methods, instructions or products referred to in the content.