1. Introduction
In modern industry, composite materials are increasingly gaining ground, displacing traditional materials such as metals and alloys [
1]. Their unique properties—high strength-to-weight ratio, corrosion resistance, and the ability to create materials with specified characteristics—make them indispensable in aerospace, automotive engineering, energy, medicine, and other high-tech industries [
2]. However, despite all these advantages, their processing, especially cutting, remains one of the most complex and pressing issues in mechanical engineering. This is due to the specific heterogeneous structure of composites, which differs significantly from the homogeneous structure of metals [
3]. Unlike the plastic deformation characteristic of metals, the cutting process of composites is accompanied by brittle fracture and abrasive wear, placing special demands on the cutting tool [
4].
The machining of composite materials, particularly sand–polymer composites, is one of the most complex and least studied areas of mechanical engineering. SPCs represent a special class of particle-reinforced composites consisting of a polymer matrix and quartz sand filler. In contrast to carbon- or glass-fiber-reinforced plastics (CFRP/GFRP), SPCs are characterized by a particulate structure, high abrasiveness, and low thermal conductivity of the polymer matrix, which together create distinct machining challenges. The main difficulties are associated with the high abrasiveness of the reinforcing quartz particles, the low heat dissipation capacity of the matrix, and the heterogeneity of the material’s mechanical properties [
5]. During cutting, this leads to rapid tool wear, delamination, chipping, and burr formation [
6], as well as significant thermomechanical loads that can cause local overheating, tool failure, and deterioration of the machined surface quality [
7].
Carbide cutting inserts, such as those of the WC-TiC-Co group, are widely used for machining highly abrasive composites due to their high hardness and strength [
8]. Even these tools, however, are subject to significant thermomechanical stresses [
9]. Understanding the stress–strain state (SSS) of a cutting insert during operation allows assessment of whether the permissible stresses for a given tool material are exceeded, predicting behaviors such as elastic deformation, wear, or brittle chipping [
10]. This knowledge also facilitates optimization of tool geometry—including rake and clearance angles, edge radius, and chamfer dimensions—to reduce stress concentrations and extend tool life.
With the advent of new composite types, such as CFRP, GFRP, and hybrid materials, machining complexity has increased further [
11]. For example, CFRP generates highly abrasive dust, accelerating tool wear and posing health hazards [
12], while GFRP is highly brittle, making it prone to delamination during drilling or milling [
13]. Compared to these materials, SPCs exhibit a unique combination of brittle-abrasive behavior and low thermal conductivity, which demands a different modeling approach and makes existing metal-cutting or fiber–composite models inapplicable.
One of the most promising approaches to addressing these challenges is numerical modeling, particularly finite element modeling (FEM). Modern trends in FEM research focus on analyzing the SSS of tools under complex cutting conditions, evaluating the effects of tool geometry, cutting speed, feed rate, and composite composition on tool wear and failure [
14,
15,
16,
17]. Increasingly, studies integrate experimental data with FEM simulations to provide more accurate predictions of tool behavior under transient thermomechanical loads [
18,
19]. Such models not only allow the visualization of stress and deformation distributions but also enable the optimization of cutting parameters to extend tool life and improve surface quality [
20,
21].
Despite significant progress, several challenges remain unresolved. Although the machinability and wear mechanisms of composites are well studied, there is still no detailed quantitative analysis of the internal stress–strain state of cutting tools as a function of filler content. In particular, the influence of quartz fraction in SPCs on the internal SSS and contact stress distribution of the tool has not been systematically investigated. Recent studies have shown that the morphology and concentration of filler particles significantly affect cutting forces and tool wear [
22], while other works have demonstrated that the mechanical and thermal properties of filled polymers, including modulus and strength, strongly depend on quartz content [
23]. However, these studies do not directly address stress distribution within the tool under real cutting conditions, leaving a gap in understanding tool failure mechanisms.
To fill this gap, the present study applies a combined analytical-numerical approach to investigate the SSS of a T15K6 carbide turning insert during the machining of sand–polymer composites. Particular attention is paid to the influence of quartz filler mass fraction on the distribution of contact stresses along the cutting edge and flank surfaces. The novelty of this work lies in performing a systematic quantitative analysis of tool stresses depending on filler content, integrating analytical contact models with FEM simulations. The obtained results provide deeper insights into tool loading mechanisms and form the basis for optimizing tool geometry and selecting suitable materials for effective SPC machining.
2. Materials and Methods
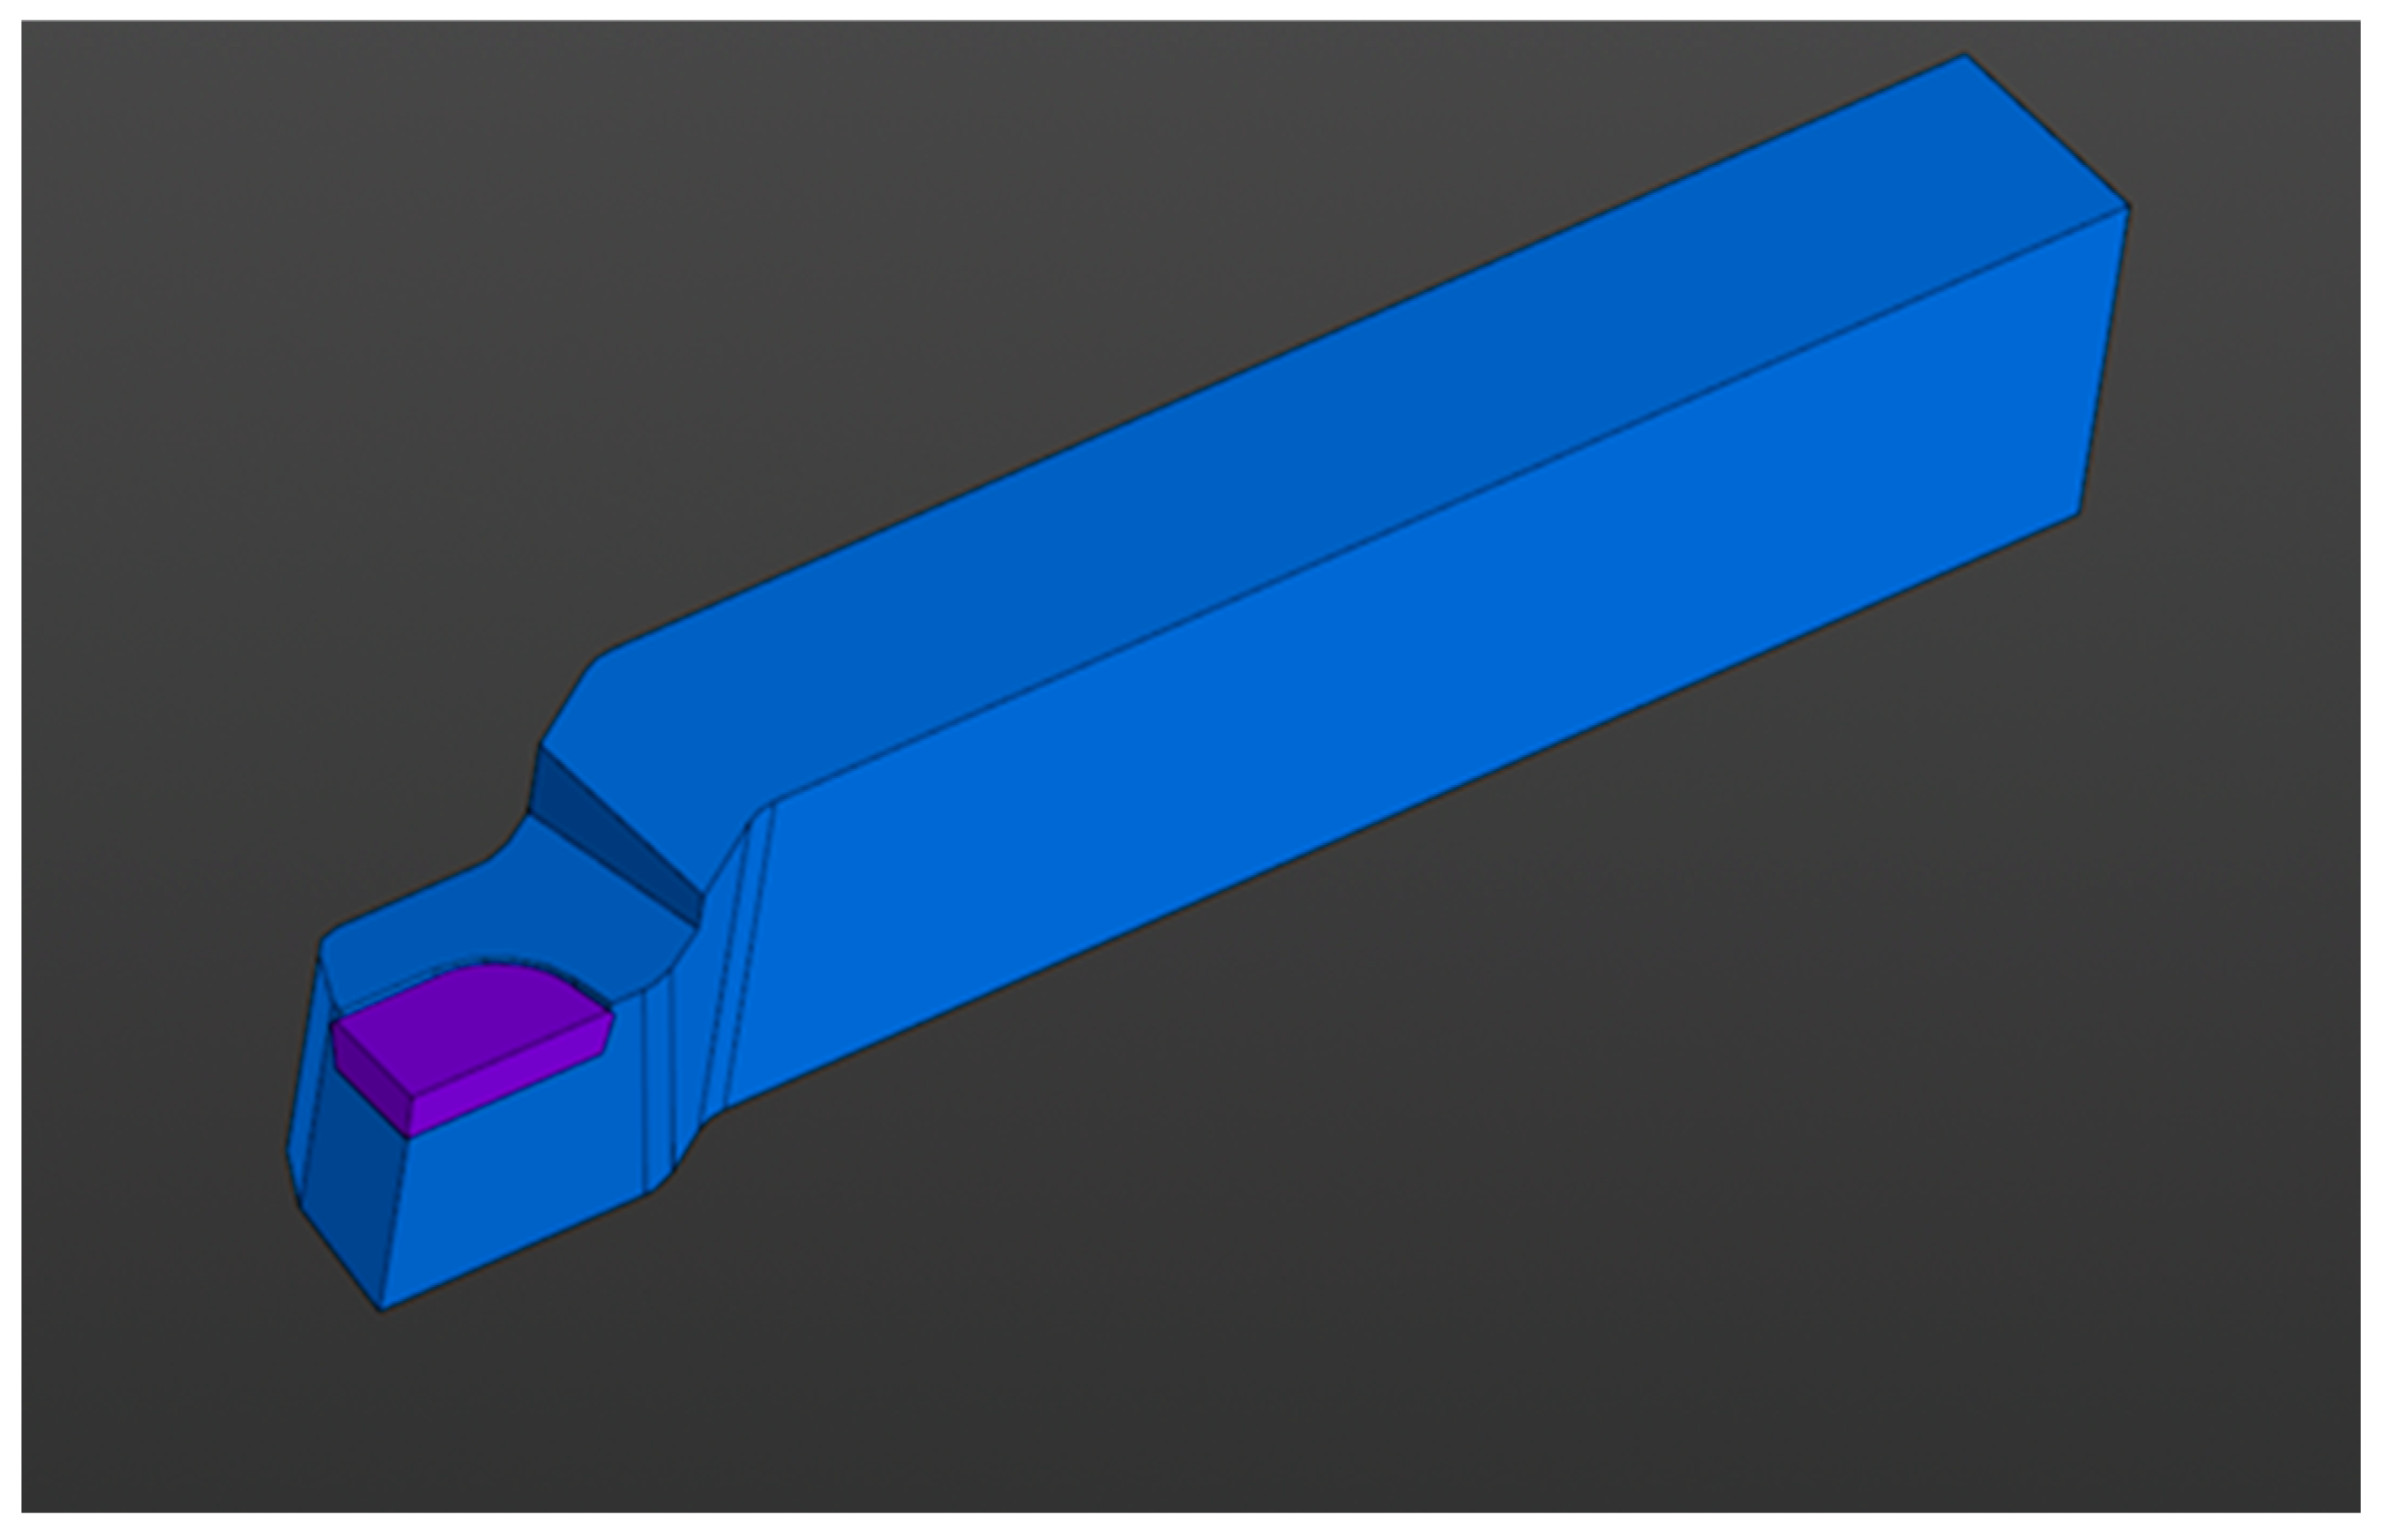
A lathe cutter with a brazed plate made of T15K6 hard alloy (LLC PF “Russian Instrument”, Belgorod, Russia) was selected as the object of study. The geometric parameters of the cutter were adopted in accordance with GOST 18879-73 [
24] type 2103-0007, which corresponds to a standard straight turning cutter: cutter cross-section 25 × 16; rake angle γ = 10°; and clearance angle α = 10°. The main plan angle (φ) in this case was determined by the cutter design for the considered size φ, typically equal to 60° or 90°; the formula for the cutting thickness took into account a specific φ when calculating contact loads.
Figure 1 shows an image of the cutter used.
The T15K6 hard alloy belongs to the group of tungsten-type carbide hard alloys and contains, according to the designation, approximately 15% titanium carbide (TiC) and about 6% cobalt (Co) as a binder, with the remainder being tungsten carbide (WC) [
25]. This material is widely used for cutters intended for machining hard-to-cut materials due to its combination of high hardness and strength. The main mechanical properties of the T15K6 alloy are summarized in
Table 1, providing the reference data for the simulation of tool behavior [
26].
To analyze the stress–strain state of the cutter when machining sand–polymer composite materials, it is necessary to know the distribution of contact stresses on the rake face and on the chamfers of the clearance face of the cutter [
27,
28], as well as the physical and mechanical properties of the sand–polymer composite, which are summarized in
Table 2, providing the baseline data for the numerical analysis [
29].
When turning a sand–polymer composite material, the following cutting parameters are specified: feed rate S = 0.2 mm/rev, main plan angle φ = 90°, and cutting width b = 3 mm. These data are used to determine the geometric dimensions of the cut layer and the contact zones on the cutting tool [
30,
31].
The cut thickness (the uncut layer) is calculated using the well-known geometric Formula (1):
where
a is slice thickness;
s is feed;
φ is the main angle in the plan.
When machining sand–polymer composite materials, elemental chips are formed, and the length of contact between the chip and the cutting edge is usually estimated based on empirical relationships. For the given conditions, we assume that the length of contact between the chip and the cutting edge is calculated using Formula (2) [
11,
12]
where
c is chip contact length.
The equations for calculating the physical components of the cutting force at a positive rake angle
γ are calculated using Formula (3) and (4) [
32,
33]:
where
N is normal force;
Pz is the main cutting force;
Pxy is the tangential component of the cutting force in the xy plane.
where
F is the friction force acting on the rake (front) surface of the cutter, as shown in
Figure 2, which schematically illustrates the force components acting in the cutting zone.
In general, the values of the feed force Fx and radial force Fy are significantly lower than the main cutting force Fz: for a cutter, the feed force Fx is typically about 12–25% of Fz, while the radial force Fy ranges from 25 to 50% of the main cutting force Fz [
34,
35], as shown in
Figure 3. This figure illustrates the distribution of contact stresses and the relative magnitudes of the cutting force components under the specified cutting conditions.
An important step is to check the correctness of the diagram construction [
36,
37].
Checking the normal force using the diagram
σ:
Checking the tangential force using the diagram
τ:
For each
i-th section, we determine the physical forces
Ni and
Fi using the contact stress diagrams, which we apply to the corresponding
i-th section of length
Li and width b (b = const). The length
Li should be shorter in sections with intense contact stress variations. The shorter the length
Li, the closer the loading to actual distributed contact loads (contact stresses
σi and
τi). If the length
Li is longer (more than 0.5 mm), ANSYS 2025 R1 will interpret this as concentrated loading, which will lead to unrealistically high stresses in the cutting wedge at the point of load application [
38].
where
Ni is the normal force in the
i-th element of the contact zone on the front surface of the cutter.
where
Fi is the friction force in the
i-th element of the contact zone on the front surface of the cutter.
To apply external loads to the ANSYS program, they must be specified in the direction of the Z, Y, and X axes, and perpendicular (
Ni) or tangential (
Fi) to the front surface. Therefore, it is necessary to calculate the forces in the direction of the OZ (
Pz) and OY (
Py) axes [
39].
Two technological components
PzNi and
PyNi will act on the physical force
Ni [
38].
where
PzNi is the projection of the normal force onto the cutting axis.
where
PyNi is the projection of the normal force onto the axis of the tangential force.
The two technological components
PyFi and
PzFi will also act on the physical force
Fi:
Technological components:
To take into account the influence of all internal stresses and temperature in the stress–strain zone, the equivalent stress is calculated,
ση. Taking into account the variability of the properties of tool materials with increasing temperature, the following criteria for the limiting state are recommended for WC-Co group alloys when the temperature
θ < 870 K [
40,
41]
where
σa denotes the allowable (admissible) stress, which can be interpreted as the yield or failure strength depending on the grade and operating conditions of the alloy. The origin and theoretical justification of this criterion are not always explicitly presented in the literature and therefore require clarification or a direct reference to the primary source.
For a more comprehensive assessment of the stress–strain state, the equivalent (von Mises) stress criterion is applied. According to the von Mises hypothesis, the stress intensity at the point under consideration is given by
where
σ1,
σ2,
σ3 are the principal stresses at the considered point of the cutting tool.
Safety factor of tool material:
n =
σв/
ση [
42].
For the T15K6 hard alloy with a grain size from 1 to 2 µm, the ultimate tensile strength is
σв = 900 MPa, compressive strength is
σc = 4800 MPa, and the ultimate bending strength is
σb = 1400 MPa. When the grain size is reduced to 0.1 µm,
σ = 3800 MPa, as shown in
Table 3.
To evaluate the tool performance, it is necessary to study how changes in the composite composition (quartz content) affect the stress distribution in the cutter.
The mechanical and physical properties of sand–polymer composites with different quartz content are presented in
Table 4, while the influence of quartz content on cutting forces and equivalent stresses is summarized in
Table 5.
The data in
Table 4 were obtained from literature sources [
40,
41] and partially refined using empirical correlations between the elastic modulus, density, and quartz content reported for similar polymer–quartz composites.
The yield strength and tensile strength values were estimated based on the known dependencies between elastic modulus and mechanical strength for particulate-filled polymers. The coefficient of friction was taken according to published data for polymer–ceramic systems in contact with WC-Co cutting tools under dry conditions. The overall uncertainty of the tabulated parameters is estimated to be within ±7% for mechanical properties and ±0.04 for the friction coefficient, which is sufficient for comparative FEM analysis.
The finite element method (FEM) was used to determine the cutting edge stress. A three-dimensional model of the cutting part of the cutter was constructed. The model was discretized with a minimum grid step of 0.2 mm in the cutting edge zone. A general view of the calculation grid is shown in
Figure 4. In this area of increased stress gradient at the edge, smaller finite elements are used, while away from the edge, the size of the elements can be increased to save computing resources [
42].
To minimize numerical errors, a refined finite element mesh was applied near the cutting edge, where the stress gradient is the highest. Although a detailed mesh sensitivity analysis was not carried out, preliminary calculations with several mesh densities showed that the stress distribution near the edge remained stable. Therefore, the adopted mesh (with a minimum element size of 0.2 mm and a total of about 180,000 elements) was considered sufficiently fine for reliable evaluation of the stress–strain state of the cutter.
The boundary conditions were modeled as the cutter being fixed in the holder: the surfaces of the plate corresponding to the planes adjacent to the holder were assigned rigid fixation with zero normal displacement and no slippage [
43]. Physically, this corresponds to a tightly clamped cutter, as in a real tool holder.
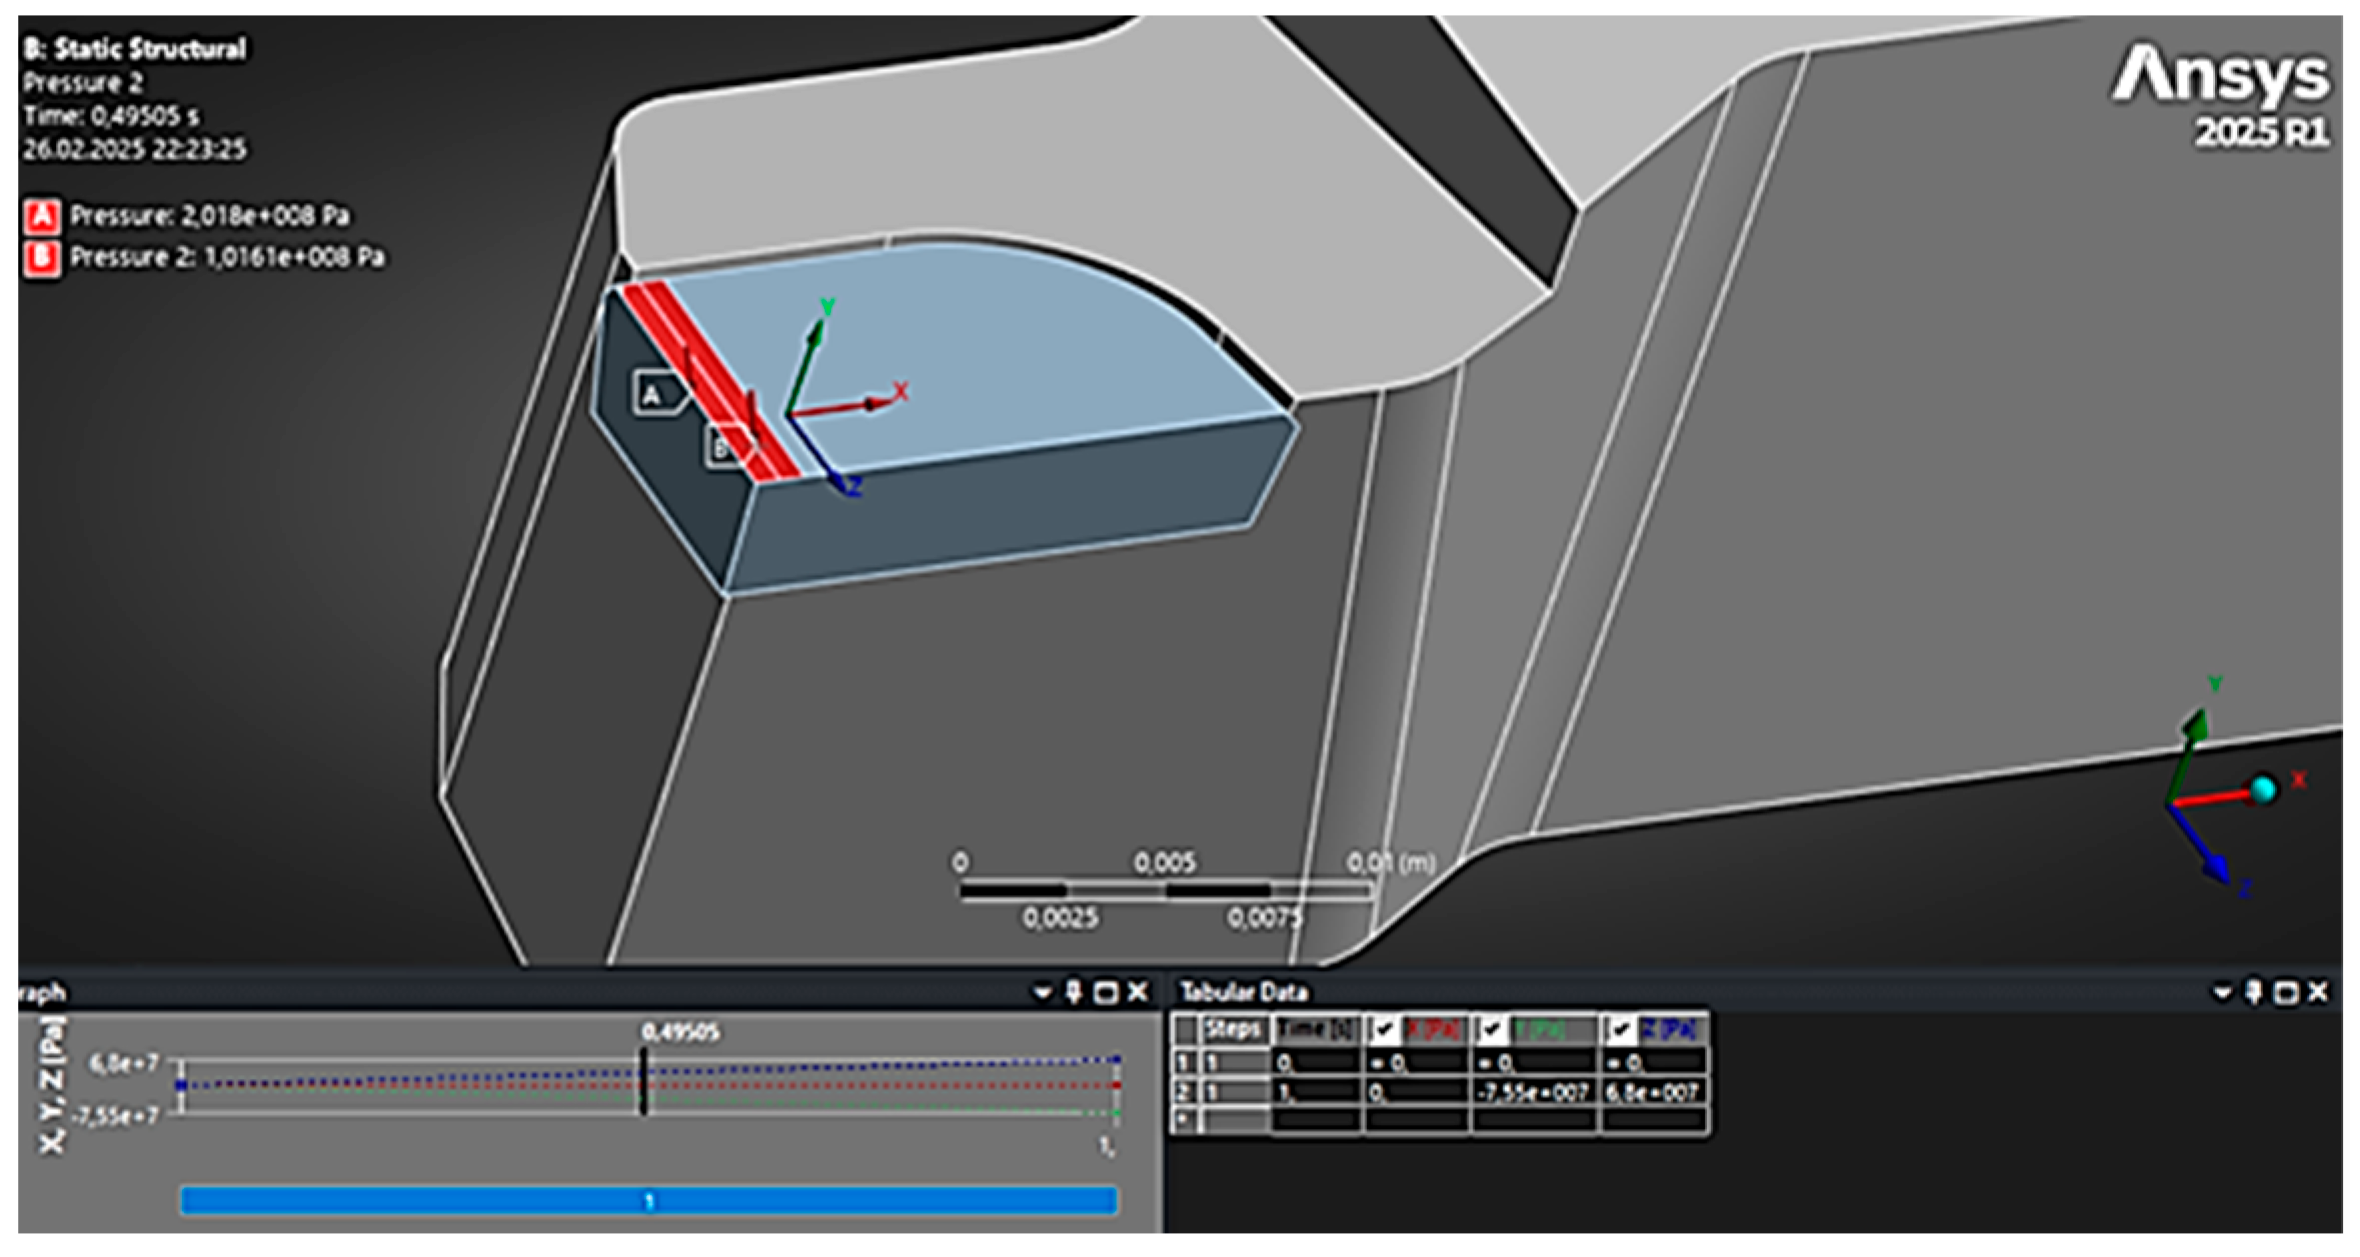
The load on the cutter was applied in the form of distributed pressures acting on the rake (front) and flank (rear) surfaces, simulating the contact stresses from chip pressure and friction. The tangential stresses were defined as a fraction of the normal stresses through the friction coefficient (μ ≈ 0.5), corresponding to dynamic friction conditions between the tool and the chip. Thermal effects were not included in the present simulation, as the study focuses on the static elastic stress–strain state of the cutter.
To illustrate the applied loading and boundary conditions,
Figure 5 schematically represents the fixation of the cutter and the areas where distributed pressures were applied. The clamped regions correspond to the tool holder surfaces, while the loaded zones simulate chip pressure and friction on the rake and flank faces. The normal pressure on the front surface is shown in red, and the pressure on the rear surface is shown in blue. The total friction force was determined as FT ≈ μFN. These values correspond to a light turning mode [
44]; at higher feeds, the forces would increase, but within the scope of this study, the cutting regime was selected such that the tool operates within the elastic range without failure.
After setting all the boundary conditions, the problem was solved using the finite element method.
3. Results
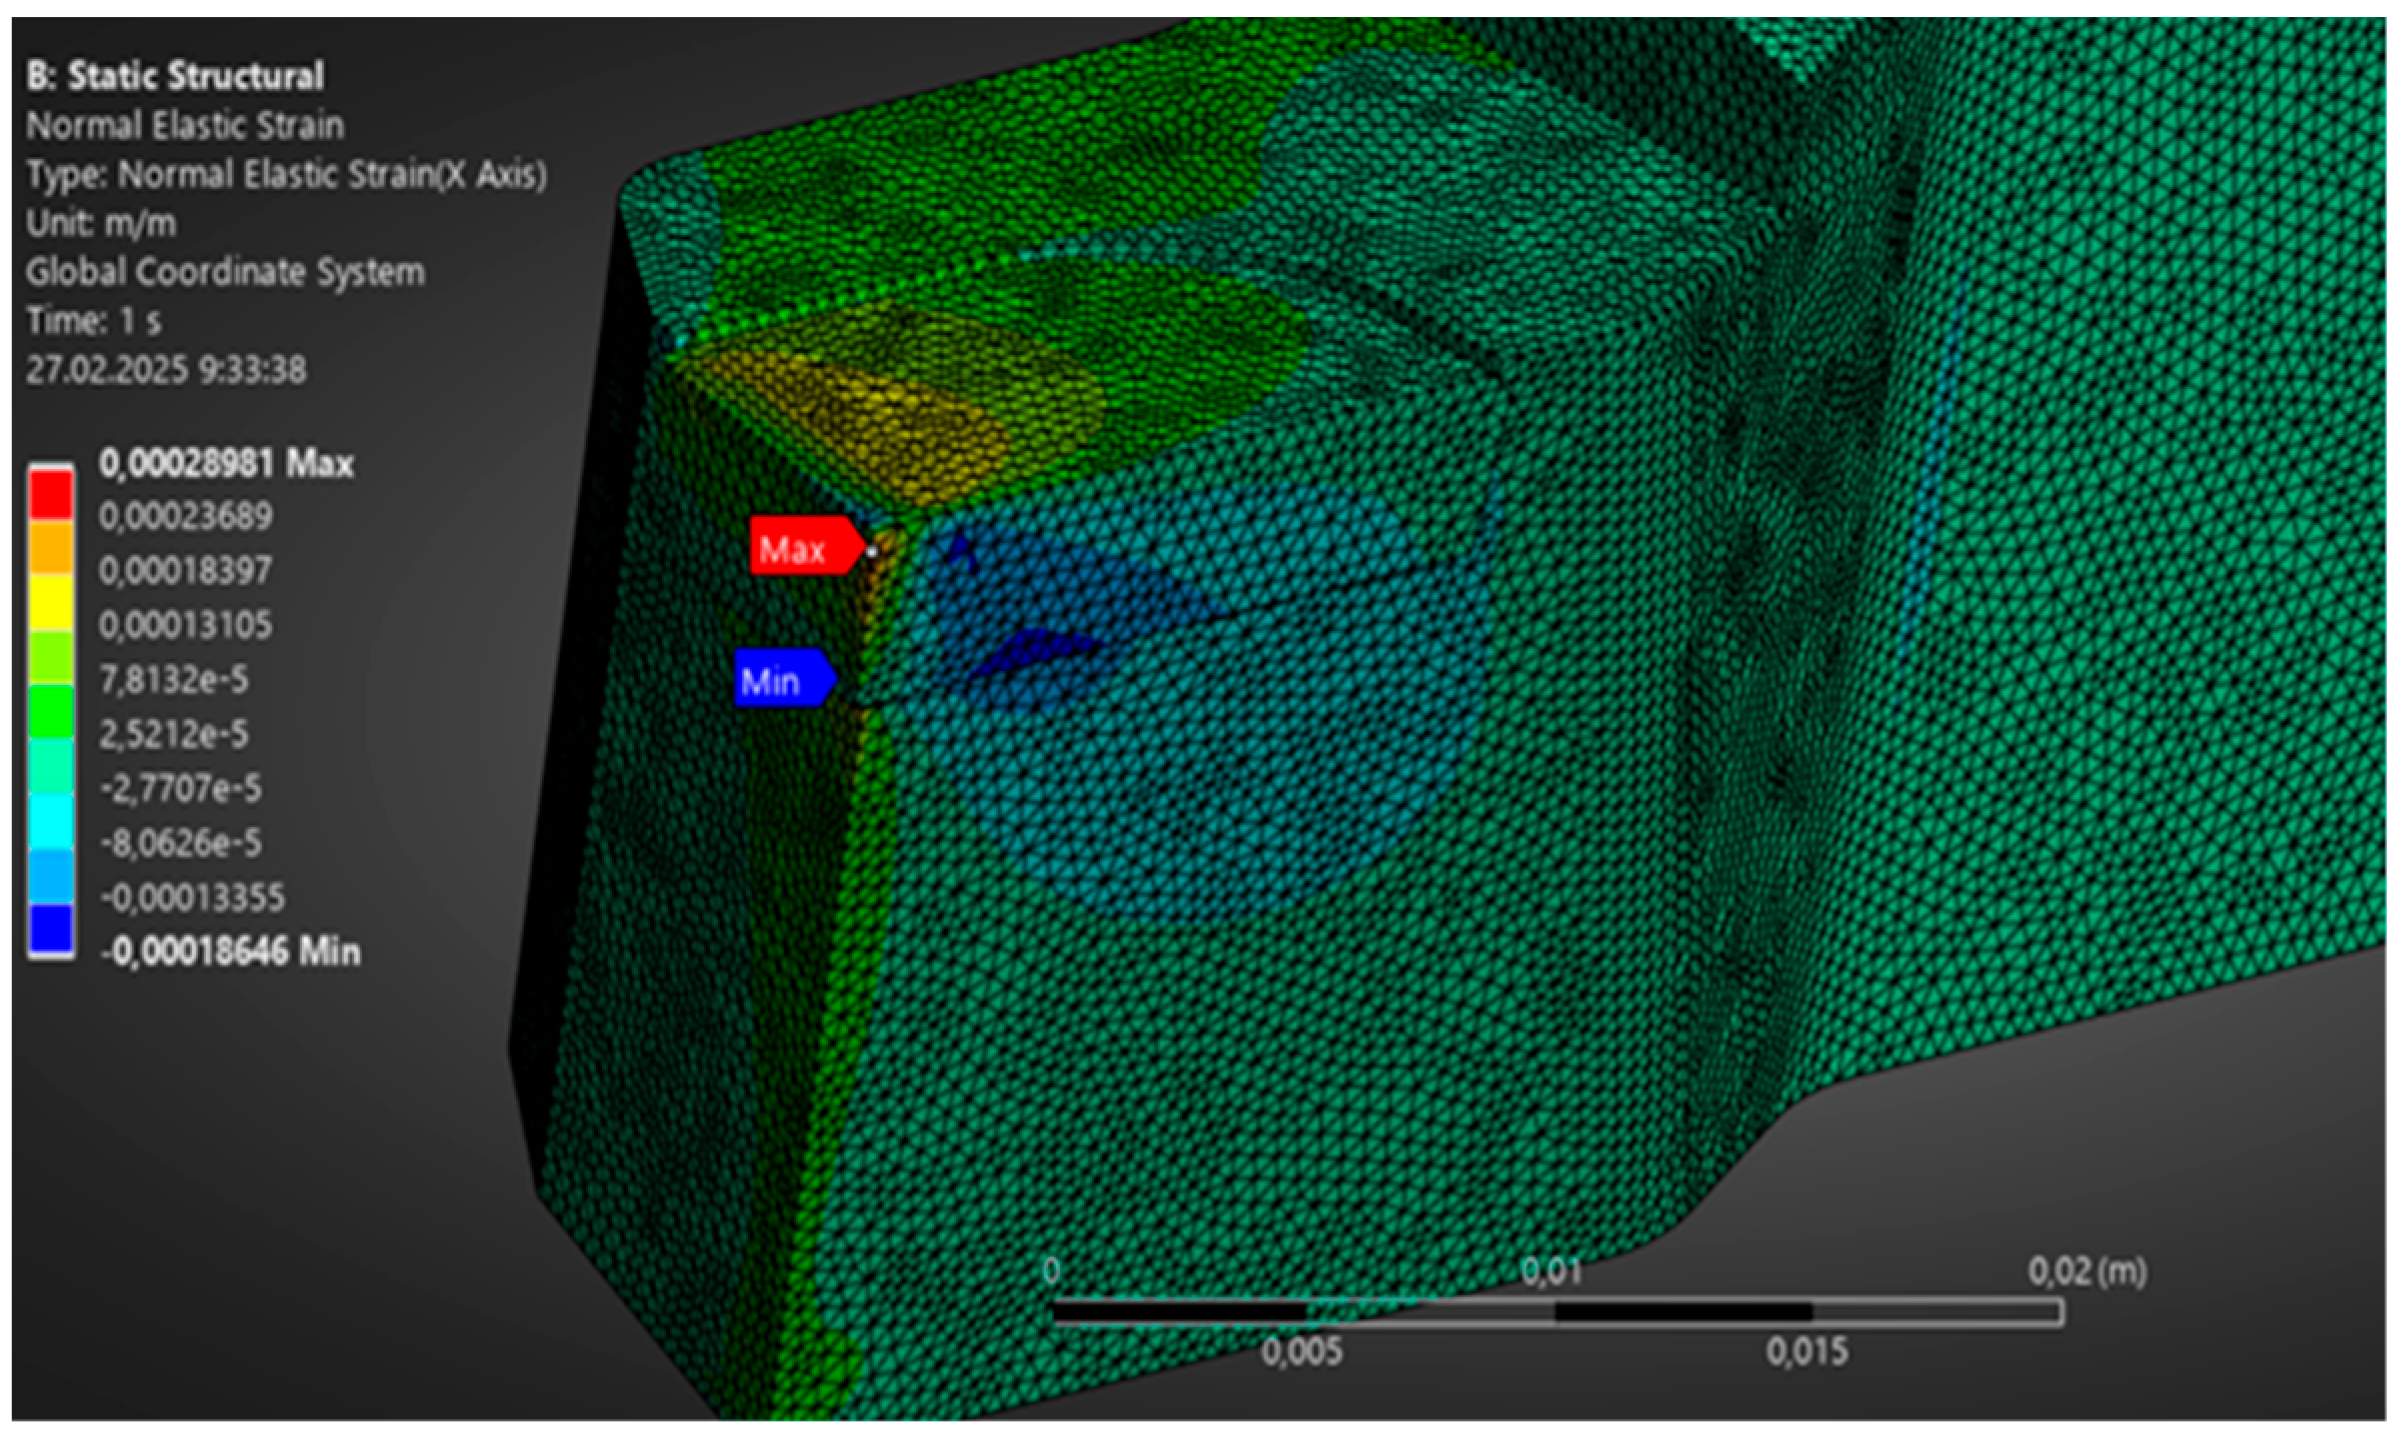
Solving the problem made it possible to obtain stress fields throughout the entire volume of the cutting plate of the cutter, as well as to estimate the values of deflections/deformations of the tool under load. The components of the stress–strain state are considered below in sequence: normal stresses, tangential stresses, equivalent stresses (stress intensity), and resulting deformations.
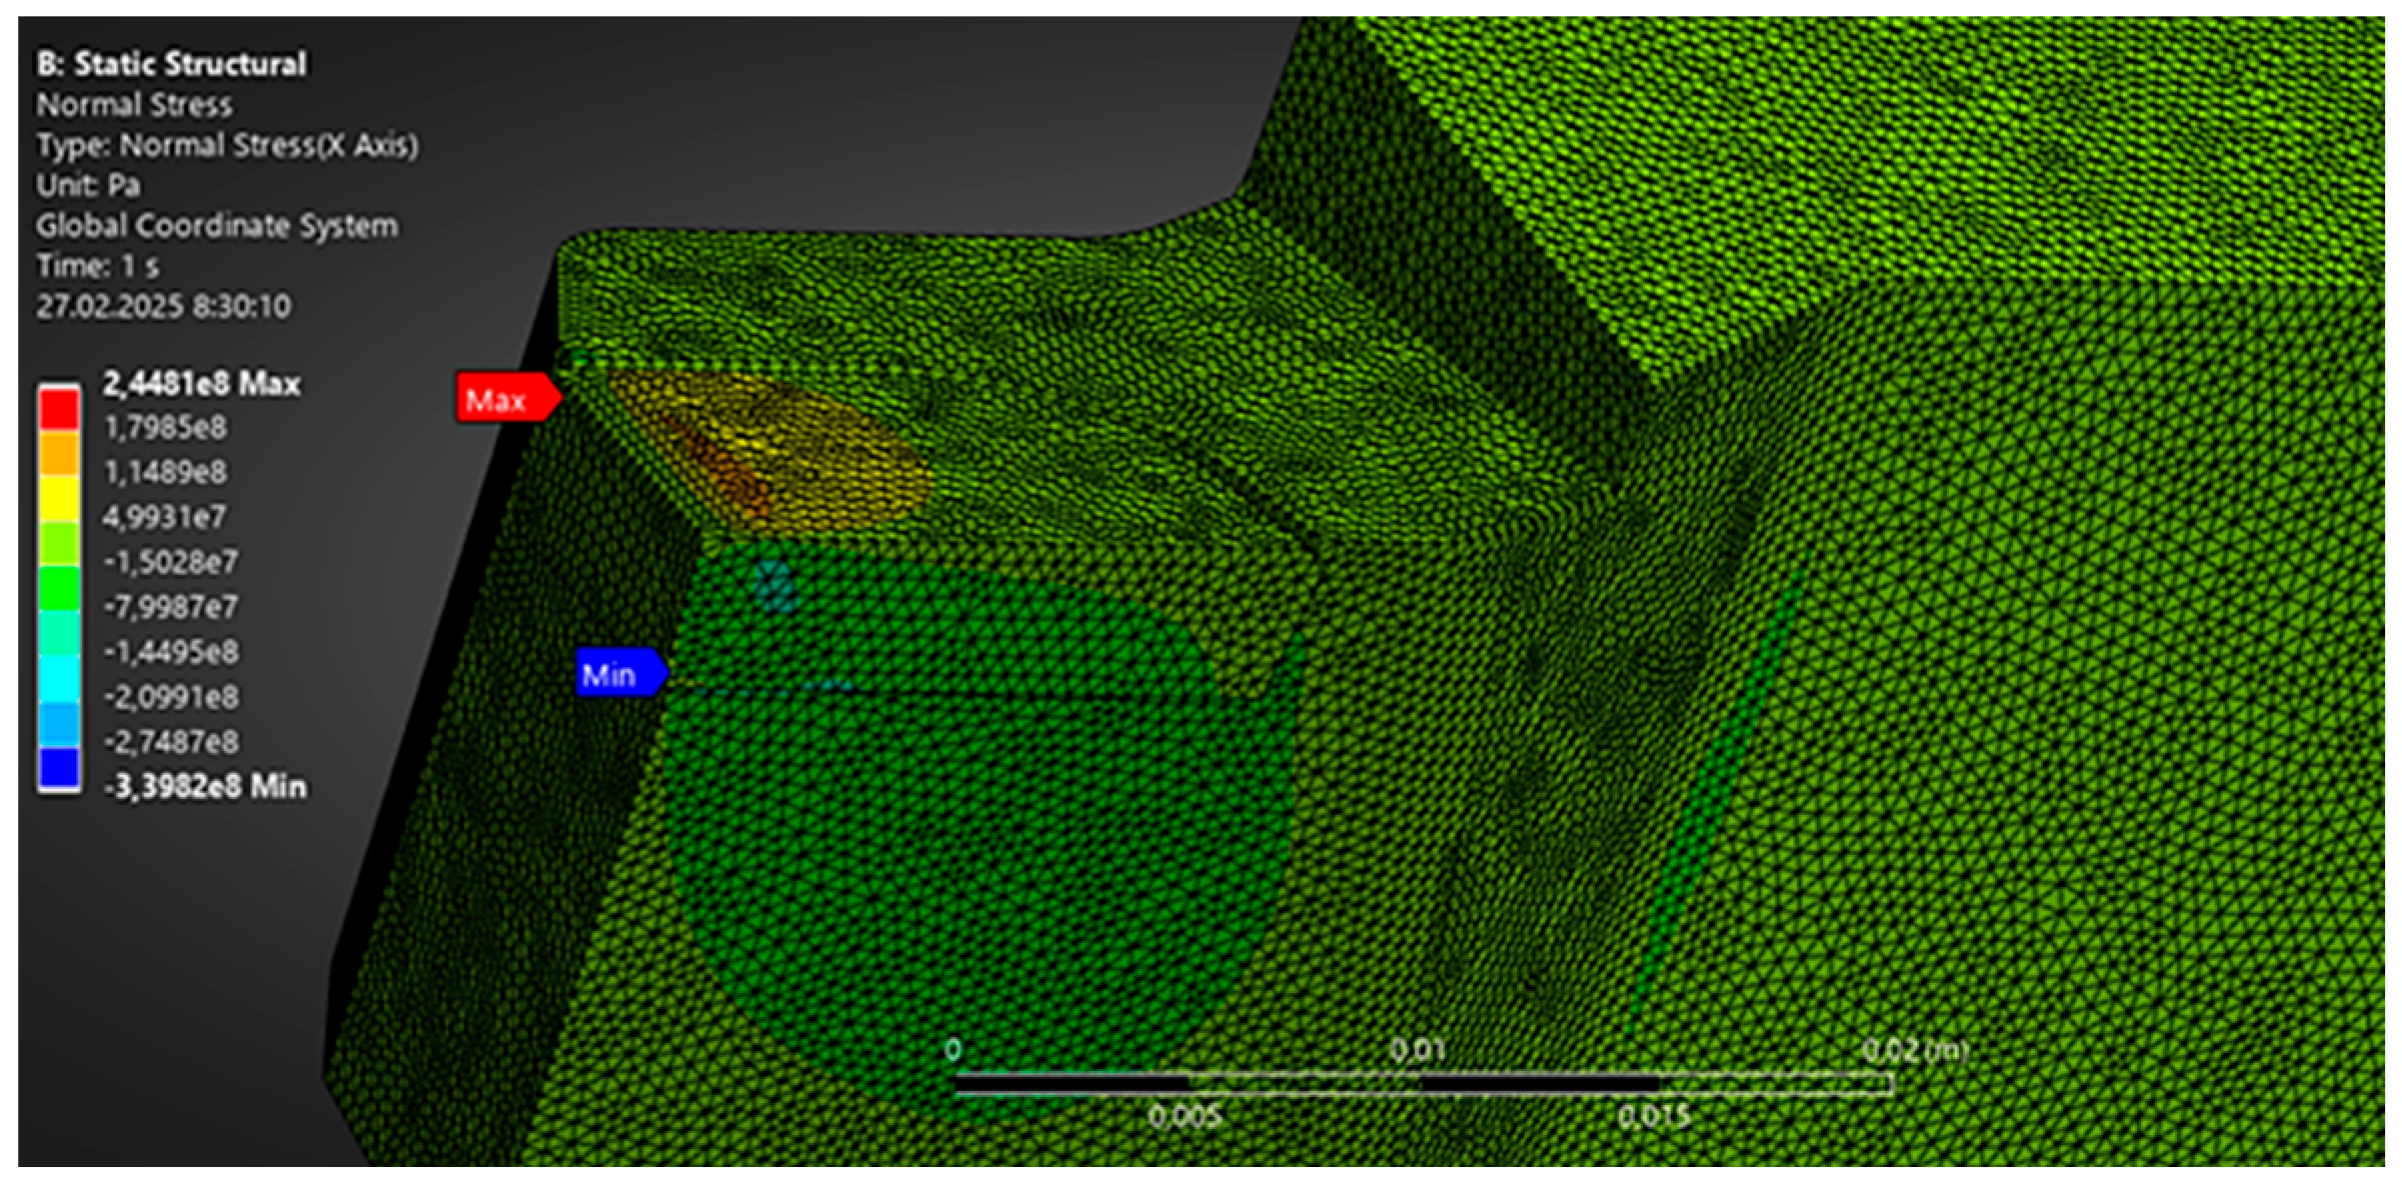
Figure 6,
Figure 7,
Figure 8 and
Figure 9 show visualizations of these distributions for PPC–60 wt% quartz, obtained in the ANSYS software environment.
Normal stresses.
Figure 6 shows the field of normal stresses σ in the cutting plate. According to the results, the maximum normal stresses (in terms of modulus) are observed in the area where the front surface and the rear surface adjoin at the cutting edge itself, where the load from the chips and the machined part is concentrated. Numerically, the maximum ¬¬σmax reaches about 245 MPa and has a “+” sign, which corresponds to tensile stress (probably, local tension occurs near the transition edge of the front surface to the edge). At the same time, high negative values of −340 MPa appear in the adjacent area, which corresponds to high compressive stresses directly under the loaded zone.
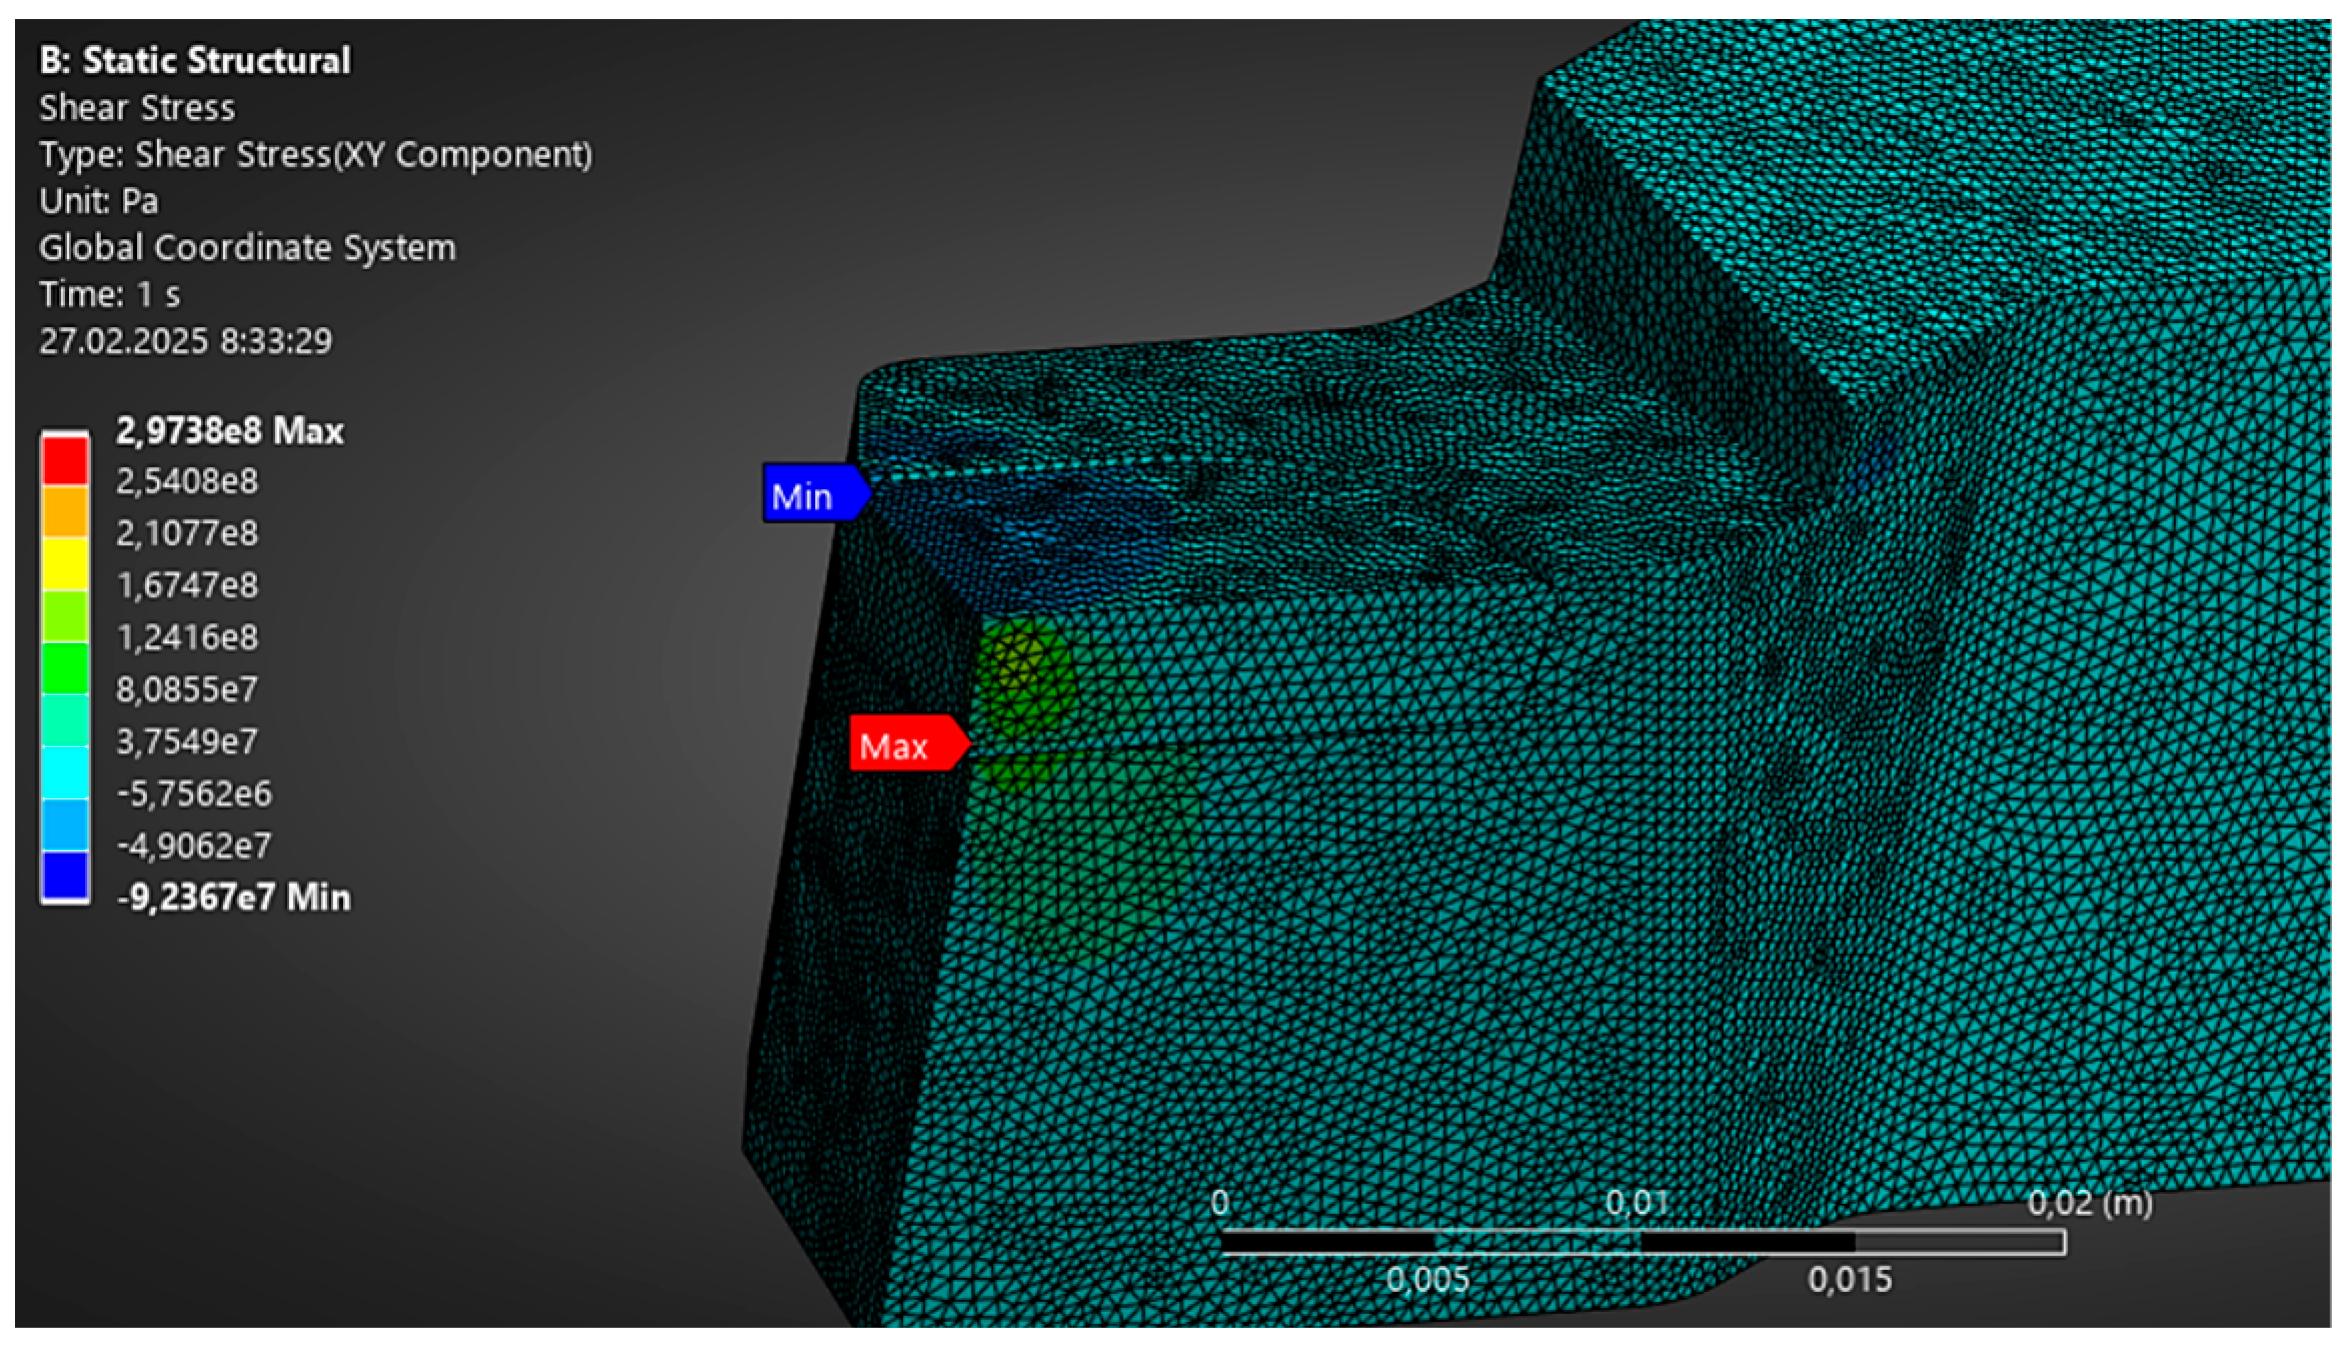
As expected, the maximum tangential stresses, as shown in
Figure 7, are localized in the contact zone on the rake face at the cutting edge [
24]. This figure illustrates how shear stresses are concentrated along the tool–chip interface, reflecting the main area of frictional interaction during cutting. The calculations indicate that the maximum value of τ
max is approximately 297 MPa in this area. This level of ~300 MPa does not exceed the strength characteristics of the alloy: it represents about 20% of the compressive strength and is roughly half of the bending strength.
The region of high tangential stresses is similar in size to that of the normal stresses—within approximately 1–2 mm from the edge—beyond which τ gradually decreases to near zero deeper inside the insert. On the flank face of the cutter, the tangential stresses are significantly lower, concentrated mainly at the very edge up to ~100 MPa and rapidly decaying further down the rear surface.
To evaluate the strength of a material under a complex triaxial stress state, the equivalent stress according to the Huber–Mises energy theory is often used [
45].
Figure 8 shows the distribution of the equivalent (von Mises) stress in the cutting insert. This parameter reduces the complex stress state to a single scalar value equivalent in effect to some conditional uniaxial stress [
46]. The maximum σeq in the model is ~812 MPa. This maximum stress intensity occurs in the plate material at the cutting edge itself, just below the surface (within the first few hundred microns from the edge angle). The obtained value can be compared with the strength characteristics of the alloy: the bending strength of T15K6 is 1400–1600 MPa; therefore, the maximum equivalent stress is ~50–60% of this limit. According to the Mises criterion for plastic materials, this would mean a safety factor of ~2. However, for a hard alloy, the Mises criterion is not entirely correct (the alloy is brittle), so it is better to compare the stress components with the maximum permissible values. Nevertheless, as an estimate, the equivalent stress of 812 MPa is significantly lower than the strength characteristics, including the compressive strength of 4000 MPa, so it can be expected that the static strength of the tool will not be compromised.
Despite the high stresses, the absolute values of elastic deformations in the carbide remain very small due to its high modulus of elasticity.
Figure 9 shows the resulting displacement field (total deformation) in the cutting insert, expressed in millimeters. The maximum tool deflection was only approximately 0.24 µm—such a small value is due to both the rigidity of the material and the relatively low cutting forces assumed in the calculations. The maximum displacements are observed at the tip of the cutting edge. Thus, it can be concluded that during the elastic stage of deformation, the tool in question exhibits virtually no deflection—its elastic compliance is very low.
The stress–strain state of the cutter during the turning of each composite was assessed based on the contact loads on the front and rear surfaces of the tool. As the quartz content in the composite increases, the load on the tool steadily increases. This is due to the increase in the strength and hardness of the material being machined—greater force is required to cut a more rigid and abrasive composite. In addition, an increase in the friction coefficient leads to an increase in the proportion of the tangential force F, which puts additional load on the tool.
To verify the validity of the FEM results, a full-scale experiment was conducted machining sand–polymer composite samples under the same conditions. Stresses were determined using Davidenkov’s method. The resulting tool stresses after the experiment are presented in
Table 6.
From the analysis of the obtained data, it is clear that the deviation of the experimental data of the FEM was 3–5% and therefore the FEM analysis can be trusted.
The maximum equivalent stresses σeq in the T15K6 cutting insert during turning of the composites under consideration range from 520 MPa for 30% quartz to 1050 MPa for 85% quartz. The stress increases almost linearly with increasing elastic modulus and quartz content in the composite.
Figure 10 shows a graph of σeq versus quartz content.
4. Discussion
The finite-element simulations demonstrate a pronounced concentration of equivalent stresses at the cutting edge of the T15K6 insert. This concentration is a direct consequence of the local contact mechanics: the cutting edge simultaneously supports the compressive reaction from the chip side and frictional/shear tractions from the workpiece side, producing a highly non-uniform, triaxial stress state in a small volume adjacent to the edge. The high stress gradients and triaxiality promote local plasticity, micro-cracking and, under repeated loading, fatigue damage accumulation—mechanisms known to initiate the two dominant wear types observed experimentally for particulate and mineral-filled polymer composites: crater wear on the rake (front) face and abrasive flank (rear) wear at the edge. This spatial correlation between maximum σeq and observed wear zones confirms that the computed stress-field correctly identifies the tool locations most susceptible to progressive loss of geometry and strength.
The mechanical origin of the observed linear dependence between maximum equivalent stress and quartz content can be traced to the macroscopic stiffening of the workpiece as quartz fraction increases: with more hard filler the composite’s effective elastic modulus and hardness grow, so the same cutting kinematics produce larger contact reaction forces transferred to the tool. In the studied interval (C
quartz = 30–85%, E
eff ≈ 3–8 GPa), this increase is essentially proportional and well described by the linear regression obtained from the simulations:
where σ
eq is the maximum equivalent stress in MPa; C
quarz is the mass fraction of quartz in the composite in percent (%).
For example, at Cquartz = 60% the formula gives σeq ≈ 808 MPa, in excellent agreement with the simulated value ~812 MPa. The quasi-linear behavior in the examined range is consistent with micromechanical expectations for particulate composites where the effective modulus follows approximately monotonic trends with filler fraction and where particle distribution is relatively uniform. Micromechanics and homogenization models predict similar monotonic increases in modulus with filler content and justify using a linear approximation for engineering-level estimates in a limited composition window.
Published studies on particle-reinforced composites and tool wear support the two key messages of our work:
(1) Increasing hard-particle content raises the workpiece stiffness/hardness and thus the cutting loads and tool stresses.
(2) Tool wear mechanisms in such systems are dominated by abrasive action and impact micro-chipping as particle fraction and particle size grow. Recent reviews and experimental investigations on SiC-particle and other hard-particle composites report that both cutting force and tool wear rate increase with reinforcement volume fraction and particle size, and that tool damage modes shift toward more severe abrasive/chipping mechanisms at high particle loadings.
Mechanistic models of abrasive wear in composites further explain the observed trends: physically based models indicate that the wear interaction depends on the relative properties and exposure of hard particles and that there can be regimes (depending on particle fraction, particle size and interparticle spacing) where wear behavior changes qualitatively. In particular, several studies indicate that at very high filler loadings, a threshold-like change in surface response (and consequently tool interaction) may occur because of particle clustering, reduced matrix cushioning and direct particle–particle contacts, which produce nonlinear increases in effective stiffness and in local impact/abrasion loads on the tool. This is consistent with our observation that linearity degrades outside the 30–85% range.
Finally, mineral-specific evidence (quartz being extremely hard and abrasive) shows that high quartz fractions greatly increase abrasivity in rock–metal contacts and machining contexts—a qualitative justification for the strong acceleration of abrasive wear when quartz content becomes dominant.
Practical conclusions and implications for tool life:
Meaning of the safety coefficient. The computed maximum equivalent stresses remain below the static strength limit of the T15K6 insert, so the calculated factor of safety (strength divided by maximum working stress) indicates that instantaneous, single-load fracture is unlikely under the simulated conditions. In practice this means that brittle fracture at first cut is not the primary failure mode; instead, progressive mechanisms (abrasive loss of edge geometry, chipping from particle impacts and fatigue accumulation from cyclic contacts) will determine operational lifetime.
Effect of high quartz fraction (>80%). A number of experimental reports in related fields show that above a high filler content (often observed empirically between ~80 and 87.5% in polymer/filler systems), wear behavior can change sharply: the matrix no longer cushions particles, particles protrude and bulk particle contacts dominate, producing much higher abrasion and a step-increase in material loss. Thus, even though static strength margins remain, tool life will shorten rapidly in the high-quartz regime due to accelerated abrasive and impact-fatigue wear. Practically, this implies stricter limits on cutting speeds, feed, and necessary tool maintenance intervals for composites with Cquartz > ~80%.
Design and process recommendations. To mitigate the concentrated stresses and slow wear progression we recommend the following:
- (a)
Adopting a controlled micro-chamfer or small edge radius (blunting the nominally perfectly sharp edge) to redistribute peak stresses over a larger volume—with the caveat that excessive bluntness increases cutting forces;
- (b)
Selecting wear-resistant tool materials/coatings to reduce adhesive/frictional contributions and to resist three-body abrasion;
- (c)
Optimizing cutting parameters (lower feed or cutting speed, use of cooling/lubrication where feasible) when machining composites with high quartz contents. Coatings and tool selection are known to markedly affect tool performance in abrasive composites and often extend practical tool life.
Model assumptions and limitations. The current SSS analysis uses simplifying assumptions that limit direct quantitative extrapolation beyond the tested range:
An idealized sharp cutting edge (no micro-chamfer or worn initial geometry);
Homogeneous, isotropic effective properties of the composite (no explicit particle size distribution, clustering, or interphase);
Constant friction coefficient along the contact surfaces;
Isothermal (no thermo-mechanical coupling) conditions;
Purely elastic tool behavior except where stress exceeds local yield criteria in post-processing. Each of these assumptions affects stress magnitude and distribution: for example, even a small micro-chamfer can reduce peak σeq by redistributing contact pressure, whereas strong thermal softening or frictional heating can increase local stresses and accelerate wear.
Future research directions. To address these limitations and improve predictive capability, we suggest the following (ranked by expected impact):
Explicit multi-scale modeling that resolves particle geometry, size distribution and interparticle contacts (to capture percolation/clustering effects at very high filler fractions).
Thermo-mechanical simulations including frictional heating and temperature-dependent material behavior.
Parametric SSS studies of edge geometry to quantify the trade-off between reduced peak stress and increased cutting forces.
Experimental validation across the full compositional range (especially above 80–90% quartz) to identify thresholds for the transition to particle-dominated contact regimes and to calibrate wear-rate laws for tool life forecasts.
Investigation of advanced tool materials/coatings under representative three-body abrasion and impact loading to develop best-practice tool selection guidelines for high-quartz sand–polymer composites.
Within the studied composition and elastic modulus window (Cquartz = 30–85%, Eeff ≈ 3–8 GPa), the nearly linear dependence of maximum equivalent stress on quartz content is a robust engineering approximation that links macroscopic stiffening to increased tool loading. Nevertheless, both modeling refinements and targeted experiments are required to capture the nonlinear, threshold-type behavior and the accelerated abrasive/fatigue wear that become dominant at very high quartz contents.
