Abstract
Infrared thermography non-destructive testing technology has been widely used in the defect detection of composite structures due to its advantages, including non-contact operation, rapidity, low cost, and high precision. In this study, a laser-line scanning system combined with an infrared thermography was developed, along with a corresponding dynamic sequence image reconstruction method, enabling rapid localization of surface damages. Then, high-precision quantitative characterization of defect morphology in reconstructed images was achieved by integrating an edge gradient detection algorithm. The reconstruction method was validated through finite element simulations and experimental studies. The results demonstrated that the laser-line scanning thermography effectively enables both rapid localization of surface damages and precise quantitative characterization of their morphology. Experimental measurements of ceramic materials indicate that the relative error in detecting crack width is about 6% when the crack is perpendicular to the scanning direction, and the relative error gradually increases when the angle between the crack and the scanning direction decreases. Additionally, an alumina ceramic plate with micrometer-width cracks is inspected by the continuous laser-line scanning thermography. The morphology detection results are completely consistent with the actual morphology. However, limited by the spatial resolution of the thermal imager in the experiment, the quantitative identification of the crack width cannot be carried out. Finally, the proposed method is also effective for detecting surface damage of wrinkles in ceramic matrix composites. It can localize damage and quantify its geometric features with an average relative error of less than 3%, providing a new approach for health monitoring of large-scale ceramic matrix composite structures.
1. Introduction
Ceramic matrix composites (CMCs) are a new type of thermal–structural functional integrated material that combines the performance advantages of metallic materials, ceramic materials, and carbon materials. They feature high specific strength, high temperature resistance, oxidation resistance, corrosion resistance, etc. [1], and can achieve multiple functions, such as thermal protection, load-bearing, and stealth [2]. Currently, they have been widely used in fields such as near-space hypersonic vehicles, hot-end components of aero-engines, combustion chambers of aerospace engines, and nozzles [3].
However, the preparation process of CMCs is complex, and defects are inevitable, which affect their performance and applications. For example, Preceramic Polymer Impregnation and Pyrolysis (PIP) is an important process for preparing CMCs. Its core principle is to use liquid preceramic polymers (such as polysilane, polycarbosilane, etc.) to impregnate fiber preforms, and then heat the preceramic polymers to undergo pyrolysis reaction, converting them into ceramic matrices, which combine with fibers to form composites. Usually, multiple preceramic impregnation, pyrolysis conversion, and high-temperature treatment (>1500 °C) are required to improve the density of the ceramic matrix. Since the volume shrinkage of the preceramic polymer during pyrolysis can reach 30–40%, various initial defects, such as surface-wrinkling defects, are easily generated. Although these defects are visible to the naked human eye, the inside fiber wrinkles or even fiber breakage is invisible. For example, the inside fiber breakage will significantly reduce the mechanical performance of CMCs and can even cause catastrophic accidents [4,5,6]. Therefore, carrying out research on defect identification and evaluation technology of CMCs has important scientific significance and national defense engineering significance.
There are destructive and non-destructive testing and evaluation (NDT&E) techniques. It is not only time-consuming and laborious but also costly to conduct the destructive NDT&E tests, such as mechanical tensile, to evaluate the strength of the CMCs with inside fiber wrinkles or even fiber breakage. Therefore, the non-destructive NDT&E technique is a preferred choice. The non-destructive NDT&E technique is a means of testing and evaluating materials without affecting their future use and maintainability [7,8]. Non-destructive testing methods for composites have become a current research hotspot [9]. Conventional non-destructive testing methods have limitations for CMCs. Ultrasonic testing suffers from significant attenuation in heterogeneous materials, low signal-to-noise ratio, surface detection blind zones, and insufficient sensitivity for small-sized defects [10]. X-ray testing is restricted by the incident angle, showing insensitivity to area-type defects (such as cracks and delaminations) perpendicular to the ray direction, resulting in poor detection performance and high costs [11]. Both non-destructive testing methods are hardly applicable to defect identification in CMCs. Infrared thermography (IRT), as an emerging non-destructive testing method, has attracted extensive attention due to its advantages of non-contact, large-area inspection, intuitive results, low cost, and real-time detection.
The principle of infrared thermography non-destructive testing is to determine the properties and status of an object by collecting and analyzing its infrared thermal radiation signals [12,13,14,15,16]. To improve the detection sensitivity of IRT, external excitation is usually applied to the tested object to amplify the thermal radiation difference between the defective and non-defective areas, thereby achieving defect detection. This method of applying external excitation is also called active infrared thermography. The current mainstream excitation methods include optical excitation [17], ultrasonic excitation [18,19], and eddy current excitation [20,21]. Optical excitation is further divided into pulsed [22], lock-in [23,24], and thermal wave radar modes [25,26]. Pulsed excitation is fast and efficient, and it provides intuitive results, but it has insufficient contrast and sensitivity. Lock-in and thermal wave radar modes have higher accuracy and sensitivity, but they are mainly used for internal defect detection and have low detection efficiency. The ultrasonic excitation method offers high thermal contrast and detection sensitivity, but as a contact excitation method, it requires a couplant. The eddy current excitation method balances detection accuracy and efficiency but is only suitable for conductive materials. All the above mainstream excitation methods have their respective limitations and struggle to meet the diverse needs of surface damage detection in composite materials. Therefore, further development and research on excitation methods are required.
Laser-line scanning excitation is a non-contact optical excitation method, whose principle is to use a narrow laser line to perform concentrated excitation on a local area. The temperature fields on both sides of the laser line exhibit a near-Gaussian distribution, with more concentrated energy near the center of the heat source. As the distance from the center increases, the temperature drops rapidly, presenting a certain temperature gradient. This indicates that the heat flow of the linear laser source propagates not only in the depth direction but also along the surface. This heat flow propagation model is more conducive to high-precision detection of surface cracks. As early as 2011, Almond et al. [27] discovered that cracks affect the temperature field distribution around the laser line and proposed using linear heat sources for surface crack identification. He et al. [28] developed a surface temperature gradient characterization method, successfully applying linear laser thermography to locate surface cracks in different regions of metallic materials. Jiao et al. [29] proposed a laser scanning thermography method to identify cracks with a surface width of more than 20 μm in thermal barrier-coating structures. When researching surface cracks in cylindrical structures, Liu et al. [30] developed a signal enhancement method based on laser-line scanning that considers the phase shift characteristics of surface waves on cylindrical surfaces, enabling the localization of surface cracks on cylinders. Based on laser-line thermography, Qiu et al. [31] proposed an inversion analysis scheme using a conjugate gradient optimization algorithm to reconstruct the internal contour shape of fatigue cracks. Wang et al. [32] developed a linear laser scanning and tracking technique, which was successfully used to identify the angles of surface cracks in carbon fiber-reinforced composites. He et al. [33] proposed a combined scanning laser thermography method, achieving high-precision reconstruction of sequential images under scanning excitation by considering scanning speed and sampling frequency. Suh et al. [34] combined linear laser thermography with neural networks to achieve automatic localization of surface damage. Based on laser thermography, He et al. [35,36] developed a fatigue crack-tip localization method using Prewitt edge detection and proposed a new parameter for crack-opening temperature gradient to characterize crack closure effects, along with its testing theory. Li et al. proposed a laser scanning thermography combined with a corresponding data-processing algorithm for defect detection in composites [37,38].
Previous studies indicate that the laser-line scanning thermography method holds enormous application potential in crack localization and morphology identification. However, the accuracy of commonly used laser-line scanning thermography needs to be improved when large CMCs with various defects are inspected and result in limited resolution of the thermal images. Therefore, there is an urgent need to develop laser scanning infrared imaging methods and technologies for the highly accurate detection of defects in CMCs.
This paper proposes a continuous laser-line scanning thermography excitation and data processing method to accurately identify defect morphology. First, an excitation model for laser continuous line scanning is proposed, and a corresponding dynamic sequence image reconstruction method is established. Then, finite element simulation and experiments are used to achieve rapid localization of surface defects on ceramic plates, and edge gradient detection is applied to quantitatively identify defects at different angles. Finally, the proposed continuous line scanning excitation and reconstruction method is applied to the actual detection of ceramic matrix composites, verifying the effectiveness and high precision of the method.
2. Methodology
Figure 1 shows a schematic diagram of a continuous laser-line scanning thermography system. The continuous laser-line scanning system mainly includes three parts: the excitation system, the infrared image acquisition system, and the motion system. The excitation system is composed of a laser controller, a laser emitter, and an optical prism. The laser controller can set the laser energy level, excitation time, and excitation waveform. Then, the laser beam is emitted from the laser emitter through an optical cable and converted into a Gaussian-like distributed linear laser heat source via a customized optical lens. The infrared image acquisition system includes an infrared thermal imager, a control computer, and a data acquisition card. The excitation system and the infrared image acquisition system are linked through the data acquisition card to achieve synchronous triggering of excitation and image acquisition, ensuring the integrity of the sequence images collected in the experiment. The motion system includes a programmable control stepper motor and a detachable platform, which can flexibly select the scanning method according to the specimen size: for standard plate-shaped specimens (such as the ceramic plate in this paper), the specimen is fixed on the stepper motor using a fixture, and the stepper motor is controlled by a program to drive the specimen to move uniformly through the fixed laser line and the thermal imager’s field of view; for some large and complex structures in actual engineering, the specimen can be kept stationary, and the stepper motor can drive the laser line and the thermal imager as a whole to move, achieving large-area continuous scanning. Compared with the scanning mode in traditional methods where the laser line is moved by rotating lenses, this modular design based on relative motion not only retains the convenience of detecting small specimens but also avoids the excessive requirements for the stepper motor load and platform accuracy caused by moving large specimens by adjusting the moving subject. This improves engineering applicability and is more conducive to achieving continuous detection over large areas. As shown in Figure 1, the temperature distribution on the surface of the plate can be expressed as follows [28,37]:
where q is the rate of heat emitted per unit length (W/m); k is the thermal conductivity (W·K−1·m−1); α represents the thermal diffusivity (m2/s); and ρ and c are the density (kg/m3) and specific heat capacity (J·kg−1·K−1) respectively. K0(x) is a modified Bessel function of the second type of order zero. The above formula can only solve the surface thermal distribution of defect-free plates. For the line-scan surface thermal distribution of plates with defects, it needs to be solved through finite element simulation.
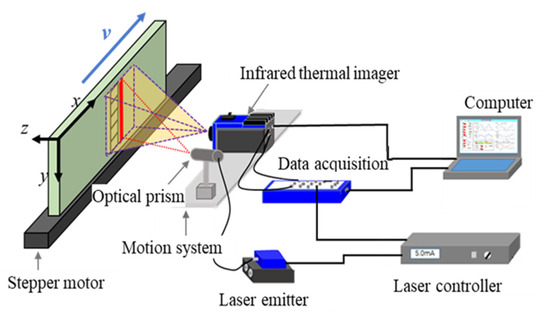
Figure 1.
Schematic of continuous laser-line scanning system.
For the dynamic thermal sequence images obtained by the continuous laser-line scanning thermography method, the temperature information of the entire specimen surface can be reconstructed by extracting key pixel columns from each frame of the sequence images. The principle is shown in Figure 2. The pixel column used for reconstruction is selected from a column of pixels parallel to the laser line within the field of view of the thermal imager in Figure 1. The width of this pixel column is 1 pixel, and its relative position to the laser line remains unchanged, with its x-axis coordinate denoted as xi. It is assumed that one side of the tested specimen is located at the xi position in the initial first frame. During the scanning process, the specimen moves at a constant speed along the x-coordinate direction until it completely passes through the pixel column used for reconstruction: the other side of the specimen is located at the xi position in the n-th frame. The moment of the first frame is denoted as t1, the second frame as t2, and so on, with the n-th frame denoted as tn. The temperature data on the pixel column xi in the first frame is denoted as , which is regarded as the first column of the reconstructed image and denoted as . By analogy, the last column of the reconstructed image is composed of the temperature data on the pixel column xi in the n-th frame. The pixel columns, , extracted from each frame of the image can be regarded as the result of uniform excitation by a linear heat source with consistent heat. In this way, the reconstructed image is equivalent to the temperature distribution image of the entire specimen surface after uniform excitation. This reconstruction method only requires extracting one column of pixels from each frame of the image, compressing key information into a single reconstructed image, achieving data dimensionality reduction and significantly improving post-processing speed.
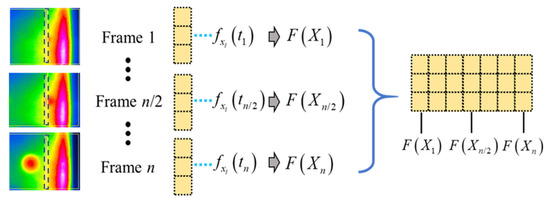
Figure 2.
Principle of sequence image reconstruction for continuous laser-line scanning thermography.
When the laser performs line scanning, the thermal resistance of the crack causes a temperature difference between the two sides of the crack, which is the basic principle for realizing the quantitative detection of crack geometric parameters. The temperature difference between the two sides of the crack is affected not only by experimental parameters such as excitation power, material parameters, and heat source distance, but also by geometric parameters of the crack itself, such as its width and depth. For cracks with a specific depth, the quantitative detection of their width and length can be achieved through thermal resistance analysis.
The boundaries of surface cracks are detected using the edge gradient detection method, utilizing the mutation characteristics of gray values at defect edges in the spatial dimension [34,39,40]. Taking the most basic Sobel operator as an example, the Sobel operator uses two 3 × 3 convolution kernels, which are respectively used to detect vertical edges and horizontal edges. The convolution operator templates in the vertical direction and horizontal direction are as follows:
where the edge intensity, G, can be expressed as
In the infrared thermography defect detection method, edge gradient detection can be used to identify edge pixels in the image. By linking all edges together, the required defect boundaries can be formed. The edge gradient detection method can effectively extract defect boundaries and has good noise-suppression effects, making it an important means to achieve quantitative defect detection. This study will realize quantitative characterization of crack morphology based on the edge gradient detection algorithm.
3. Simulation and Validation
A ceramic-plate model with a titled crack is established based on the finite element software Abaqus, as shown in Figure 3. The model has the dimensions 50 mm × 50 mm × 5 mm (thickness is of 5 mm), and the crack length, opening width, and depth are 10 mm, 0.2 mm, and 1 mm, respectively. The boundary condition is an adiabatic environment. The initial temperature of the sample is 25 °C. The convection coefficient is 1 W/(m2·K). In terms of load settings, a Fortran subroutine is used to generate a moving linear heat source perpendicular to the x-direction. The heat source has a size of 50 mm × 4 mm, a uniform distribution heat flux density of 5000 W/m2, and a scanning speed of 5 mm/s. The material parameters are shown in Table 1, where the crack area is assigned material parameters of air to simulate defect characteristics.
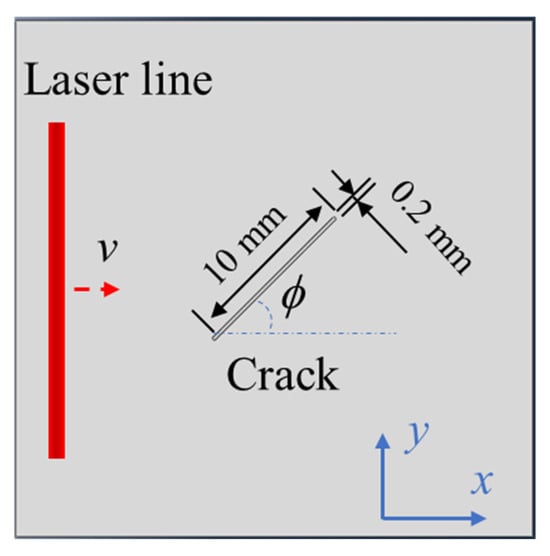
Figure 3.
Finite element model of a ceramic plate containing crack with an angle of ϕ. The red arrow indicates the moving direction of the laser line.

Table 1.
Parameters of the finite element model for ceramic plate.
The analysis step is transient heat transfer, with a time increment step of 0.02 s and a maximum number of increment steps of 750, fully covering 10 s of the scanning process and 5 s of the cooling stage. The element type is an eight-node linear heat transfer hexahedral element (DC3D8), and the global seed point density in the mesh division is set to 0.005 mm. The finite element model undergoes repeated validation by adjusting grid size to ensure it is mesh-independent prior to result output. Furthermore, the time step is also justified based on thermal diffusion time scales and scanning speed.
Figure 4 presents the surface temperature field distribution during the heat source scanning process with ϕ = 90° and the results of dynamic reconstruction. As shown in Figure 4a, when the linear heat source sweeps across the crack area, heat accumulates at the crack due to its lower thermal conductivity compared to the matrix material, forming a clearly distinguishable thermal contrast region. Figure 4b shows the results of dynamic sequence reconstruction, where the pixels used for reconstruction are located at the center of the heat source. The reconstruction results indicate that the dynamic sequence image reconstruction method can accurately identify the location information of surface cracks and effectively restore their geometric-shape features. Figure 4c displays the results of the reconstructed image after edge gradient detection processing. By approximating the crack as a rectangle and automatically identifying the pixel values of the long and short sides in the binarized image, quantitative detection of defects is achieved. It can be seen from Figure 4c that the recognition result of the long side of the crack is 10 mm, and that of the short side is 0.2 mm, which is completely consistent with the preset geometric parameters, successfully verifying the effectiveness of the edge gradient detection method in the quantitative characterization of crack morphology.
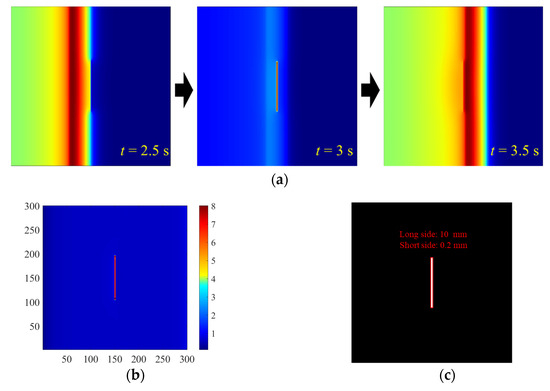
Figure 4.
Detection of crack morphography when ϕ = 90°: (a) Distribution of surface temperature field at scanning times of t = 2.5 s, 3 s, and 3.5 s. (b) Reconstructed images. (c) Edge gradient detection result.
Figure 5 shows the finite element calculation results when ϕ = 45°. From the temperature field distribution shown in Figure 5a, it can be seen that the thermal contrast characteristics can still be clearly and intuitively observed when the linear heat source scans to the crack area. The dynamic sequence reconstruction results in Figure 5b indicate that the change in crack angle affects the surface temperature distribution characteristics, but the reconstruction method can still effectively restore the location and morphology of the crack. Figure 5c shows the edge gradient detection results. The crack length and width are 10.5 mm and 0.2 mm, respectively. Figure 6 shows the finite element calculation results when ϕ = 0°. Figure 6a shows the temperature field distribution at a scanning time of t = 2 s. Figure 6b indicates the dynamic sequence reconstruction results, which effectively restore the location and morphology of the crack. Figure 6c shows the edge gradient detection results. The crack length and width are 9.6 mm and 0.2 mm, respectively. There is approximately a 5% relative error in the identification of the crack length. One of the reasons for the relative error may be the difference in heat conduction distribution caused by the change in crack angle. From the principle of heat conduction, when the laser line moves along the x-axis direction, the heat flow propagates perpendicularly to the scanning direction. For the 90° crack, its direction is completely perpendicular to the heat flow direction. At this time, the heat flow forms a strong reflection and accumulation effect at the crack boundary, and the temperature gradient on both sides of the crack shows obvious step characteristics perpendicular to the scanning direction, providing a clear geometric boundary for edge detection. For the oblique crack, because the crack direction intersects obliquely with the heat flow direction, part of the heat flow is refracted and scattered along the crack interface, forming lateral diffusion along the crack direction during propagation. This transforms the temperature gradient distribution at the crack edge from a vertical step to an oblique gradual change, weakening the gradient mutation signal required by the edge detection algorithm and causing edge blur, thus affecting the accuracy of gradient detection. Overall, the method combining dynamic sequence reconstruction and edge gradient extraction can effectively restore the location and shape of cracks at different angles, while achieving quantitative detection of crack morphology.

Figure 5.
Detection of crack morphography when ϕ = 45°: (a) Distribution of the surface temperature field at scanning time of t = 2 s. (b) Reconstructed image. (c) Edge gradient detection result.

Figure 6.
Detection of crack morphography when ϕ = 0°: (a) Distribution of the surface temperature field at scanning time of t = 2 s. (b) Reconstructed image. (c) Edge gradient detection result.
It should be pointed out that one of advantages of the current continuous laser-line scanning thermography is that the morphography identification of surface cracks is independent of crack depth. The crack depth was not set to 1 mm in the simulation. If the crack depth was set to, for example, 1.5 mm, although the magnitude of temperature would change, the qualitative temperature distribution would remain almost same. As a result, the morphography identification of surface cracks can still be realized by sequence image reconstruction of the continuous laser-line scanning thermography and subsequent edge gradient detection method.
4. Experiments
4.1. Experimental Setup
The whole experimental platform was made up of three fundamental modules: a real-time image-capturing setup, a laser activation setup, and a movement mechanism, as shown in Figure 7. The real-time image-capturing setup was composed of an infrared (IR) camera (VarioCAM HD, produced by InfraTec, Dresden, Germany), and a computer. The IR camera, featuring high sensitivity, was equipped with an uncooled microbolometer focal plane array detector. This detector has a spectral response range of 7.5–14 μm, allowing the camera to capture thermal images. The specific parameters of the thermal images were as follows: a frame rate of 30 Hz, an image resolution of 1024 × 768 pixels, a temperature resolution of 0.05 K, and a measurement accuracy of ±1.5 %. The laser activation setup consisted of three key parts: a continuous-wave fiber-coupled near-infrared diode laser (model specifications: 45 W power and 808 nm wavelength, manufactured by Jenoptik, Germany), a laser controller (produced by OsTech, Germany), and a linear lens (Beijing, China). The laser controller is capable of maintaining stable and consistent output of activation signals by regulating the current. After these signals are emitted from the laser head, they pass through a tailor-made linear lens, which converts them into a line-scanning heat source. The energy distribution of this heat source is similar to that of a Gaussian distribution, and the power of the laser controller was set to 45 W during the experiment. The movement mechanism was a programmable stepper motor (Daheng, Beijing, China), whose main function was to achieve translational motion at a constant speed. In the experimental process, the linear laser and the thermal imaging camera were kept fixed, without any movement. Instead, the test samples were mounted on the stepper motor, which drove the samples to move at a constant speed. Additionally, the distance between the IR camera and the test samples was roughly 0.6 m. At this distance, the observation window used to monitor the samples had a pixel size of 600 × 250.
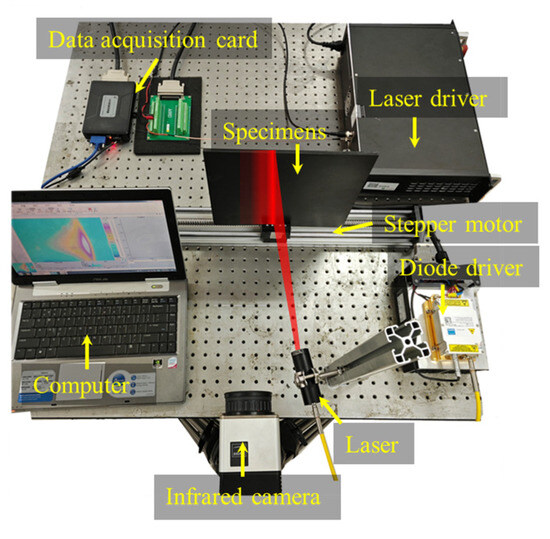
Figure 7.
Photo of experimental setup.
4.2. Ceramic Plate with Surface Cracks
The test specimen is an alumina ceramic plate that has a dimension of 50 mm × 50 mm × 5 mm (thickness is of 5 mm). Two cracks were prefabricated on the surface using mechanical cutting. Among them, Crack-1 has a length of 29 mm, a maximum width of 1.95 mm, a minimum width of 1.35 mm, and an average width of 1.63 mm; and Crack-2 has a length of 23 mm, a maximum width of 1.55 mm, a minimum width of 1.45 mm, and an average width of 1.5 mm, as shown in Figure 8. To improve the thermal emissivity during the experiment, the surface of the specimen was treated with a black spray. The experimental parameters were set as follows: laser power at 45 W; specimen moving speed at 6 mm/s; infrared thermal imager sampling frequency at 30 Hz; thermal image resolution at 1024 pixels × 768 pixels; and 1 pixel in the thermal imager’s field of view, corresponding to 0.15 mm.
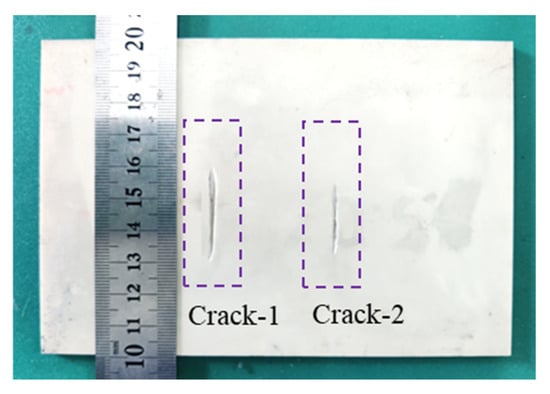
Figure 8.
Ceramic-plate specimen with surface cracks.
Figure 9a presents the results of edge gradient detection on the reconstructed images of cracks when ϕ = 90°. To distinguish the damage, the reconstructed images were filtered for noise reduction before temperature gradient reconstruction. Table 2 lists the width-measurement results and relative errors of Crack-1 and Crack-2 when ϕ = 90°. It should be pointed out that the crack has an irregular shape due to processing errors, and the width measurements are divided into the maximum width, the minimum width, and average width for a more refined analysis of the width. As for Crack-1, the relative measurement error of the maximum crack width is 5.13%, the relative error of the minimum width is 7.41%, and the relative error of the average width is 6.13%. As for Crack-2, the relative measurement error of the maximum crack width is 5.81%, the relative error of the minimum width is 7.59%, and the relative error of the average width is 6.00%. Overall, the relative error of the width measurement is about 6% when the scanning line is perpendicular to the crack (ϕ = 90°).
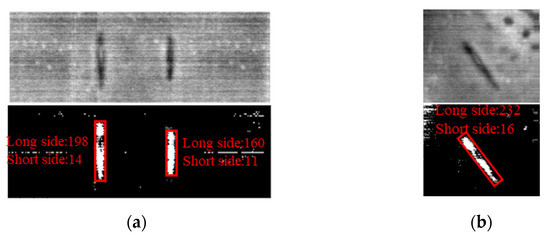
Figure 9.
Reconstruction results of cracks with different angles: (a) 90° and (b) 45°.

Table 2.
Measurement results and relative errors of Crack-1 and Crack-2 when ϕ = 90°.
Figure 9b presents the results of edge gradient detection on the reconstructed image of Crack-2 when ϕ = 45°. The relative measurement error of the maximum crack width is 7.10%, the relative error of the minimum width is 9.66%, and the relative error of the average width is 9.33%, as listed in Table 3. Overall, the relative error of the width measurement is about 9% when the scanning line is titled to the crack with ϕ = 45°. It demonstrates that the detection error is the smallest when the scanning line is perpendicular to the crack. As the crack angle deviates, the heat flow transmission path changes, making the temperature-field characteristics and edge morphology more complex, thus increasing the detection error.

Table 3.
Measurement results and relative errors of Crack-2 when ϕ = 45°.
The above measurements were conducted at least five times, and the repeated measurement results were relatively stable, which demonstrates the effectiveness of the thermographic reconstruction method and the edge gradient detection method. It should be pointed out that, during the measurement process, the resolution of the infrared thermal imager is one of the key factors. In the experiments, 1 pixel in the field of view corresponds to 0.15 mm, so when the crack width is small, larger measurement errors will occur. The measurement accuracy can be improved when a high-resolution infrared camera is used.
4.3. Alumina Ceramic Plates with Microcracks
An alumina ceramic plate with surface microcracks was taken as the test object to carry out a feasibility study on the application of this method in the detection of microcracks with micrometer width. As shown in Figure 10a, there are two surface cracks with natural morphology on the surface of the alumina ceramic. Measured by a microscope (Keyence VHX-2000C, Osaka, Japan), the average widths of the two cracks are 25.7 μm and 33.1 μm, respectively.
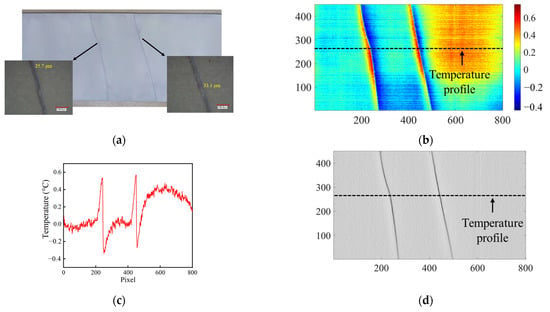
Figure 10.
(a) Alumina ceramic plates with microcracks, (b) reconstructed image of the microcrack region, (c) temperature profile of the reconstructed image, and (d) edge gradient detection result of the reconstructed image.
In the experiment, the scanning speed was set to 6 mm/s, and the scanning was carried out from the left to the right of the sample; the pixel–mm ratio in the infrared image was 647 pixels–100 mm. Figure 10b is the reconstructed image of the alumina ceramic sample with surface microcracks under continuous line-scanning excitation. Figure 10c shows a temperature profile line on the reconstructed image, with which the rapid positioning of microcracks can be realized. Finally, the morphology detection of microcracks was further realized by the edge gradient detection method, as shown in Figure 10d. The morphology detection results are completely consistent with the actual morphology shown in Figure 10a. However, limited by the spatial resolution of the thermal imager in the experiment, the quantitative identification of the crack width cannot be carried out.
As we previously pointed out, the morphography identification of surface cracks is independent of crack depth using the continuous laser-line scanning thermography combined with the edge gradient detection method. This merit was further demonstrated in the testing of alumina ceramic plates with microcracks. The crack depths were not known as an input parameter during the tests; nevertheless, the cracks were successfully identified using the proposed method.
4.4. Ceramic Matrix Composite Plate with Surface Damages
The cut CMC plate had dimensions of 130 mm × 130 mm × 6 mm (thickness is of 6 mm), with a subtle wrinkle damage on its surface, as shown in Figure 11. Using the experimental setup in Figure 7, the specimen’s moving speed was set to 8 mm/s, and 1 pixel in the thermal imager’s field of view corresponds to 0.25 mm. It should be pointed out that the parameters were adjusted until the repeatability of the output thermal images was stable.
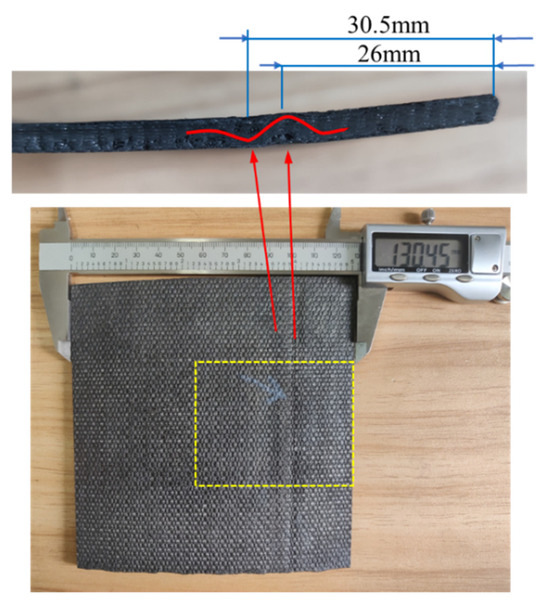
Figure 11.
Ceramic matrix composite plate with surface damage. The area in the yellow box is imaged and reconstructed.
Figure 12 shows the dynamic sequence-reconstructed image of the composite plate and its temperature profile. In the reconstructed image, the temperature of the concave part in the wrinkled area is higher than that of the normal area, while the temperature of the convex part is lower than that of the normal area—a phenomenon consistent with the heat conduction characteristics of wrinkle damage. Quantitative analysis of the infrared images shows that the concave part is approximately 25.1 mm from the right boundary, and the convex part is approximately 30.7 mm from the right boundary. Compared with the subsequent wrinkle profile results, the average relative error in damage localization is less than 3%. Additionally, at this scanning speed, continuous detection of a 1-square-meter large-scale CMC plate can be completed within 30 min, enabling continuous and rapid inspection, with promising prospects for engineering applications.
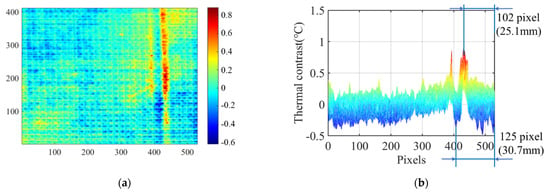
Figure 12.
(a) Reconstructed image of specimen. (b) Thermal profile image of the reconstructed image at scanning speed of 8 mm/s.
The continuous laser-line scanning thermography was then used for the detection of surface damages in a large CMC plate with sizes of about 2 m × 4 m. The infrared imaging method enables continuous and uninterrupted scanning, capable of completing the inspection of approximately 1 square meter per hour.
Subsequently, the continuous laser-line scanning thermography was employed to detect surface damages in a large CMC plate, which measures approximately 2 m by 4 m. The results indicate that the infrared imaging method enables continuous, uninterrupted scanning. An area of 1 square meter can be inspected and completed within half an hour with a 120 mm length laser line and a 5 mm/s scanning speed. It demonstrated a new approach for industrial health monitoring of large-scale structures.
5. Conclusions
This paper presents a laser-line scanning infrared thermography technique, establishing an integrated continuous line scanning experimental platform. Through the development of a dynamic sequence image reconstruction method, rapid localization of surface cracks in composites is achieved, and quantitative characterization of crack morphology is realized by combining edge gradient detection methods. The research results show the following:
- (1)
- Continuous laser-line scanning excitation combined with an edge gradient detection algorithm can rapidly and effectively perform quantitative characterization of the localization and morphology of cracks at different angles. With a scanning speed of approximately 5–10 mm/s, detection of a 1-square-meter area can be achieved within half an hour, demonstrating high detection efficiency.
- (2)
- Experimental results indicate that the continuous laser-line scanning infrared imaging technique is capable for crack size detection. When the crack is perpendicular to the scanning direction, the relative error in detecting crack width is about 6%. As the angle between the crack and the scanning direction decreases, the relative error in detecting crack width gradually increases.
- (3)
- An alumina ceramic plate with micrometer-width cracks was inspected using continuous laser-line scanning thermography. The morphology detection results are completely consistent with the actual morphology. However, limited by the spatial resolution of the thermal imager in the experiment, the quantitative identification of the crack width could not be carried out.
- (4)
- The continuous laser-line scanning method is also effective for detecting other types of surface damage (such as wrinkles) in ceramic matrix composites. It can localize damage through temperature field differences and quantify its geometric features with an average relative error of less than 3%, providing a new approach for health monitoring of large-scale ceramic matrix composite structures.
Author Contributions
Writing—original draft, Y.W.; supervision, J.Z.; data curation, L.D.; validation, X.L.; software, S.J. All authors have read and agreed to the published version of the manuscript.
Funding
This research was funded by Science and Technology Project of Jiangsu Provincial Administration for Market Regulation, grant number KJ2025053; and Key Projects of National Institute of Metrology, grant number AKYZZ2540.
Data Availability Statement
The original contributions presented in this study are included in the article. Further inquiries can be directed to the corresponding author.
Conflicts of Interest
The authors declare no conflicts of interest.
References
- Zhu, Y.; Cheng, L.; Ma, B.; Liu, Y.; Zhang, L. Effect of CVD ZrB2 coating thickness on anti-ablation performance of C/SiC composites. Ceram. Int. 2018, 44, 8166–8175. [Google Scholar] [CrossRef]
- Zhang, M.; Pang, Z.; Jia, Y.; Li, J.; Shan, C. Research progress and development trend of fiber-reinforced ceramic matrix composites. J. Aeronaut. Mater. 2021, 41, 14–27. [Google Scholar]
- Bertrand, D.J.; Sabelkin, V.; Zawada, L.; Mall, S. Fatigue behavior of sylramic-iBN/BN/CVI SiC ceramic matrix composite in combustion environment. J. Mater. Sci. 2015, 50, 7437–7447. [Google Scholar] [CrossRef]
- Liu, S.; Liu, F.; Zhang, Q.; Li, Z.; Zhang, B.; Wang, L. Non-destructive characterisation and evaluation of manufacturing defects in SiCf/SiC composites using the relative energy attenuation behaviour of X-rays. Ceram. Int. 2020, 46, 26044–26054. [Google Scholar] [CrossRef]
- Zhang, Y.; Liu, W.; Gui, Z.; Zhou, S.; Ren, Z. Damage mechanisms of 2.5D SiO2f/SiO2 woven ceramic matrix composites under compressive impact. Ceram. Int. 2023, 49, 9203–9218. [Google Scholar] [CrossRef]
- Smith, C.E.; Morscher, G.N.; Xia, Z. Electrical resistance as a nondestructive evaluation technique for SiC/SiC ceramic matrix composites under creep-rupture loading. Int. J. Appl. Ceram. Technol. 2011, 8, 298–307. [Google Scholar] [CrossRef]
- Papa, I.; Ricciardi, M.R.; Antonucci, V.; Langella, A.; Tirillò, J.; Sarasini, F.; Pagliarulo, V.; Ferraro, P.; Lopresto, V. Comparison between different non-destructive techniques methods to detect and characterize impact damage on composite laminates. J. Compos. Mater. 2020, 54, 617–631. [Google Scholar] [CrossRef]
- Jiang, H.J.; Chen, L. Application of infrared thermography in nondestructive testing of composite materials. Nondestruct. Test. 2018, 40, 37–41. (In Chinese) [Google Scholar]
- Senthilkumar, M.; Sreekanth, T.G.; Manikanta Reddy, S. Nondestructive health monitoring techniques for composite materials: A review. Polym. Polym. Compos. 2021, 29, 528–540. [Google Scholar] [CrossRef]
- Podymova, N.B.; Karabutov, A.A. Combined effects of reinforcement fraction and porosity on ultrasonic velocity in SiC particulate aluminum alloy matrix composites. Compos. Part B Eng. 2017, 113, 138–143. [Google Scholar] [CrossRef]
- Liu, F.; Liu, S.; Zhang, Q.; Li, Z.; Qiu, H. Quantitative non-destructive evaluation of drilling defects in SiCf/SiC composites using low-energy X-ray imaging technique. NDT & E Int. 2020, 116, 102364. [Google Scholar]
- Zhu, J.; Mao, Z.; Wu, D.; Zhou, J.; Jiao, D.; Shi, W.; Zhu, W.; Liu, Z. Progress and trends in non-destructive testing for thermal barrier coatings based on infrared thermography: A review. J. Nondestruct. Eval. 2022, 41, 49. [Google Scholar] [CrossRef]
- Zhuo, L.; Xu, Y.; Zhu, J.; Chen, H.; Yang, Q. Depth estimation of internal defects from a sensitive frequency using thermal wave radar. NDT E Int. 2025, 154, 103367. [Google Scholar] [CrossRef]
- Zhuo, L.; Xu, Y.; Zhu, J.; Liu, C.; Yi, F. Quantitative Evaluation of Interfacial Defect Size and Pattern by Solving a 3D Inverse Problem Based on Step Heating Thermography. Exp. Mech. 2024, 64, 245–259. [Google Scholar] [CrossRef]
- Zhuo, L.; Yang, Y.; Zhu, J.; Huang, Z.; Chao, J.; Xie, W. Size determination of interior defects by reconstruction of subsurface virtual heat flux for step heating thermography. NDT E Int. 2023, 133, 102734. [Google Scholar] [CrossRef]
- Huang, H.; Zhu, J.; Zhuo, L.; Li, C.; Liu, C.; Hao, W.; Xie, W. Non-destructive evaluation of uneven coating thickness based on active long pulse thermography. NDT E Int. 2022, 130, 102672. [Google Scholar] [CrossRef]
- Schroeder, J.A.; Ahmed, T.; Chaudhry, B.; Shepard, S. Non-destructive testing of structural composites and adhesively bonded composite joints: Pulsed thermography. Compos. Part A Appl. Sci. Manuf. 2002, 33, 1511–1517. [Google Scholar] [CrossRef]
- De Oliveira, L.A.; Gomes, G.F.; Pereira, J.L.J.; Francisco, M.B.; Demarbaix, A.; Cunha, S.S. New trends of damage detection and identification based on vibrothermography in composite materials. J. Nondestruct. Eval. 2023, 42, 57. [Google Scholar] [CrossRef]
- Philippe, D.; Jean-Claude, G.; Daniel, S. Damage detection in composites by vibrothermography and local resonances. Mech. Ind. 2013, 14, 137–143. [Google Scholar] [CrossRef]
- Yi, Q.; Tian, G.Y.; Malekmohammadi, H.; Zhu, J.; Laureti, S.; Ricci, M. New features for delamination depth evaluation in carbon fiber reinforced plastic materials using eddy current pulse-compression thermography. NDT E Int. 2019, 102, 264–273. [Google Scholar] [CrossRef]
- He, Y.; Tian, G.; Pan, M.; Chen, D. Impact evaluation in carbon fiber reinforced plastic (CFRP) laminates using eddy current pulsed thermography. Compos. Struct. 2014, 109, 1–7. [Google Scholar] [CrossRef]
- Sun, J.G.; Benz, J. Flash duration effect in one-sided thermal imaging. AIP Conf. Proc. 2005, 760, 650–654. [Google Scholar] [CrossRef]
- Chung, Y.; Lee, S.; Shrestha, R.; Kim, W. Detectability of subsurface defects in polypropylene/glass fiber composites using multiple lock-in frequency modulated algorithms. Appl. Sci. 2023, 13, 545. [Google Scholar] [CrossRef]
- Zhang, J.Y.; Meng, X.B.; Ma, Y.C. A new measurement method of coatings thickness based on lock-in thermography. Infrared Phys. Technol. 2016, 76, 655–660. [Google Scholar] [CrossRef]
- Wang, F.; Liu, J.; Mohammad, O.; Wang, Y. Research on debonding defects in thermal barrier coatings structure by thermal-wave radar imaging (TWRI). Int. J. Thermophys. 2018, 39, 71. [Google Scholar] [CrossRef]
- Liu, L.; Mandelis, A.; Melnikov, A.; Wang, L. Comparative analysis of single- and multiple-frequency thermal wave radar imaging inspection of glass fiber reinforced polymer (GFRP). Int. J. Extreme Manuf. 2022, 4, 025201. [Google Scholar] [CrossRef]
- Li, T.; Almond, D.P.; Rees, D.A.S. Crack imaging by scanning laser-line thermography and laser-spot thermography. Meas. Sci. Technol. 2011, 22, 035701. [Google Scholar] [CrossRef]
- He, M.; Zhang, L.; Zheng, W.; Feng, Y. Crack detection based on a moving mode of eddy current thermography method. Measurement 2017, 109, 119–129. [Google Scholar] [CrossRef]
- Jiao, D.; Shi, W.; Liu, Z.; Xie, H. Laser multi-mode scanning thermography method for fast inspection of micro-cracks in TBCs surface. J. Nondestruct. Eval. 2018, 37, 30. [Google Scholar] [CrossRef]
- Liu, X.; Yang, S.; Liu, Y.; Chi, Y.; Gu, X. Surface crack identification on a cylinder using the signal enhancement of the scanning laser line source method. Appl. Sci. 2018, 8, 1796. [Google Scholar] [CrossRef]
- Qiu, J.; Pei, C.; Yang, Y.; Wang, R.; Liu, H.; Chen, Z. Remote measurement and shape reconstruction of surface-breaking fatigue cracks by laser-line thermography. Int. J. Fatigue 2021, 142, 105950. [Google Scholar] [CrossRef]
- Wang, Q.; Zhang, Z.; Yin, W.; Chen, H.; Liu, Y. Defect detection method for CFRP based on line laser thermography. Micromachines 2022, 13, 612. [Google Scholar] [CrossRef]
- He, Z.; Wang, H.; He, Y.; Zhang, G.; Wang, J.; Zou, G.; Chady, T. Joint scanning laser thermography defect detection method for carbon fiber reinforced polymer. IEEE Sens. J. 2020, 20, 328–336. [Google Scholar] [CrossRef]
- Lee, S.J.; Kim, W.T.; Suh, H.K. Correlation data augmentation-based YOLO-integrated object detection of thermal-equalization video using line scanning inductive thermography. Appl. Sci. 2024, 14, 11903. [Google Scholar] [CrossRef]
- Geng, C.; Zhong, Q.; Luo, H.; Shi, W.; Xie, H.; He, W. A novel method to in-situ characterize fatigue crack growth behavior of nickel-based superalloys by laser thermography. Exp. Mech. 2025, 65, 5–23. [Google Scholar] [CrossRef]
- Zhang, C.; He, W.; Xie, H.M. Automatic crack tip localization in enormous DIC images to in-situ characterize high-temperature fatigue crack growth behavior. Int. J. Fatigue 2024, 185, 108364. [Google Scholar] [CrossRef]
- Li, C.; Zhu, J.; Zhuo, L.; Li, J.; Zhang, D. Continuous laser-line scanning thermography with data-processing algorithm for rapid and accurate defect inspection. NDT E Int. 2024, 142, 103028. [Google Scholar] [CrossRef]
- Li, C.; Zhu, J.; Zhuo, L.; Jin, E.; Liu, H. Defect detection in CFRP laminate structures using continuous laser-line scanning thermography with parameter optimization and PCA fusion method. NDT E Int. 2025, 155, 103438. [Google Scholar] [CrossRef]
- Shi, L.; Zhao, Y.F. Edge detection of high-resolution remote sensing image based on multi-directional improved Sobel operator. IEEE Access 2023, 11, 135979–135993. [Google Scholar] [CrossRef]
- Ma, Y.L.; Ma, H.Y.; Chu, P.C. Demonstration of quantum image edge extration enhancement through improved Sobel operator. IEEE Access 2020, 8, 210277–210285. [Google Scholar] [CrossRef]
Disclaimer/Publisher’s Note: The statements, opinions and data contained in all publications are solely those of the individual author(s) and contributor(s) and not of MDPI and/or the editor(s). MDPI and/or the editor(s) disclaim responsibility for any injury to people or property resulting from any ideas, methods, instructions or products referred to in the content. |
© 2025 by the authors. Licensee MDPI, Basel, Switzerland. This article is an open access article distributed under the terms and conditions of the Creative Commons Attribution (CC BY) license (https://creativecommons.org/licenses/by/4.0/).