Article

Research and Development of pH-Sensitive Delivery Systems for Protein Molecule Delivery Based on Chitosan and Hydroxyapatite

by
Elina E. Chernikova
1,*,
Maxim D. Zagvozkin
2,
Aleksander A. Buzaev
3,
Irina A. Kurzina
1 and
Svetlana A. Ulasevitch
4
1
Department of Natural Compounds, Pharmaceutical and Medical Chemistry, Faculty of Chemistry, Tomsk State University, Tomsk 634050, Russia
2
Department of Mechanics of Deformed Solid Body, Faculty of Physics and Engineering, Tomsk State University, Tomsk 634050, Russia
3
Department of Inorganic Chemistry, Faculty of Chemistry, Tomsk State University, Tomsk 634050, Russia
4
Laboratory of Intelligent Technologies in Infochemistry, Infochemistry Research Center, ITMO University, Saint-Petersburg 191002, Russia
*
Author to whom correspondence should be addressed.
J. Compos. Sci. 2025, 9(10), 525; https://doi.org/10.3390/jcs9100525
Submission received: 23 July 2025 / Revised: 8 September 2025 / Accepted: 19 September 2025 / Published: 1 October 2025
(This article belongs to the Section Biocomposites)

Abstract

The degree of bovine serum albumin (BSA) released from particles based on chitosan and hydroxyapatite prepared by encapsulation and chemisorption methods, crosslinked by aldol condensation, was studied. The obtained materials’ composition was qualitatively determined by IR spectroscopy; phase identification and surface morphology were analyzed by X-ray diffraction and scanning electron microscopy, respectively. A spectrophotometric method was used to quantitatively assess the loading and release degree of encapsulated/chemisorbed BSA from polymer microspheres. To determine the release mechanism, the data on the amount of BSA released were analyzed according to the zero- and first-order, Higuchi, and Korsmayer–Peppas models.

1. Introduction

Cancer is one of the most rapidly progressing diseases worldwide. The increasing global cancer disease burden is a consequence of both population aging and demographic growth and changes in people’s exposure to risk factors, some of which are related to the level of socioeconomic development. Tobacco, alcohol, and obesity are key drivers of the rising cancer rate. This trend leads to the need for accurate and rapid treatments, such as through targeted therapies based on drug delivery systems.
Microsphere-based drug delivery systems have demonstrated many advantages in cancer treatment such as good pharmacokinetics, precise targeting of tumor cells, reduction of side effects, and drug resistance. Microspheres used in drug delivery systems are usually designed or selected based on their size and characteristics according to the tumor pathophysiology. They release drug substances into tumor cells to induce their death [1].
There are a number of encapsulation strategies for drug delivery. One strategy is liposomal delivery. Liposomal doxorubicin encapsulates doxorubicin hydrochloride in PEGylated liposomes, which increases circulation time and reduces cardiotoxicity. Liposomes demonstrate high encapsulation efficiency and sustained release: studies have shown over 90% drug loading in cancer treatment [2]. Another strategy, discussed in this article, is loading into polymeric nanoparticles. Chitosan nanoparticles loaded with doxorubicin demonstrated 50% higher absorption in cancer cells and a 2.5-fold increase in efficiency compared to free doxorubicin, which is explained by pH-sensitive release in the tumor microenvironment [3]. Another option is delivery using solid lipid nanoparticles. Tetrodotoxin (TTX)-loaded solid lipid nanoparticles achieved encapsulation efficiency of over 70% and sustained release for 48–72 h. High-pressure cold homogenization maintained the stability of thermolabile drugs [4].
One of the most frequently used biologic carriers is chitosan: complexes with hydroxyapatite are often used as drug delivery systems [5]. However, most of the literature describes the creation and properties of scaffolds based on these complexes without addressing the possibility of using the system for drug delivery to treat non-bone diseases.
Hydroxyapatite is a mineral with composition of Ca5(PO4)3OH, more commonly written as Ca10(PO4)6(OH)2. Since it is a mineral, it can be either synthetic or natural. In nature, it is found in many bone structures: bones, tooth enamel, eggshells. It is also found in some plants and aquatic organisms, such as coral and starfish. There are many methods of synthesizing particles of this mineral; some of them are shown in Table 1.
Hydroxyapatite usage can be divided into two large groups: medical and non-medical applications. Non-medical applications include its use as a chromatographic sorbent, in catalysis, laser host materials, fluorescent materials, and gas sensors [13]. In the medical field, due to its mechanical properties and composition, it is used for bone defect treatment and as a dental material, tissue engineering system, and bioactive coating on metal bone implants [14]. A number of studies also show that hydroxyapatite particles inhibit the growth of many types of cancer cells [15].
Hydroxyapatite usage as a drug delivery material has not been investigated for a long time. From the current data, a number of advantages of this application can be concluded:
  • Long biodegradation time to control drug release [16];
  • Slow drug release due to porous material structure [17];
  • Adsorbs both positively and negatively charged molecules [18];
  • Maintains mechanical and physical properties even when internal factors such as temperature and pH change [19];
  • Synthetic hydroxyapatite retains the composition, crystal structure, and size that it has in target tissues (e.g., bone or teeth) [20].
Such advantages, as well as the development prospects of this material, enable its use in drug delivery system synthesis. A more detailed comparison can be made between the potential chitosan–hydroxyapatite complex and its analogues. Chitosan–hydroxyapatite complexes are more stable in physiological environments and are less susceptible to accidental dissolution in the presence of chelating agents or ion exchange compared to alginate complexes [21]. Continuing the comparison with alginate complexes, it can be noted that the combination of the mucoadhesive properties of chitosan and the large surface area of HA leads to a significantly higher protein loading efficiency (usually >90% for CS-HA versus 60–80% for alginate systems) [22]. Compared with another analogue, PLGA-based systems from the same paper, it can be noted that the surface erosion mechanism of CS-HA systems provides more linear release kinetics compared to the bulk erosion of PLGA, which often leads to unpredictable burst release patterns. In this work we synthesized delivery systems based on a complex of chitosan and hydroxyapatite.
Therefore, the aim of this research work is to obtain and investigate physical and chemical properties of chitosan–hydroxyapatite microspheres.

2. Materials and Methods

2.1. Synthesis Techniques

The material was obtained according to our previous work [23,24]. In brief, the first synthesis step was the preparation of 0.5% low molecular-weight chitosan solution in 0.5% aqueous acetic acid solution and 10% Na2HPO4*12H2O solution. Then the acidified chitosan solution was slowly added to the Na2HPO4*12H2O solution. After mixing, the prepared solution was adjusted to pH 10 and stirred for 20 min. In the second step, particle activation was carried out by aldol condensation using terephthalic aldehyde. Therefore, an aqueous solution of terephthalic aldehyde with a concentration of 2.5 mg/mL was prepared by heating and constant stirring and then introduced into the alkalinized chitosan solution. The obtained colloidal solution was washed 4 times with distilled water and filtered on a vacuum unit.
BSA incorporation was carried out by two methods: encapsulation and chemisorption. Encapsulation was carried out by introducing 7.5% aqueous solution of BSA into inactivated chitosan solution (after the first step), followed by its activation. Chemisorption was carried out by soaking the prepared filtered particles (after the second step) in 3.75% aqueous BSA solution.
A wet chemical method was used to deposit hydroxyapatite (HA) on the chitosan microspheres surface. Firstly, the chitosan microspheres were soaked in 0.5M CaCl2 aqueous solution for 10 min to adsorb Ca2+ since the large number of amino functional groups on the chitosan molecules could chelate calcium ions, which were then soaked in deionized water for 10 min to remove the Cl excess on the chitosan particles surface. Secondly, the chitosan particles were soaked in 0.3M Na2HPO4 aqueous solution for 10 min, and they were soaked in deionized water for 10 min to remove the excess Na+ on the chitosan microspheres’ surfaces. The Na2HPO4 solution’s pH was adjusted and kept at 11.0 by adding ammonia hydroxide. The whole dipping process was carried out in one cycle. The dipping process was performed twice.
In the case of BSA encapsulation, hydroxyapatite was injected after the finished particles were obtained. In case of BSA chemisorption, hydroxyapatite was injected before soaking the particles in aqueous BSA solution.
The full synthesis methodology described above is summarized in Figure 1.

2.2. Materials Analysis

The materials were analyzed by four physicochemical methods: infrared spectroscopy, X-ray diffraction analysis, scanning electron microscopy, and spectrophotometry.
IR spectra of the obtained materials and pure chitosan were taken on an Agilent Cary 630 FTIR spectrometer.
X-ray diffraction analysis of obtained particles was carried out on a diffractometer (Rigaku Smartla, CuKα emission) by powder method with 2θ = 3 ÷ 100°, step 3°/min.
The obtained material’s surface morphology was investigated on a HITACHI TM-3000 electron microscope (Hitachi High-Technologies Corporation, Tokyo, Japan) at an accelerating voltage of 5 kV for all samples, in low-vacuum mode at magnification of 500, 1000, 3000.
The BSA loading degree with encapsulation and chemisorption methods was determined by the spectrophotometric method, and the BSA release degree from chitosan matrices was quantified on a Spectr-2000 spectrophotometer. Thus, the BSA loading degree was evaluated by the study of flushing waters during synthesis. The BSA release degree from chitosan microspheres was estimated from samples taken at certain intervals from solutions of phosphate buffers in which the particles were located. This study was carried out for 7 days at 37 °C and pH 5.0 (simulation of the extracellular matrix during metastasis and angiogenesis), pH 6.5 (simulation of tumor cell extracellular space environment), and pH 7.4 (simulation of blood flow environment). For this purpose, a series of phosphate buffers were prepared according to the pharmacopoeia monograph GPM.1.3.0003.15:
  • Phosphate buffer solution pH 5.0: 2.72 g potassium dihydrophosphate dissolved in 800.0 mL water. Adjust to pH 5.0 potentiometrically with 1 M potassium hydroxide solution and bring the volume of the solution with water to 1000.0 mL.
  • Phosphate buffer solution pH 6.5: dissolve 1.79 g dihydrophosphate, 1.36 g potassium dihydrophosphate and 7.02 g sodium chloride in water and bring the volume of the solution to 1000.0 mL with water.
  • Phosphate buffer solution pH 7.4: 393.4 mL of 0.1 M sodium hydroxide solution is mixed with 250.0 mL of 0.2 M potassium dihydrophosphate solution.

3. Results

3.1. IR Spectroscopy Analysis of Particle Structure

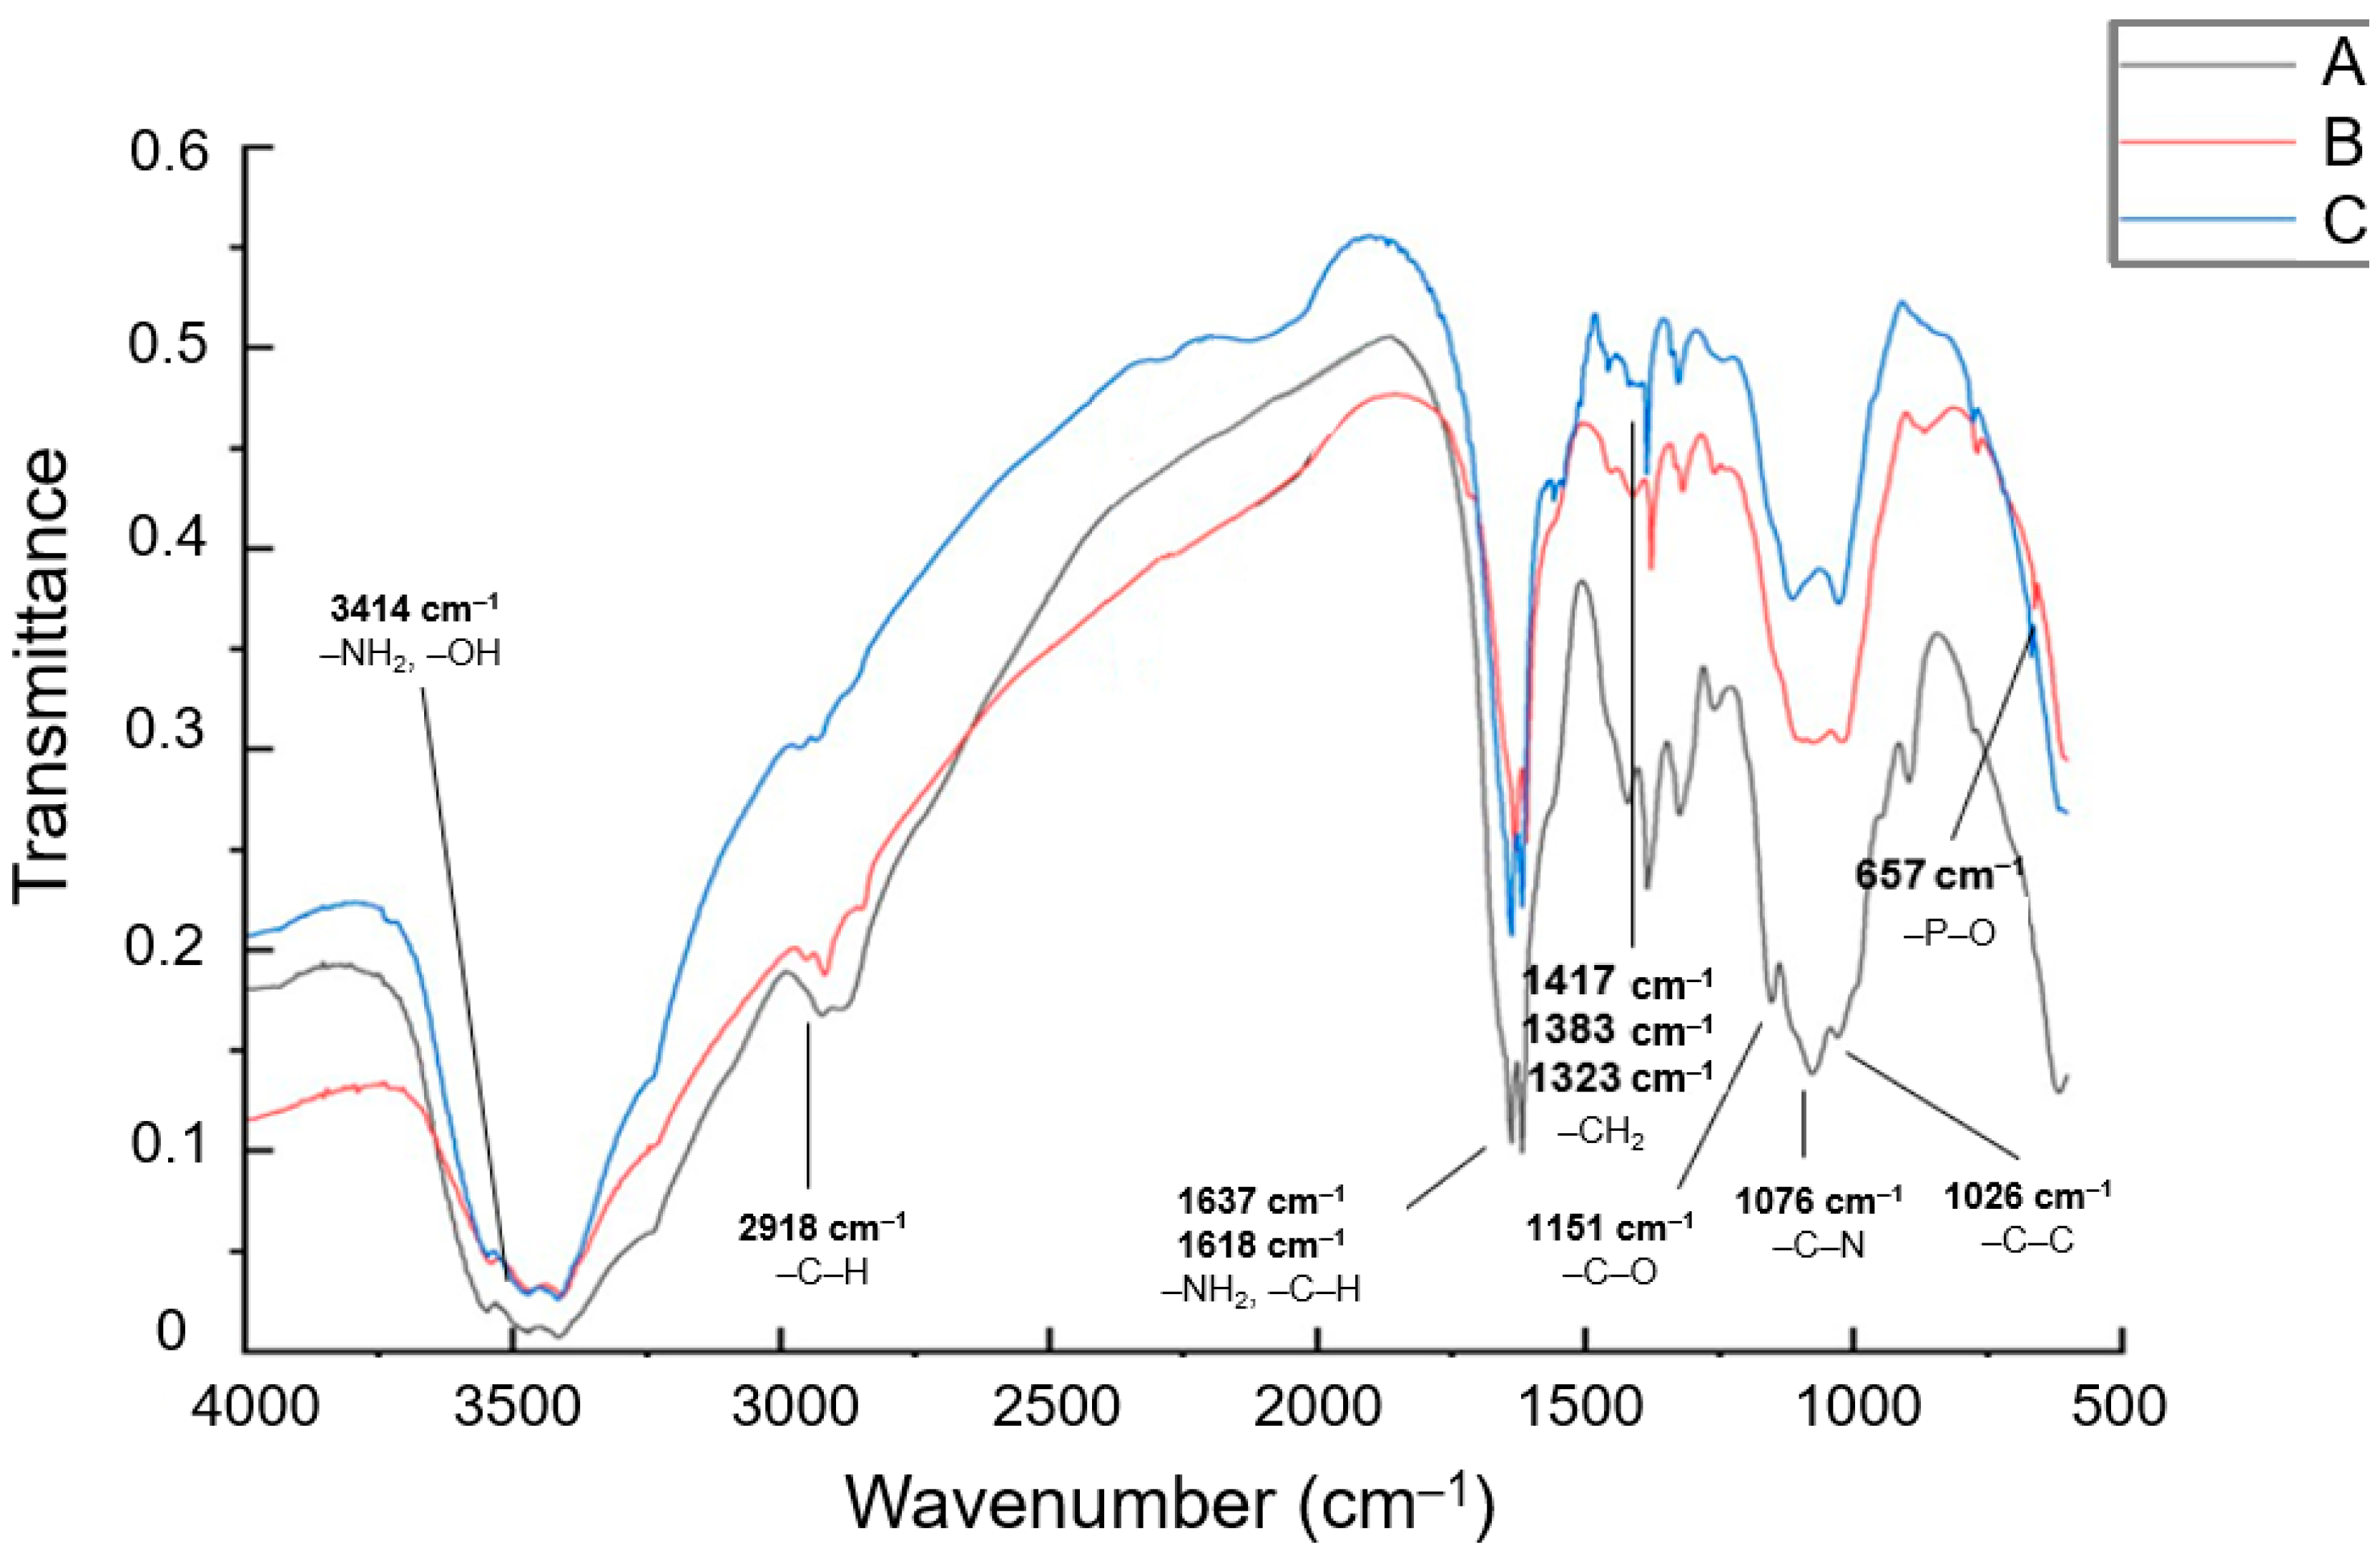
Figure 2 shows the IR spectra of pure chitosan (A), particles with encapsulated BSA (B), and particles with chemisorbed BSA (C).
Thus, vibrations were detected for chitosan of the free amino group (~3414 cm−1 and 1637 cm−1), hydroxyl group (~3414 cm−1), tertiary hydrocarbon bond (1618 cm−1), the triplet of the bound methyl group (1417 cm−1, 1383 cm−1 and 1323 cm−1), and the cyclic backbone triplet consisting of carbonyl (1151 cm−1), nitrile (1076 cm−1) groups and carbon σ-bond (1026 cm−1). Obviously, the particles’ IR spectra with two types of BSA deposition will have similar characteristic peaks to pure chitosan and BSA. Thus, we observe a narrowing of the peak observed in the region of 3500 cm−1 due to the bonding of free amino groups due to aldol condensation, the appearance of the tertiary hydrocarbon bond peak (2918 cm−1), a narrowing and decrease in the intensity of the peaks of the amino group (1637 cm−1), tertiary hydrocarbon bond (1618 cm−1), and the bound methyl group triplet (1417 cm−1, 1383 cm−1 and 1323 cm−1) due to the decrease in the concentration of chitosan in the system. The shape and intensity of the peaks related to the cyclic backbone of the chitosan molecule (1151 cm−1, 1076 cm−1, and 1026 cm−1) also change due to the decrease in the concentration of chitosan in the system and partial overlapping of the duplex of the tertiary hydrocarbon bond of BSA (1100−1 and 1000 cm−1). A small signal in the region of 657 cm−1 refers to the phosphate groups of hydroxyapatite, indicating its incorporation into the matrix structure.

3.2. X-Ray and SEM Analysis of Particle Morphology

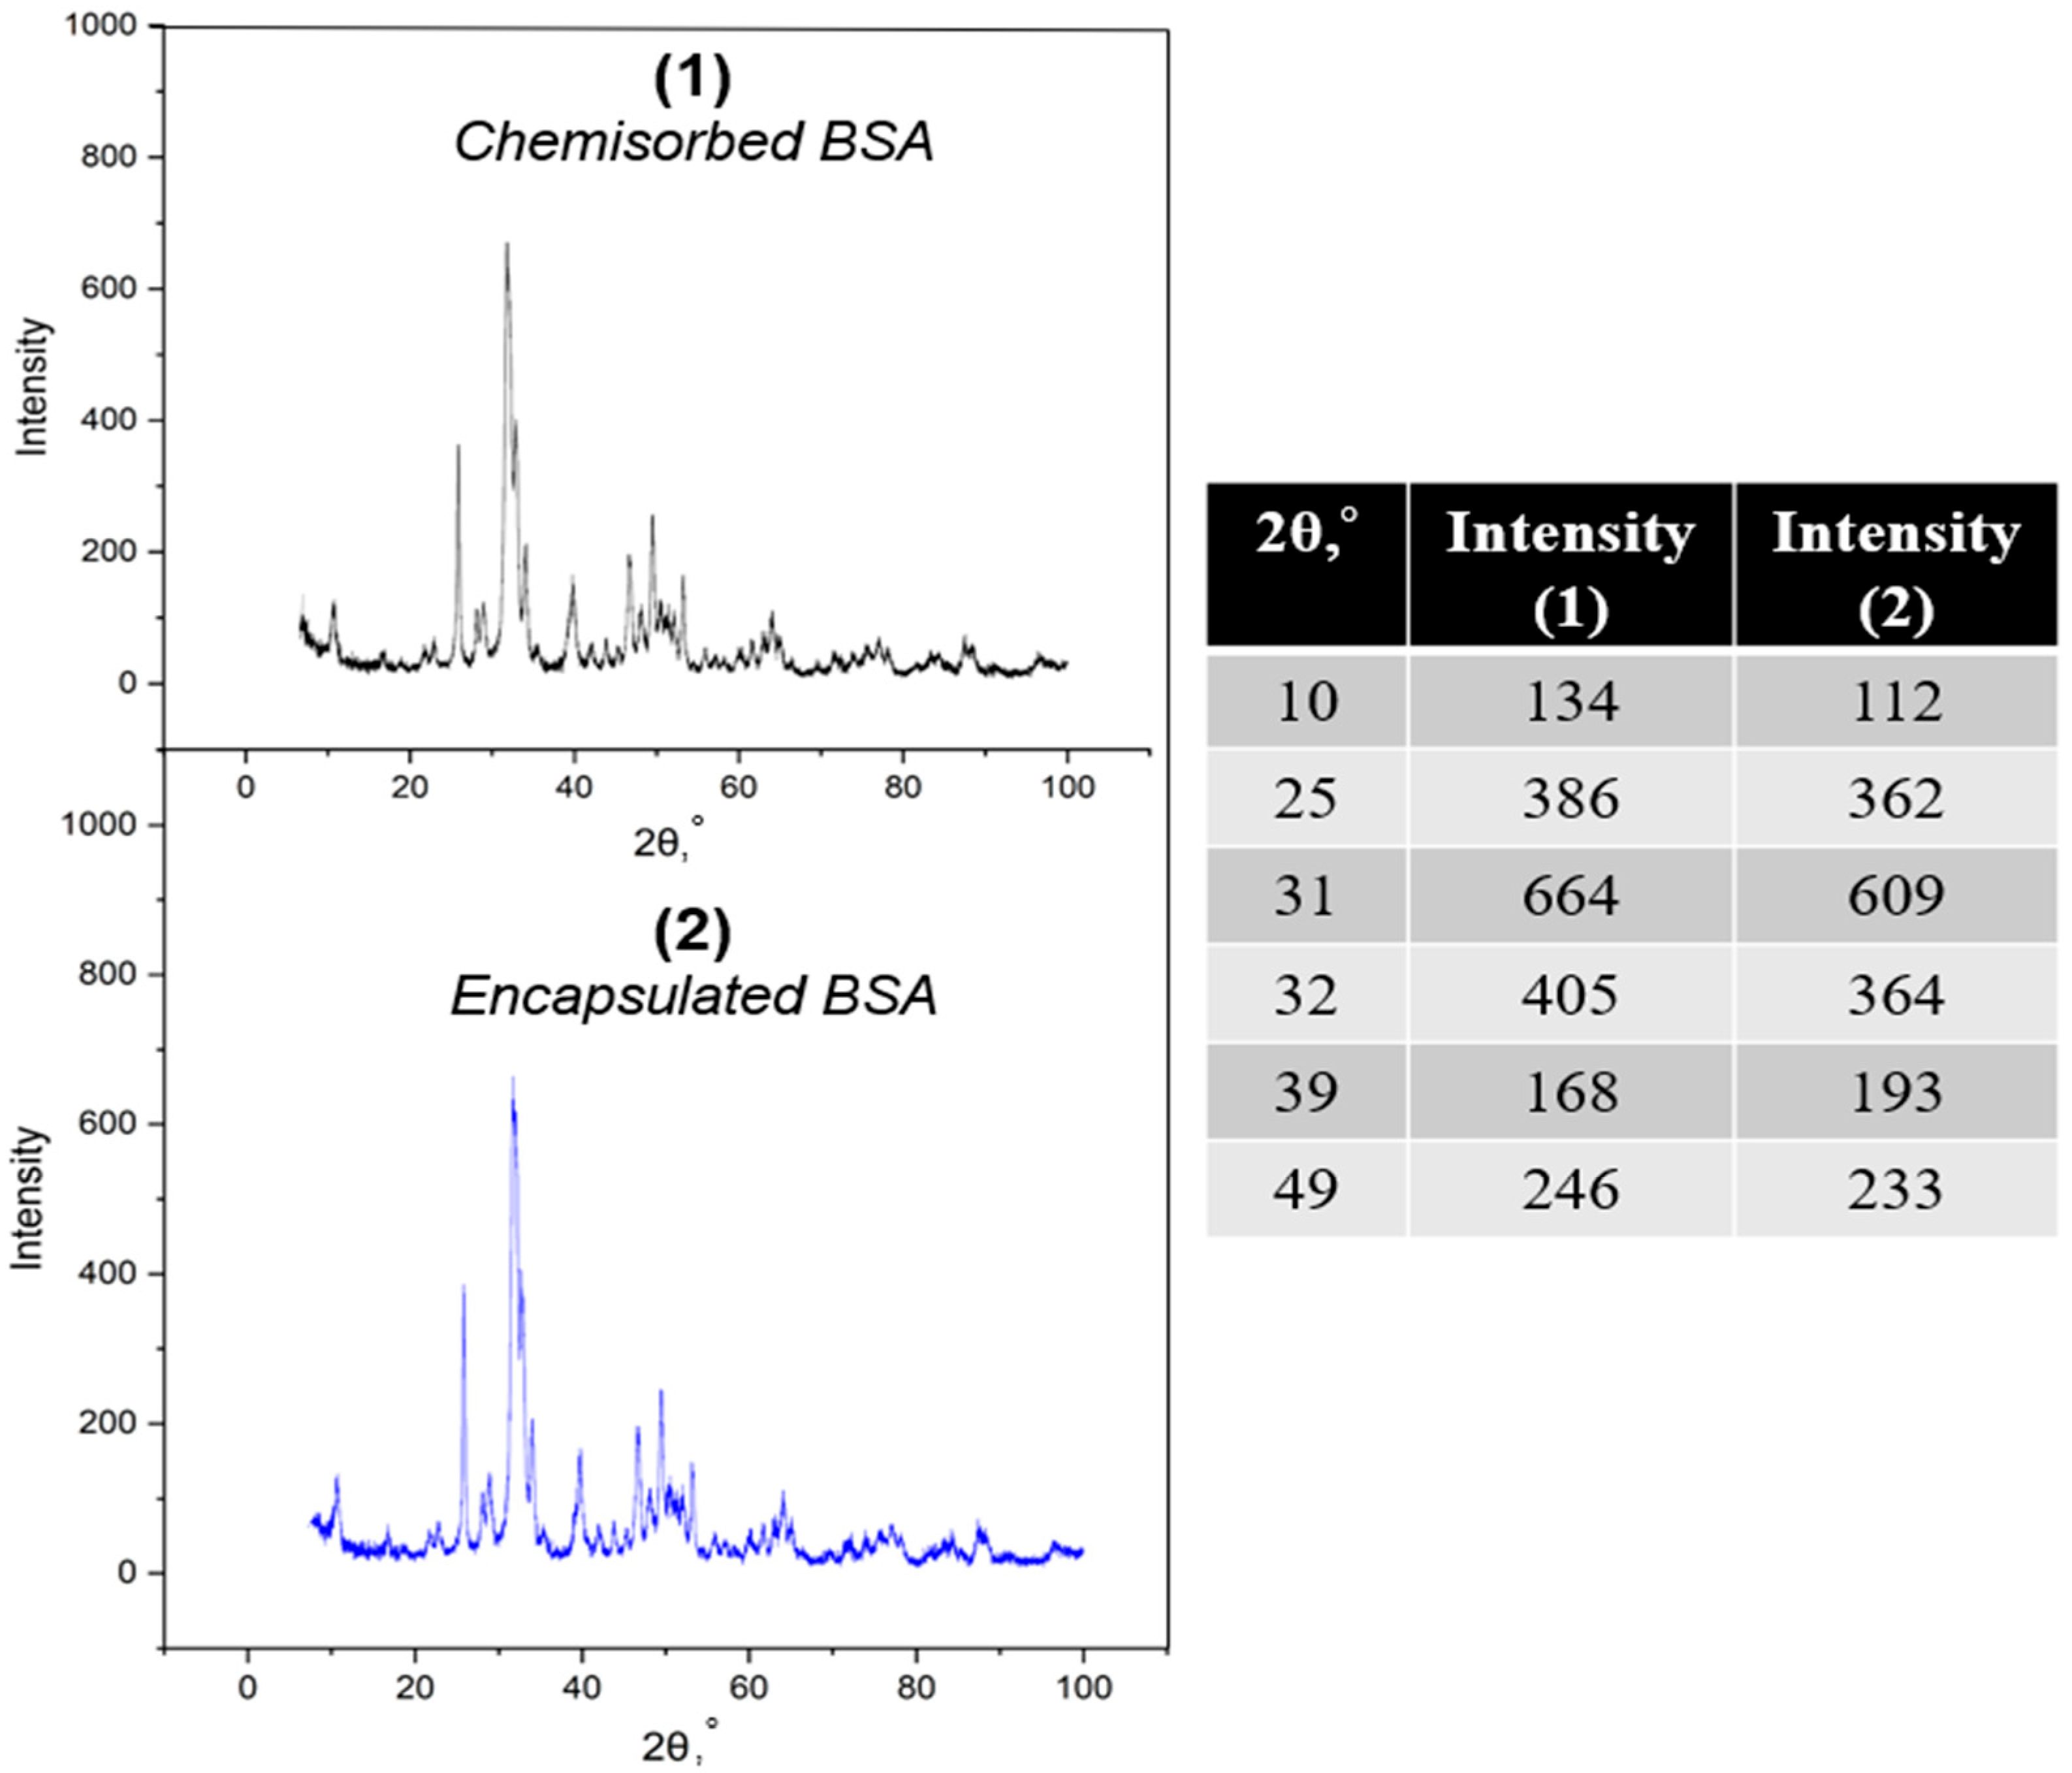
The X-ray diffractograms (Figure 3) show signals related to the hydroxyapatite phase (experimentally obtained reflexes), which were identified from the PDF-2 database, DB card number 01-079-5683. Low-intensity and frequent reflexes are observed in the range of 2θ = 11–24°, 2θ = 32–49° and 2θ = 50–100°, indicating the presence of a small amount of amorphous hydroxyapatite phase. Nevertheless, the region 2θ = 25–33° is characterized by acute, intense reflexes, which indicates the crystalline phase predominance in the samples, which is consistent with the SEM images.
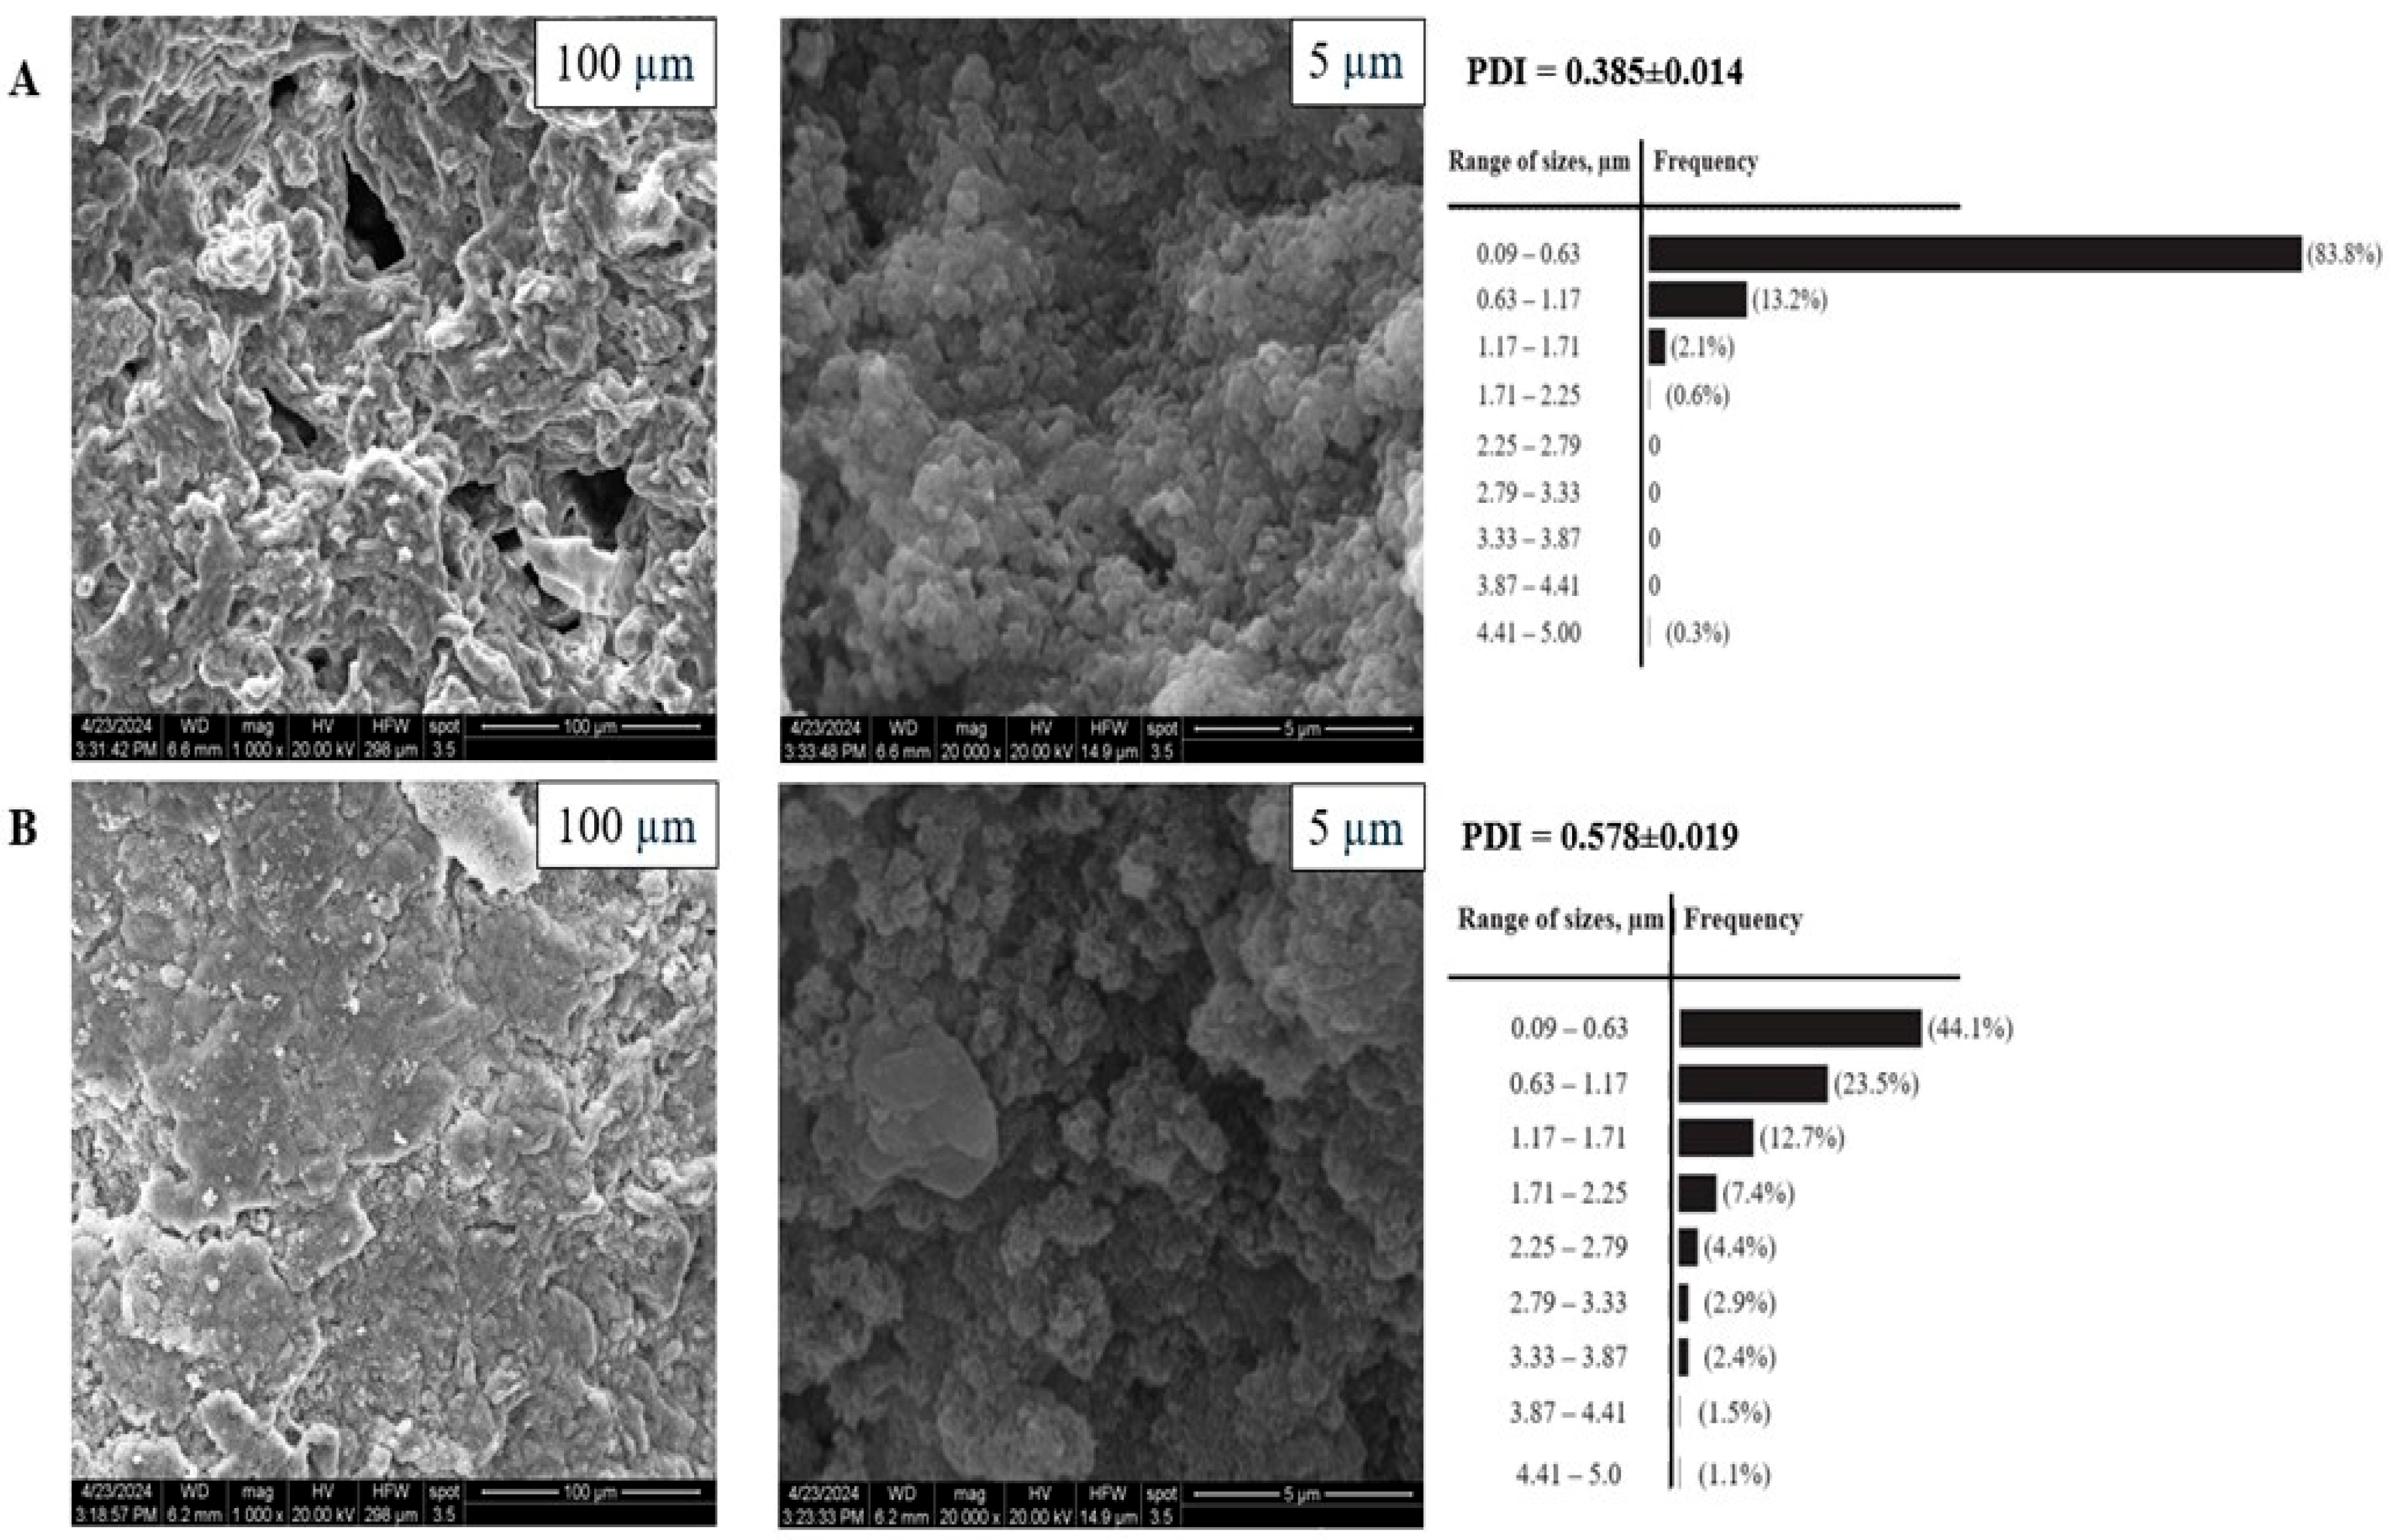
Scanning electron microscopy (SEM) was used to evaluate the surface morphology and measure the obtained particles size. Thus, Figure 4 shows SEM images of samples with different protein applications.
From the SEM images, it can be seen that the material is a polycrystalline structure with a monomodal size distribution for encapsulated BSA (average particle size 0.421 ± 0.015 µm, PDI 0.385 ± 0.014) and bimodal size distribution for chemisorbed BSA (average particle size 0.493 ± 0.022 µm, PDI 0.578 ± 0.019). This variation is possible due to the adding hydroxyapatite to already synthesized chitosan particles of different sizes. Images show that, depending on the protein application, the materials’ structures will also be different. Thus, particles with encapsulated BSA are characterized by larger crystallinity and pore formation in the matrix volume. For particles with chemisorbed application, crystallinity is less distinct, and the material has a film-like morphology with almost complete absence of pores.

3.3. Mathematical Model Selection of BSA Release from Particles

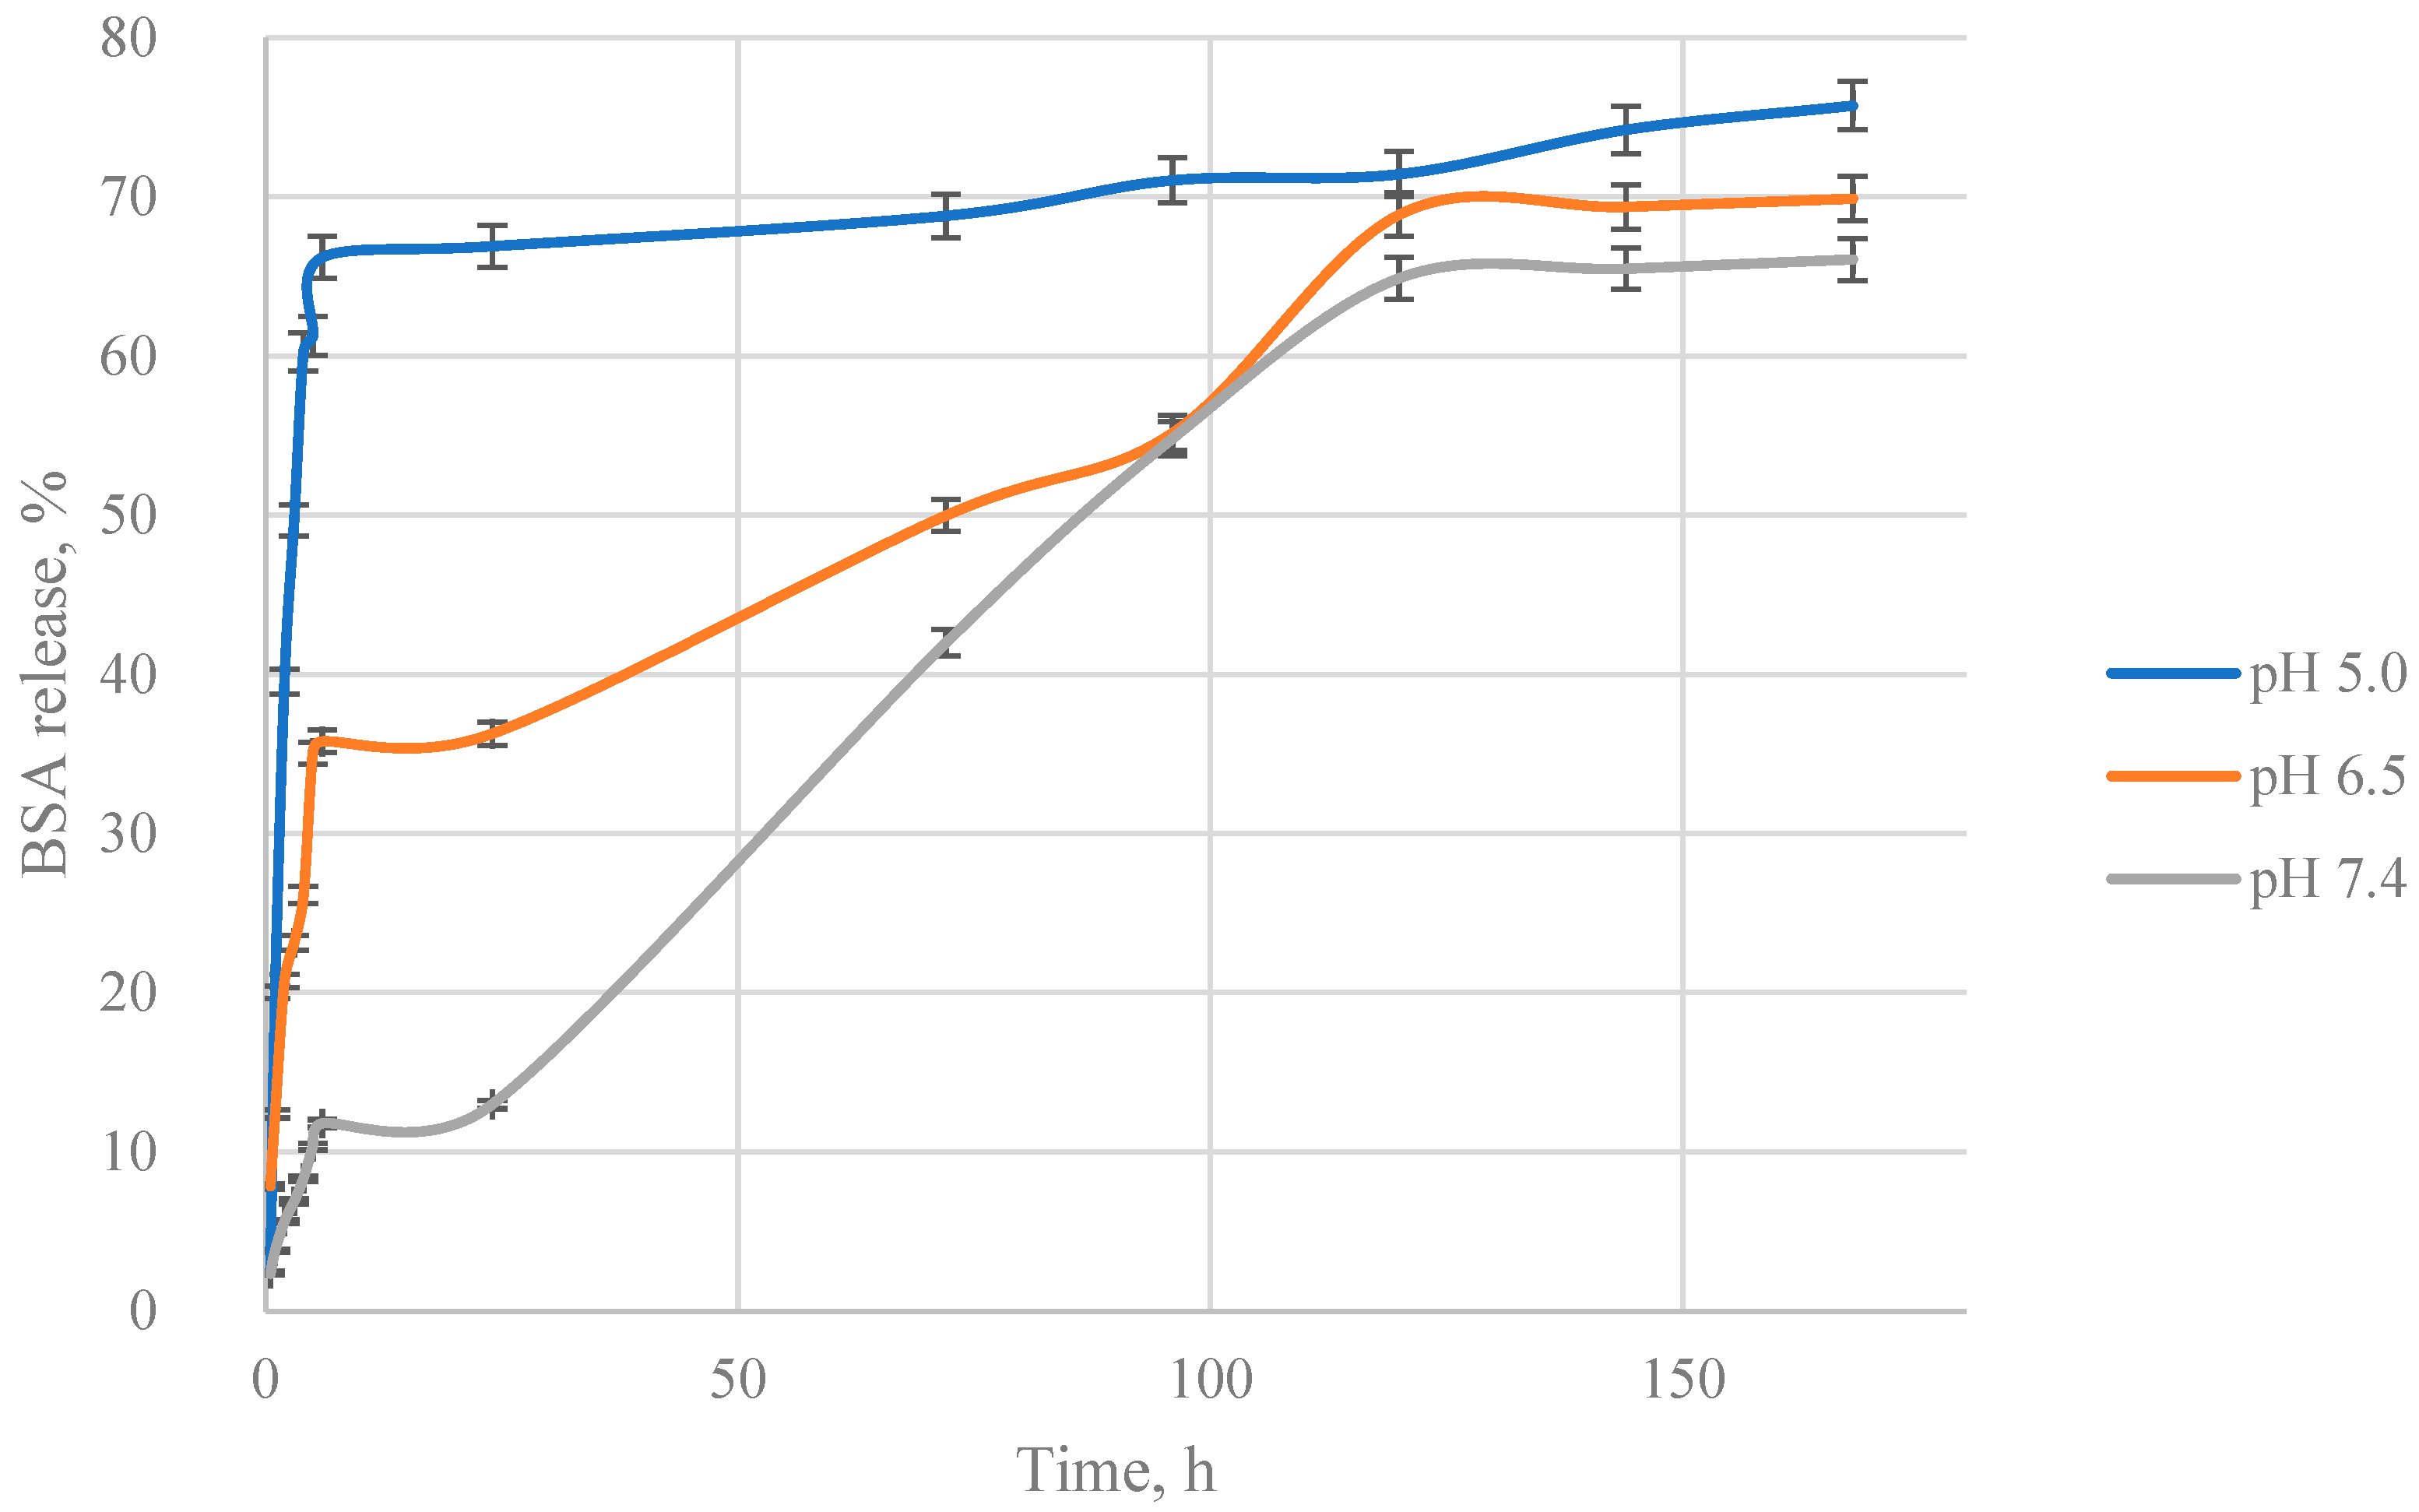
Two of the most important characteristics for drug delivery systems are the time and extent of drug release. Taking into account the matrix structure as well as the nature of the materials used, the delivery system described in this paper is pH-sensitive. To determine the kinetic parameters, a kinetic experiment was carried out for BSA release from the particles at different pHs. The release of encapsulated BSA is shown in Figure 5, and chemisorbed BSA is shown in Figure 6.
Figures show that the release in both cases of BSA incorporation approximately represents or tends to represent a logarithmic shape. Thus, the whole curve can be divided into two conditional stages. The first ranges from the introduction of particles into the solution simulating biological fluids up to a day (24 h), and the second ranges from 24 to 144 h. Each of these sections is described by its own equation, which introduces additional complexity in the description of kinetic parameters. The best release after one week is achieved at pH 5.0 and is numerically equal to 67.4 ± 1.3% for encapsulated BSA and 75.7 ± 1.5% for chemisorbed BSA. It is correlates with the chitosan particles’ sensitivity (which comprise the whole matrix framework) to swelling pH. At pH 7.4, the particles shrink due to chitosan’s low charge density, which prevents release. At pH 5.0, partial dissociation of bonds and dissolution of the matrix can occur, resulting in rapid BSA release.
The hydroxyapatite incorporation into the matrix structure also plays a role. In the case of protein encapsulation, when the chitosan matrix is disrupted, the dynamic release–precipitation equilibrium shifts, and the protein is deposited on newly formed chitosan conglomerates and/or on undissolved hydroxyapatite particles. In the case of chemisorbed protein application, this dependence is less distinct because the film-like structure of chitosan particles is “protected” by hydroxyapatite and is less susceptible to dissociation.
The constructed cumulative kinetic curve gives an indication of the release rate and profile (the profile is the kinetic curve shape). A change in profile is associated with a change in the release mechanism. For example, the application of an additional coating may change the release from controlled to delayed release when the concentration at the beginning of the process increases very slowly. The release curve analysis involves mathematical data processing to determine the functional dependence of the change in drug concentration in the medium over time: obtaining the function equation or the coefficients’ numerical value in the equation that have a physical meaning. Otherwise, “prediction” of the dependence value between experimental points is performed by connecting them by a regression line (trend line). The choice of mathematical model depends on the delivery system’s composition and structure, as well as on the resulting release curve. The mathematical model adequacy criterion are the correlation coefficient (R) and the determination coefficient (reliability of approximation, R2). The correlation coefficient and determination coefficient are important factors and measures of the extent to which the regression line represents the actual experimental data. When the regression line passes exactly through every point on the relationship graph, it will be able to predict the change in one variable when the other variable changes. The farther the line moves away from the points, the lower the accuracy. The best model describing the drug release profile is identified using the determination coefficient (R2) to assess the model equation fit. Typically, this value tends to increase as more parameters are added, regardless of the model variable’s significance. When comparing models with different numbers of parameters, the adjusted determination coefficient (adjusted R2) is more appropriate. Thus, the experimental drug release data mathematical processing consists of the following steps:
(1)
Construction of a dot plot of the drug concentration dependence in the test liquid on time or the released substance fraction on time.
(2)
Initial estimation and selection of the mathematical model. For example, if the dependence is close to linear, then linear approximation by the first-order model (zero order release) is first used.
(3)
Calculation of the adjusted determination coefficient (R2). The closer R2 is to unity, the higher the reliability of approximation and the more the mathematical model reflects the real experiment.
(4)
Use the model coefficients to describe the release mechanisms.

3.4. Mathematical Model Chosen for BSA Release from Particles

Based on the release curves’ general appearance in Figure 5 and Figure 6, a fairly clear separation between stage 1 and stage 2 release can be observed. The appearance of the first release stage is described by an explosive effect and can be described by a zero-order model. The zero-order model is characterized by the following equation:
M t M = k t ,
where M t M is the protein release fraction at time t; k is a constant accounting for the structural characteristics of the matrix.
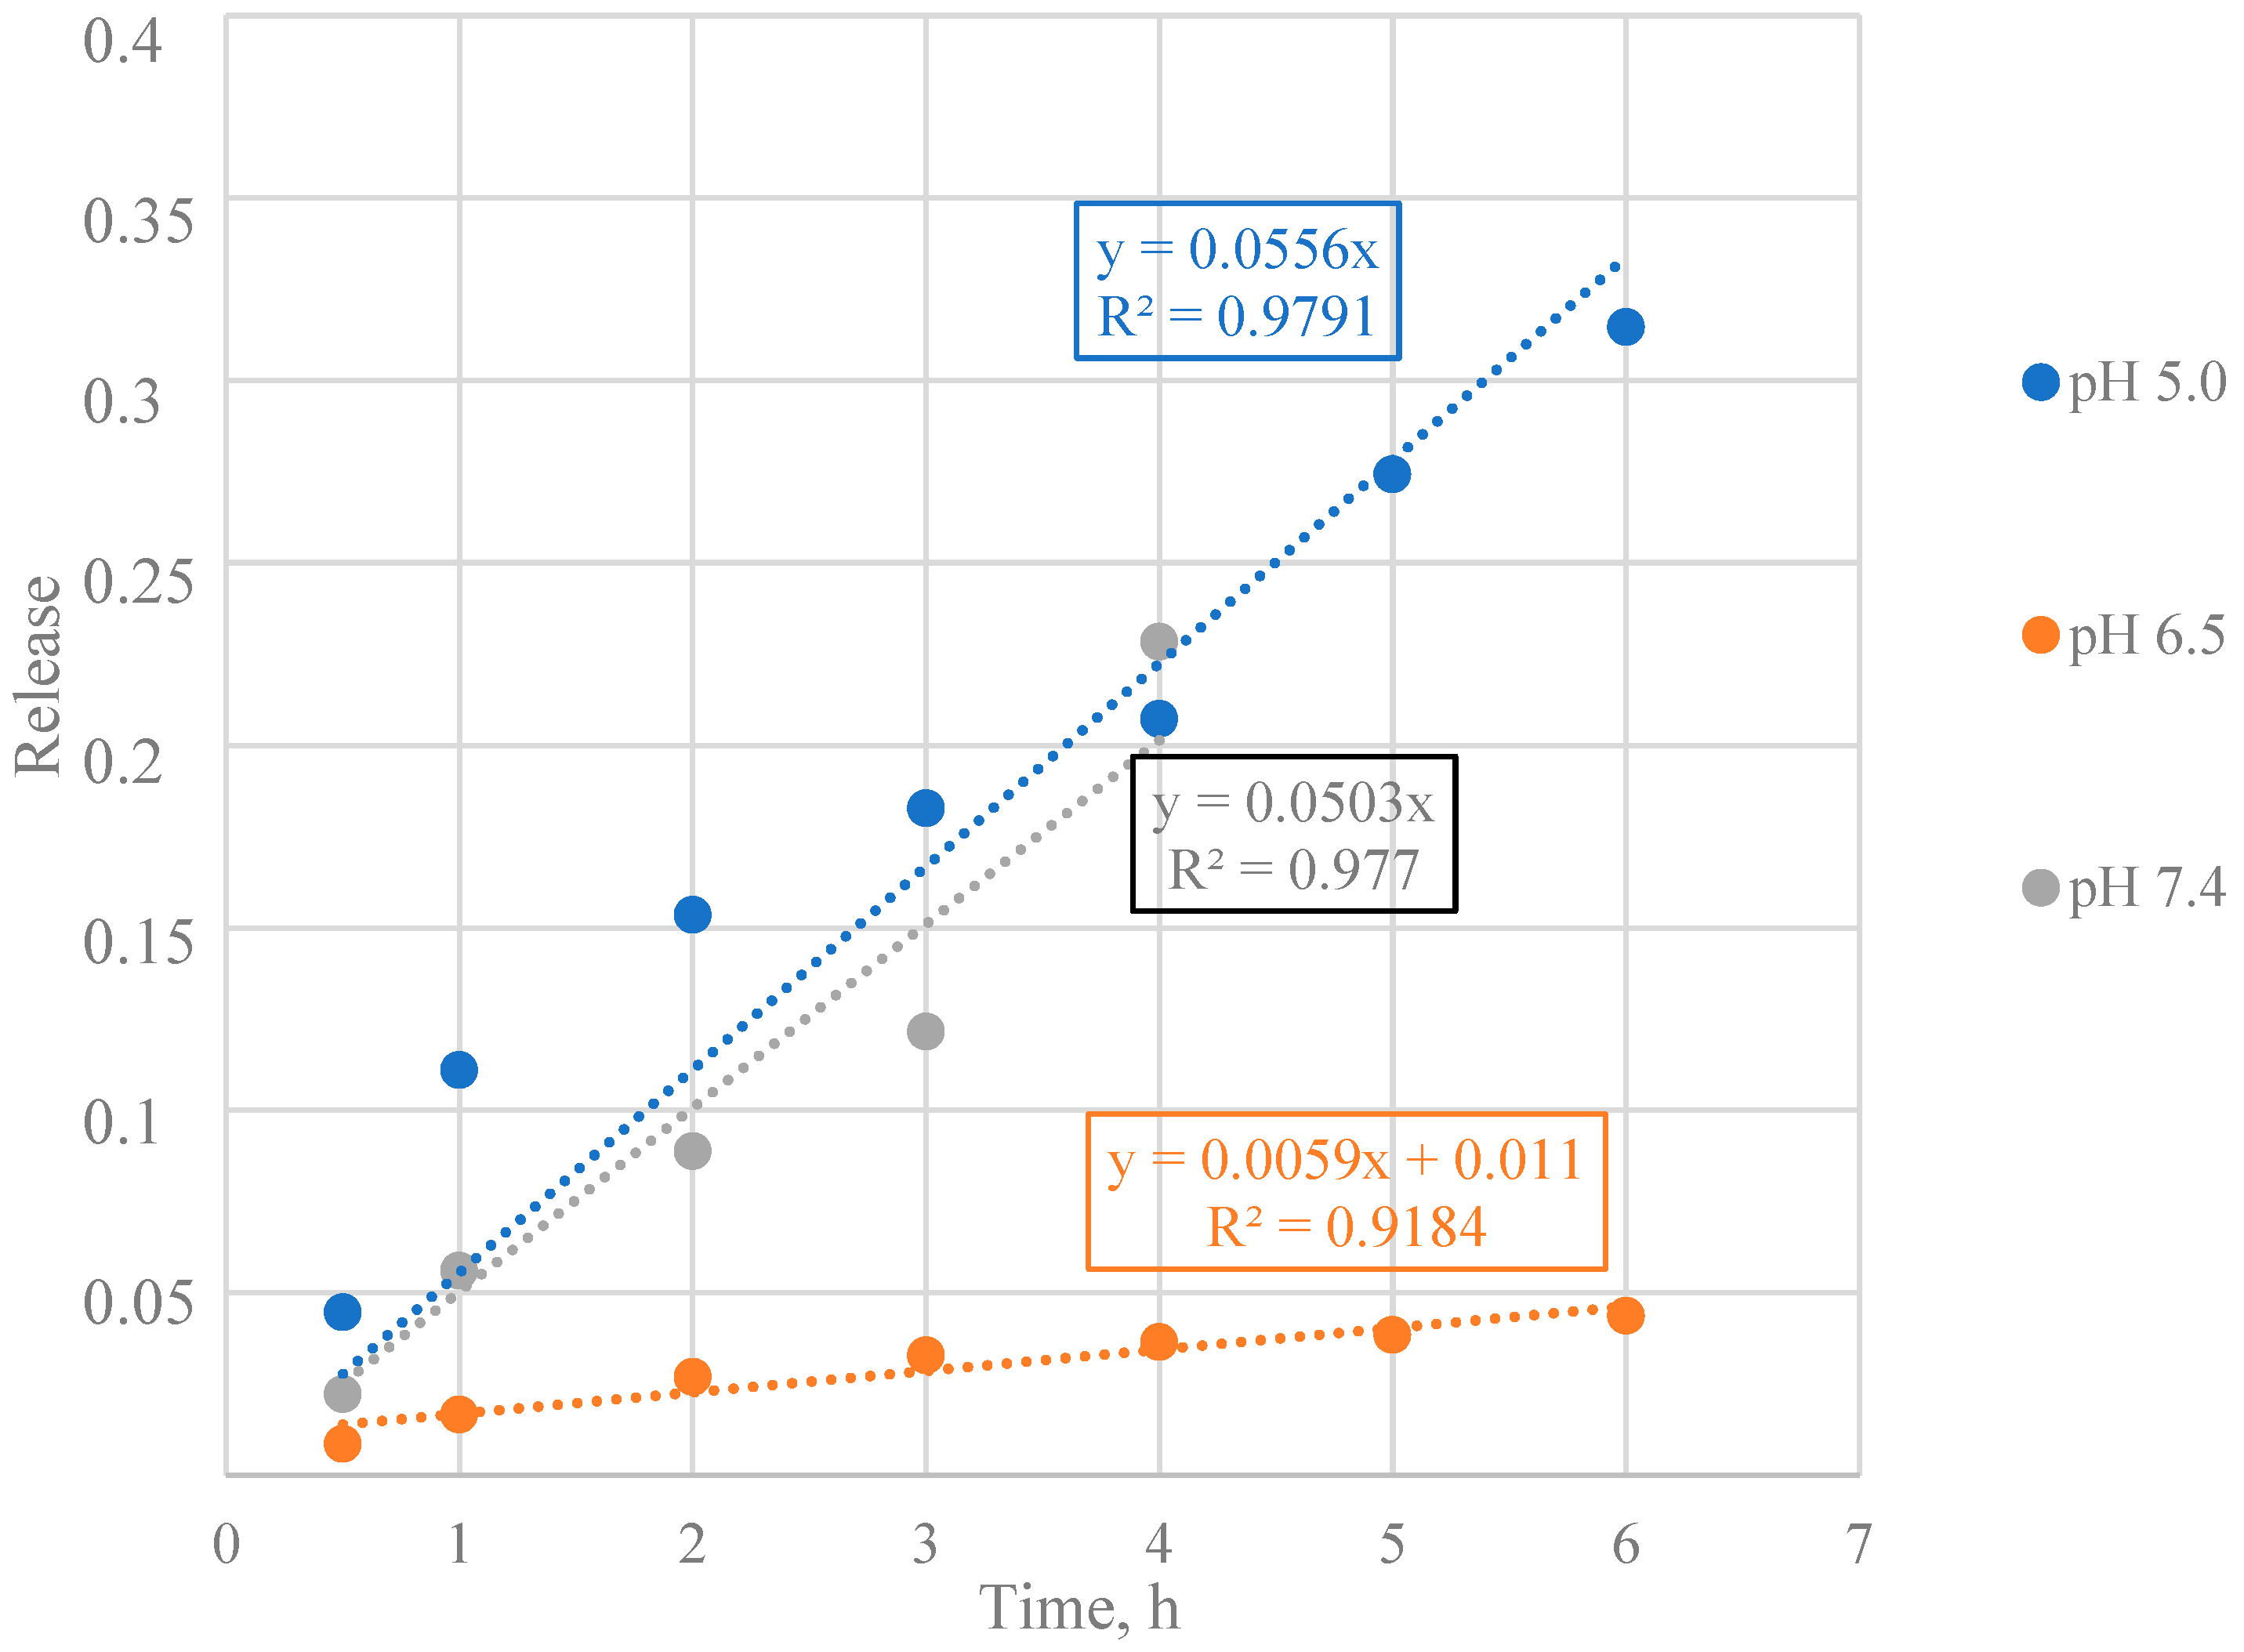
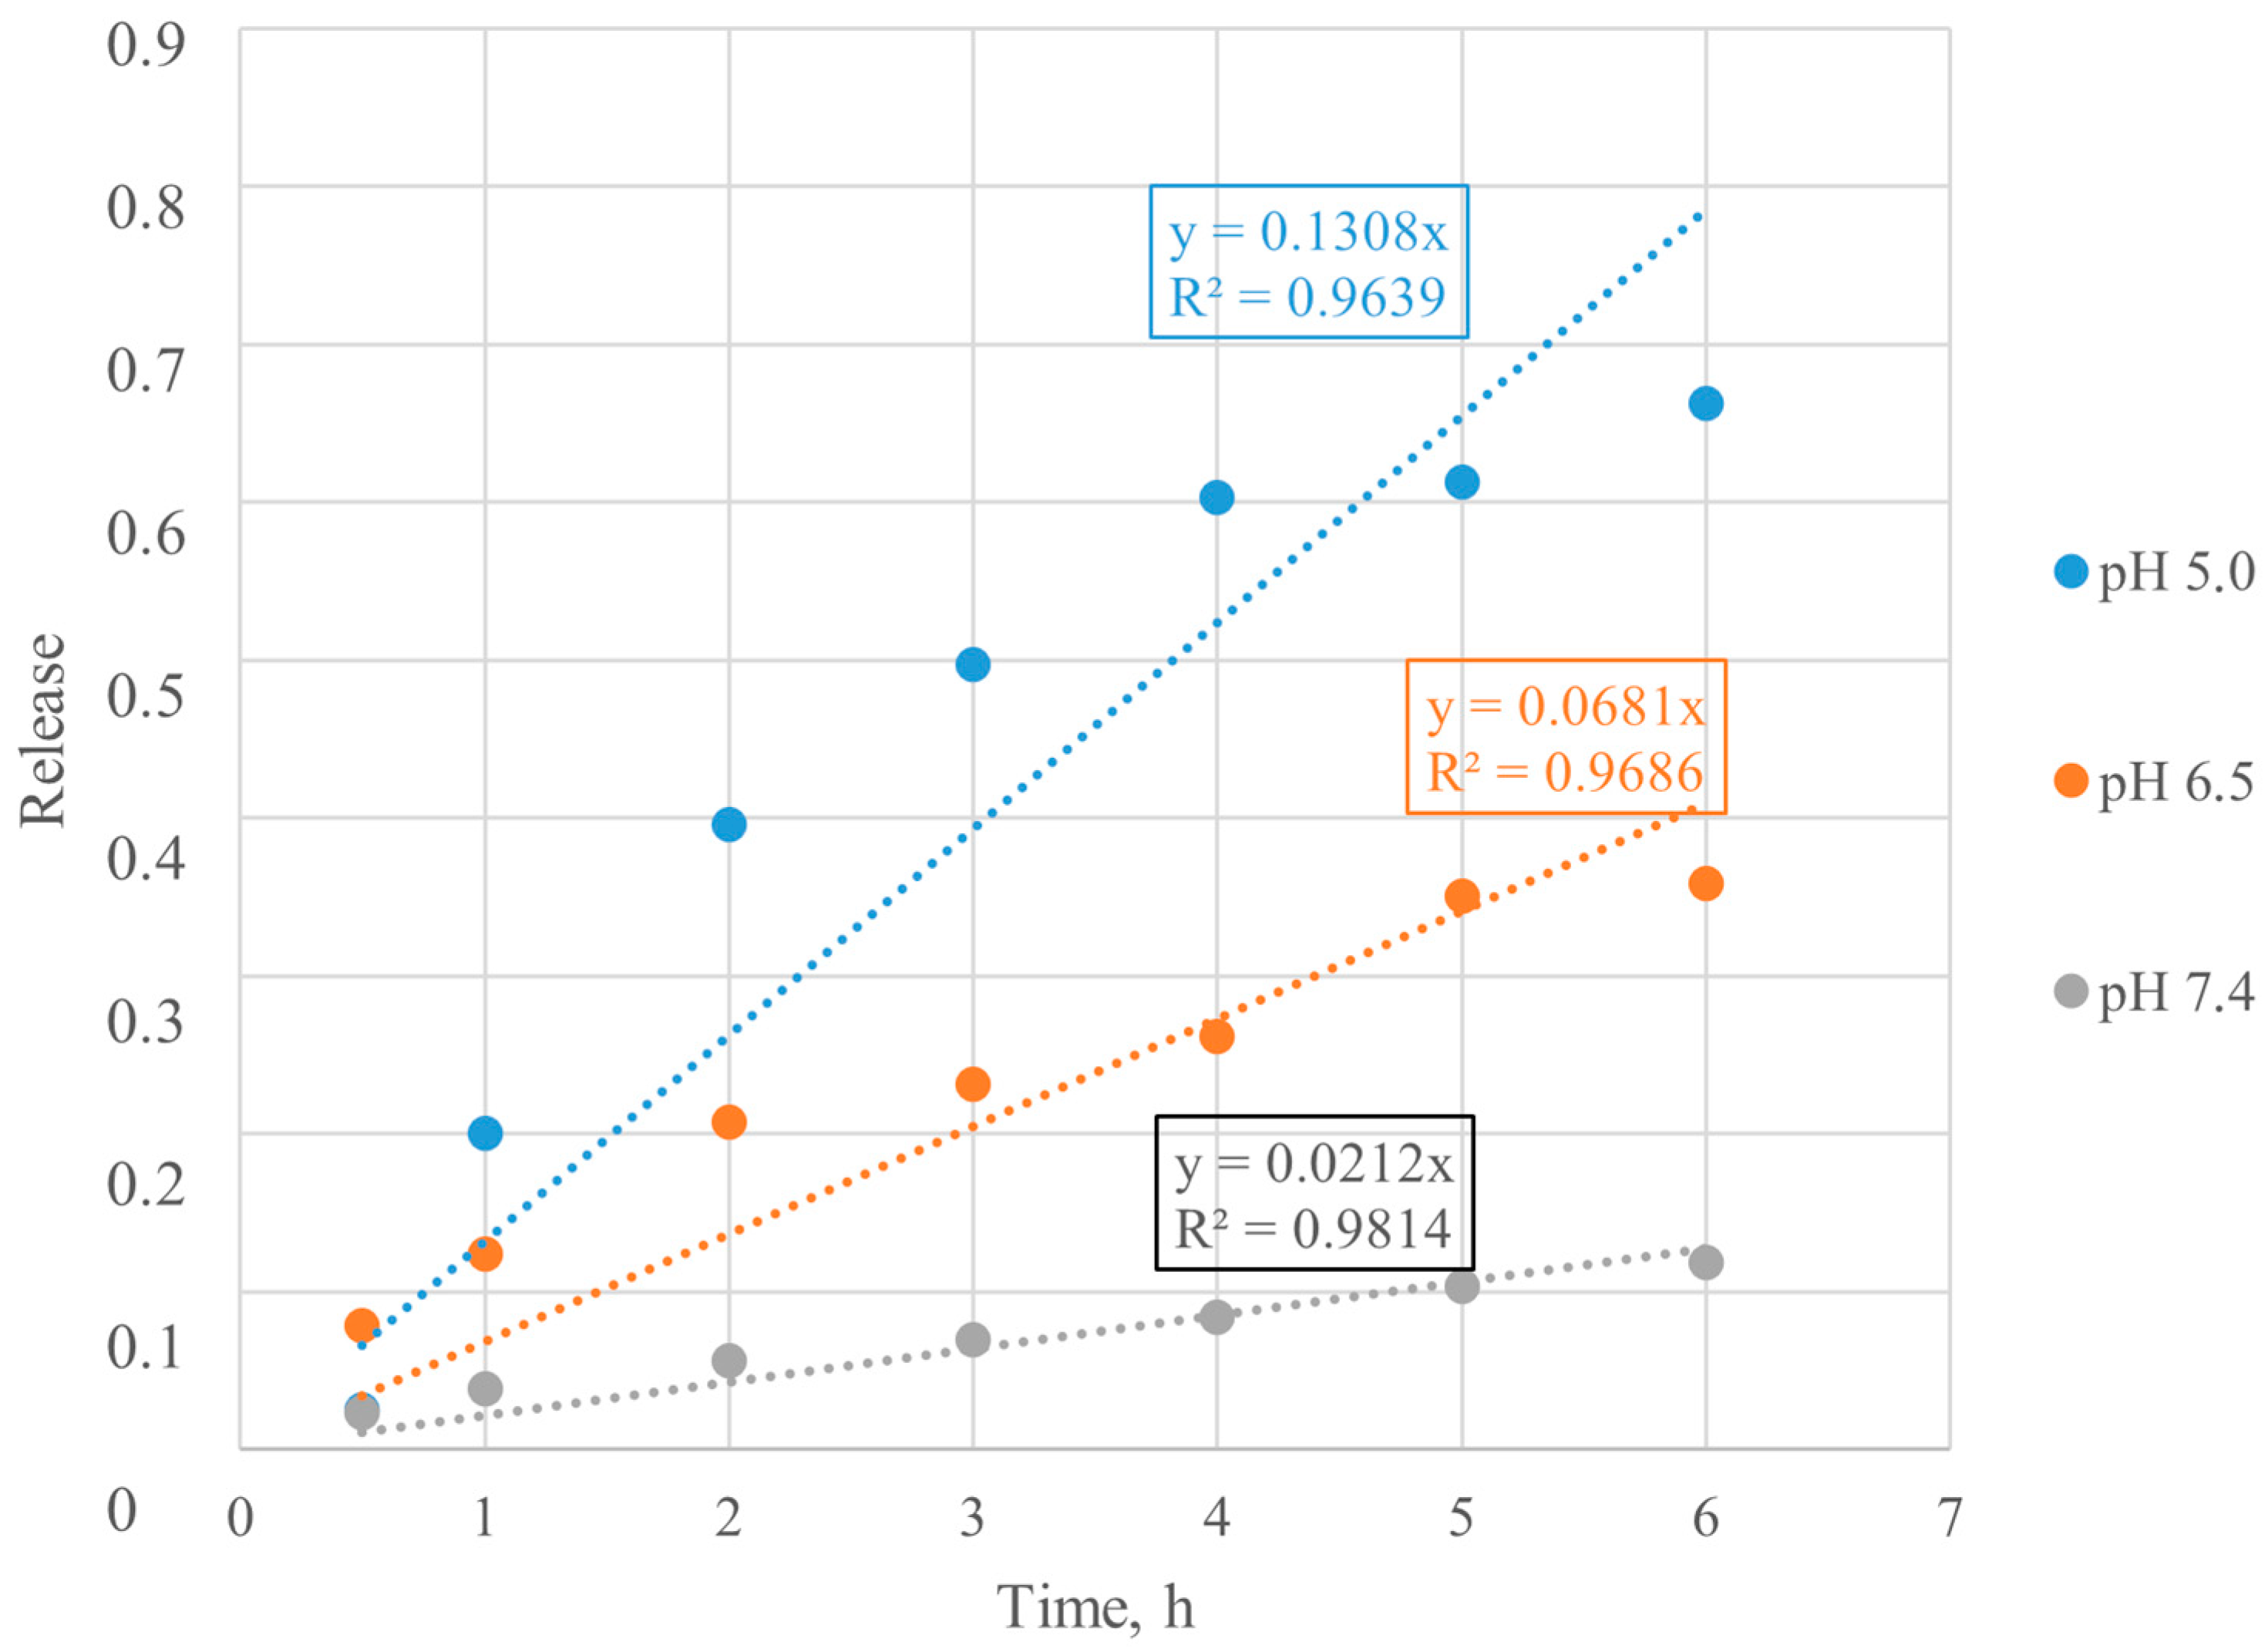
The description of the first step in the zero-order model of encapsulated BSA is presented in Figure 7 and that of chemisorbed BSA in Figure 8.
The R2 for each release is above 0.9, indicating a high accuracy of description by this model. A similar dependence is observed when describing the second stage of release by the zero-order model.
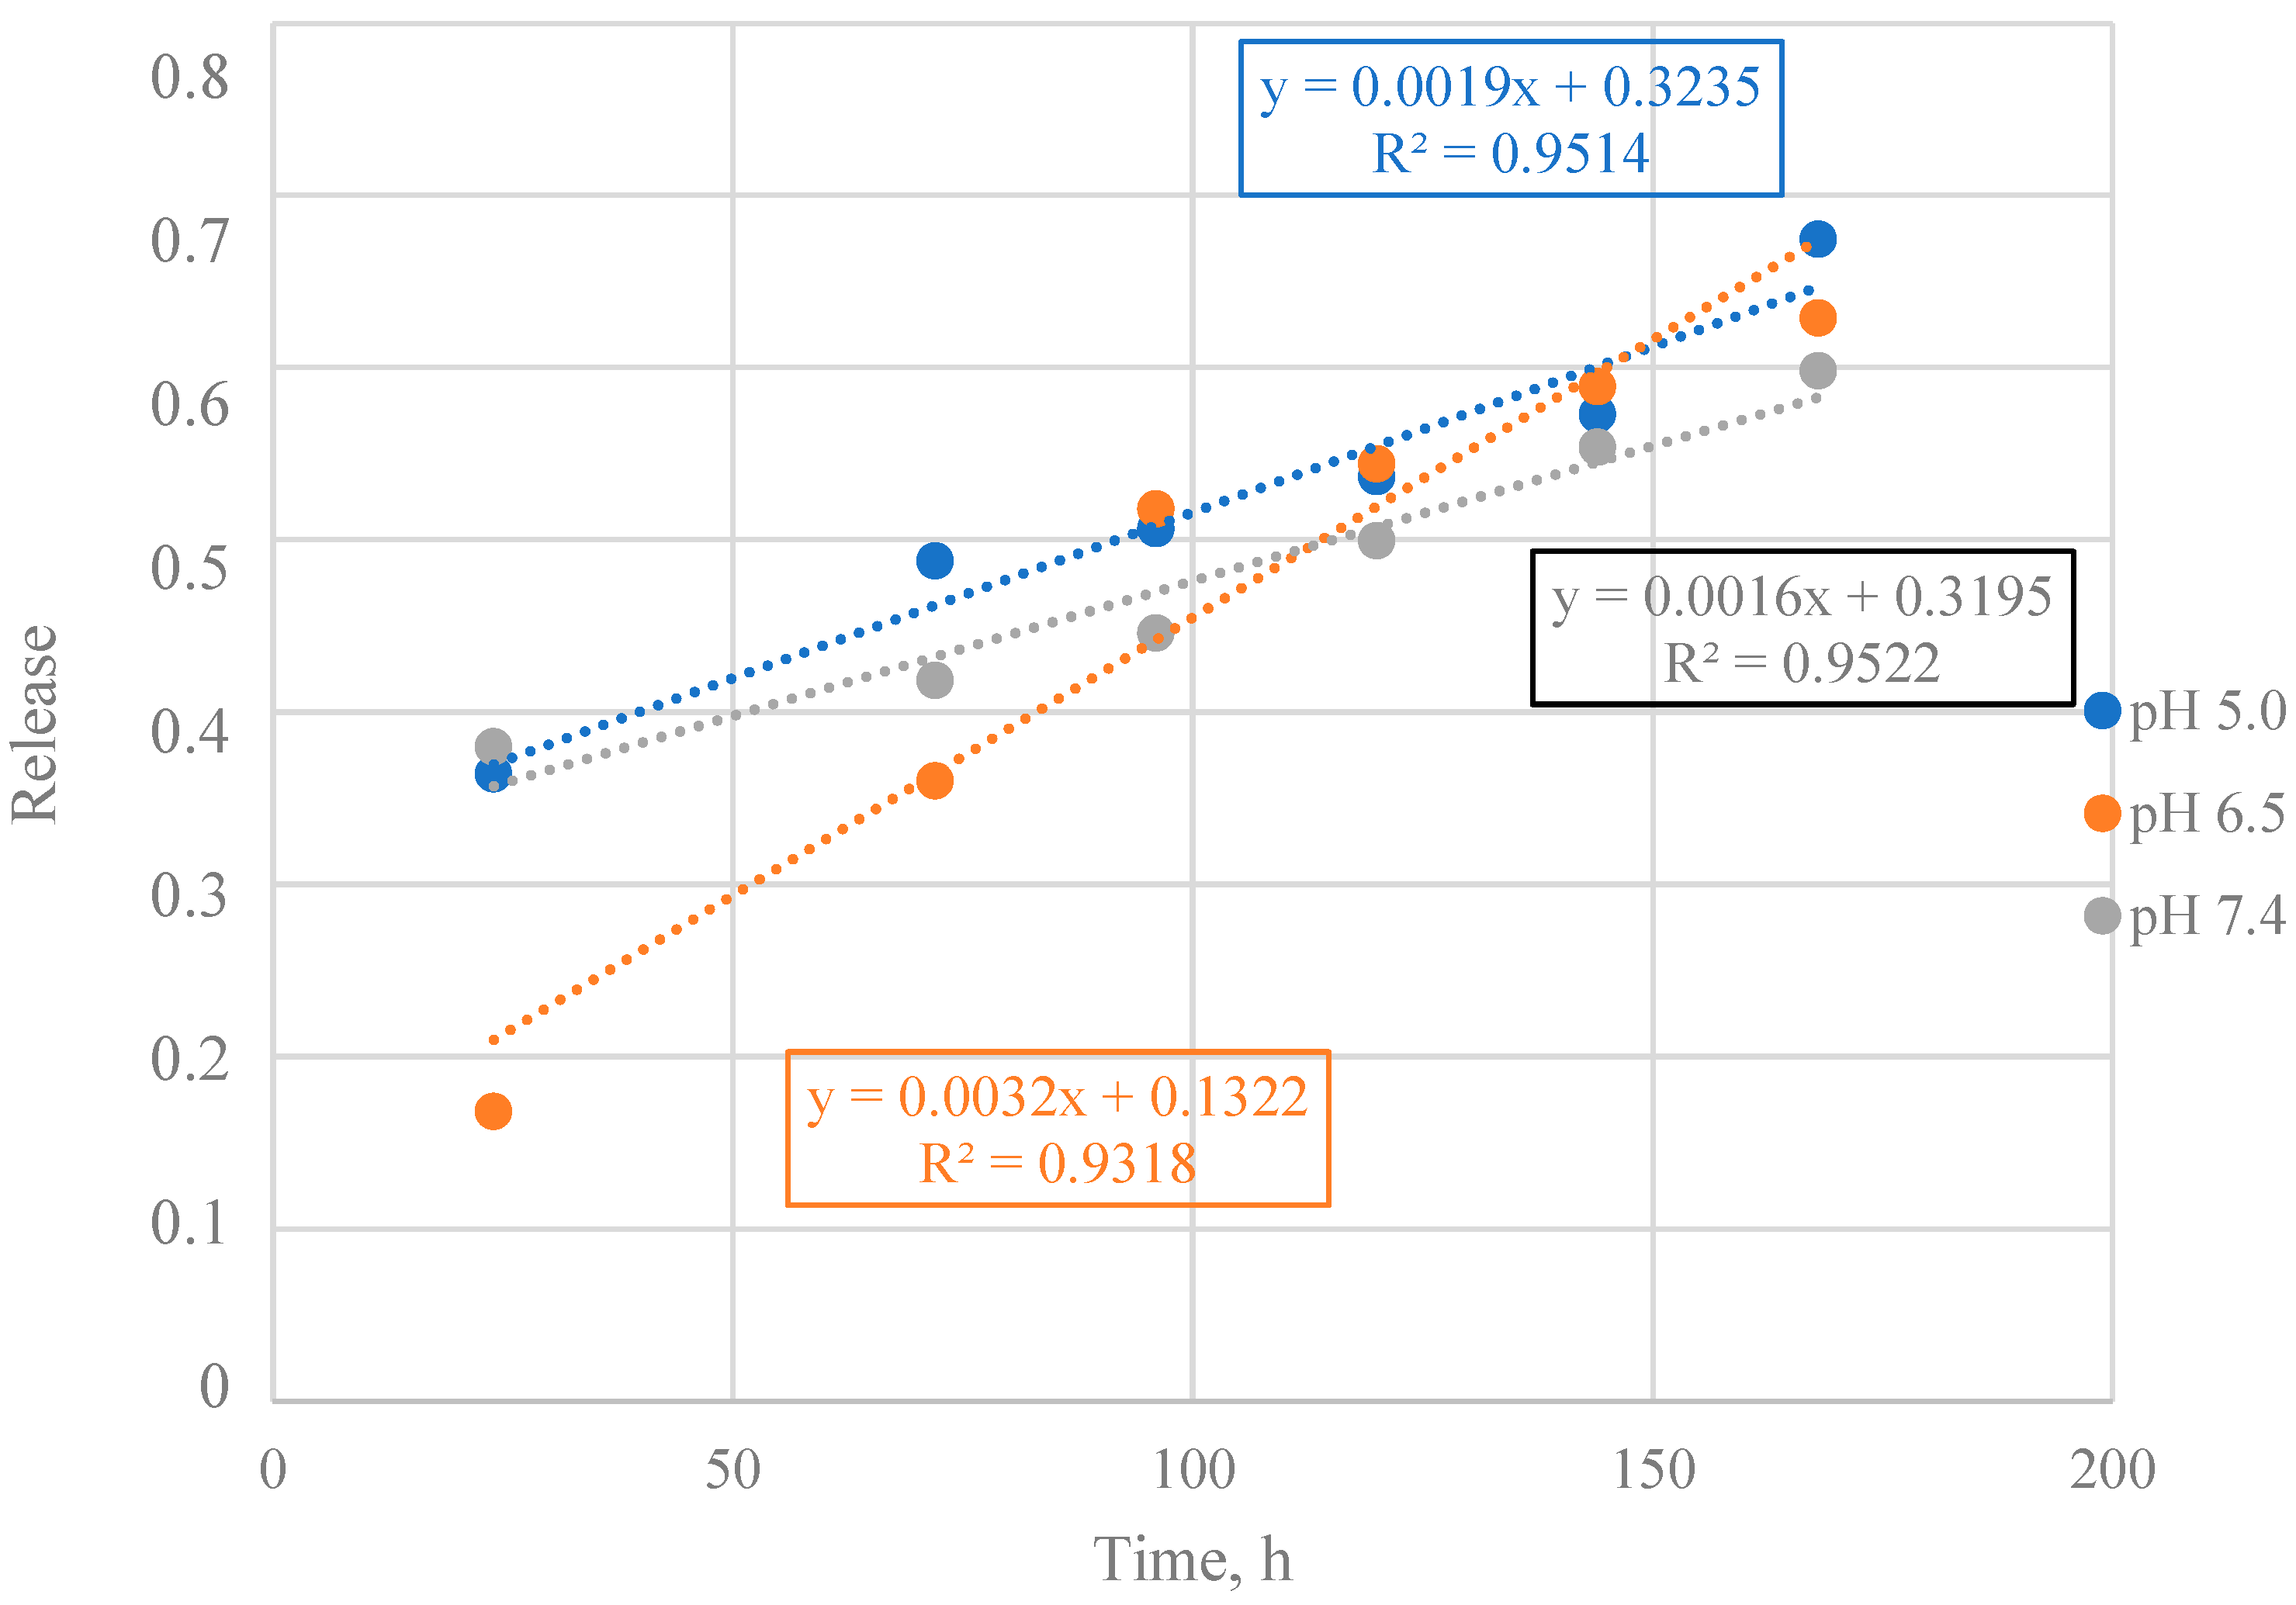
The release of encapsulated BSA is shown in Figure 9 and that of chemisorbed BSA in Figure 10.
Figure 9 and Figure 10 show that the zero-order model describes the second stage of BSA release just as well. R2 values in this case are also greater than 0.9 for all curves. However, in the transition from the piecewise-defined function to the full release curve, the R2 value drops sharply, which corresponds to the physical meaning of the zero-order model.
The release in both stages of encapsulated BSA is shown in Figure 11 and for chemisorbed BSA in Figure 12.
This pattern, with a characteristic drop in R2 for the curves with the largest burst effect, is explained quite well by the physical meaning of the zero-order model. This model is mainly used for osmotic pump systems as well as for transdermal systems, matrix tablets with poorly soluble drugs, and coated dosage forms.
Another model for describing release is the first-order model. It is described by the following equation:
ln 1 M t M = k t
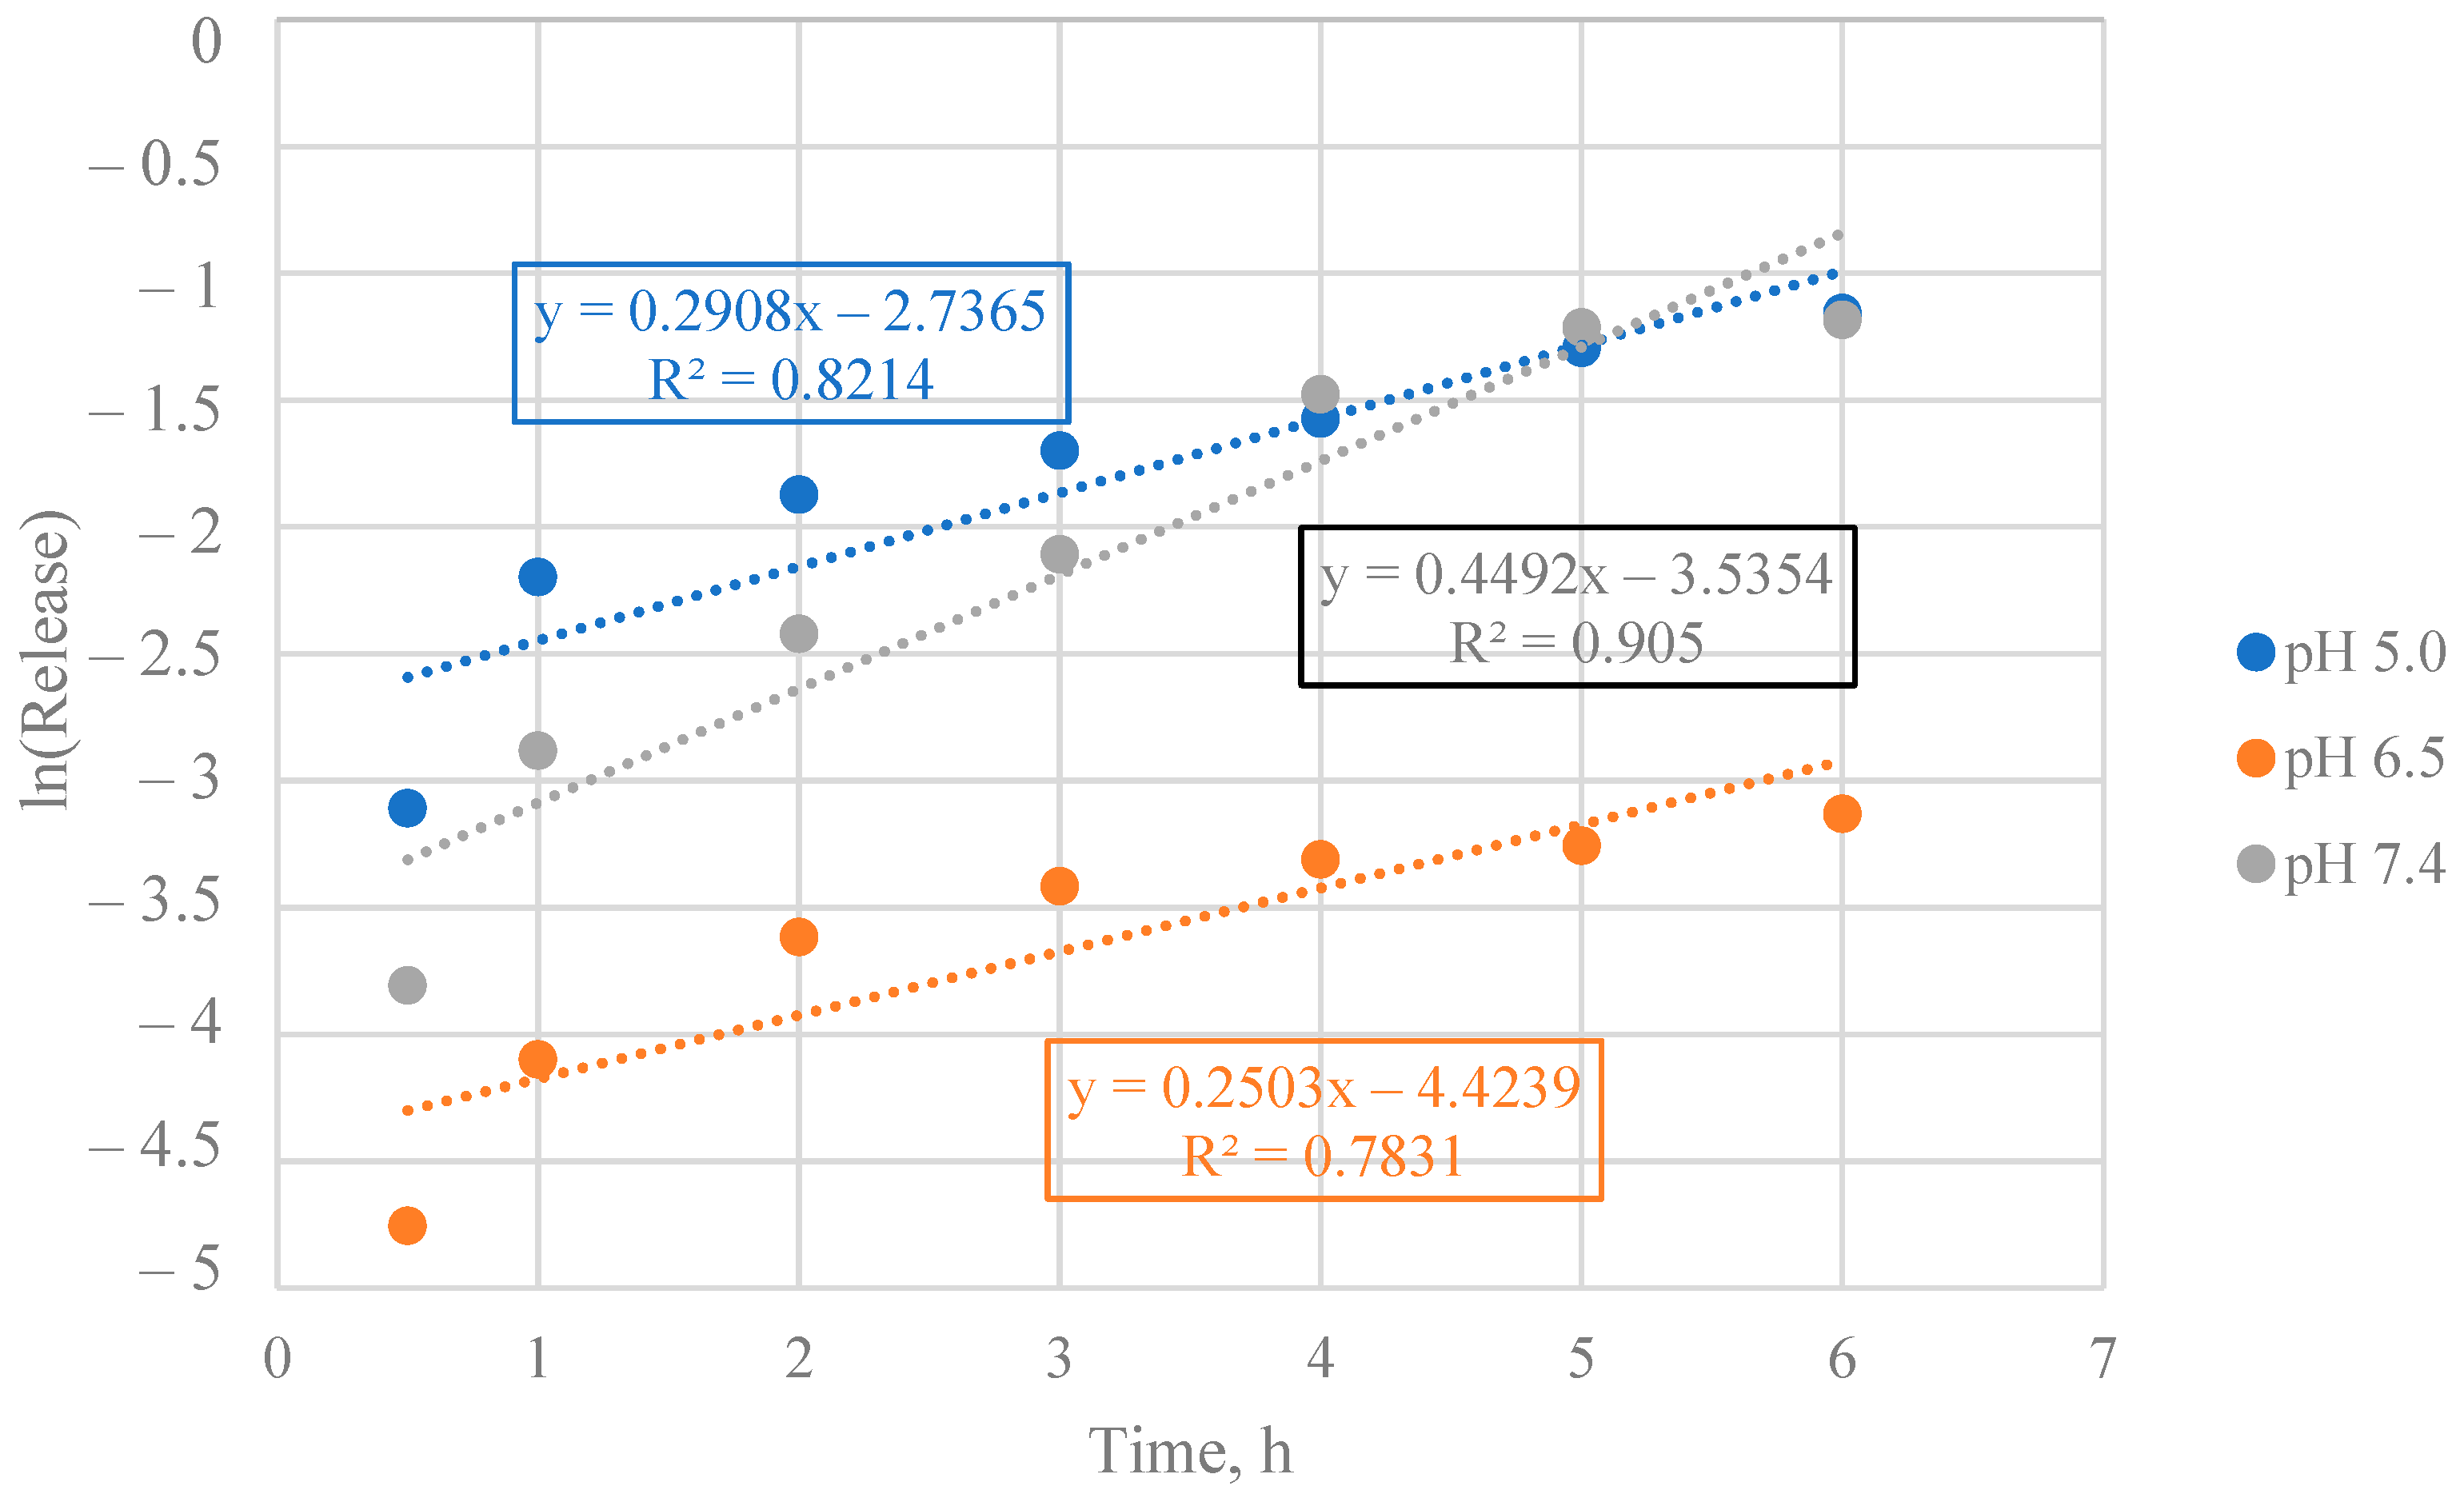
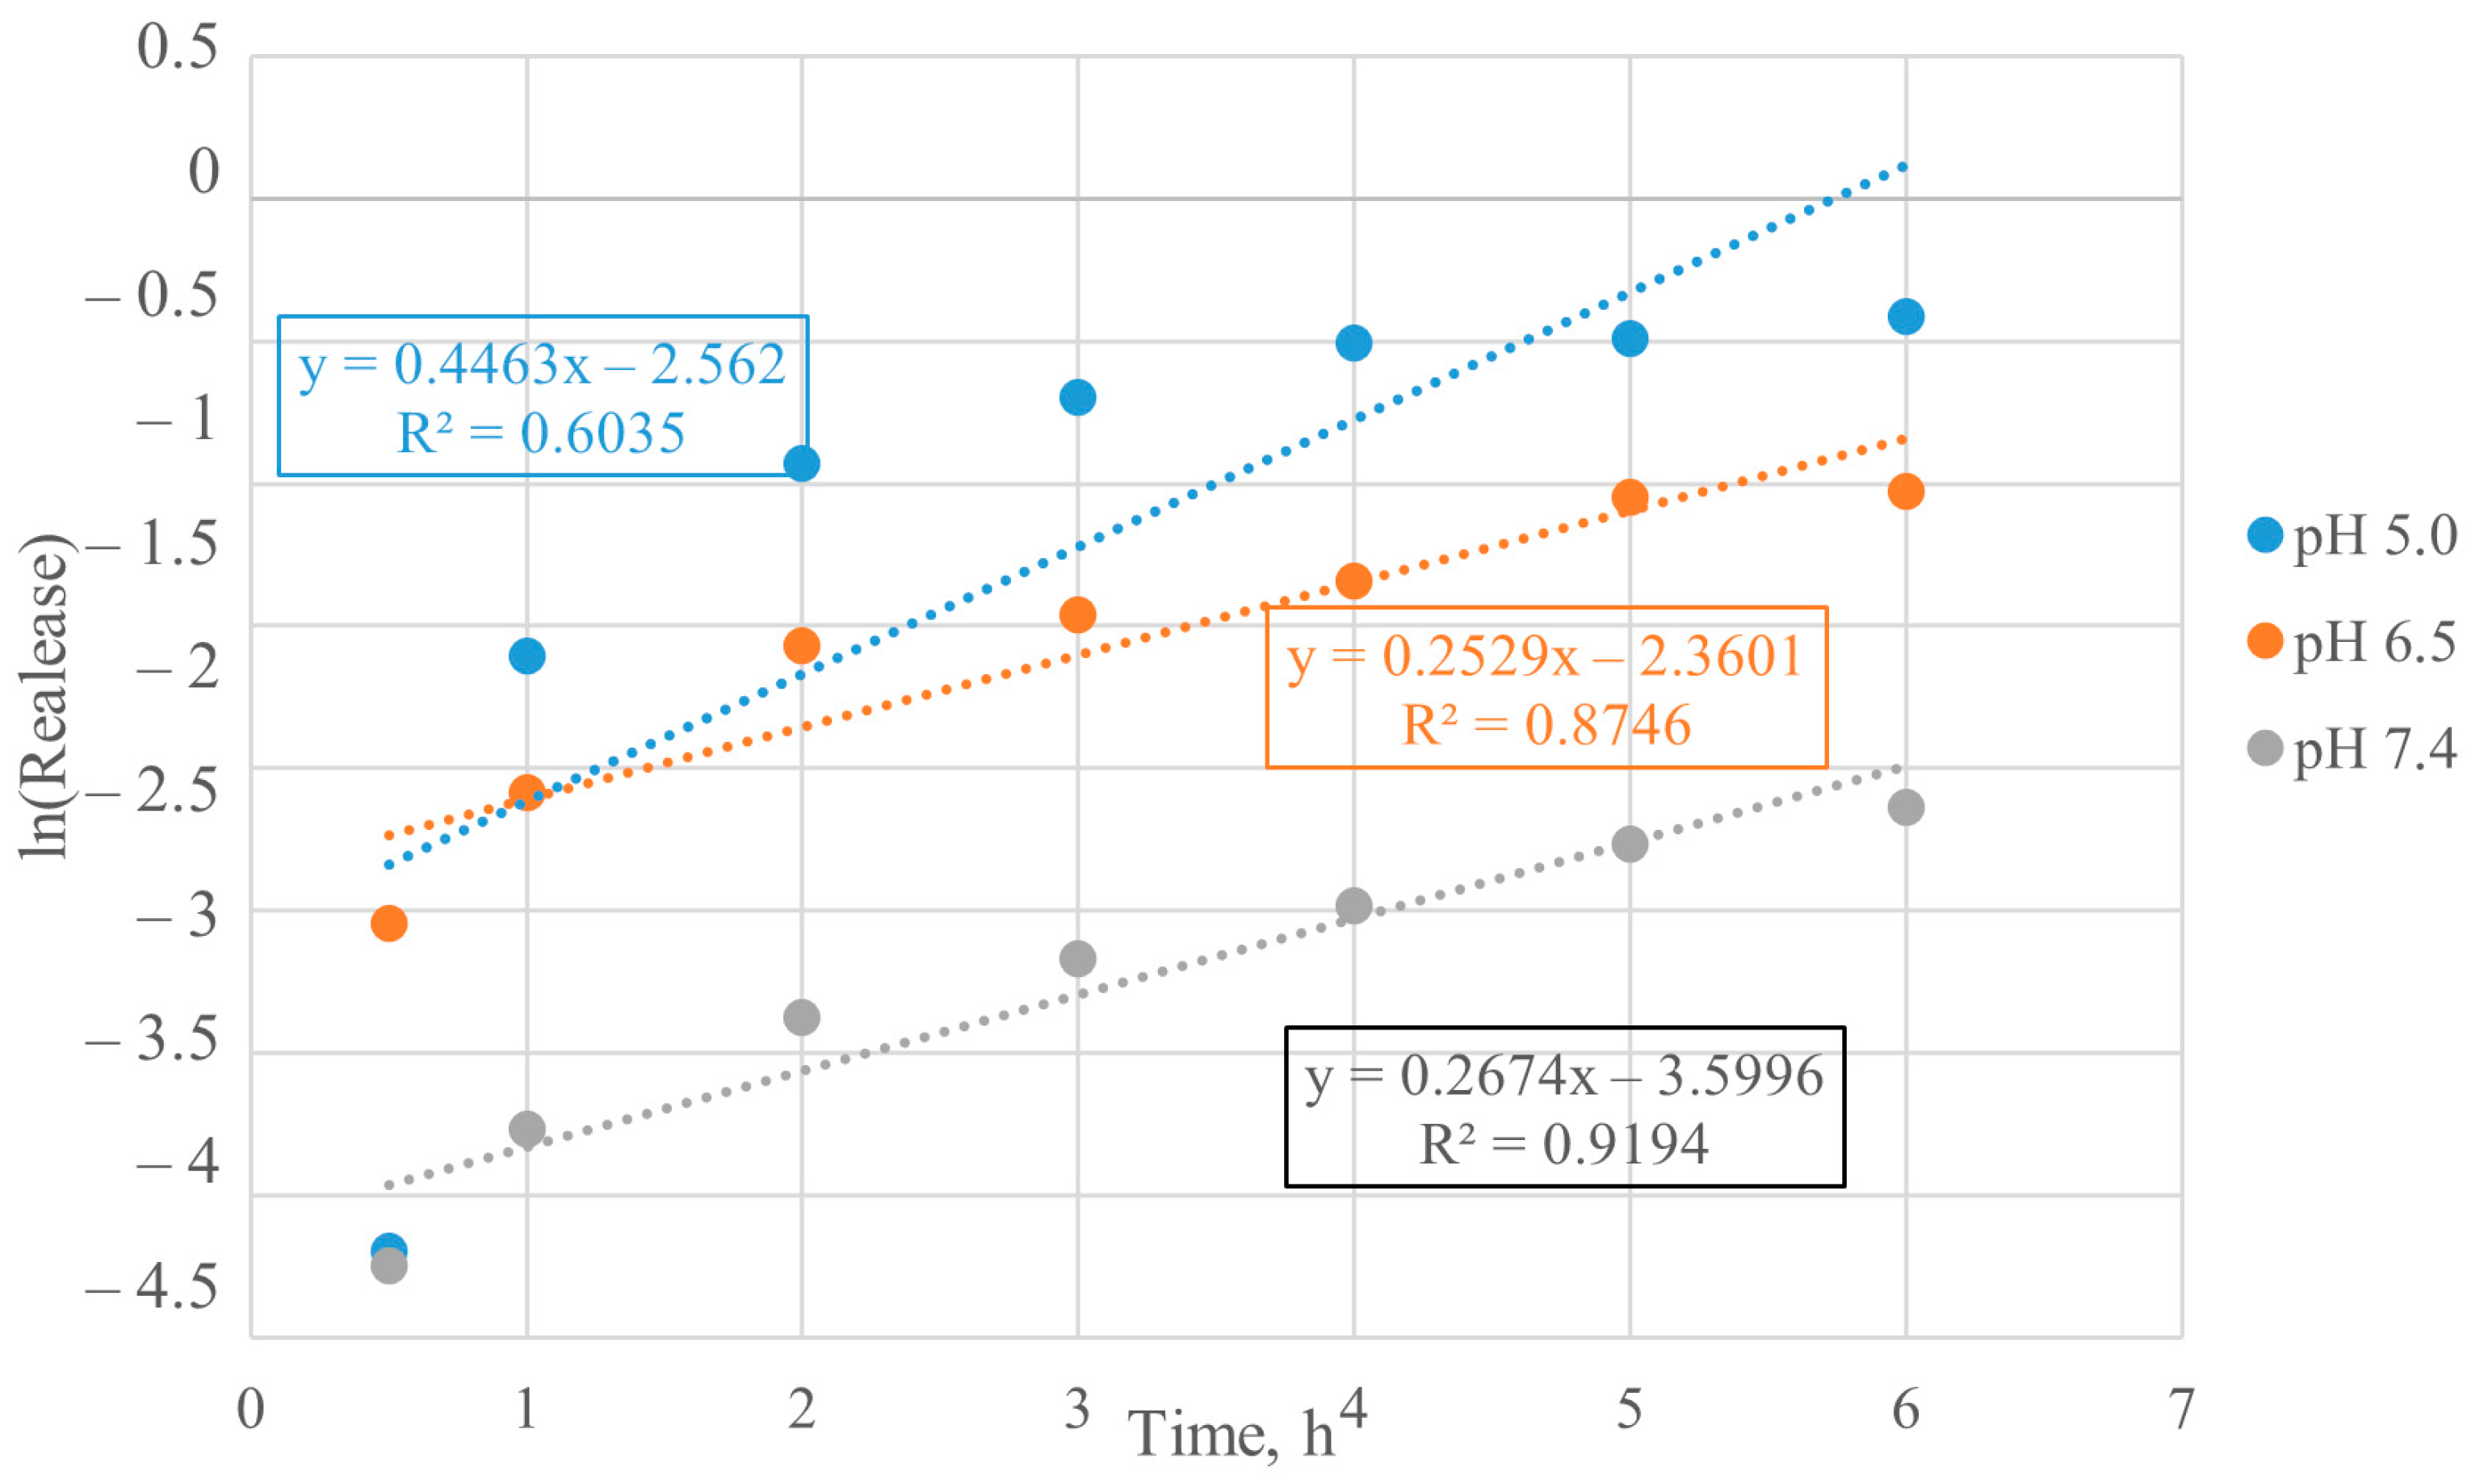
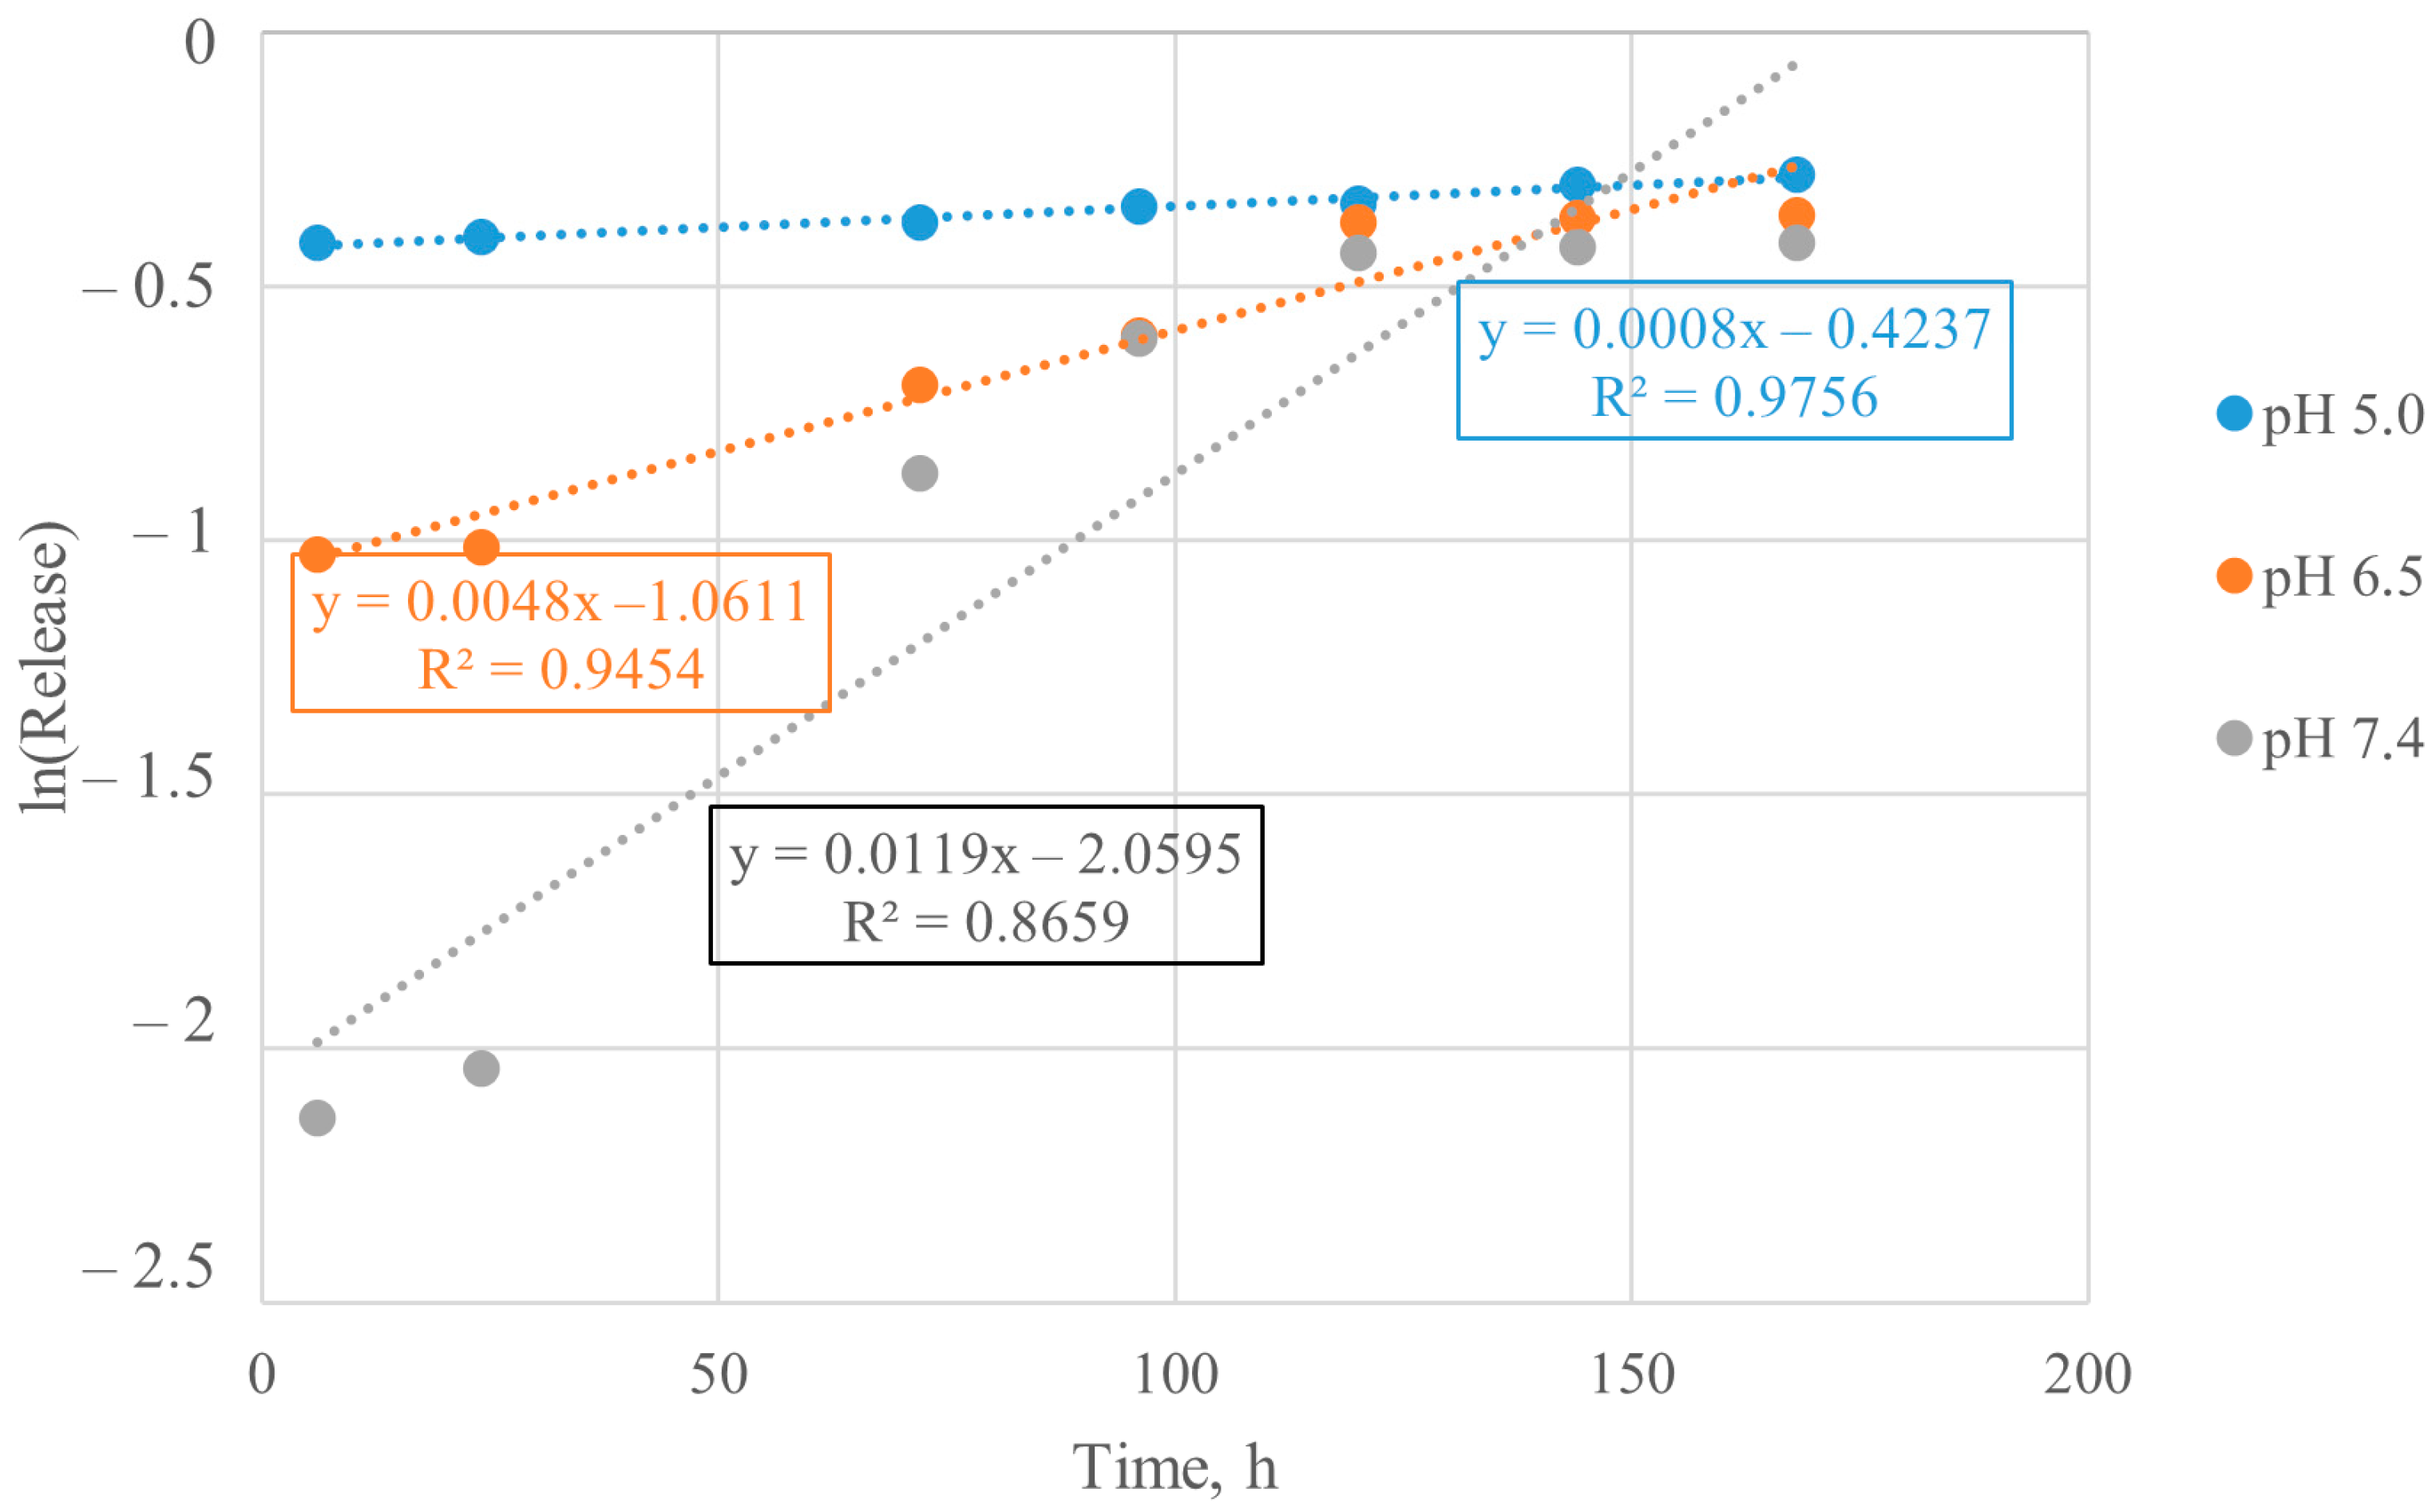
However, this model did not prove to be a good fit either. First, it is more often used to describe the release of water-soluble drugs from porous matrices. In this delivery system, pores are only partially present in encapsulated proteins. The description by this model of the first release step for encapsulated BSA is shown in Figure 13 and for chemisorbed BSA in Figure 14.
Quite high R2 values are also shown for the second release step. Thus, the release described the first-order model is shown in Figure 15, and the chemisorbed release is shown in Figure 16.
However, this mathematical model cannot be used because its R2 does not exceed 0.75, and in the worst cases (for pH 5.0) remains below 0.35.
Another mathematical model is the Higuchi model. This model is used to describe water-soluble and poorly water-soluble drugs incorporated in semi-solid and solid matrices. Based on the definition, this model should fit best because it is applied to systems that are synthesized. This model is described by the following equation:
M t M = k t 1 / 2 ,
This model cannot describe each of the release stages with reliable accuracy, but it is well suited for describing the whole curve. The release according to Higuchi’s model for encapsulated BSA is shown in Figure 17, and for chemisorbed BSA in Figure 18.
The small deviation in the case of chemisorbed BSA at pH 5.0 may arise from the abrupt transition from explosive release to controlled release. As can be seen from Figure 16 and Figure 17, the Higuchi model is currently the best mathematical model for describing the release of BSA from synthesized particles.
However, despite the high value of model approximation with real data, Higuchi’s model still cannot give us enough information about the release kinetics of BSA. The Korsmeyer–Peppas model described by the following equation can cope with this task:
ln M t M = n ln t + ln k ,
There is an extremely important parameter in this equation, n. This is the rate of release, indicating the mechanism of release. The Korsmeyer–Peppas model was proposed to describe release from cylindrical tablets. Depending on the value of n, different mechanisms are distinguished, as shown in Table 2.
Fick diffusive release occurs by normal molecular diffusion of a substance due to chemical potential difference. Relaxation release (case II) involves stresses and changes in phase states in hydrophilic glassy polymers that swell in water or biological fluids. This case also involves chain unraveling and erosion of the polymer. The release described by the Korsmeyer–Peppas model for encapsulated BSA is presented in Figure 19 and for chemisorbed BSA in Figure 20.
The Korsmeyer–Peppas model provided important information about the release mechanism but still cannot be applied for calculation of kinetic parameters.

3.5. Calculation of Kinetic Parameters of BSA Release from Particles

As can be seen in Figure 18 and Figure 19, the values of n are approximately equal, being in the same range. Table 3 collects information on the mechanisms for each release analyzed.
The heterogeneity of release at different pHs may be related both to the inaccuracy of the Korsmeyer–Peppas model for these systems and to the premature achievement of a dynamic release–relaxation equilibrium. Considering that the values at pH 6.5 and 7.4 are distinguished, the option with dynamic equilibrium seems more plausible.
The calculated kinetic parameters are presented in Table 4.
The drop-out values at pH 6.5 for encapsulated BSA and at pH 7.4 for chemisorbed BSA are consistent with other release mechanisms. It is possible that the effect of matrix swelling and relaxation leads to a strong decrease in the order of protein release due to the appearance of an equilibrium between release and relaxation.
The obtained data on protein release can be compared with some other similar studies. Thus, the particles considered in an article [25] did not have an intense burst release at the initial stages without incubation at elevated temperatures, and the total release over 10 days at pH 5 was less than 50%. An article [26] showed a more active release, 80–90% for pH 5.5, but with an increase in pH to 7.4, the release value rapidly drops to 20%, in contrast to 60% for the complexes obtained in this article.
In the future, it is planned to consider the effect of crosslinking on the release mechanism and its kinetic parameters. At the moment, adipine and/or glutaraldehydes have been selected as a soft crosslinking agent, with the chain length coinciding with the length of the aromatic ring of terephthalic aldehyde. The choice was made for these aldehydes to reduce spatial changes in the analysis of the release mechanism.

4. Conclusions

The crosslinking of chitosan particles with terephthalic aldehyde was confirmed by IR spectroscopy, and the presence of hydroxyapatite in the chitosan matrix was also proved. Absence of C=O groups indicates the completeness of the aldol condensation.
According to the X-ray diffractograms and SEM images, the particles have a polycrystalline structure with slight incorporation of amorphous phases characterized by monomodal size distribution for encapsulated BSA (average particle size 0.421 ± 0.015, PDI 0.385 ± 0.014) and bimodal size distribution for chemisorbed BSA (average particle size 0.493 ± 0.022, PDI 0.578 ± 0.019). Thus, the release of chemisorbed BSA is less controllable due to the higher number of amorphous inclusions and the more widely dispersed crystallite size distribution.
This study of BSA release kinetics showed that the highest release degree is achieved at pH 5.0 (67.4 ± 1.3% for encapsulated BSA and 75.7 ± 1.5% for chemisorbed BSA), which corresponds to the conditions of the tumor cell microenvironment. At pH 7.4 (simulated blood flow), release is slowed due to the contraction of chitosan particles.
The most suitable mathematical model for describing the kinetics of BSA release from the particle matrix was selected. The most suitable model was the Higuchi mathematical model. Using the Higuchi and the Korsmeyer–Peppas model, the release mechanism, the rate constant and the reaction order for all analyzed systems were evaluated. Thus, the Higuchi model provides the best description of BSA release kinetics, which is consistent with the matrix system nature. The Korsmeyer–Peppas model allows us to determine the release mechanisms: for most systems, diffusion from a non-swelling matrix prevails (n < 0.5), with the exception of cases at pH 6.5 (encapsulated BSA) and pH 7.4 (chemisorbed BSA), where abnormal transport is observed (0.5 < n < 1.0).
The obtained materials have potential for clinical use in cancer treatment, when the particles are modified on solid carriers, and as drug delivery vehicles to bone tissue in orthopedics or dental surgery. In addition, the materials themselves can be used to deliver drugs in ophthalmology as well as in absence of the internal contents, in particular, in wound healing due to their hemostatic properties.

Author Contributions

Conceptualization, E.E.C. and M.D.Z.; methodology, E.E.C., M.D.Z. and A.A.B.; validation, E.E.C., M.D.Z. and A.A.B.; formal analysis, I.A.K. and S.A.U.; investigation, E.E.C. and M.D.Z.; resources, E.E.C. and M.D.Z.; data curation, E.E.C., M.D.Z. and A.A.B.; writing—original draft preparation, E.E.C. and M.D.Z.; writing—review and editing, E.E.C. and M.D.Z.; visualization, E.E.C. and M.D.Z.; supervision, I.A.K. and S.A.U.; project administration, E.E.C. and I.A.K.; funding acquisition, I.A.K. All authors have read and agreed to the published version of the manuscript.

Funding

This study was supported by the State Assignment of the Ministry of Education and Science of the Russian Federation (project No. FSWM-2025-0013).

Institutional Review Board Statement

Not applicable.

Informed Consent Statement

Not applicable.

Data Availability Statement

The original contributions presented in this study are included in the article. Further inquiries can be directed to the corresponding author.

Acknowledgments

The authors express their gratitude to Ministry of Education and Science of the Russian Federation for the financial support.

Conflicts of Interest

The authors declare no conflicts of interest. The funders had no role in the design of this study; in the collection, analyses, or interpretation of data; in the writing of this manuscript; or in the decision to publish the results.

References

  1. Dadwal, A.; Baldi, A.; Kumar-Narang, R. Nanoparticles as carriers for drug delivery in cancer. Artif. Cells Nanomed. Biotechnol. 2018, 46, 295–305. [Google Scholar] [CrossRef]
  2. Li, Q.; Li, X.; Zhao, C. Strategies to obtain encapsulation and controlled release of small hydrophilic molecules. Front. Bioeng. Biotechnol. 2020, 8, 437. [Google Scholar] [CrossRef]
  3. Stefanache, A.; Lungu, I.I.; Anton, N.; Damir, D.; Gutu, C.; Olaru, I.; Condratovici, A.P.; Covrig, M.D.; Constantin, M.; Calin, G.; et al. Chitosan Nanoparticle-Based Drug Delivery Systems: Advances, Challenges, and Future Perspectives. Polymers 2025, 17, 1453. [Google Scholar] [CrossRef]
  4. Thakur, S.; Godela, R.; Mandava, K.; Kolure, R. Advances in nanocarrier technology for drug encapsulation: A comprehensive overview. Discov. Mater. 2025, 5, 124. [Google Scholar] [CrossRef]
  5. Zhao, B.; Zhong-Ming, L.; Song, X.; Xu, H.; Gao, Y.; Xu, J.-Z.; Yin, H.-M.; Xu, L. Promoting osteoblast proliferation on polymer bone substitutes with bone-like structure by combining hydroxyapatite and bioactive glass. Mater. Sci. Eng. 2019, 96, 1–9. [Google Scholar]
  6. Fatullayeva, S.; Tagiyev, D.; Zeynalov, N.; Mammadova, S.; Aliyeva, E. Recent advances of chitosan-based polymers in biomedical applications and environmental protection. J. Polym. Res. 2022, 29, 251–259. [Google Scholar] [CrossRef]
  7. Mohammed, A.; Abourehab, S.; Pramanik, S.; Abualsoud, B.M.; Kadi, A.; Ansari, M.J.; Deepak, A. Recent advances of chitosan formulations in biomedical applications. Int. J. Mol. Sci. 2022, 23, 10975. [Google Scholar] [CrossRef]
  8. Zhang, Y.; Lu, J. The transformation of single-crystal calcium phosphate ribbon-like fibres to hydroxyapatite spheres assembled from nanorods. Nanotechnology 2008, 23, 155–189. [Google Scholar] [CrossRef] [PubMed]
  9. Ramanan, S.R.; Venkatesh, R. A study of hydroxyapatite fibers prepared via sol-gel route. Mater. Lett. 2004, 58, 320–323. [Google Scholar] [CrossRef]
  10. Zhang, H.; Darvell, B.W. Synthesis and characterization of hydroxyapatite whiskers by hydrothermal homogeneous precipitation using acetamide. Acta Biomater. 2010, 6, 155–189. [Google Scholar] [CrossRef]
  11. Sahni, G.; Gopinath, P.; Jeevanandam, P. A novel thermal decomposition approach to synthesize hydroxyapatite-silver nanocomposites and their antibacterial action against GFP-expressing antibiotic resistant E. coli. Colloids Surf. B Biointerfaces 2013, 103, 441–447. [Google Scholar] [CrossRef]
  12. Aizawa, M.; Hanazawa, T.; Itatani, K.; Howell, F.S.; Kishioka, A. Characterization of hydroxyapatite powders prepared by ultrasonic spray-pyrolysis technique. J. Mater. Sci. 1999, 34, 266–287. [Google Scholar] [CrossRef]
  13. Zhang, H.G.; Zhu, Q. Preparation of fluoride-substituted hydroxyapatite by a molten salt synthesis route. J. Mater. Sci. Mater. Med. 2006, 17, 691–695. [Google Scholar] [CrossRef] [PubMed]
  14. Nasiri-Tabrizi, B.; Honarmandi, P.; Ebrahimi-Kahrizsangi, R. Synthesis of nanosize single-crystal hydroxyapatite via mechanochemical method. Mater. Lett. 2009, 63, 543–546. [Google Scholar] [CrossRef]
  15. Lin, K.; Pan, J.; Chen, Y.; Cheng, R.; Xu, X. Study the adsorption of phenol from aqueous solution on hydroxyapatite nanopowders. J. Hazard. Mater. 2009, 161, 231–240. [Google Scholar] [CrossRef]
  16. Wopenka, B.; Pasteris, J. A mineralogical perspective on the apatite in bone. Mater. Sci. Eng. 2005, 25, 131–143. [Google Scholar] [CrossRef]
  17. Hou, C.-H.; Hou, S.-M.; Hsueh, Y.-S.; Lin, J.; Wu, H.-C.; Lin, F.-H. The in vivo performance of biomagnetic hydroxyapatite nanoparticles in cancer hyperthermia therapy. Biomaterials 2009, 30, 3956–3960. [Google Scholar] [CrossRef]
  18. Shenoy, B.D.; Udupa, N.; Nagarajkumari, Y. Implantable drug delivery systems for centchroman. Indian J. Pharm. Sci. 1997, 59, 246–250. [Google Scholar]
  19. Walduck, A.K.; Opdebeeck, J.P.; Benson, H.E.; Prankerd, R.P. Biodegradable implants for the delivery of veterinary vaccines: Design, manufacture and antibody responses in sheep. J. Control. Release 1998, 51, 269–280. [Google Scholar] [CrossRef]
  20. Chen, L.; Mccrate, J.; Lee, J.; Li, H. The role of surface charge on the uptake and biocompatibility of hydroxyapatite nanoparticles with osteoblast cells. Nanotechnology 2011, 22, 105–117. [Google Scholar] [CrossRef] [PubMed]
  21. Zagvozkin, M.D.; Chernikova, E.E.; Brusevich, A.; Kurzina, I.A.; Ulasevich, S.A. Development of pH-sensitive delivery systems for bovine serum albumin based on chitosan by chemisorption method. Tomsk. State Univ. J. Chem. 2024, 139–151. [Google Scholar] [CrossRef]
  22. Chernikova, E.E.; Zagvozkin, M.D.; Kurzina, I.A.; Brusevich, A.; Ulasevich, S.A. Preparation and study of pH-sensitive delivery systems for encapsulated protein molecules based on chitosan. Tomsk. State Univ. J. Chem. 2024, 126–138. [Google Scholar]
  23. Sun, H.; Qiu, X.; Li, X.; Wang, H. Eco-friendly, pH-sensitive curcumin-loaded sodium alginate/hydroxyapatite/quaternary ammonium chitosan microspheres with enhanced antibacterial and antioxidant activities for fruit preservation. Int. J. Biol. Macromol. 2024, 279, 135297. [Google Scholar] [CrossRef]
  24. Wu, M.Y.; Kao, I.F.; Fu, C.Y.; Yen, S.K. Effects of Adding chitosan on drug entrapment efficiency and release duration for paclitaxel-loaded hydroxyapatite—Gelatin composite microspheres. Pharmaceutics 2023, 15, 2025. [Google Scholar] [PubMed]
  25. Devine, D.M.; Hoctor, E.; Hayes, J.S.; Sheehan, E.; Evans, C.H. Extended release of proteins following encapsulation in hydroxyapatite/chitosan composite scaffolds for bone tissue engineering applications. Mater. Sci. Eng. 2018, 84, 281–289. [Google Scholar]
  26. Sha, Z.; Wu, Y.; Zheng, Y.; Yang, K.; Gong, X.; Xuan, L.; Li, X.; Chen, X. Advances in pH-responsive drug delivery systems for periodontitis treatment. Drug Deliv. 2025, 32, 2522109. [Google Scholar] [CrossRef] [PubMed]
Figure 1. Scheme for preparation of chitosan microspheres with encapsulated and chemisorbed BSA with HA incorporation into the structure.
Jcs 09 00525 g001
Figure 2. IR spectra of pure chitosan (A), particles with encapsulated BSA (B), and chemosorbed BSA particles (C).
Jcs 09 00525 g002
Figure 3. X-ray diffractograms of the obtained materials.
Jcs 09 00525 g003
Figure 4. SEM images of 5 and 100 µm resolution of the particles surface with (A) encapsulated BSA; (B) chemisorbed BSA.
Jcs 09 00525 g004
Figure 5. Release curve of encapsulated BSA at different pHs.
Jcs 09 00525 g005
Figure 6. Release curve of chemisorbed BSA at different pHs.
Jcs 09 00525 g006
Figure 7. Zero-order mathematical model of the first stage of encapsulated BSA release.
Jcs 09 00525 g007
Figure 8. Zero-order mathematical model of the first stage of chemisorbed BSA release.
Jcs 09 00525 g008
Figure 9. Zero-order mathematical model of the second stage of encapsulated BSA release.
Jcs 09 00525 g009
Figure 10. Zero-order mathematical model of the second stage of chemisorbed BSA release.
Jcs 09 00525 g010
Figure 11. Zero-order mathematical model of encapsulated BSA release.
Jcs 09 00525 g011
Figure 12. Zero-order mathematical model of chemisorbed BSA release.
Jcs 09 00525 g012
Figure 13. First-order mathematical model of the first stage of encapsulated BSA release.
Jcs 09 00525 g013
Figure 14. First-order mathematical model of the first stage of chemisorbed BSA release.
Jcs 09 00525 g014
Figure 15. First-order mathematical model of the second stage of encapsulated BSA release.
Jcs 09 00525 g015
Figure 16. First-order mathematical model of the second stage of chemisorbed BSA release.
Jcs 09 00525 g016
Figure 17. Higuchi mathematical model for encapsulated BSA release.
Jcs 09 00525 g017
Figure 18. Higuchi mathematical model for chemisorbed BSA release.
Jcs 09 00525 g018
Figure 19. Korsmeyer–Peppas mathematical model for encapsulated BSA.
Jcs 09 00525 g019
Figure 20. Korsmeyer–Peppas mathematical model for chemisorbed BSA.
Jcs 09 00525 g020
Table 1. Methods of synthesizing hydroxyapatite particles and their characteristics.
Synthesis MethodAdvantagesMorphology and SizeReference
Co-precipitationSimplest and most efficient chemical method. Synthesis at room temperature. Particle size can easily be controlled by adjusting pH and ionic strength of reaction media. Structures have wide range in size and morphology.Irregular, sphere, rod, needle, tube, fiber, filament, wire, whisker, strip, platelet, flower. Size range: 3 nm–1000 μm.[6]
Sol-gel synthesisMolecular-level mixing of reactants improves the chemical homogeneity of pure and hybrid synthesized nanostructures at low temperature.Irregular, sphere, rod, needle, tube, filament, whisker, platelet. Size range: 3 nm–1000 μm.[7]
Hydrothermal synthesisEnhanced solubility of precursors. Controlled growth dynamics.Irregular, sphere, rod, needle, tube, fiber, wire, whisker, feathery structures.[8]
Thermal decompositionGood size control, narrow size variation, and good crystallinity.Irregular, flake, plate, sheet, formless. Size range: 5 nm–200 μm.[9]
PyrolysisRod-like nanoparticles and single phase with high crystallinity and good stoichiometry.Nanorods embedded to micron form. Size range: 10 nm–1000 μm.[10]
Solid stateWell-crystallized structure.Irregular, filament, rod, needle, whisker. Size range: 5 nm–1000 μm.[11]
Mechano-chemicalNo calcination is required.Irregular, sphere, rod, needle, whisker. Size range: 5 nm–200 μm.[12]
Table 2. Dependence of the release mechanism on the value of n.
nRelease MechanismRelease Rate as a Function of TimeRelease Mechanism
n < 0.5Quasi–Fickian diffusiontnDiffusion from a non-swelling matrix
0.5Fickian diffusiont0.5Diffusion from a non-swelling matrix
0.5 < n < 1.0Anomalous transport (non-Fickian)tn−1Diffusion and/or relaxation
1.0Case II (non-Fickian diffusion)Time-independentZero order
n > 1.0Supercase IItn−1Relaxation (swelling) or erosion
Table 3. Mechanism of BSA release.
SystempH Valuen ValueRelease Mechanism
Encapsulated BSA5.00.3596Diffusion from a non-swelling matrix
6.50.7541Diffusion and/or relaxation
7.40.4465Diffusion from a non-swelling matrix
Chemisorbed BSA5.00.3204Diffusion from a non-swelling matrix
6.50.3154Diffusion from a non-swelling matrix
7.40.5690Diffusion and/or relaxation
Table 4. Kinetic parameters of BSA release from the investigated systems.
SystempH ValueRate ConstantOrder
Encapsulated BSA5.00.07861.899
6.50.05750.194
7.40.05331.539
Chemisorbed BSA5.00.05881.943
6.50.05202.298
7.40.06340.512
Disclaimer/Publisher’s Note: The statements, opinions and data contained in all publications are solely those of the individual author(s) and contributor(s) and not of MDPI and/or the editor(s). MDPI and/or the editor(s) disclaim responsibility for any injury to people or property resulting from any ideas, methods, instructions or products referred to in the content.