
Machine Learning Approach for Prediction and Reliability Analysis of Failure Strength of U-Shaped Concrete Samples Joined with UHPC and PUC Composites


Abstract
1. Introduction
2. Development of Database
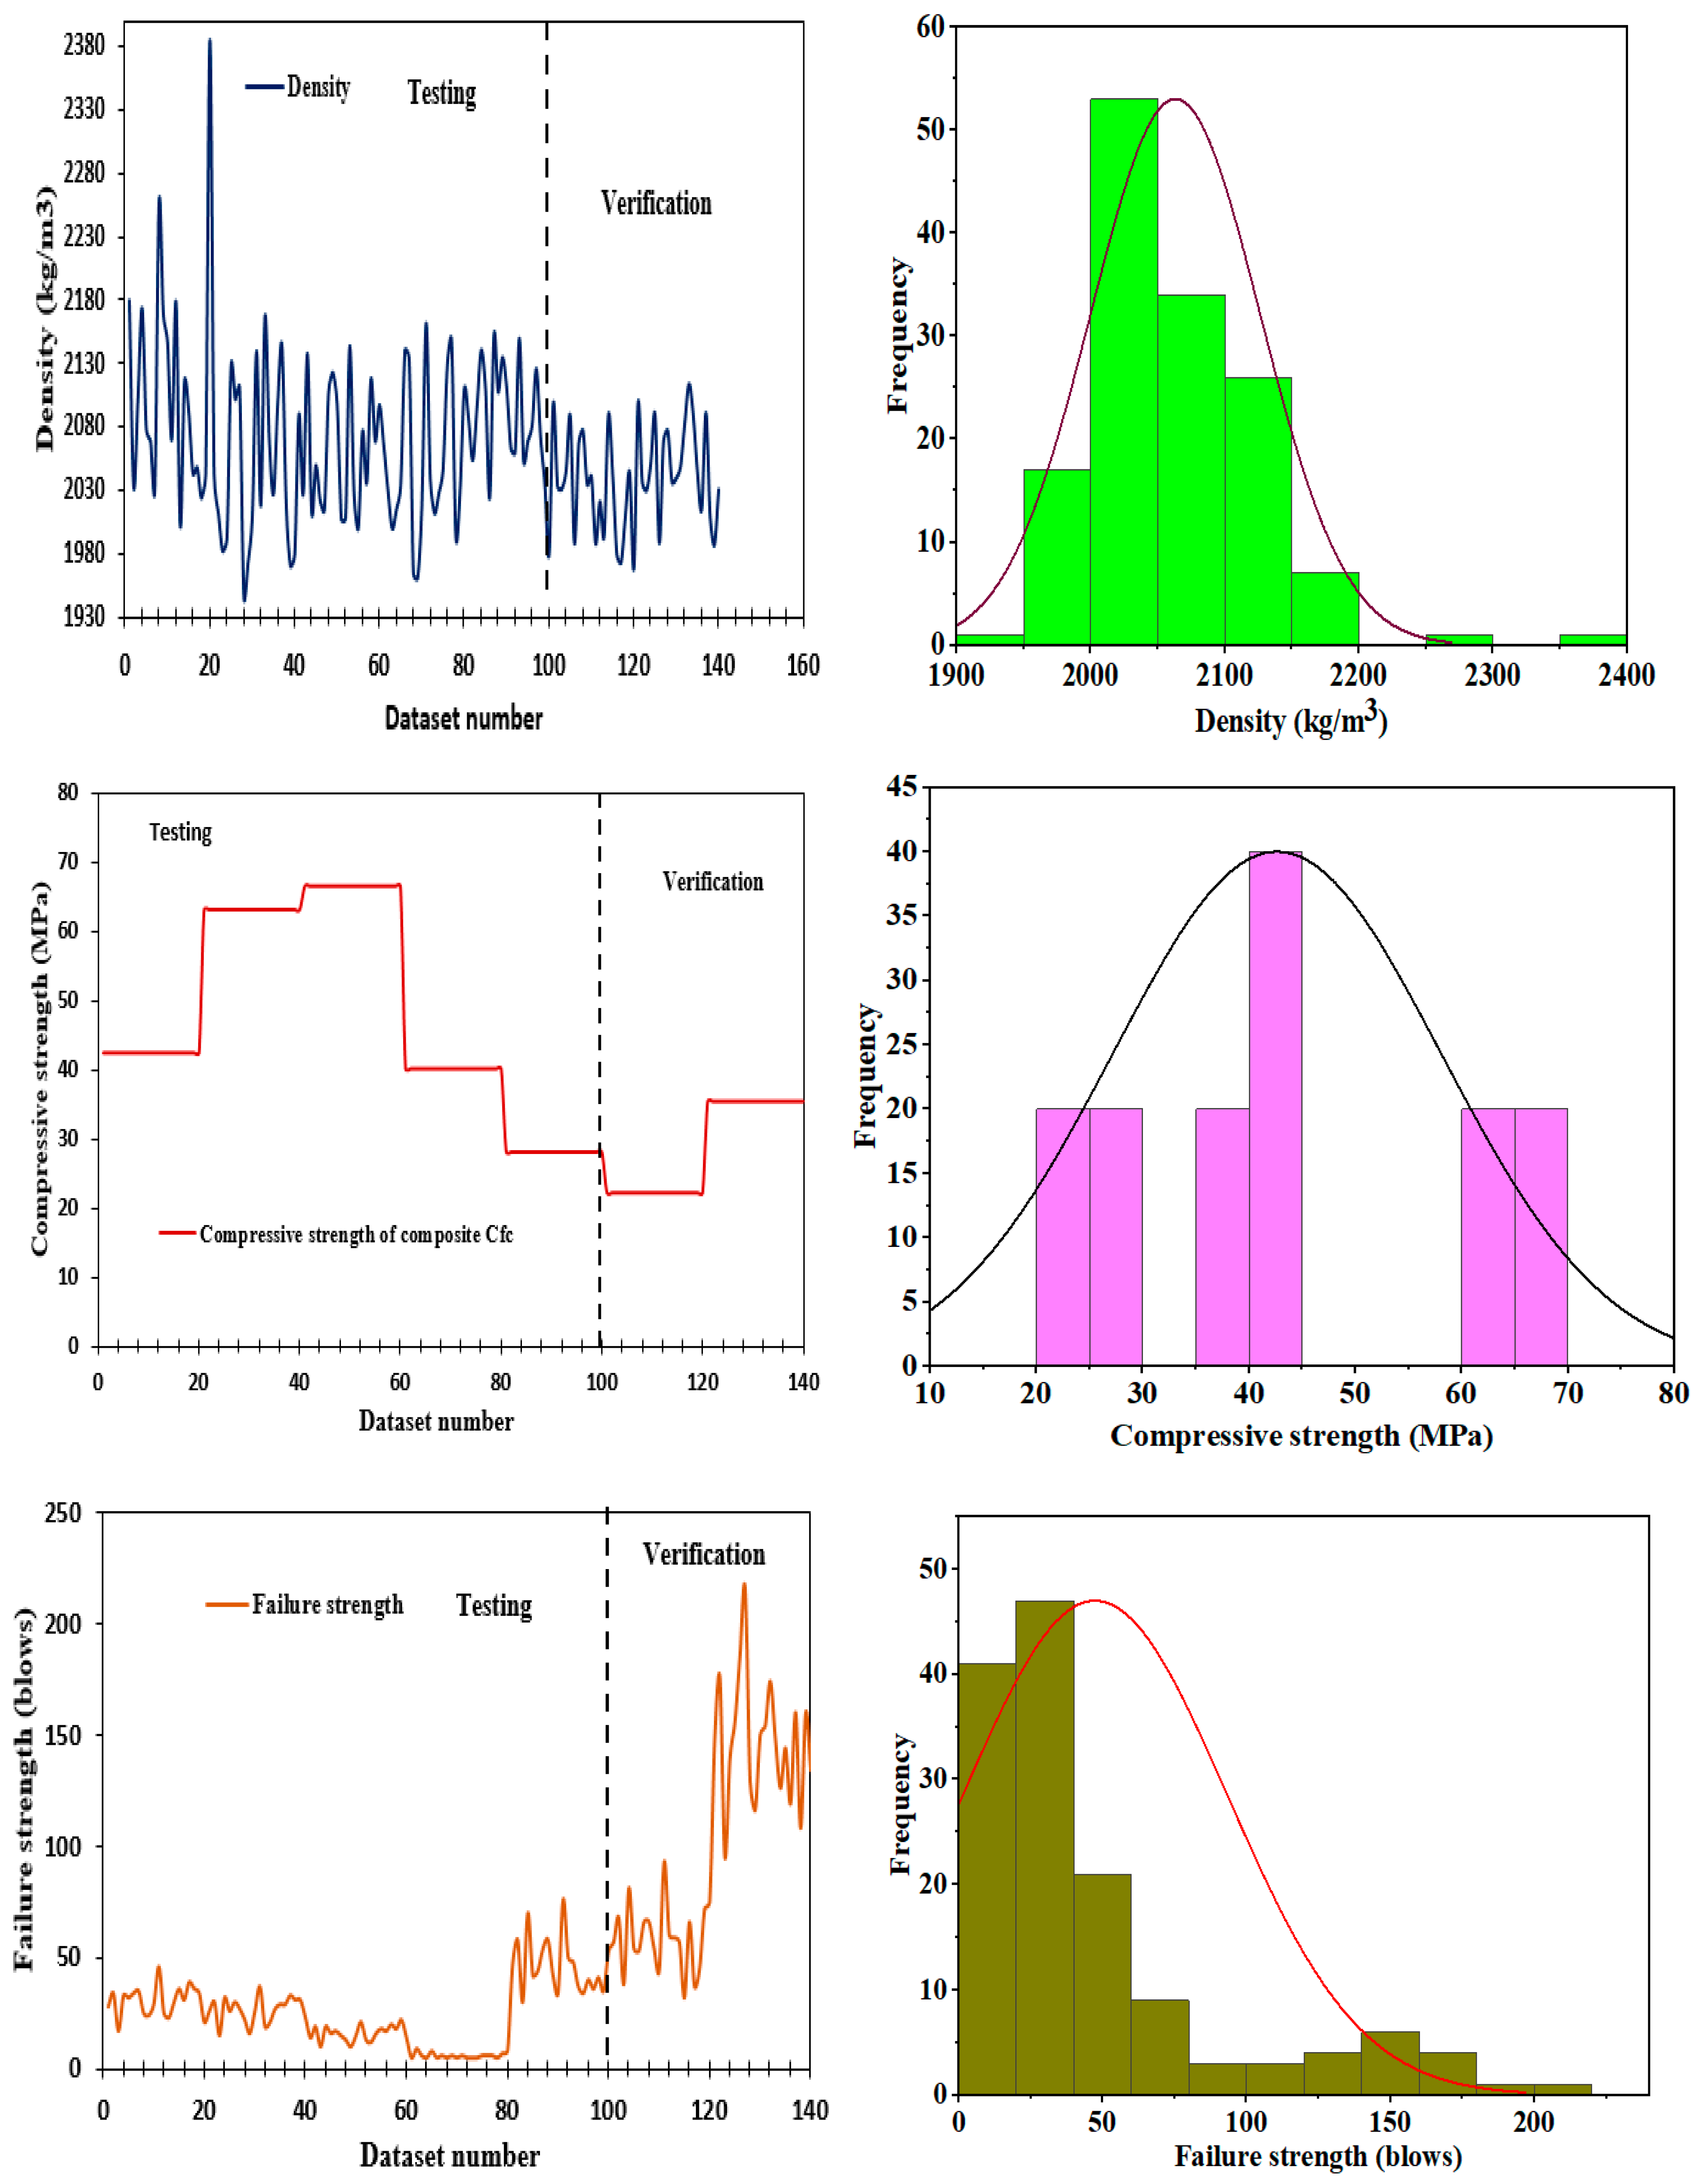
2.1. Description of Dataset Distribution
2.2. Selection of Optimal Input Variables
3. Machine Learning Algorithm
3.1. Gaussian Process Regression (GPR)
3.2. SVR Model
3.3. IEPSO
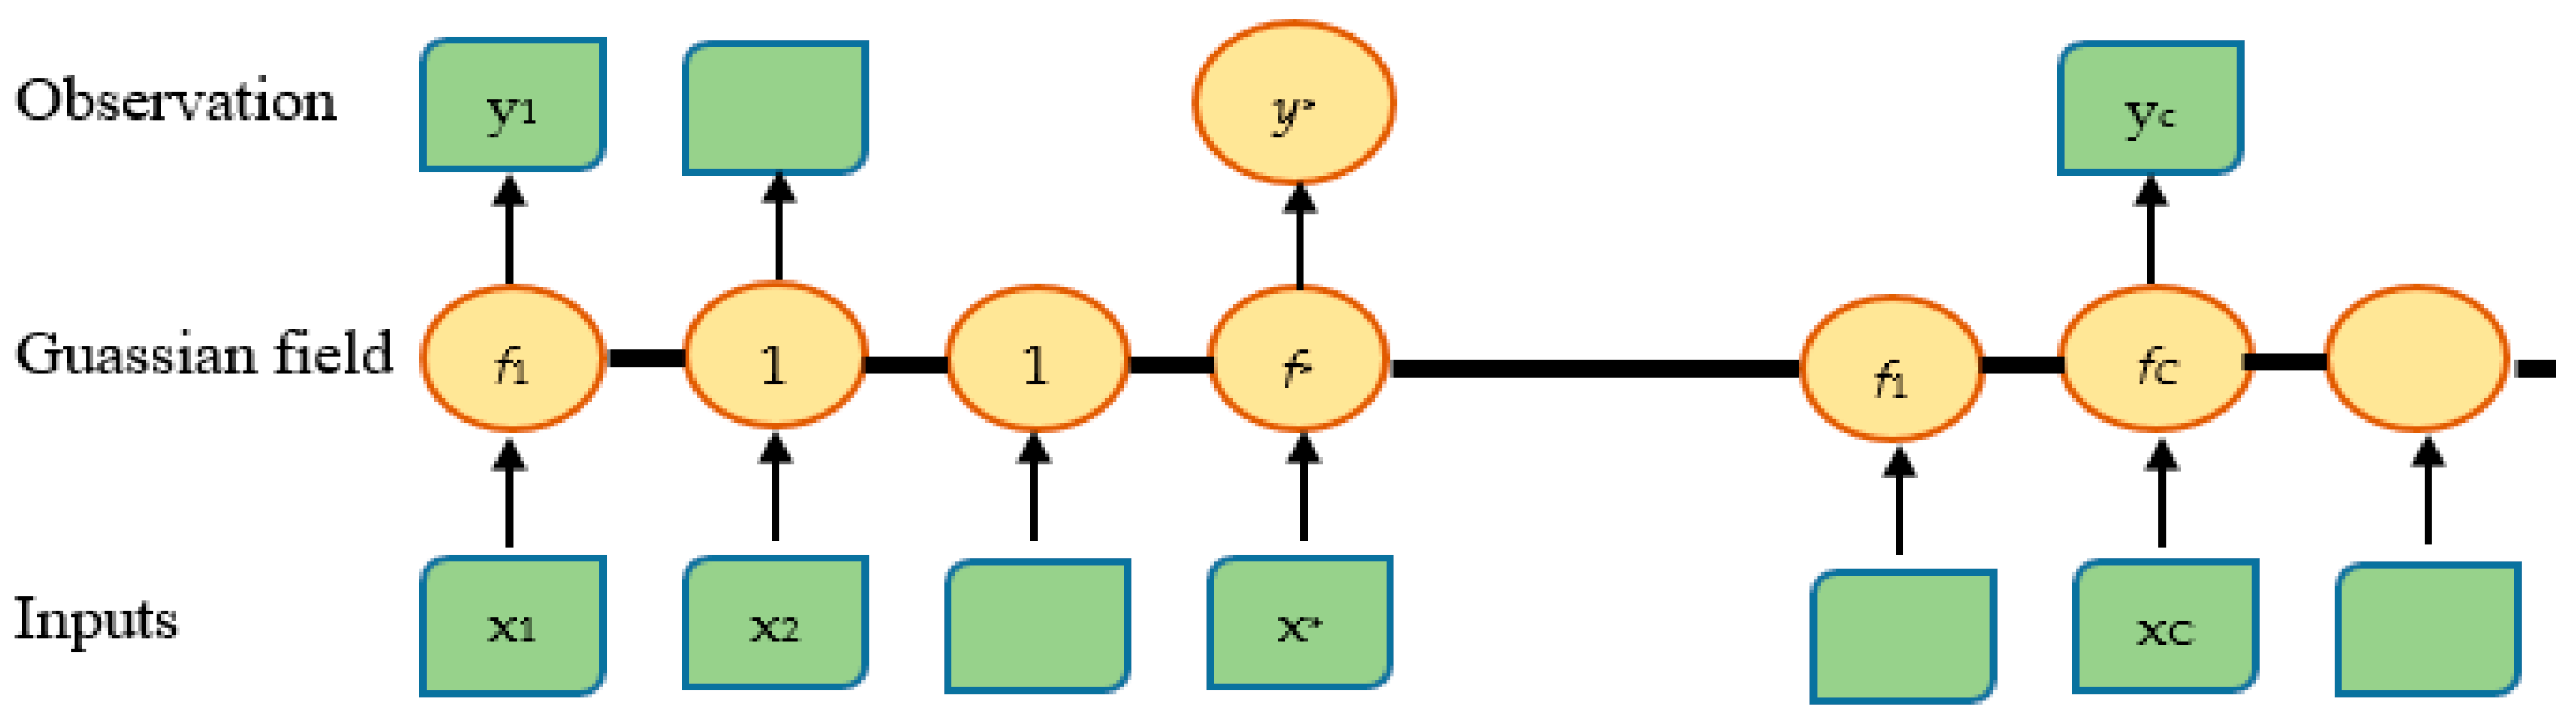
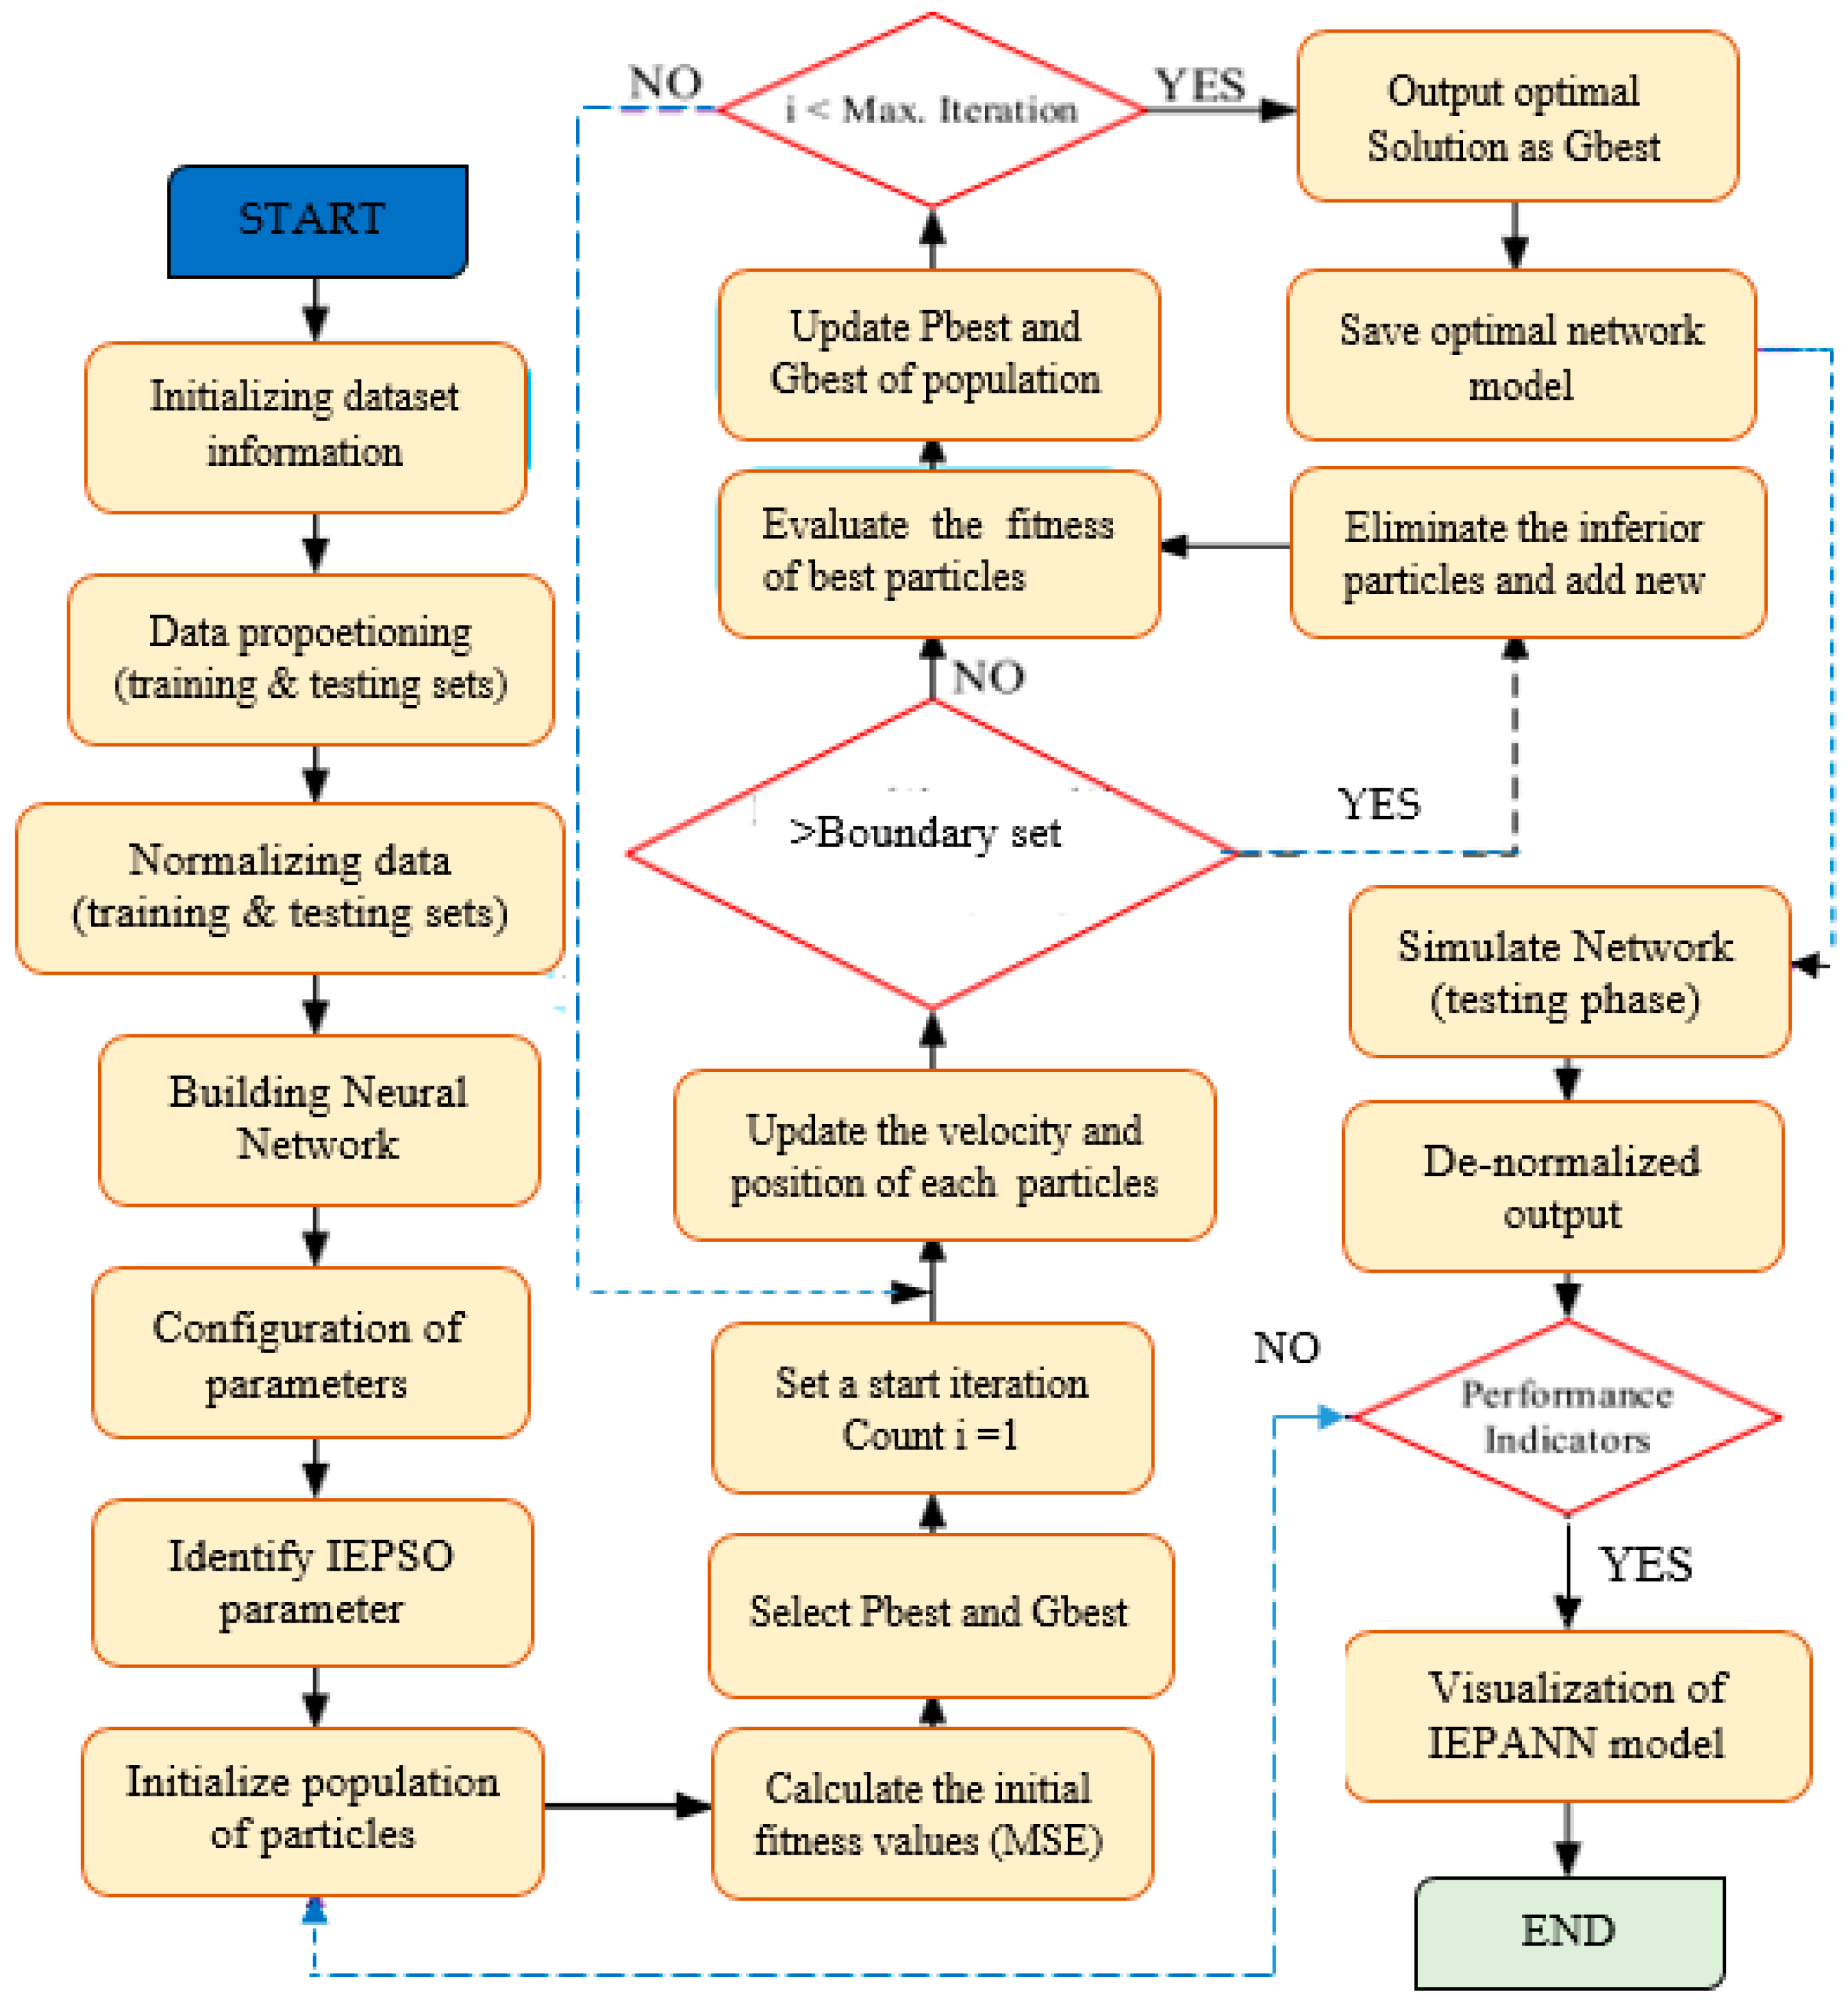
3.4. IEPANN
3.5. Model Performance Matrix
4. Results and Discussion
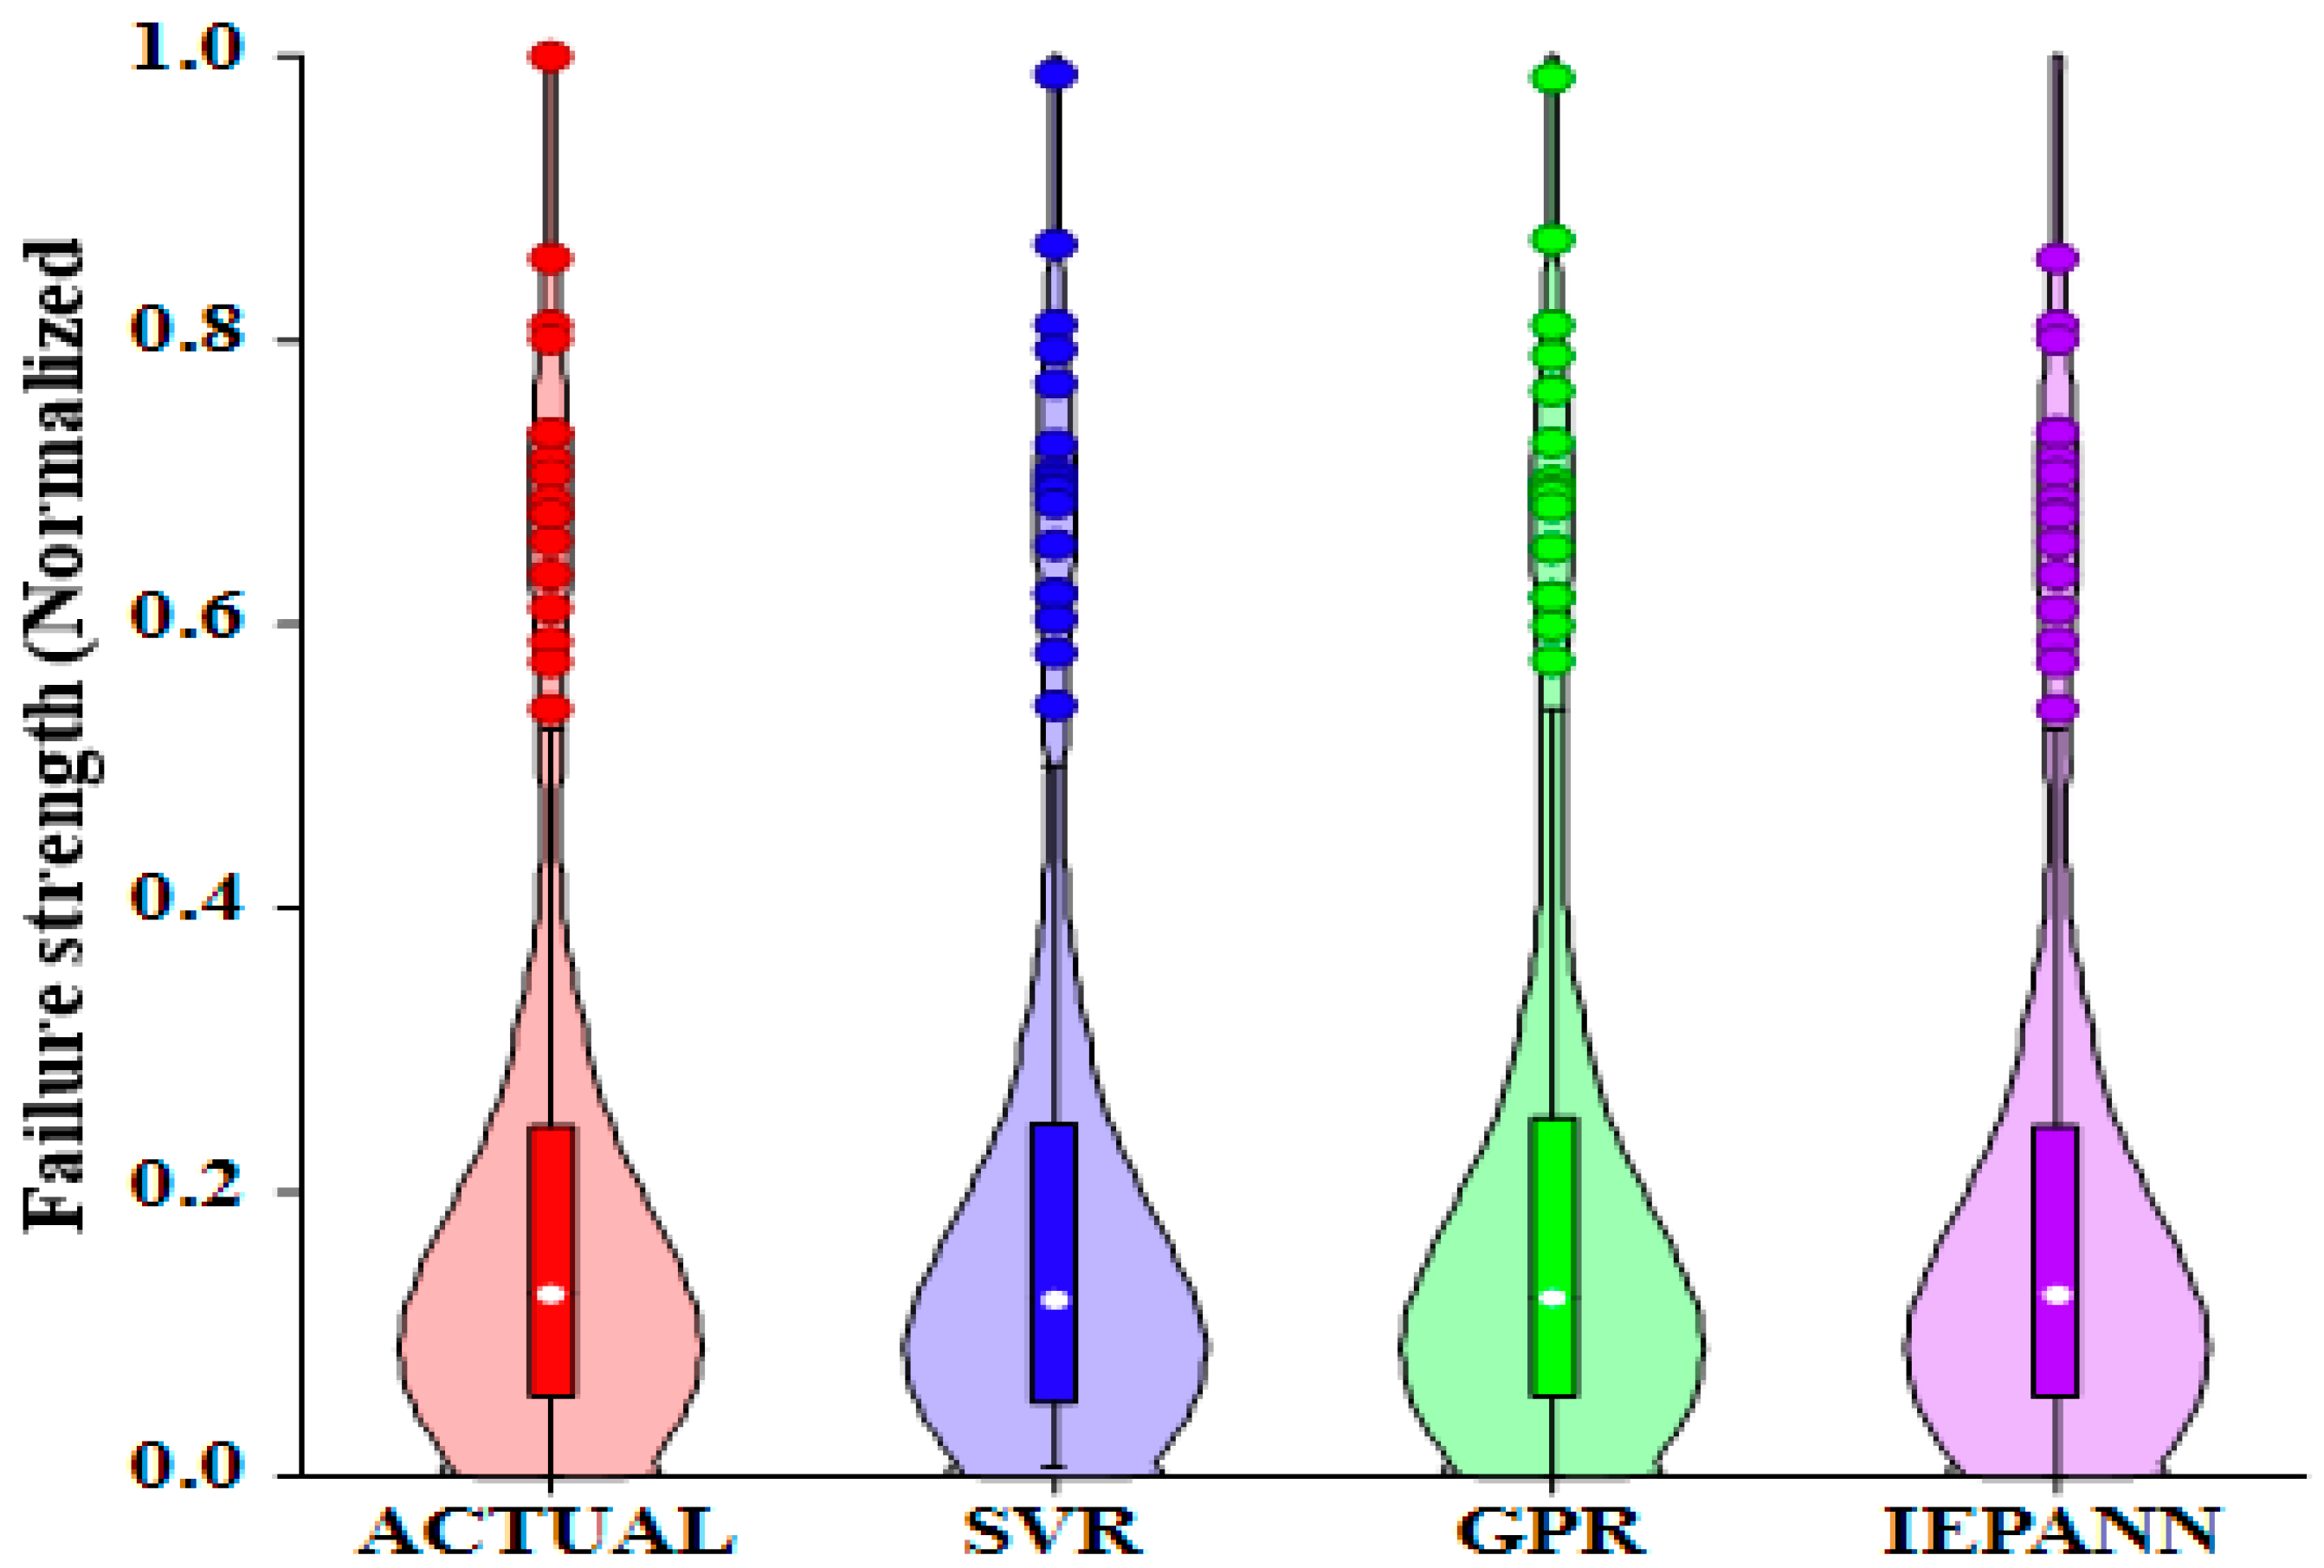
ML Model Results
5. Statistical Analysis
5.1. Weibull Distribution
5.2. Reliability Analysis
6. Conclusions
- All models revealed high prediction accuracy, achieving NSE values above acceptable thresholds, with NSE greater than 90% across the dataset. Performance indicators such as RMSE (ranging from 0.0013 to 0.017), PBIAS (from 0.0018 to 0.0248), and MAE (from 0.001 to 0.0139) were all within permissible limits at the testing stage. Additionally, similar results were obtained at the verification stage. Across the entire dataset, the ratio of observed and predicted strength values was nearly equal to 1 for all the developed models.
- Among the developed models, the hybrid IEPANN appeared to be the most effective model, demonstrating the highest NSE value of 0.999 and the lowest RMSE, PBIAS, and MAE values of 0.0013, 0.0018, and 0.001, respectively, compared with the nonlinear techniques. However, other individual models demonstrated high prediction skills.
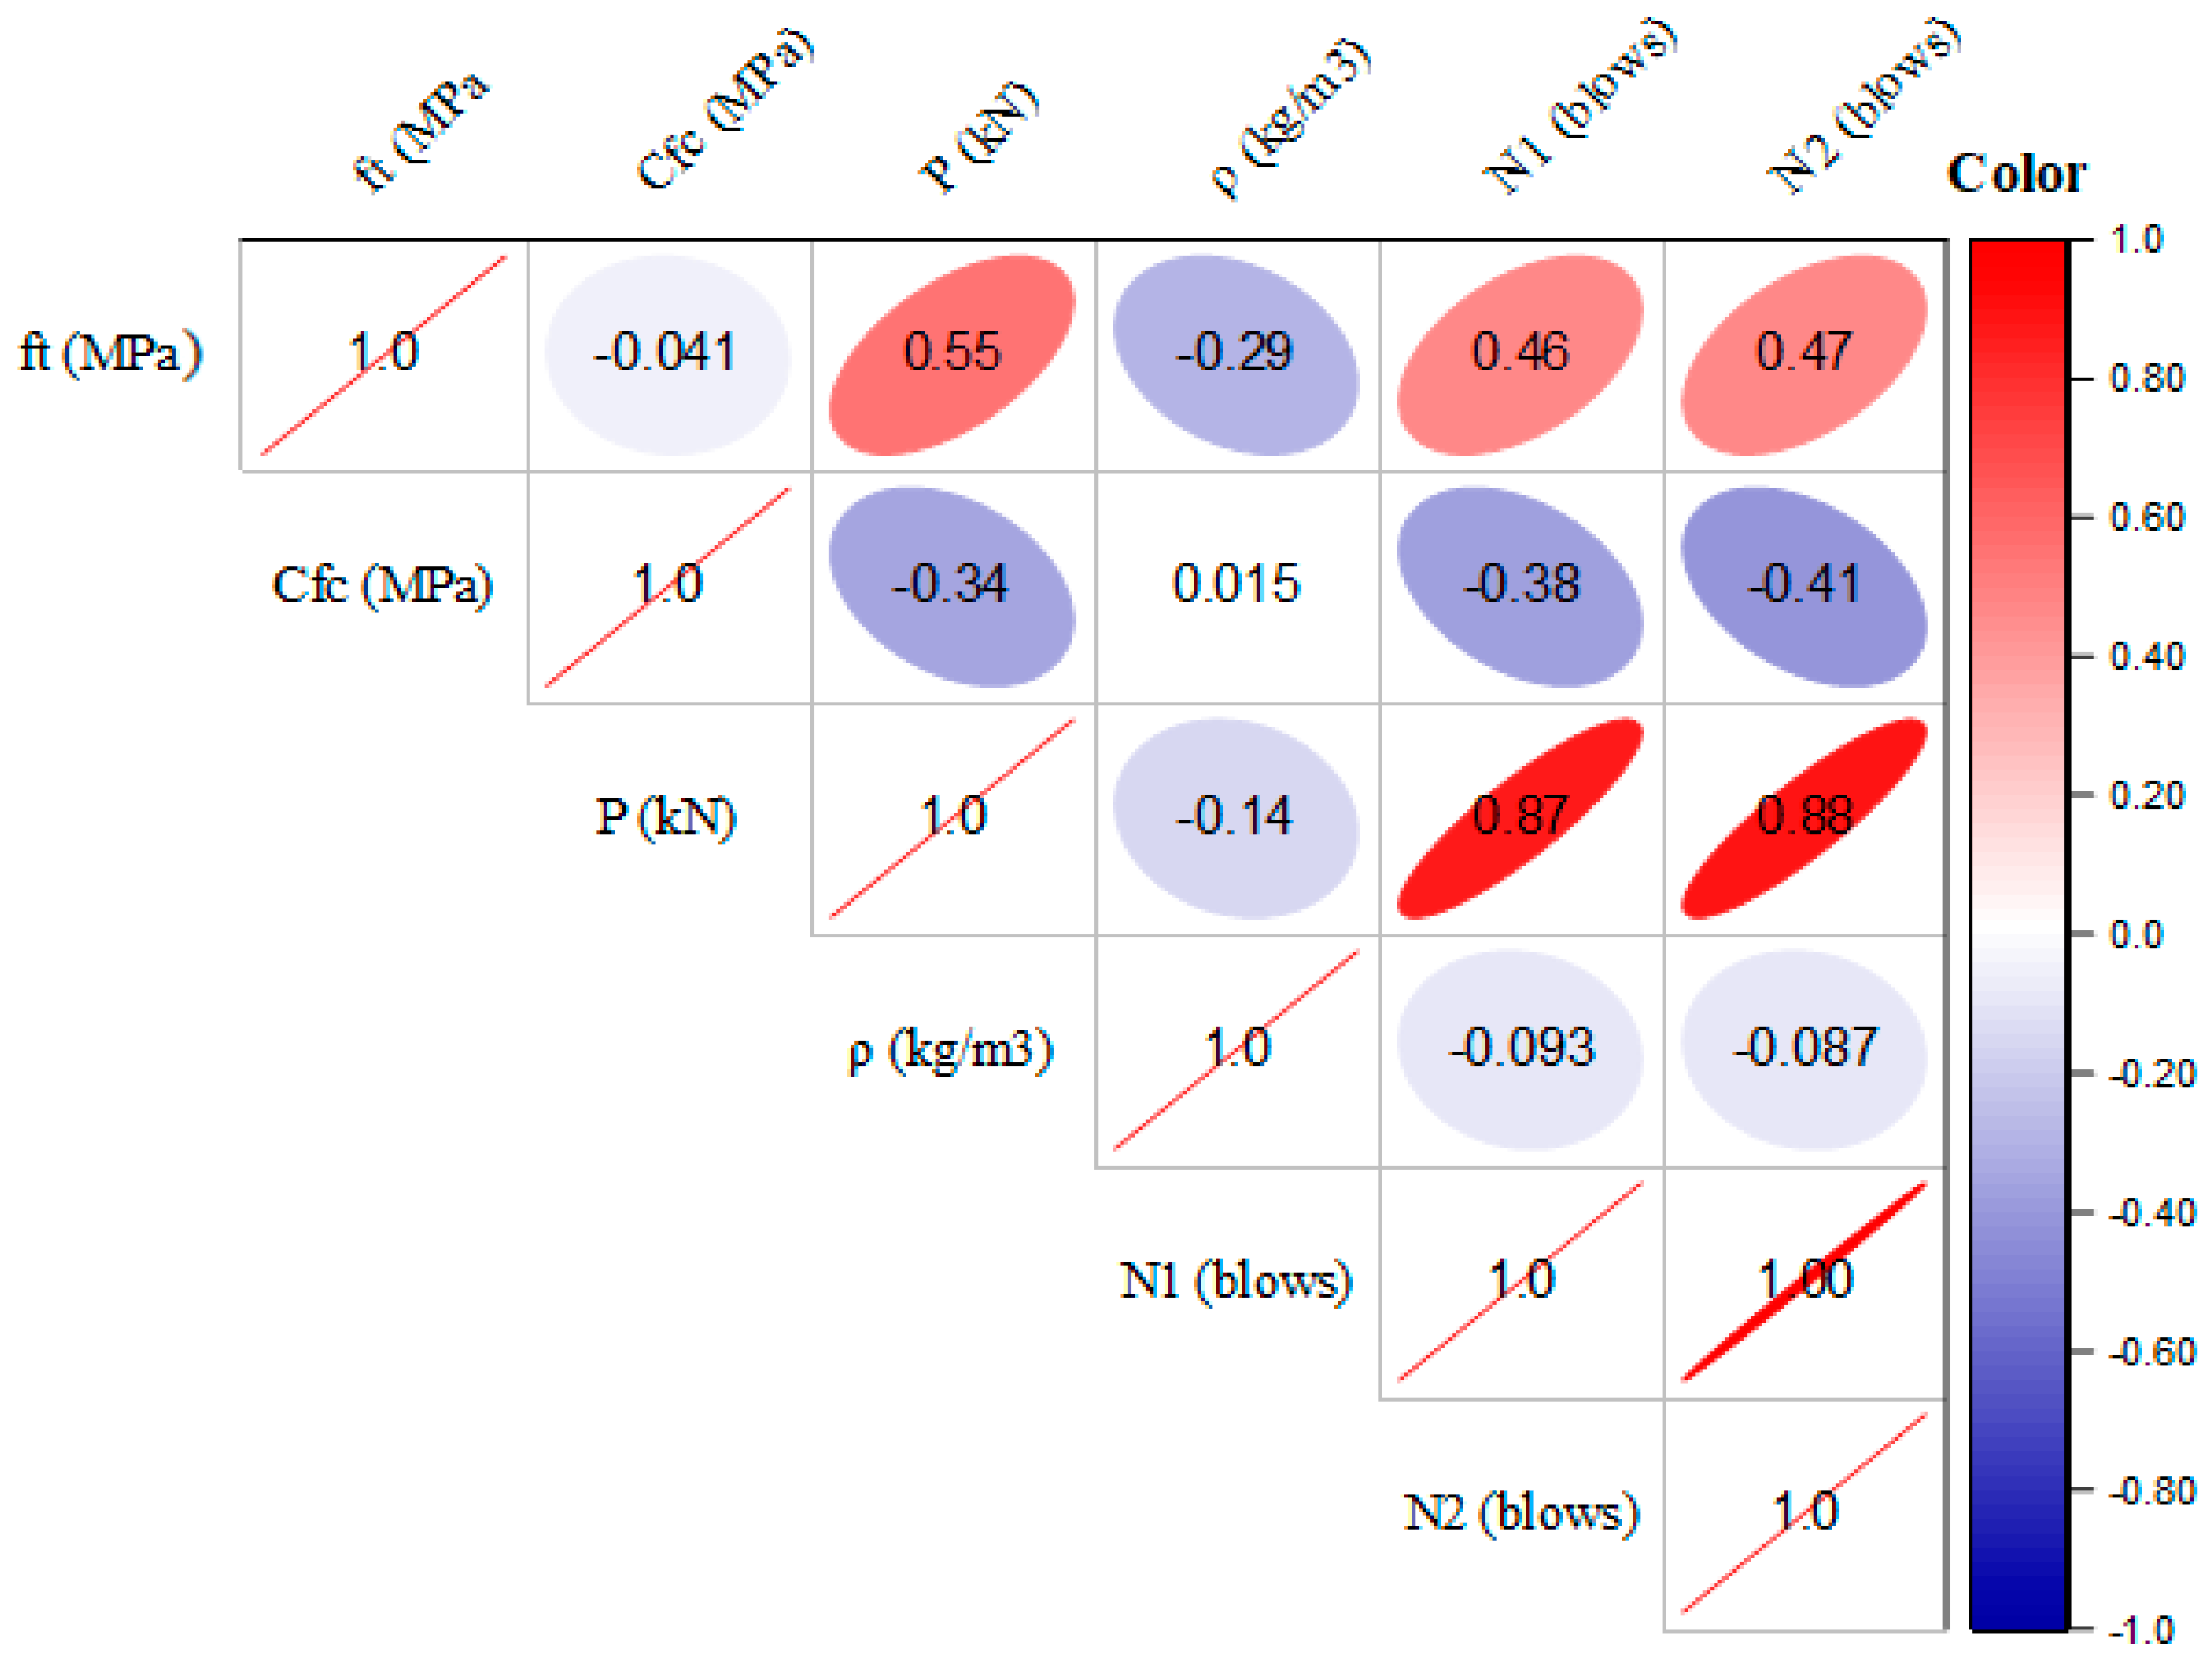
- The initial cracking strength and flexural stress of the U-shaped samples were the leading factors contributing to the prediction of the output parameter, with correlation values of +1 and 0.88, respectively, based on the Pearson correlation matrix. This high correlation with failure strength shows the significant influence of these parameters on the model’s estimation.
- The statistical analysis of the dataset of composite U-shaped specimens under two scenarios followed the two-parameter Weibull distribution function; hence, reliability analysis revealed that the number of impacts (N1 and N2) reduced as the survival probability increased. At 80% survival probability, NCNF-UHPC and NCNF-PUPC specimens were able to withstand 16 and 107 blows before the first crack, and 21 and 117 blows before complete failure, respectively, which agreed with the experimental results.
Author Contributions
Funding
Data Availability Statement
Acknowledgments
Conflicts of Interest
References
- Beushausen, H.; Torrent, R.; Alexander, M.G. Performance-based approaches for concrete durability: State of the art and future research needs. Cem. Concr. Res. 2019, 119, 11–20. [Google Scholar] [CrossRef]
- Alexander, M.; Beushausen, H. Durability Durability, service life prediction, and modelling for reinforced concrete structures–review and critique. Cem. Concr. Res. 2019, 122, 17–29. [Google Scholar] [CrossRef]
- Beushausen, H.; Höhlig, B.; Talotti, M. The influence of substrate moisture preparation on bond strength of concrete overlays and the microstructure of the OTZ. Cem. Concr. Res. 2017, 92, 84–91. [Google Scholar] [CrossRef]
- Espeche, A.D.; León, J. Estimation of bond strength envelopes for old-to-new concrete interfaces based on a cylinder splitting test. Constr. Build. Mater. 2010, 25, 1222–1235. [Google Scholar] [CrossRef]
- Julio, E.N.; Branco, F.A.; Silva, V.D. Concrete-to-concrete bond strength. Influence of the roughness of the substrate surface. Constr. Build. Mater. 2004, 18, 675–681. [Google Scholar] [CrossRef]
- Yang, Y.; Du, X.; Yu, Y.; Pan, Y. Experimental study on the seismic performance of composite columns with an ultra-high-strength concrete-filled steel tube core. Adv. Struct. Eng. 2019, 23, 794–809. [Google Scholar] [CrossRef]
- Hung, C.-C.; Hsiao, H.-J.; Shao, Y.; Yen, C.-H. A comparative study on the seismic performance of RC beam-column joints retrofitted by ECC, FRP, and concrete jacketing methods. J. Build. Eng. 2022, 64, 105691. [Google Scholar] [CrossRef]
- Al-Nimry, H.S.; Al-Rabadi, R.A. Axial–Flexural Interaction in FRP-Wrapped RC Columns. Int. J. Concr. Struct. Mater. 2019, 13, 53. [Google Scholar] [CrossRef]
- Ouyang, L.-J.; Chai, M.-X.; Song, J.; Hu, L.-L.; Gao, W.-Y. Repair of thermally damaged concrete cylinders with basalt fiber-reinforced polymer jackets. J. Build. Eng. 2021, 44, 102673. [Google Scholar] [CrossRef]
- Haruna, S.I.; Ibrahim, Y.E.; Han, Z.; Farouk, A.I.B. Flexural Response of Concrete Specimen Retrofitted with PU Grout Material: Experimental and Numerical Modeling. Polymers 2023, 15, 4114. [Google Scholar] [CrossRef]
- Haruna, S.; Zhu, H.; Ibrahim, Y.E.; Shao, J.; Adamu, M.; Ahmed, O.S. Impact resistance and flexural behavior of U-shaped concrete specimen retrofitted with polyurethane grout. Case Stud. Constr. Mater. 2023, 19, e02547. [Google Scholar] [CrossRef]
- Nataraja, M.; Dhang, N.; Gupta, A. Statistical variations in impact resistance of steel fiber-reinforced concrete subjected to drop weight test. Cem. Concr. Res. 1999, 29, 989–995. [Google Scholar] [CrossRef]
- Song, P.; Wu, J.; Hwang, S.; Sheu, B. Assessment of statistical variations in impact resistance of high-strength concrete and high-strength steel fiber-reinforced concrete. Cem. Concr. Res. 2004, 35, 393–399. [Google Scholar] [CrossRef]
- Nia, A.A.; Hedayatian, M.; Nili, M.; Sabet, V.A. An experimental and numerical study on how steel and polypropylene fibers affect the impact resistance in fiber-reinforced concrete. Int. J. Impact Eng. 2012, 46, 62–73. [Google Scholar]
- AlAhmed, Y.S.; Hassan, N.M.; Bahroun, Z. Significance of Sandwich Panel’s Core and Design on Its Impact Resistance under Blast Load. J. Compos. Sci. 2023, 7, 44. [Google Scholar] [CrossRef]
- Al-Shawafi, A.; Zhu, H.; Haruna, S.; Bo, Z.; Laqsum, S.A.; Borito, S.M. Impact resistance of ultra-high-performance concrete retrofitted with polyurethane grout material: Experimental investigation and statistical analysis. Structures 2023, 55, 185–200. [Google Scholar] [CrossRef]
- Su, Q.; Wu, H.; Fang, Q. Calibration of KCC model for UHPC under impact and blast loadings. Cem. Concr. Compos. 2022, 127, 104401. [Google Scholar] [CrossRef]
- Abid, S.R.; Abdul-Hussein, M.L.; Ayoob, N.S.; Ali, S.H.; Kadhum, A.L. Repeated drop-weight impact tests on self-compacting concrete reinforced with micro-steel fiber. Heliyon 2020, 6, e03198. [Google Scholar] [CrossRef]
- Abid, S.R.; Hussein, M.L.A.; Ali, S.H.; Kazem, A.F. Suggested modified testing techniques to the ACI 544-R repeated drop-weight impact test. Constr. Build. Mater. 2020, 244, 118321. [Google Scholar] [CrossRef]
- Anas, S.; Alam, M.; Tahzeeb, R. Impact response prediction of square RC slab of normal strength concrete strengthened with (1) laminates of (i) mild-steel and (ii) C-FRP, and (2) strips of C-FRP under falling-weight load. Mater. Today Proc. 2022, 87, 9–19. [Google Scholar] [CrossRef]
- Fan, W.; Chen, Y.; Li, J.; Sun, Y.; Feng, J.; Hassanin, H.; Sareh, P. Machine learning applied to the design and inspection of reinforced concrete bridges: Resilient methods and emerging applications. Structures 2021, 33, 3954–3963. [Google Scholar] [CrossRef]
- Dang, H.V.; Trestian, R.; Bui-Tien, T.; Nguyen, H.X. Probabilistic method for time-varying reliability analysis of structure via variational bayesian neural network. Structures 2021, 34, 3703–3715. [Google Scholar] [CrossRef]
- Haruna, S.I.; Malami, S.I.; Adamu, M.; Usman, A.G.; Farouk, A.; Ali, S.I.A.; Abba, S.I. Compressive Strength of Self-Compacting Concrete Modified with Rice Husk Ash and Calcium Carbide Waste Modeling: A Feasibility of Emerging Emotional Intelligent Model (EANN) Versus Traditional FFNN. Arab. J. Sci. Eng. 2021, 46, 11207–11222. [Google Scholar] [CrossRef]
- Farouk, A.I.B.; Jinsong, Z. Prediction of Interface Bond Strength Between Ultra-High-Performance Concrete (UHPC) and Normal Strength Concrete (NSC) Using a Machine Learning Approach. Arab. J. Sci. Eng. 2022, 47, 5337–5363. [Google Scholar] [CrossRef]
- Li, Z.; Long, Z.; Lei, S.; Zhang, T.; Liu, X.; Kuang, D. Predicting the glass formation of metallic glasses using machine learning approaches. Comput. Mater. Sci. 2021, 197, 110656. [Google Scholar] [CrossRef]
- Islam, M.; Hossain, B.; Akhtar, N.; Moni, M.A.; Hasan, K.F. CNN Based on Transfer Learning Models Using Data Augmentation and Transformation for Detection of Concrete Crack. Algorithms 2022, 15, 287. [Google Scholar] [CrossRef]
- Roudsari, S.S.; Ungureanu, L.M.; Soroushnia, S.; Abu-Lebdeh, T.; Petrescu, F.I.T. Optimization of Fiber-Reinforced Polymer Bars for Reinforced Concrete Column Using Nonlinear Finite Element Algorithms. Algorithms 2021, 15, 12. [Google Scholar] [CrossRef]
- Yazici, S.; Sezer, G.I.; Sezer, A. Prediction of Impact Resistance Properties of Concrete Using Radial Basis Function Networks. Acta Phys. Pol. A 2017, 132, 1036–1040. [Google Scholar] [CrossRef]
- Moein, M.M.; Saradar, A.; Rahmati, K.; Rezakhani, Y.; Ashkan, S.A.; Karakouzian, M. Reliability analysis and experimental investigation of impact resistance of concrete reinforced with polyolefin fiber in different shapes, lengths, and doses. J. Build. Eng. 2023, 169, 106262. [Google Scholar] [CrossRef]
- Mane, K.M.; Chavan, S.P.; Salokhe, S.A.; Nadgouda, P.A.; Kumbhar, Y.D. Predicting the impact strength and chloride permeability of concrete made with industrial waste and artificial sand using ANN. Innov. Infrastruct. Solut. 2024, 9, 306. [Google Scholar] [CrossRef]
- Palamarchuk, A.; Yudaev, P.; Chistyakov, E. Polymer Concretes Based on Various Resins: Modern Research and Modeling of Mechanical Properties. J. Compos. Sci. 2024, 8, 503. [Google Scholar] [CrossRef]
- Li, L.; Mortazavi, M.; Far, H.; El-Sherbeeny, A.M.; Fini, A.A. Simulation and modeling of polymer concrete panels using deep neural networks. Case Stud. Constr. Mater. 2024, 20, e02912. [Google Scholar] [CrossRef]
- Keshtegar, B.; Bagheri, M.; Yaseen, Z.M. Shear strength of steel fiber-unconfined reinforced concrete beam simulation: Application of novel intelligent model. Compos. Struct. 2019, 212, 230–242. [Google Scholar] [CrossRef]
- Onyari, E.; Ikotun, B. Prediction of compressive and flexural strengths of a modified zeolite additive mortar using artificial neural network. Constr. Build. Mater. 2018, 187, 1232–1241. [Google Scholar] [CrossRef]
- Chou, J.; Nguyen, N. Metaheuristics-optimized ensemble system for predicting mechanical strength of reinforced concrete materials. Struct. Control. Heal. Monit. 2021, 28, e2706. [Google Scholar] [CrossRef]
- Liang, M.; Chang, Z.; Wan, Z.; Gan, Y.; Schlangen, E.; Šavija, B. Interpretable Ensemble-Machine-Learning models for predicting creep behavior of concrete. Cem. Concr. Compos. 2022, 125, 104295. [Google Scholar] [CrossRef]
- Sharghi, E.; Nourani, V.; Zhang, Y.; Ghaneei, P. Conjunction of cluster ensemble-model ensemble techniques for spatiotemporal assessment of groundwater depletion in semi-arid plains. J. Hydrol. 2022, 610, 127984. [Google Scholar] [CrossRef]
- Zhang, S.-Y.; Chen, S.-Z.; Jiang, X.; Han, W.-S. Data-driven prediction of FRP strengthened reinforced concrete beam capacity based on interpretable ensemble learning algorithms. Structures 2022, 43, 860–877. [Google Scholar] [CrossRef]
- Pan, L.X.; Lehký, D.; Novák, D.; Cao, M. Sensitivity Analysis for Parameters of Prestressed Concrete Bridge Using Neural Network Ensemble. In Proceedings of the 24th International Conference Engineering Mechanics 2018, Svratka, Czech Republic, 14–17 May 2018. [Google Scholar]
- Pan, L.; Novák, L.; Lehký, D.; Novák, D.; Cao, M. Neural network ensemble-based sensitivity analysis in structural engineering: Comparison of selected methods and the influence of statistical correlation. Comput. Struct. 2020, 242, 106376. [Google Scholar] [CrossRef]
- Farouk, A.I.B.; Zhu, J.; Ding, J.; Haruna, S. Prediction and uncertainty quantification of ultimate bond strength between UHPC and reinforcing steel bar using a hybrid machine learning approach. Constr. Build. Mater. 2022, 345, 128360. [Google Scholar] [CrossRef]
- You, X.; Yan, G.; Al-Masoudy, M.M.; Kadimallah, M.A.; Alkhalifah, T.; Alturise, F.; Ali, H.E. Application of novel hybrid machine learning approach for estimation of ultimate bond strength between ultra-high performance concrete and reinforced bar. Adv. Eng. Softw. 2023, 180, 103442. [Google Scholar] [CrossRef]
- Khan, A.-M.; Kee, S.-H.; Nahid, A.-A. Vision-Based Concrete-Crack Detection on Railway Sleepers Using Dense U-Net Model. Algorithms 2023, 16, 568. [Google Scholar] [CrossRef]
- Cui, L.; Zhang, X.; Hao, H. Prediction of dynamic shear and maximum displacement of clamped reinforced concrete beams subjected to impact loading. Int. J. Impact Eng. 2024, 195, 105131. [Google Scholar] [CrossRef]
- Bakhshi, M.; Valente, I.B.; Ramezansefat, H. New model for evaluating the impact response of steel fiber reinforced concrete subjected to the repeated drop-weight. Constr. Build. Mater. 2024, 449, 138459. [Google Scholar] [CrossRef]
- Laqsum, S.A.; Zhu, H.; Bo, Z.; Haruna, S.I.; Al-Shawafi, A.; Borito, S.M. Static properties and impact resistance performance of U-shaped PU-modified concrete under repeated drop-weight impact load. Arch. Civ. Mech. Eng. 2023, 23, 227. [Google Scholar] [CrossRef]
- Al-Shawafi, A.; Zhu, H.; Haruna, S.; Bo, Z.; Laqsum, S.A.; Borito, S.M. Experimental study and machine learning algorithms for evaluating the performance of U-shaped ultra-high performance reinforced fiber concrete under static and impact loads. J. Build. Eng. 2023, 70, 106389. [Google Scholar] [CrossRef]
- Haruna, S.I.; Zhu, H.; Jiang, W.; Shao, J. Evaluation of impact resistance properties of polyurethane-based polymer concrete for the repair of runway subjected to repeated drop-weight impact test. Constr. Build. Mater. 2021, 309, 125152. [Google Scholar] [CrossRef]
- Haruna, S.I.; Zhu, H.; Ibrahim, Y.E.; Shao, J.; Adamu, M.; Farouk, A.I.B. Experimental and Statistical Analysis of U-Shaped Polyurethane-Based Polymer Concrete under Static and Impact Loads as a Repair Material. Buildings 2022, 12, 1986. [Google Scholar] [CrossRef]
- Al-Shawafi, A.; Zhu, H.; Bo, Z.; Haruna, S.; Ibrahim, Y.E.; Farouk, A.; Laqsum, S.A.; Shao, J. Bond behavior between normal concrete and UHPC and PUC layers subjected to different loading conditions coupled with fracture analysis technique. J. Build. Eng. 2024, 86, 108880. [Google Scholar] [CrossRef]
- Haruna, S.I.; Ibrahim, Y.E.; Hassan, I.H.; Al-Shawafi, A.; Zhu, H. Bond Strength Assessment of Normal Strength Concrete–Ultra-High-Performance Fiber Reinforced Concrete Using Repeated Drop-Weight Impact Test: Experimental and Machine Learning Technique. Materials 2024, 17, 3032. [Google Scholar] [CrossRef]
- Ali, N.M.; Farouk, A.; Haruna, S.; Alanazi, H.; Adamu, M.; Ibrahim, Y.E. Feature selection approach for failure mode detection of reinforced concrete bridge columns. Case Stud. Constr. Mater. 2022, 17, e01383. [Google Scholar] [CrossRef]
- Liu, J.; Alexander, J.; Gu, Q.; Li, Y. Gaussian process regression-based load-carrying capacity models of corroded prestressed concrete bridge girders for fast-screening and reliability-based evaluation. Eng. Struct. 2023, 285, 116040. [Google Scholar] [CrossRef]
- Husnain, A.; Iqbal, M.; Waqas, H.A.; El-Meligy, M.; Javed, M.F.; Ullah, R. Machine learning techniques for predicting the peak response of reinforced concrete beam subjected to impact loading. Results Eng. 2024, 24, 103135. [Google Scholar] [CrossRef]
- Liu, Y.; Wang, L.; Gu, K. A support vector regression (SVR)-based method for dynamic load identification using heterogeneous responses under interval uncertainties. Appl. Soft Comput. 2021, 110, 107599. [Google Scholar] [CrossRef]
- Deng, Y.; Gao, X.; Tu, T. Enhancing skeletal age estimation accuracy using support vector regression models. Leg. Med. 2023, 66, 102362. [Google Scholar] [CrossRef]
- Lv, X.; Wang, Y.; Deng, J.; Zhang, G.; Zhang, L. Improved particle swarm optimization algorithm based on last-eliminated principle and enhanced information sharing. Comput. Intell. Neurosci. 2018, 2018, 5025672. [Google Scholar] [CrossRef]
- Botchkarev, A. Performance metrics (error measures) in machine learning regression, forecasting and prognostics: Properties and typology. arXiv 2018, arXiv:1809.03006. [Google Scholar]
- Umar, I.K.; Gökçekuş, H.; Nourani, V. An intelligent soft computing technique for prediction of vehicular traffic noise. Arab. J. Geosci. 2022, 15, 1571. [Google Scholar] [CrossRef]
- Poli, R.; Kennedy, J.; Blackwell, T. Particle swarm optimization. Intell 2007, 1, 33–57. [Google Scholar] [CrossRef]
- Moriasi, D.N.; Arnold, J.G.; van Liew, M.W.; Bingner, R.L.; Harmel, R.D.; Veith, T.L. Model evaluation guidelines for systematic quantification of accuracy in watershed simulations. Trans. ASABE 2007, 50, 885–900. [Google Scholar] [CrossRef]
- Alanazi, F.; Umar, I.K.; Haruna, S.I.; El-Kady, M.; Azam, A. Development of Artificial Intelligence Based Safety Performance Measures for Urban Roundabouts. Sustainability 2023, 15, 11429. [Google Scholar] [CrossRef]
- Hoang, N.-D.; Chen, C.-T.; Liao, K.-W. Prediction of chloride diffusion in cement mortar using Multi-Gene Genetic Programming and Multivariate Adaptive Regression Splines. Measurement 2017, 112, 141–149. [Google Scholar] [CrossRef]
- Fuhaid, A.; Alanazi, A.F. Prediction of Chloride Diffusion Coefficient in Concrete Modified with Supplementary Cementitious Materials Using Machine Learning Algorithms. Materials 2023, 16, 1277. [Google Scholar] [CrossRef] [PubMed]
- Parichatprecha, R.; Nimityongskul, P. Analysis of durability of high performance concrete using artificial neural networks. Constr. Build. Mater. 2008, 23, 910–917. [Google Scholar] [CrossRef]
- Boğa, A.R.; Öztürk, M.; Topçu, I.B. Using ANN and ANFIS to predict the mechanical and chloride permeability properties of concrete containing GGBFS and CNI. Compos. Part B Eng. 2013, 45, 688–696. [Google Scholar] [CrossRef]
- Haruna, S.I.; Ibrahim, Y.E.; Adamu, M.; Ahmed, O.S. Determination of Final Strand Slips of Prestressed Precast Hollow-Core Slabs Subjected to Flexural Load Using Machine Learning Algorithms. Buildings 2023, 13, 2013. [Google Scholar] [CrossRef]
- Murali, G.; Asrani, N.P.; Ramkumar, V.R.; Siva, A.; Haridharan, M.K. Impact Resistance and Strength Reliability of Novel Two-Stage Fibre-Reinforced Concrete. Arab. J. Sci. Eng. 2018, 44, 4477–4490. [Google Scholar] [CrossRef]
- Ganesan, N.; Raj, J.B.; Shashikala, A. Flexural fatigue behavior of self compacting rubberized concrete. Constr. Build. Mater. 2013, 44, 7–14. [Google Scholar] [CrossRef]
- Liu, F.; Meng, L.-Y.; Ning, G.-F.; Li, L.-J. Fatigue performance of rubber-modified recycled aggregate concrete (RRAC) for pavement. Constr. Build. Mater. 2015, 95, 207–217. [Google Scholar] [CrossRef]
- Gupta, T.; Chaudhary, S.; Sharma, R.K. Mechanical and durability properties of waste rubber fiber concrete with and without silica fume. J. Clean. Prod. 2016, 112, 702–711. [Google Scholar] [CrossRef]
- Haruna, S.I.; Zhu, H.; Shao, J. Experimental study, modeling, and reliability analysis of impact resistance of micro steel fiber-reinforced concrete modified with nano silica. Struct. Concr. 2022, 23, 1659–1674. [Google Scholar] [CrossRef]


| ft (MPa) | Cfc (MPa) | P (kN) | ρ (kg/m3) | N1 (Blow) | N2 (Blow) | |
|---|---|---|---|---|---|---|
| Min | 0.00 | 22.30 | 1.31 | 1946.11 | 2.00 | 5.00 |
| Max | 4.30 | 66.50 | 6.78 | 2385.03 | 198.00 | 216.00 |
| mean | 2.93 | 42.61 | 3.57 | 2063.12 | 39.61 | 47.31 |
| SD | 1.41 | 15.49 | 1.68 | 63.20 | 42.93 | 45.95 |
| Kurtosis | −0.02 | −1.19 | −0.42 | 3.95 | 2.42 | 2.12 |
| Skewness | −1.15 | 0.41 | 0.75 | 1.21 | 1.78 | 1.68 |
| Matric | Formula | Description |
|---|---|---|
| NSE | The NSE defines the fitness of the model. It has values between −∞ and 1. NSE = 1 indicates the highest prediction accuracy and vice versa. | |
| MAE | MAE has a value between 0 < MAE < ∞, indicating the MAE value between the measured and target values. | |
| RMSE | Describing the difference between the experimental and target values, a lower RMSE value indicates good performance. | |
| PBIAS | The PBIAS is used to calculate the average tendency of the computed values, bigger or smaller than the experimental results. |
| Model | Training | Verification | ||||||
|---|---|---|---|---|---|---|---|---|
| NSE | RMSE | MAE | PBIAS | NSE | RMSE | MAE | PBIAS | |
| SVR | 0.9983 | 0.0177 | 0.0139 | 0.0248 | 0.9934 | 0.0101 | 0.0065 | 0.0705 |
| GPR | 0.9983 | 0.0174 | 0.0135 | 0.0242 | 0.9961 | 0.0078 | 0.0050 | 0.0536 |
| IEPANN | 0.9999 | 0.0031 | 0.0010 | 0.0018 | 0.9996 | 0.0025 | 0.0009 | 0.0095 |
| Reference | AI-Based Model | Material | Input Variables | Datasets | R2 |
|---|---|---|---|---|---|
| Boga et al. [66] | ANN and ANFIS | concrete | 4 | 162 | 0.98 |
| Alfuhaid [64] | ANN, ANFIS, SVM, and ELM | concrete | 8 | 105 | 0.959 |
| Pirachatprecha et al. [65] | ANN | HPC | 8 | 86 | 0.98 |
| Hoang et al. [63] | ANN and ANFIS | concrete | 4 | 162 | 0.982 |
| Specimen ID | Impact Strength | τ | τLn(z) | (z) | R2 |
|---|---|---|---|---|---|
| NC reference | N1 | 3.6 | 11.835 | 27 | 0.9838 |
| N2 | 4.596 | 16.134 | 34 | 0.9775 | |
| NCNB-UHPC | N1 | 3.664 | 11.645 | 24 | 0.9775 |
| N2 | 4.515 | 15.203 | 29 | 0.9727 | |
| NCGB-UHPC | N1 | 3.499 | 8.685 | 12 | 0.9805 |
| N2 | 4.809 | 13.731 | 17 | 0.9831 | |
| NCNB-PUPC | N1 | 5.194 | 25.851 | 144 | 0.9708 |
| N2 | 5.528 | 28.01 | 157 | 0.9705 | |
| NCGB-UUPC | N1 | 3.227 | 12.847 | 54 | 0.9895 |
| N2 | 3.959 | 16.524 | 65 | 0.9791 | |
| NCSM-PUPC | N1 | 3.374 | 12.429 | 39 | 0.9174 |
| N2 | 4.161 | 16.368 | 52 | 0.9052 |
| Specimen ID | Impact Strength | Survival Probability | |||||
|---|---|---|---|---|---|---|---|
| λ = 0.01 | Λ = 0.2 | λ = 0.6 | λ = 0.8 | λ = 0.9 | λ = 0.99 | ||
| NC reference | N1 | 41 | 30 | 22 | 18 | 14 | 7 |
| N2 | 47 | 37 | 29 | 24 | 21 | 12 | |
| NCNF-UHPC | N1 | 36 | 27 | 20 | 16 | 13 | 7 |
| N2 | 41 | 32 | 25 | 21 | 18 | 7 | |
| NCGS-UHP | N1 | 19 | 14 | 10 | 8 | 6 | 3 |
| N2 | 23 | 19 | 15 | 12 | 11 | 6 | |
| NCNF-PUPC | N1 | 195 | 158 | 126 | 107 | 91 | 57 |
| N2 | 212 | 172 | 138 | 117 | 101 | 63 | |
| NCGS -PUPC | N1 | 85 | 61 | 43 | 33 | 26 | 13 |
| N2 | 94 | 73 | 55 | 45 | 38 | 22 | |
| NCSS-PUPC | N1 | 62 | 45 | 32 | 25 | 20 | 10 |
| N2 | 75 | 58 | 44 | 36 | 30 | 17 | |
Disclaimer/Publisher’s Note: The statements, opinions and data contained in all publications are solely those of the individual author(s) and contributor(s) and not of MDPI and/or the editor(s). MDPI and/or the editor(s) disclaim responsibility for any injury to people or property resulting from any ideas, methods, instructions or products referred to in the content. |
© 2025 by the authors. Licensee MDPI, Basel, Switzerland. This article is an open access article distributed under the terms and conditions of the Creative Commons Attribution (CC BY) license (https://creativecommons.org/licenses/by/4.0/).
Share and Cite
Haruna, S.I.; Ibrahim, Y.E.; Umar, I.K. Machine Learning Approach for Prediction and Reliability Analysis of Failure Strength of U-Shaped Concrete Samples Joined with UHPC and PUC Composites. J. Compos. Sci. 2025, 9, 23. https://doi.org/10.3390/jcs9010023
Haruna SI, Ibrahim YE, Umar IK. Machine Learning Approach for Prediction and Reliability Analysis of Failure Strength of U-Shaped Concrete Samples Joined with UHPC and PUC Composites. Journal of Composites Science. 2025; 9(1):23. https://doi.org/10.3390/jcs9010023
Chicago/Turabian StyleHaruna, Sadi I., Yasser E. Ibrahim, and Ibrahim Khalil Umar. 2025. "Machine Learning Approach for Prediction and Reliability Analysis of Failure Strength of U-Shaped Concrete Samples Joined with UHPC and PUC Composites" Journal of Composites Science 9, no. 1: 23. https://doi.org/10.3390/jcs9010023
APA StyleHaruna, S. I., Ibrahim, Y. E., & Umar, I. K. (2025). Machine Learning Approach for Prediction and Reliability Analysis of Failure Strength of U-Shaped Concrete Samples Joined with UHPC and PUC Composites. Journal of Composites Science, 9(1), 23. https://doi.org/10.3390/jcs9010023