Article

Assessment of Wear and Surface Roughness Characteristics of Polylactic Acid (PLA)—Graphene 3D-Printed Composites by Box–Behnken Method

by
Manjunath G. Avalappa
1,
Vaibhav R. Chate
2,
Nikhil Rangaswamy
3,
Shriranganath P. Avadhani
1,
Ganesh R. Chate
1 and
Manjunath Shettar
4,*
1
Department of Mechanical Engineering, K. L. S. Gogte Institute of Technology, Belagavi 590008, India
2
Department of Civil Engineering, K. L. S. Gogte Institute of Technology, Belagavi 590008, India
3
School of Mechanical Engineering, REVA University, Bengaluru 560064, India
4
Department of Mechanical and Industrial Engineering, Manipal Institute of Technology, Manipal Academy of Higher Education, Manipal 576104, India
*
Author to whom correspondence should be addressed.
J. Compos. Sci. 2025, 9(1), 1; https://doi.org/10.3390/jcs9010001
Submission received: 16 October 2024 / Revised: 28 November 2024 / Accepted: 13 December 2024 / Published: 24 December 2024
(This article belongs to the Special Issue Theoretical and Computational Investigation on Composite Materials)

Abstract

The biodegradability and comparatively less harmful degradation of polylectic acid (PLA) make it an appealing material in many applications. The composite material is used as a feed for a 3D printer, consisting of PLA as a matrix and graphene (3 wt.%) as reinforcement. The composite is extruded in the form of wires using a screw-type extruder machine. Thus, prepared wire is used to 3D print the specimens using fused deposition modeling (FDM) type additive manufacturing technology. The specimens are prepared by varying the different process parameters of the FDM machine. This study’s primary objective is to understand the tribological phenomena and surface roughness of PLA reinforced with graphene. Initially, pilot experiments are conducted to screen essential factors of the FDM machine and decide the levels that affect the response variables, such as surface roughness and wear. The three factors, viz., layer height, printing temperature, and printing speed, are considered. Further experiments and analysis are conducted using the Box–Beheken method to study the tribological behavior of 3D-printed composites and the effect of these parameters on surface roughness and wear loss. It is interesting to note that layer height is significant for surface roughness and wear loss. The optimum setting for minimum surface roughness is layer height at 0.16 mm, printing temperature at 180 °C, and printing speed at 60 mm/s. The optimum setting for minimum wear loss is layer height at 0.24 mm, printing temperature at 220 °C, and printing speed at 90 mm/s. The desirability function approach is used to optimize (multiobjective optimization) both surface roughness and wear loss. The layer height of 0.16 mm, printing temperature of 208 °C, and printing speed of 90 mm/s are the optimum levels for a lower surface roughness and wear loss. The SEM images reveal various wear mechanisms, viz., abrasive grooves, micro-fractures, and the presence of wear debris. The work carried out helps to make automobile door panels since they undergo wear due to excessive friction, aging, material degradation, and temperature fluctuations. These are taken care of by graphene addition in PLA with an optimized printing process, and a good surface finish helps with proper assembly.

1. Introduction

Three-dimensional printing, also known as additive manufacturing, is a transformative technology that creates three-dimensional objects by layering materials based on digital designs. This process contrasts traditional subtractive manufacturing, where the material is removed from a larger block, and opens new possibilities for design, customization, and production efficiency. Three-dimensional printing initially gained traction for rapid prototyping but has since evolved to encompass diverse applications across industries, including automotive, aerospace, healthcare, and consumer goods [1,2].
The 3D printing process begins with a digital model, often created with computer-aided design (CAD) software. This model is then “sliced” into thin layers, which guide the printer in depositing material, layer by layer, until the object is complete [3]. Different types of 3D printing technologies exist, such as fused deposition modeling (FDM), Selective Laser Sintering (SLS), and Stereolithography (SLA), each suited to specific materials and applications. These materials can range from thermoplastics and resins to metals, ceramics, and even biocompatible materials used in medical fields [4]. Three-dimensional printing offers significant advantages, including customization, reduced waste, and the ability to produce complex geometries that would be impossible with traditional manufacturing methods [5].
Fused deposition modeling (FDM) is one of the most popular AM techniques due to its affordability, simplicity, and adaptability. FDM entails layer-by-layer extrusion of a thermoplastic filament to create three-dimensional objects [6]. FDM is especially popular for prototyping, functional testing, and small-batch production because it is cost-effective and easy to operate. It is commonly used in education, engineering, automotive, and consumer product design [7]. One of its key advantages is the low cost of entry compared to other 3D printing technologies, making it accessible for both industrial and hobbyist use.
Polylactic acid (PLA) is a widely used thermoplastic in FDM due to its ability to biodegrade, be reusable, and be simple to manufacture. The PLA-based materials help to balance the product’s performance and eco-friendliness, as PLA is biodegradable [8,9]. PLA’s properties make it ideal for a wide range of applications [10], especially for prototypes, visual models, and products that do not require high strength or thermal resistance. It has a relatively low melting point, generally between 180 °C and 220 °C, which makes it easier to work with and reduces the risk of warping during printing. PLA’s versatility, coupled with its eco-friendly production, makes it a popular choice not only for 3D printing but also for applications in packaging, disposable tableware, and medical implants [11]. Ongoing research is focused on enhancing PLA’s properties through blending or incorporating fillers to increase its strength and thermal stability, further expanding its range of applications [12].
Graphene is often considered a “wonder material” with potential applications across numerous fields, including electronics, materials science, medicine, and energy storage. It has high strength, is the thinnest, is lightweight, has high thermal and electronic conductivity, is durable, and many more [13,14]. Due to these properties, graphene is used in a wide range of applications like field emission displays, gas and bio-sensors, field effect transistors, batteries, and transparent electrodes. Graphene is also used to develop different electrical, electronic, and strain sensors. Due to the anticorrosion and biocompatibility properties of graphene, it is extensively used as a coating material in dental and medical implant applications [15].
Incorporating graphene into composites holds great potential for enhancing material properties and enabling new functionalities. The dispersion of graphene in composites is crucial, and various techniques are employed to achieve a uniform dispersion for improved mechanical and electrical properties. Continued research and development efforts are needed to overcome challenges and fully exploit the benefits of graphene-based composites in various industries. The graphene-based composites find applications in regenerative engineering, sensors for medical applications, optical applications, membranes, biocomposites, etc. [16,17]. Many researchers have carried out 3D printing of composite materials. Nikzad et al. [18] emphasized 3D printing of iron-ABS, copper-ABS, and particle-based composites using FDM. Thermal conductivity enhancement and reduction in the coefficient of thermal expansion are observed. Shemelya et al. [19] 3D printed tungsten-doped polycarbonate polymer using the FDM type 3D printer. The results reveal that there is an enhancement in the properties of the X-ray attenuation factor and impact resistance, and it can be used as an X-ray shielding material. Santo et al. [20] developed PLA–graphene composites using electrochemical and chemical exfoliation. A single-screw extruder is used to convert the composite into FDM filament feedstock. The ANOVA test is carried out on filler load, filler type, and solvent. However, the work does not include the analysis of the process parameters of the FDM machine, which is going to produce the actual product. Yan et al. [21] developed the PLA/GR-Fe3O4 composites using a melt extrusion process. The filaments are 3D printed. The results revealed that the printed objects have excellent electromagnetic absorption.
On the other hand, many process parameters affect the performance of any system. Optimizing those parameters is paramount to obtaining good-quality output and avoiding collective losses [22]. In FDM, many process parameters affect the print quality. Most of the literature either focuses on the 3D printing of composites or the process optimization of 3D printers. Deswal et al. [23] used a hybrid technique to optimize the process parameters of the FDM machine. However, the work focuses on using the tool for optimization and is restricted to only ABS material. Heidari-Rarani et al. [24] used the Taguchi technique to optimize the setting for better tensile strength for PLA material. The parameters such as infill density, layer thickness, and speed are considered for the study. Significant improvements in tensile properties are observed for optimized parameter levels. Raj Mohan et al. [25] used the Box–Behnken design of “response surface methodology” to optimize the parameters of the FDM machine for the responses, such as surface roughness, cycle time, micro-hardness, and density. The ABS material is used for the study. Nagendra et al. [26] used the L27 orthogonal array of the Taguchi technique to optimize FDM process parameters for Nylon–Aramid composite materials. Most of the reported research work has focused on optimizing the process parameters of the FDM machine for the existing material.
The PLA–graphene composites find their application in the automotive, biomedical, and aerospace sectors [27]. In automotive applications, PLA is used in doors, side panels, hoods, etc. [28]. Nasir Bashir et al. [29] emphasized their work on the thermal analysis of PLA graphene 3D-printed composites using the L9 orthogonal array of the Taguchi technique. However, the authors have not considered wear to be the response, layer height, or temperature to be the factor. Adding graphene to PLA significantly improves hardness, tensile strength, flexural strength, and thermal properties [30].
The novelty of the present work is developing the 3D-printed parts from PLA–graphene-based composite material, using FDM, and optimizing the process parameters. Wear loss and surface roughness are considered as the responses for the study. The responses are considered based on the fact that wear loss decides the product life, and on the other hand, surface finish helps in assembling the components. The present work employs the Box–Behnken technique to optimize the FDM process parameters. This research seeks to contribute to developing 3D-printed parts with enhanced wear performance that are more reliable and durable. The findings can be applied to various industries, such as the automotive, aerospace, medical, and consumer products sectors, where wear resistance is essential for component durability and performance. This research will ultimately pave the way for the widespread adoption of FDM-based additive manufacturing techniques in applications with high attrition rates.

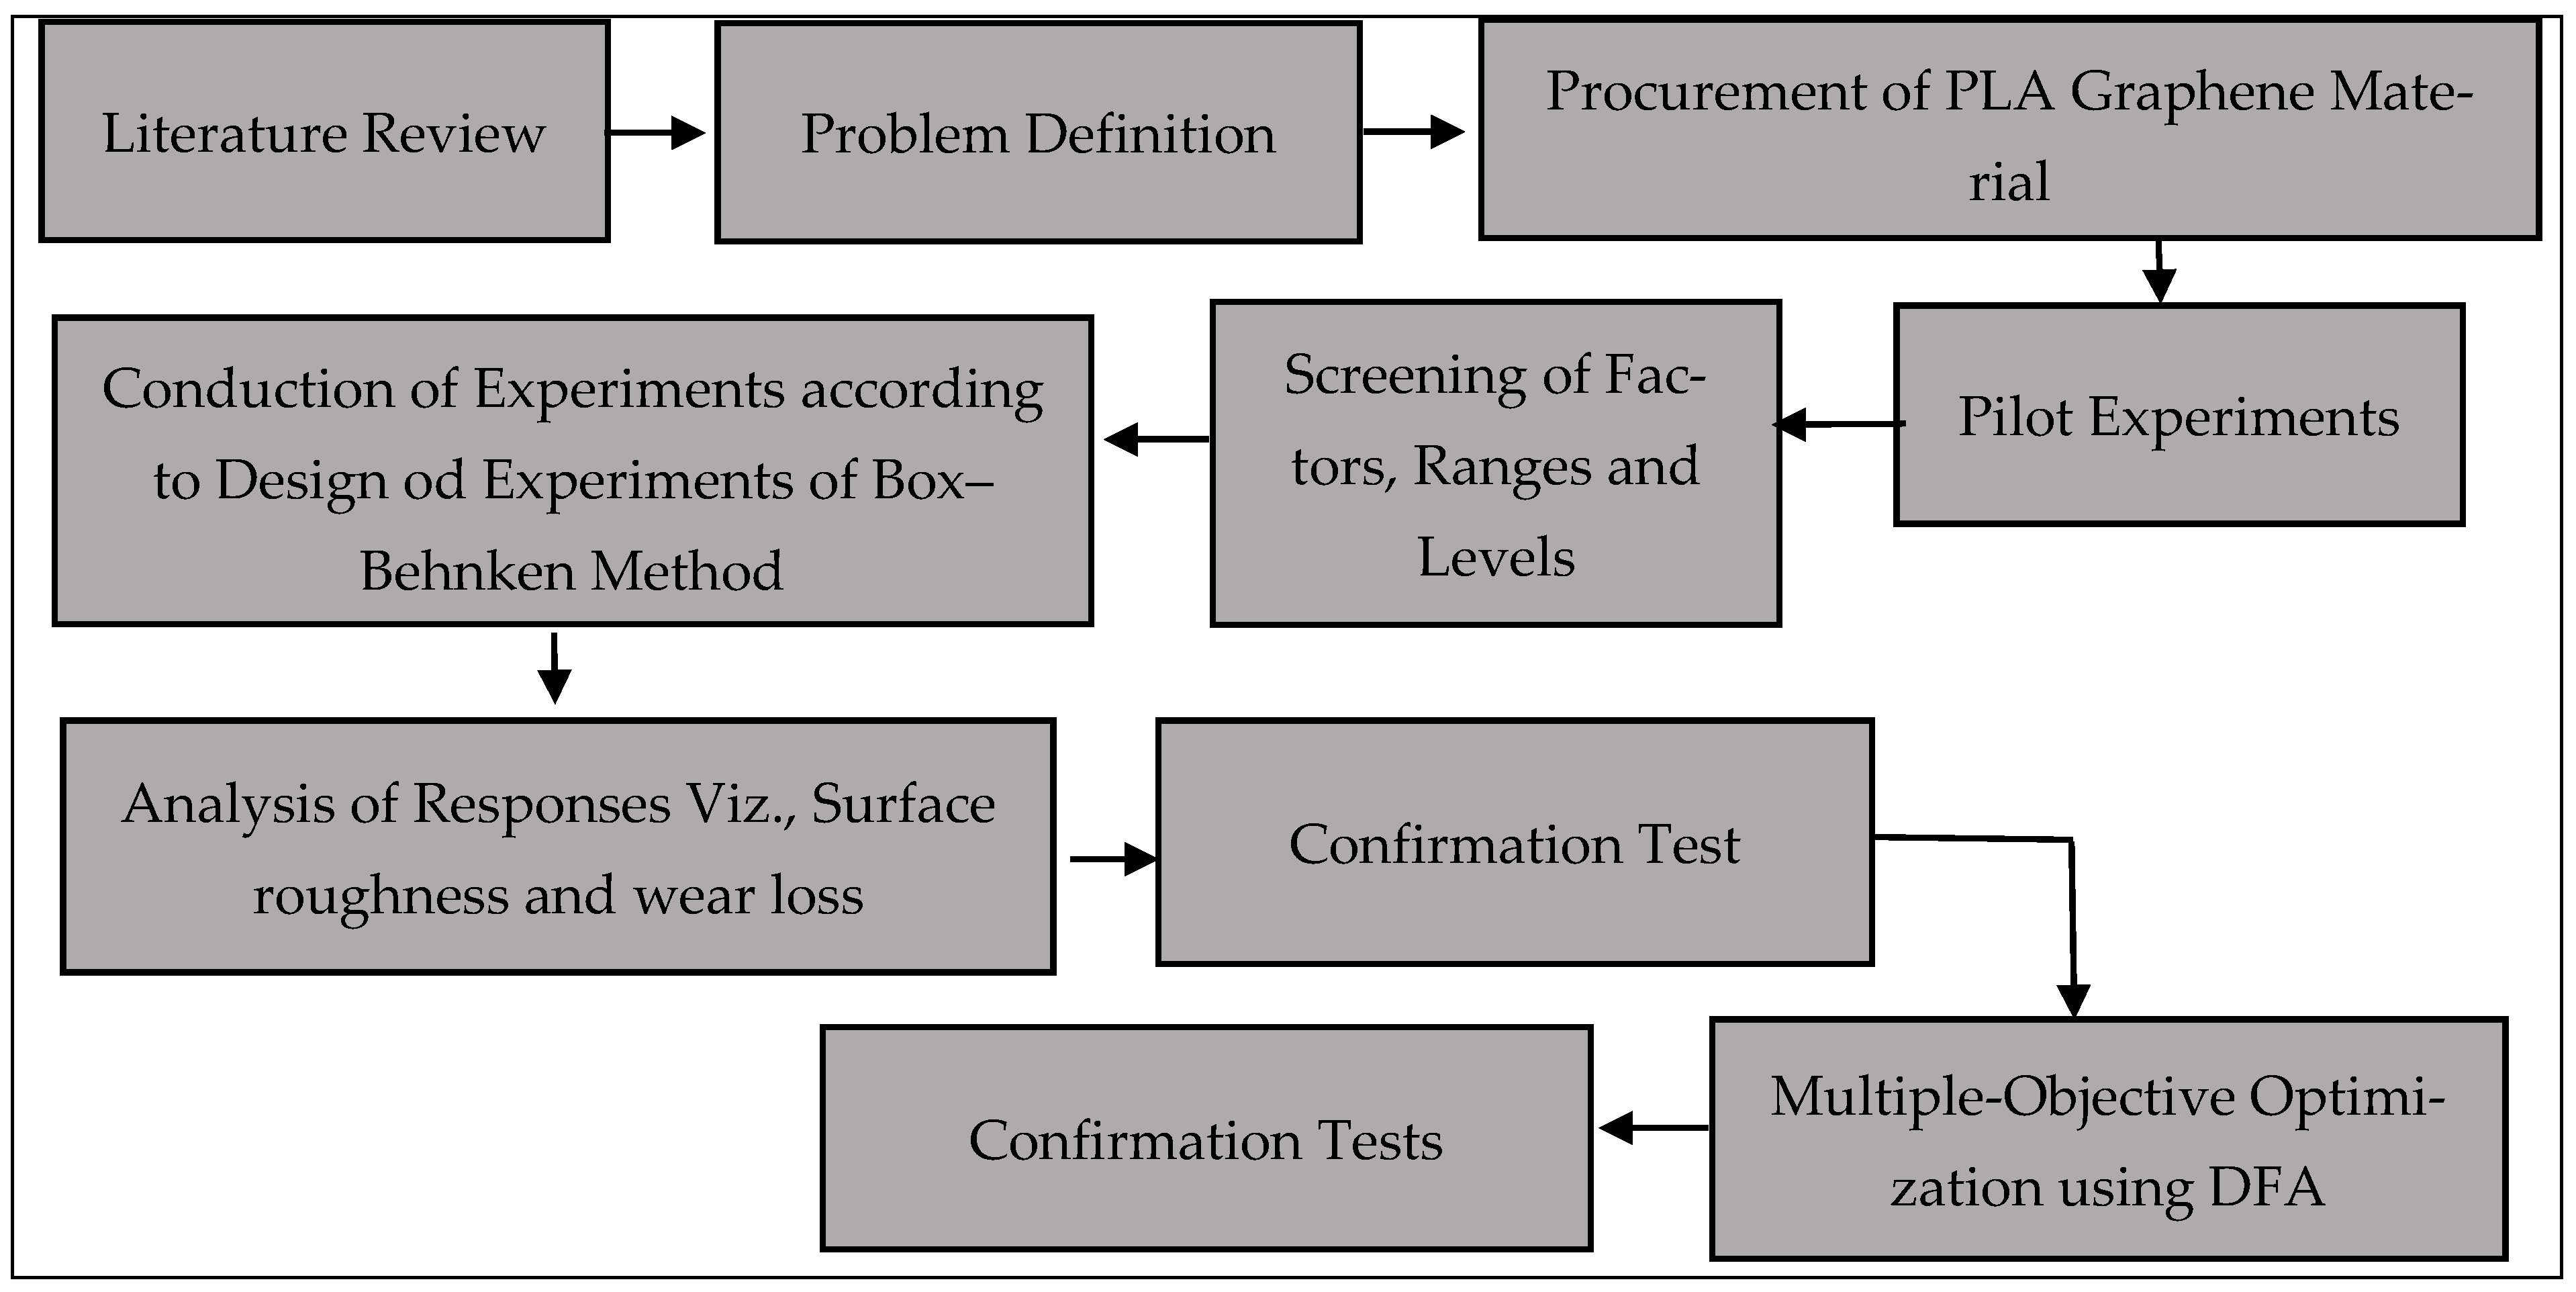
2. Materials and Methods

2.1. Materials and Processing

The 3D-printed specimens are made using a filament that consists of polylectic acid (PLA) and graphene (3 wt.%). The filament is sourced from Karo3D (Bangalore, Karnataka, India). The filament diameter is 1.75 mm, and technical specifications are presented in Table 1. The technical specifications of the 3D printer are presented in Table 2. The pilot experiments are conducted to identify essential process parameters; after screening, the printing speed, printing temperature, and layer height are considered for the study. These variables are varied at three different levels. The other parameters, such as bed temperatures, raster width, and raster angle, are kept constant, and the same values are presented in Table 3. The 3D modeling is created using SolidWorks-2016 software (version 24), and an STL file is used. The model is sliced using the software Ultimaker Cura (version 5.5). The methodology of the work is shown in Figure 1. The fabrication process of PLA–graphene-based composites using fused deposition modeling (FDM) 3D printing is shown in Figure 2.

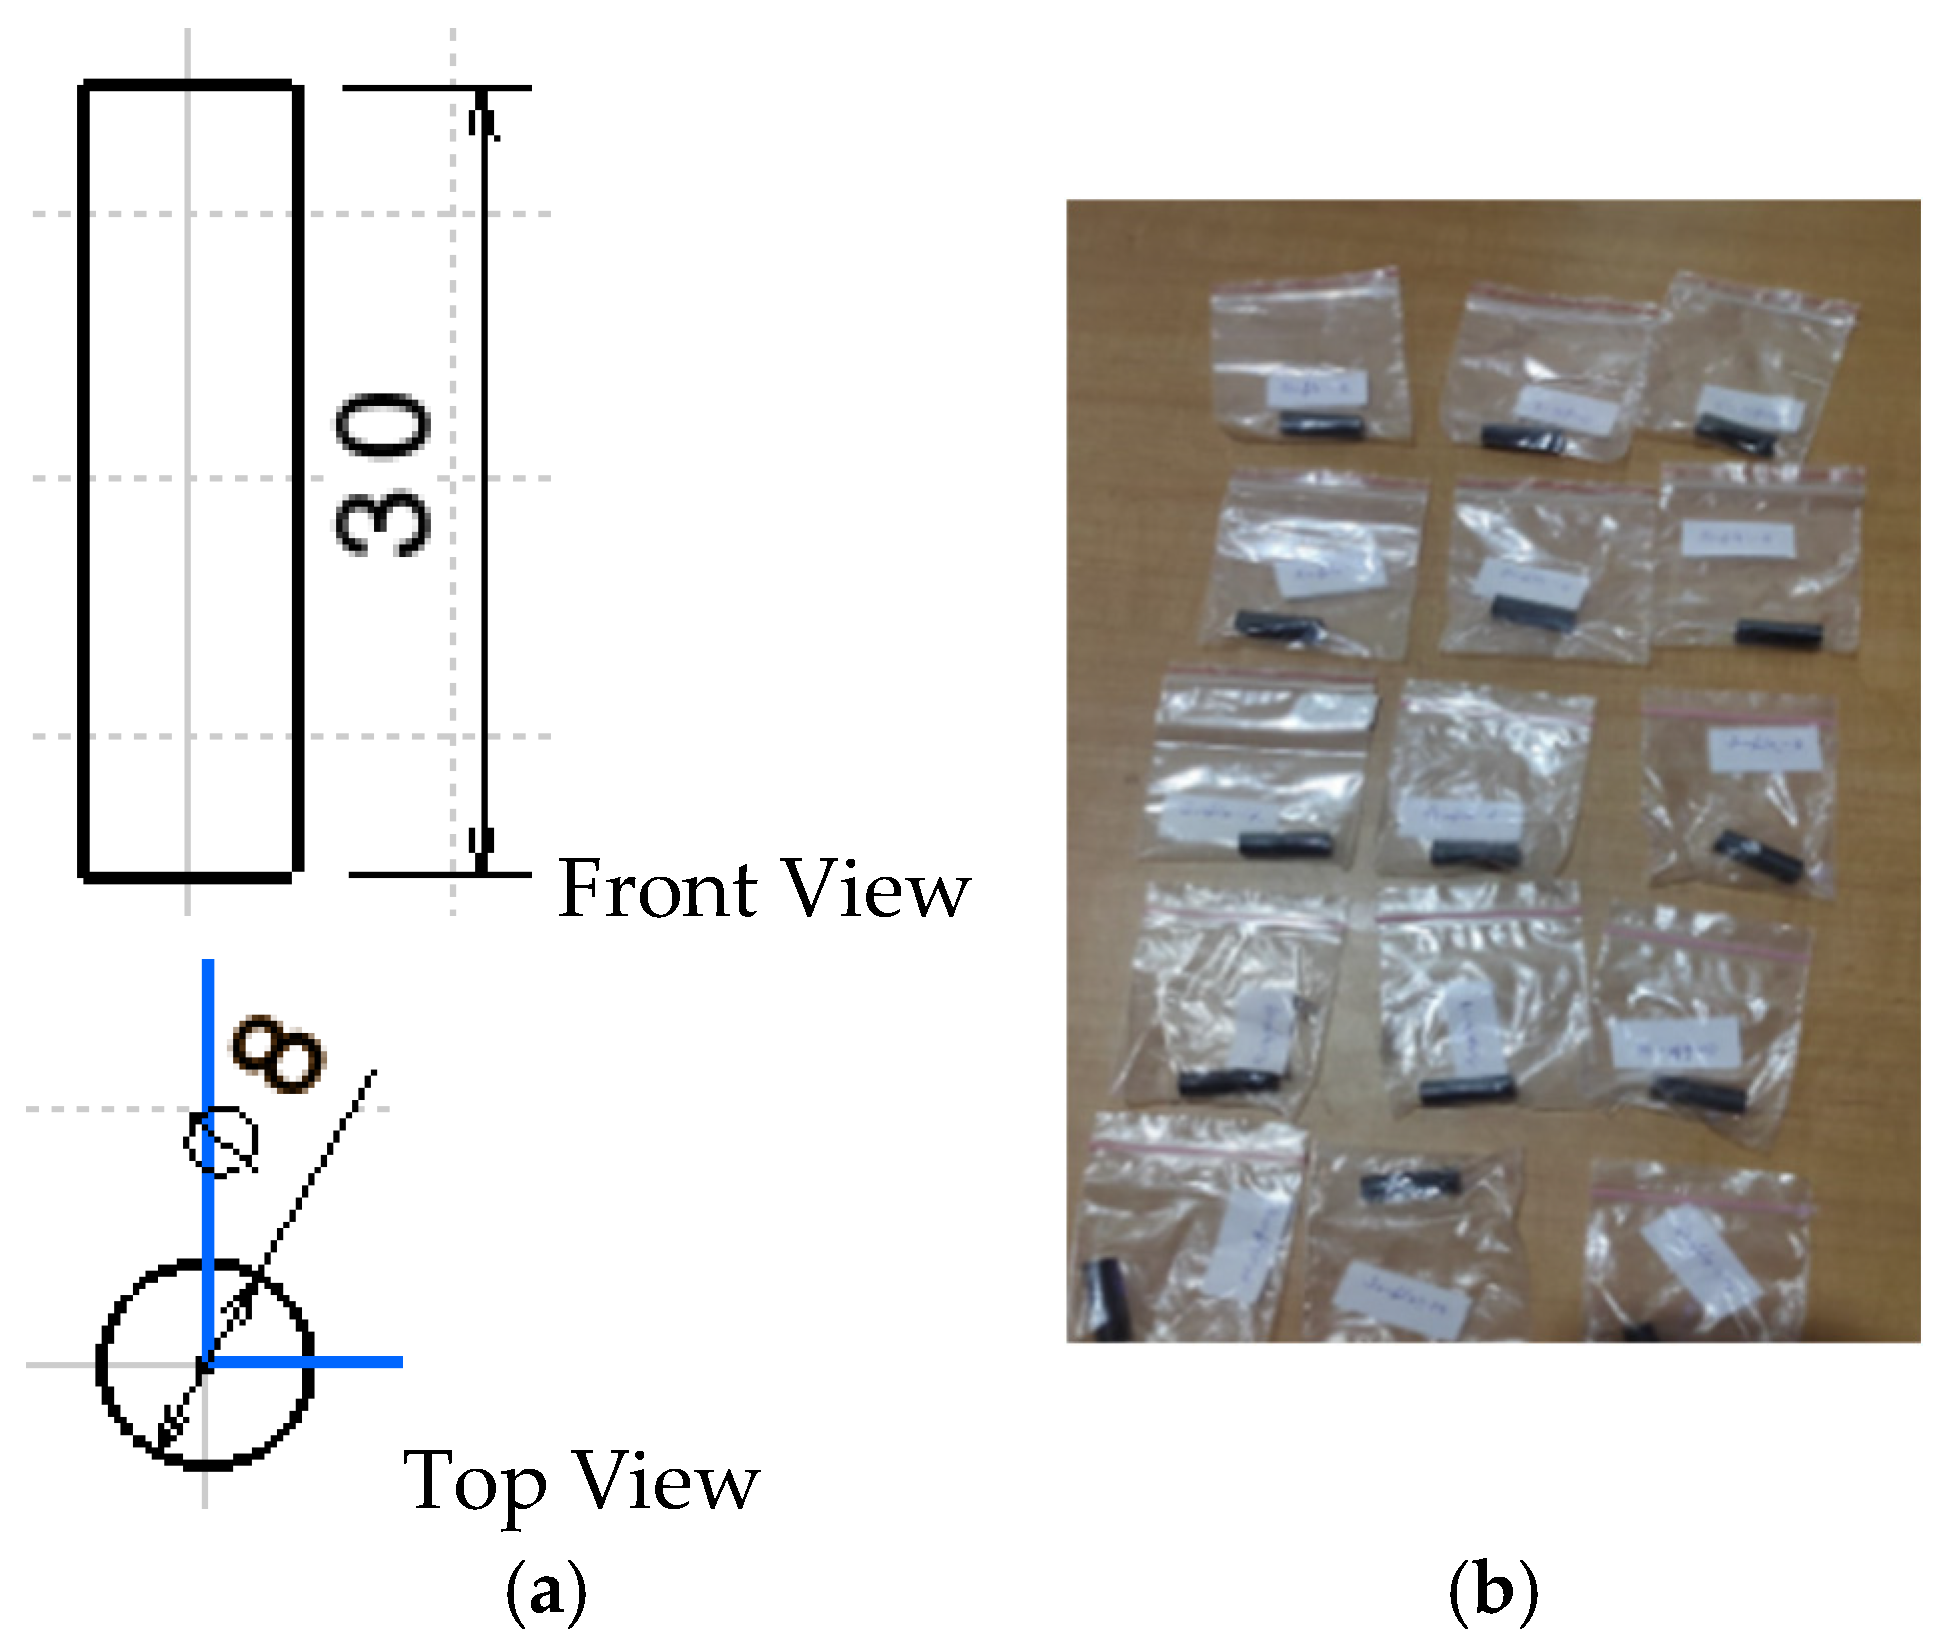
2.2. Sample Preparation

A total of 15 specimens are printed using a 3D printer to find out surface roughness by keeping layer height, printing temperature, and printing speed as process parameters. Specimens (Figure 3) with exact dimensions (in mm) are used for evaluating tribological properties.

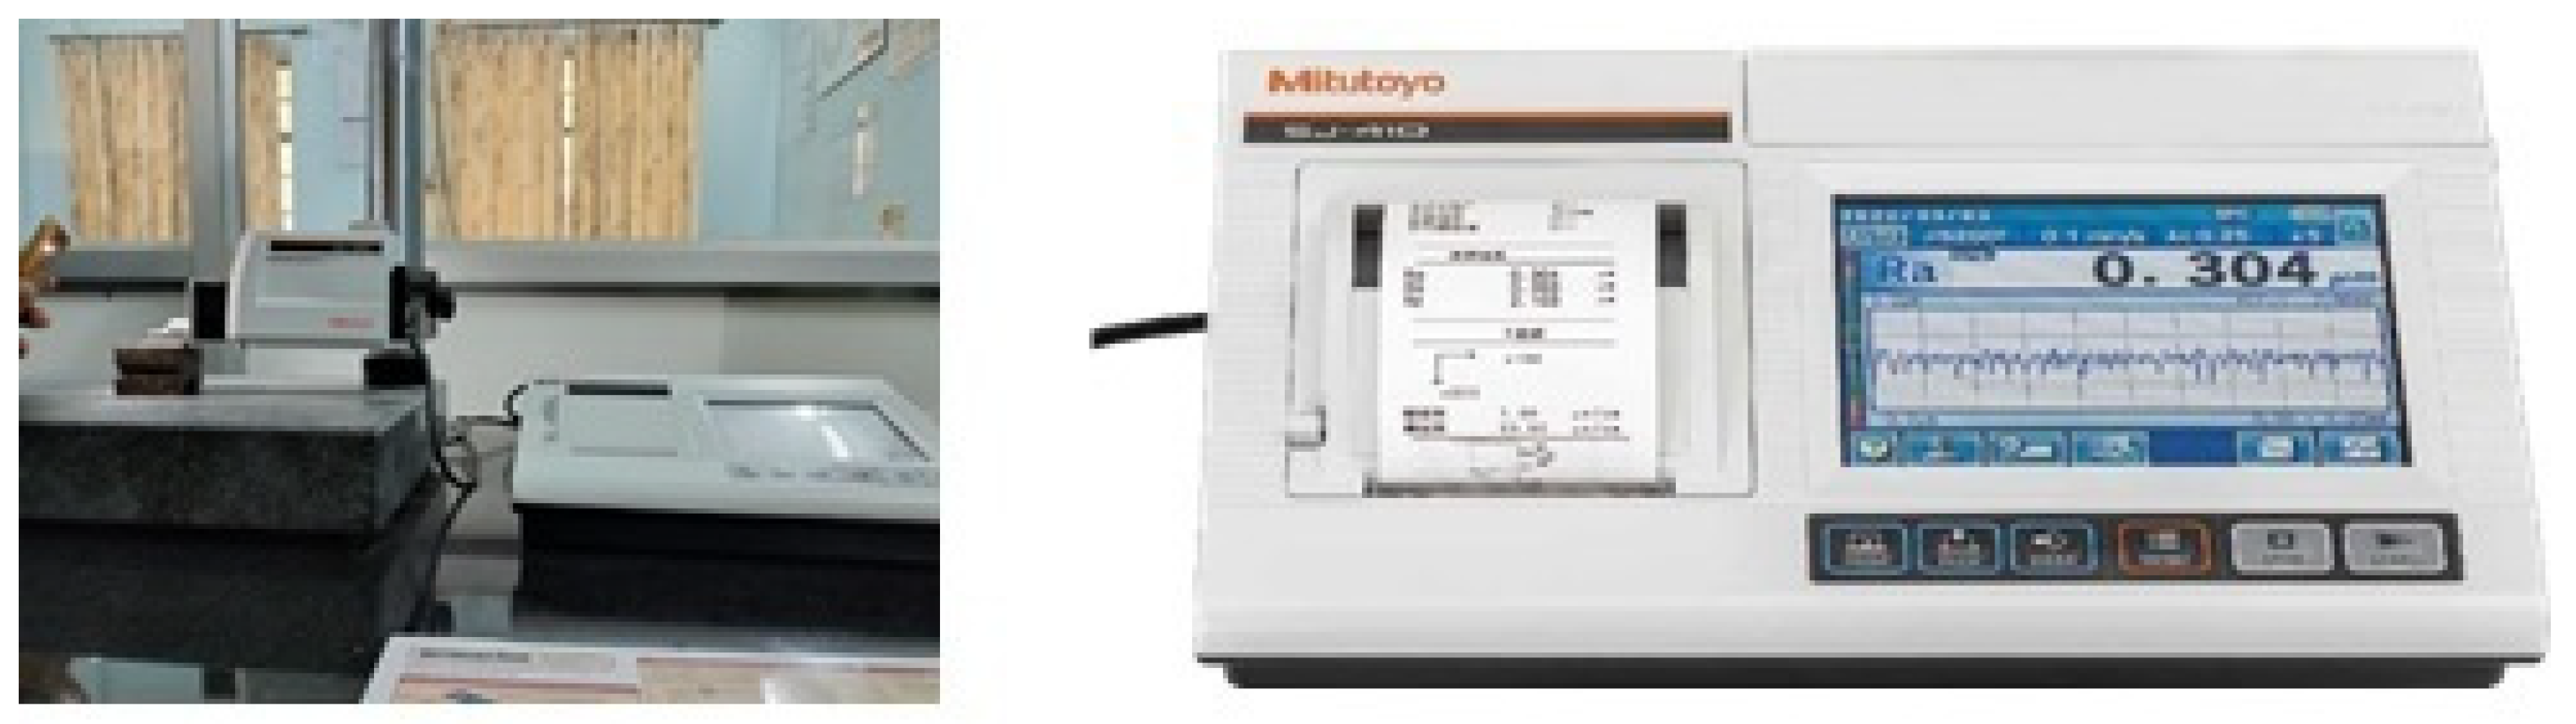
2.3. Surface Roughness Test

In this study, the surface roughness of the 3D-printed samples is evaluated using the Mitutoyo Model SJ-410 Portable Surface Roughness Tester manufactured by Mitutoyo Corporation (Kawasaki, Japan) and purchased in India (Figure 4). The samples are prepared by cutting 3D-printed PLA–graphene composites. The surface is cleaned thoroughly to remove any dirt, oil, or debris that might interfere with accurate measurements. All samples are placed in a controlled environment for at least 24 h to ensure stability in surface characteristics before testing. Each sample is placed on a flat surface to avoid vibrations or movements during testing. The stylus of the SJ-410 is carefully positioned on the sample’s surface. Surface roughness measurements are carried out by moving the stylus along the surface for a predefined evaluation length. Each sample’s average surface roughness values (Ra) are calculated and recorded.

2.4. Wear Test

In compliance with the ASTM G-99 standard [31,32], wear testing of 3D-printed PLA–graphene composites is conducted using a pin-on-disc apparatus. The device features a steel disc with a surface roughness of 5 microns, and a fixture holds the specimen perpendicular to the rotating disc. The load is applied through a lever mechanism. The time, load, and speed are 75 min, 8 N, and 50 rpm, respectively. The wear loss for each specimen is determined by measuring its weight before and after the test.

2.5. Experimentation

In this study, the Box–Behnken experimental design of Response Surface Methodology (RSM) is employed to reduce the number of experiments, costs, and time while also evaluating the influence of individual factors, both independently and simultaneously, on the properties of 3D-printed PLA–graphene composites. RSM is used to find the optimal solution by developing a predictive function to estimate surface roughness and wear loss (the responses in this study) and to analyze the impact of each factor (layer height (A), printing temperature (B), printing speed (C)). The process parameters (factors) and levels are selected based on the results obtained during pilot experiments conducted with PLA and PLA+graphene. During the pilot experimentation, based on the machine’s capability, all the controllable factors are altered individually, keeping other factors constant. Based on the outcome of this investigation, the factors and corresponding levels are selected.
Minitab 17 software is used to create the matrix design and analyze the experimental results. Three levels for each factor—layer height (A), printing temperature (B), and printing speed (C)—are taken into account, as shown in Table 4. A total of 15 experiments were conducted using the “Box–Behnken experimental design”, which includes three central points for the three factors, as indicated in Table 5.

2.6. SEM Analysis

Following wear tests, the specimen undergoes scientific analysis using a Scanning Electron Microscope (SEM), model EVO MA18, supplied by Carl Zeiss India. The sample is resized and firmly mounted on the microscope. Prior to SEM testing, a thin layer of conductive material is applied to the specimen using a sputter coater, a process that takes approximately 10 min to complete.

3. Results and Discussion

Table 5 shows the experimental design matrix and the average surface roughness and wear loss value. Each experiment is conducted three times (i.e., three replicates).

3.1. Surface Roughness
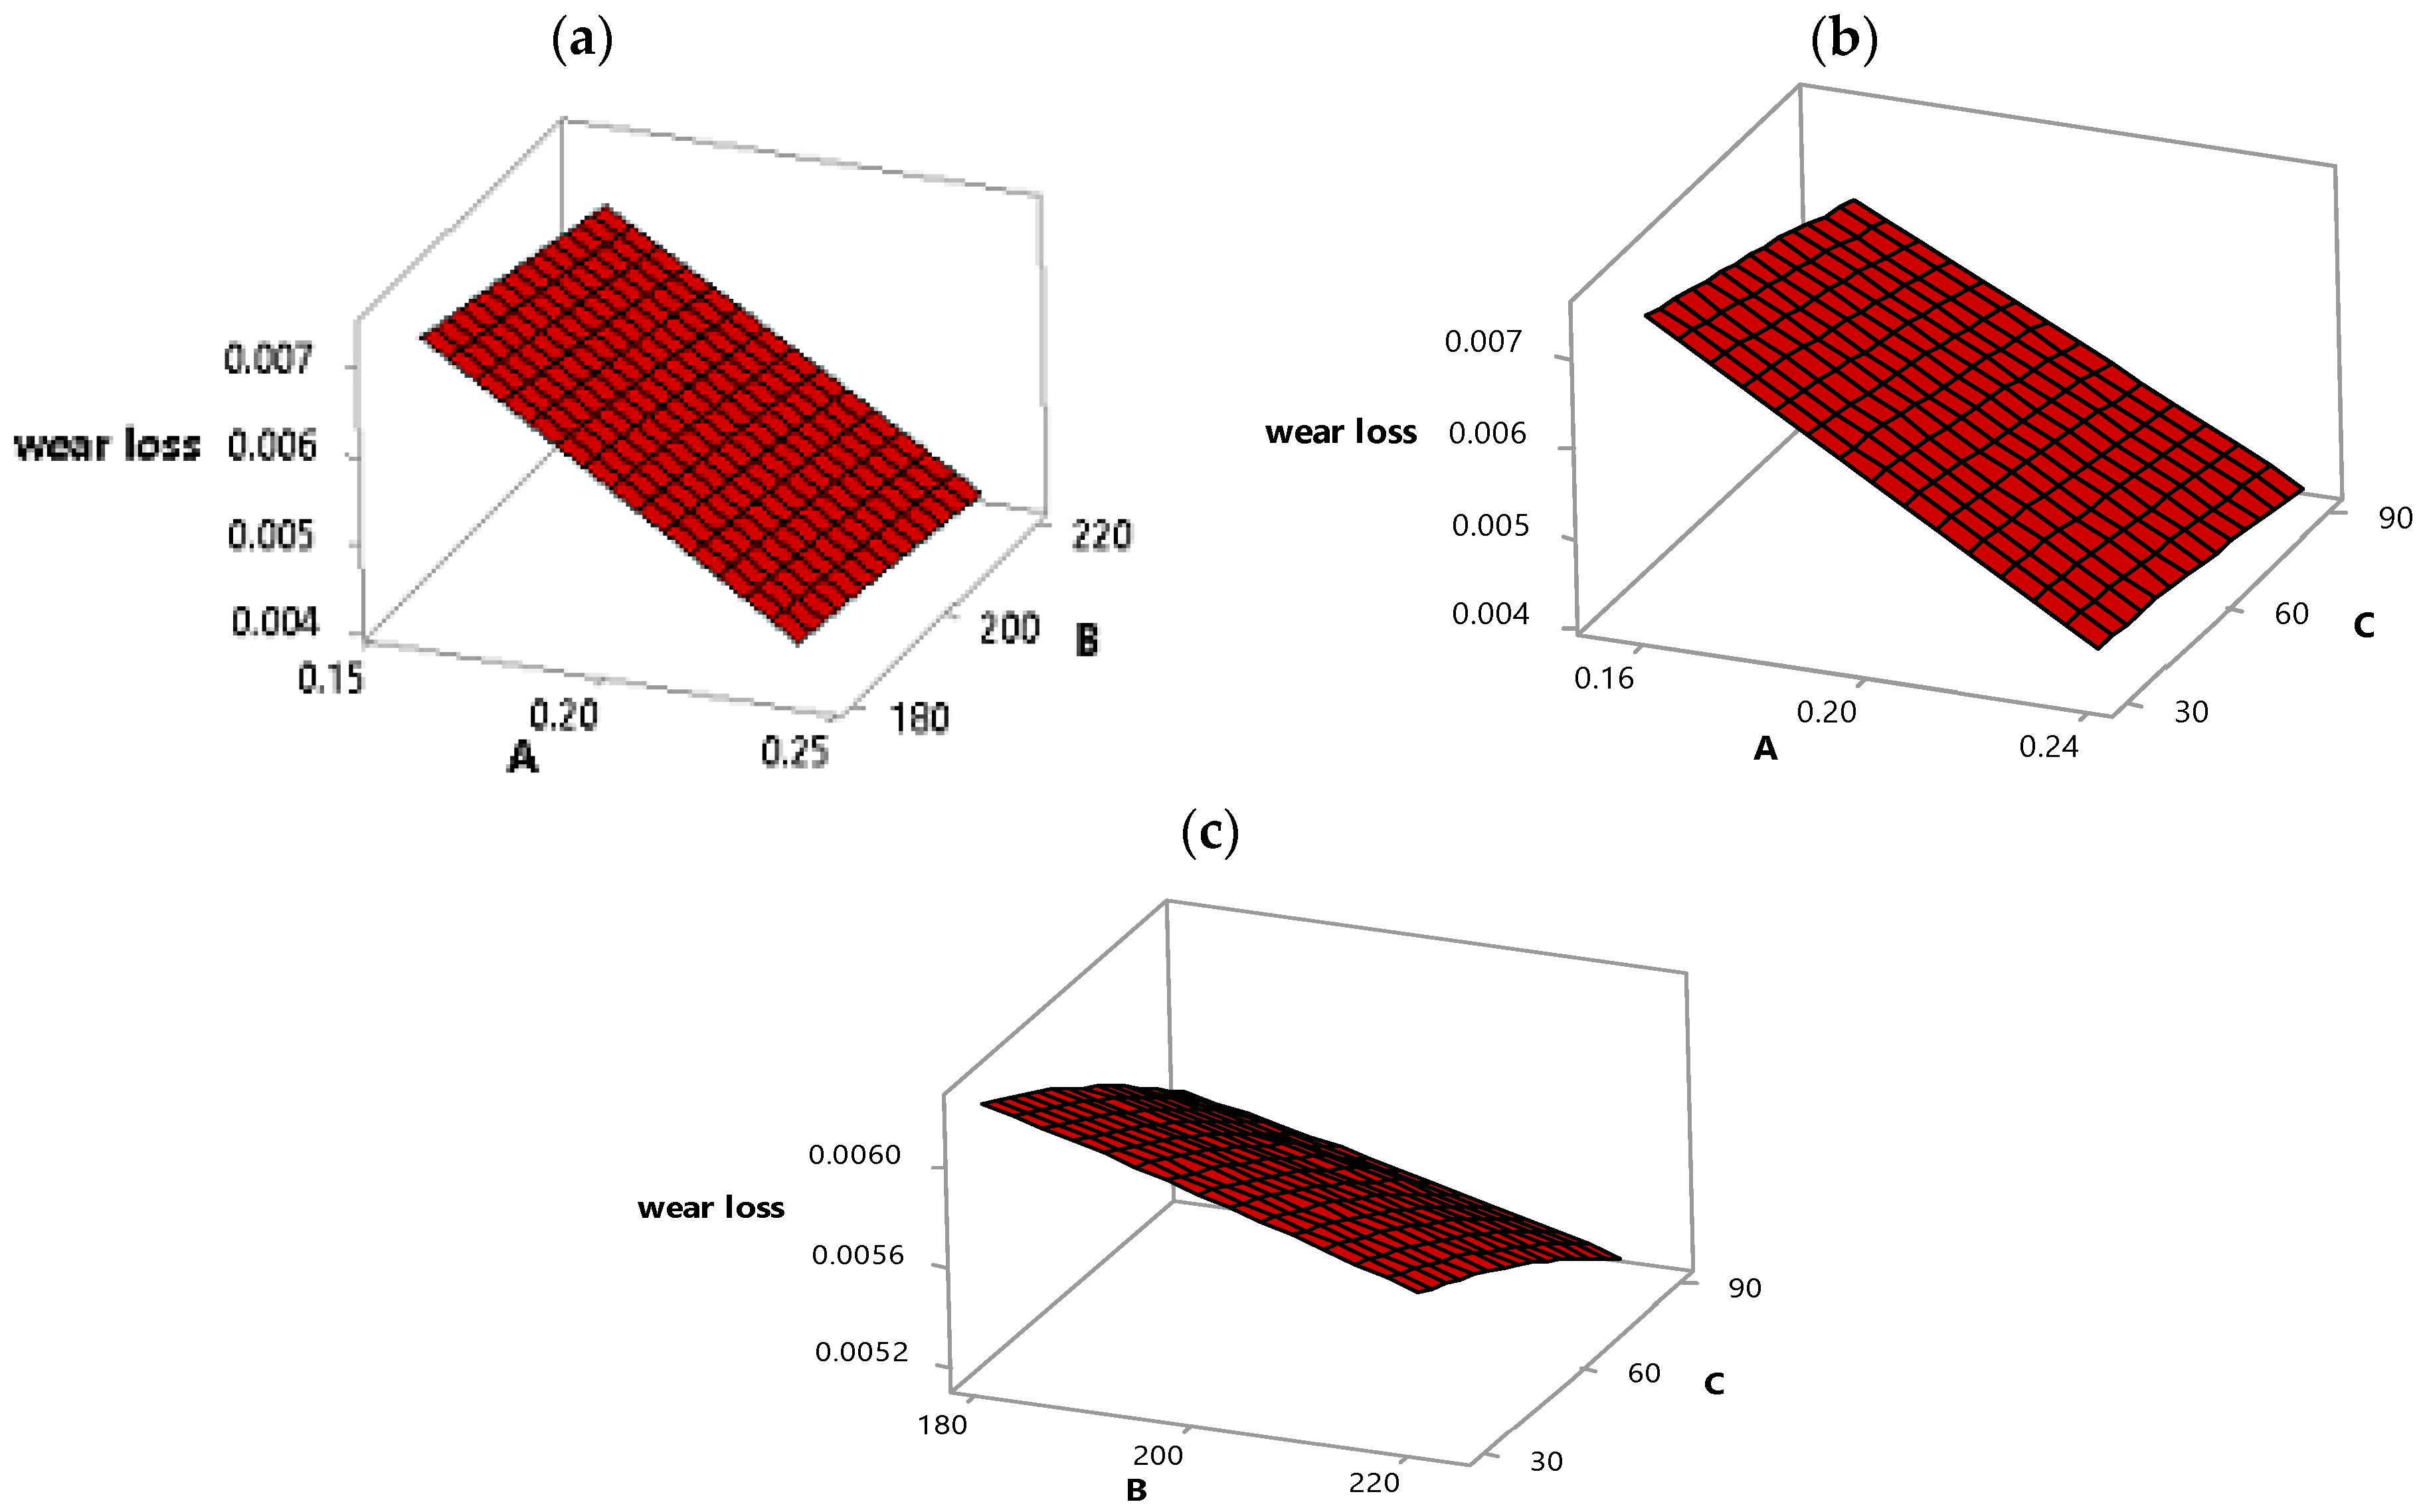
Equation (1) presents the regression model for surface roughness.
Surface roughness = 8.5 + 107 A − 0.125 B − 0.114 C − 148 A × A + 0.000445 B × B + 0.000824 C × C − 0.023 A × B + 0.365 A × C − 0.000308 B × C
The R-squared value for the above model is 96.53%. Equation (1) is quadratic and includes all the terms, including significant at 95% confidence and insignificant terms.
The Analysis of Variance (ANOVA) for the surface roughness model is shown in Table 6. The table shows that individual factors are all significant at a 95% confidence level and contribute 91.16% towards surface roughness individually. The interaction among the factors is the least contributing element to surface roughness. The error includes other factors that are not considered and cannot be controlled in experimentation. They also contribute less, i.e., 3.46%, towards surface roughness.
Figure 5 displays the main effect plots. Factor A (layer height) exerts the most significant influence on surface roughness. This influence stems from the increased heat transfer variability between the perimeter and core of the layer as layer height increases. Additionally, printing speed plays a crucial role in surface roughness. Figure 5 indicates higher roughness at lower speeds (30 mm/s), which decreases at higher speeds (60 mm/s) before increasing again at 90 mm/s. This is because, when speed is low, the binding between the layers is also less due to more loss in temperature, and again, the surface roughness is high at 90 mm/s because the layers are not appropriately oriented due to vibrations. Hence, at 60 mm/s, the surface roughness is optimum. Factor B (printing temperature) is the least significant because the range taken for experimentation is narrow for this factor. If taken at less than 180 °C, the PLA does not undergo a mushy state (glassy transition temperature), so binding does not occur. If taken more than 220 °C, the material burns or vaporizes. At 180 °C, the glassy transition temperature of PLA and surface roughness are lower because of optimum viscosity. The deformation is less due to optimum viscosity when one layer is laid on the other. As temperature increases, the viscosity decreases; hence, the layer lay-up orientation distorts.
Figure 6 presents the interaction plots for surface roughness. The analysis suggests no noticeable interaction between layer height and printing temperature. While there is a modest interaction between printing temperature and printing speed concerning surface roughness, a notable interaction is observed between layer height and printing speed affecting surface roughness.
In Figure 7, the 3D surface plots for surface roughness are illustrated. The plot highlights a non-linear relationship between printing speed and printing temperature, with maximum surface roughness observed at a printing temperature of 220 °C and a printing speed of 30 mm/s. The layer height and printing temperature have a linear relationship with surface roughness. The layer height and printing speed have a non-linear relationship towards surface roughness.
Figure 8a presents the contour plots of layer height and printing temperature. Surface roughness is less at 0.16–0.17 mm layer height and 180–200 °C printing temperature. Figure 8b indicates the contour plot for layer height and printing speed. Surface roughness is less when the speed is 60–90 mm/s, and the layer height ranges from 0.16 to 0.17 mm. Figure 8c shows the contour plot of printing speed and printing temperature. Surface roughness is less when the printing speed is 30–90 mm/s, and the printing temperature is 180 °C to 210 °C. The temperature increases with speed. Considering all these points, the optimum setting for minimum surface roughness is layer height at 0.16 mm, printing temperature at 180 °C, and printing speed at 60 mm/s, i.e., A1, B1, C2.

3.2. Wear Loss

The regression model for wear loss is shown in Equation (2).
wear loss = 0.01740 − 0.0480 A − 0.000010 B − 0.000034 C − 0.0104 A × A −
0.000000 B × B− 0.000000 C × C + 0.000063 A × B + 0.000104 A × C + 0.000000 B × C
The R-squared value for the above model is 99%. Equation (2) is a quadratic equation and includes all the terms, including significant at 95% confidence and insignificant terms.
The Analysis of Variance for the wear loss model is presented in Table 7. The table shows that individual factors are all significant at a 95% confidence level and contribute 93.75% towards wear loss individually. The interaction among the factors appears as the least contributing element towards wear loss. The error includes other factors that are not considered and cannot be controlled in experimentation. They also contribute less, i.e., 6.25%, towards wear loss.
The main effect plots for wear loss are shown in Figure 9. Factor A (layer height) has maximum influence on wear loss. The work carried out by Zhiani Hervan et al. [33] also shows that layer height is an essential factor for wear. As layer height increases, wear loss decreases because the strength of the material also increases and subsequently provides resistance to wear. The figure shows that wear loss is minimal when the layer height is 0.24 mm. The printing temperature and printing speed contribute almost the same towards wear loss. As printing temperature increases, the wear loss decreases because as temperature increases, the bond between subsequent layers improves due to heat present in that vicinity. Similarly, as printing speed increases with increased temperature, more and more materials come in contact with each other (due to layer build-up) at this elevated temperature and bond stronger, thus building the products with strong binding between the layers. This strong binding leads to minimum wear loss.
Figure 10 displays the interaction plots for wear loss. It is evident from the figure that the interaction effects between the factors are minimal, and there is a possibility of interaction effects occurring beyond the range of the factors.
Figure 11 illustrates the surface plots for wear loss. Analysis of these plots reveals the relationship between layer height and printing temperature; layer height and printing speed are linear toward wear loss. However, a non-linear relation between printing temperature and printing speed towards wear loss can be observed.
The contour plots for wear loss are shown in Figure 12. The wear loss is less, i.e., less than 0.0045, when layer height is 0.24 mm, the printing temperature ranges from 180 °C to 220 °C, and the printing speed from 60 to 90 mm/s. Considering all these points, the optimum setting to obtain minimum wear loss is layer height at 0.24 mm, printing temperature at 220 °C, and printing speed at 90 mm/s, i.e., A3, B3, C3.

3.3. Multiobjective Optimization

Mathematical objective functions are formulated to express surface roughness and wear loss as non-linear functions of input variables. With multiple objective functions, finding the optimal conditions for desired surface roughness and wear loss can be challenging. To address this, a case study is conducted using weight fractions of 0.5, 0.75, and 0.25 assigned to each objective function, and the composite desirability value is determined using Minitab 17 Software. The desirability function approach (DFA) is employed to identify the optimal conditions for low surface roughness and wear loss within the constraints of the developed non-linear objective functions for the FDM process. The condition with the highest composite desirability value, which indicates the optimal process setting, is presented in Table 8.
The DFA identifies the optimal input parameter conditions that achieve the highest desirability values for the desired properties. This study recommends scenario 2, which assigns a weight fraction of 0.75 to surface roughness and 0.25 to wear loss, resulting in lower surface roughness and improved tribological properties. This scenario’s composite desirability value surpasses the other case studies analyzed.
Confirmation experiments are performed to validate the optimized conditions for surface roughness, wear loss, and the combination of both. The resulting values from these experiments are presented in Table 9. The theoretical values of surface roughness and wear loss under DFA fall within the range of theoretical values obtained separately for surface roughness and wear loss by optimum input factors.

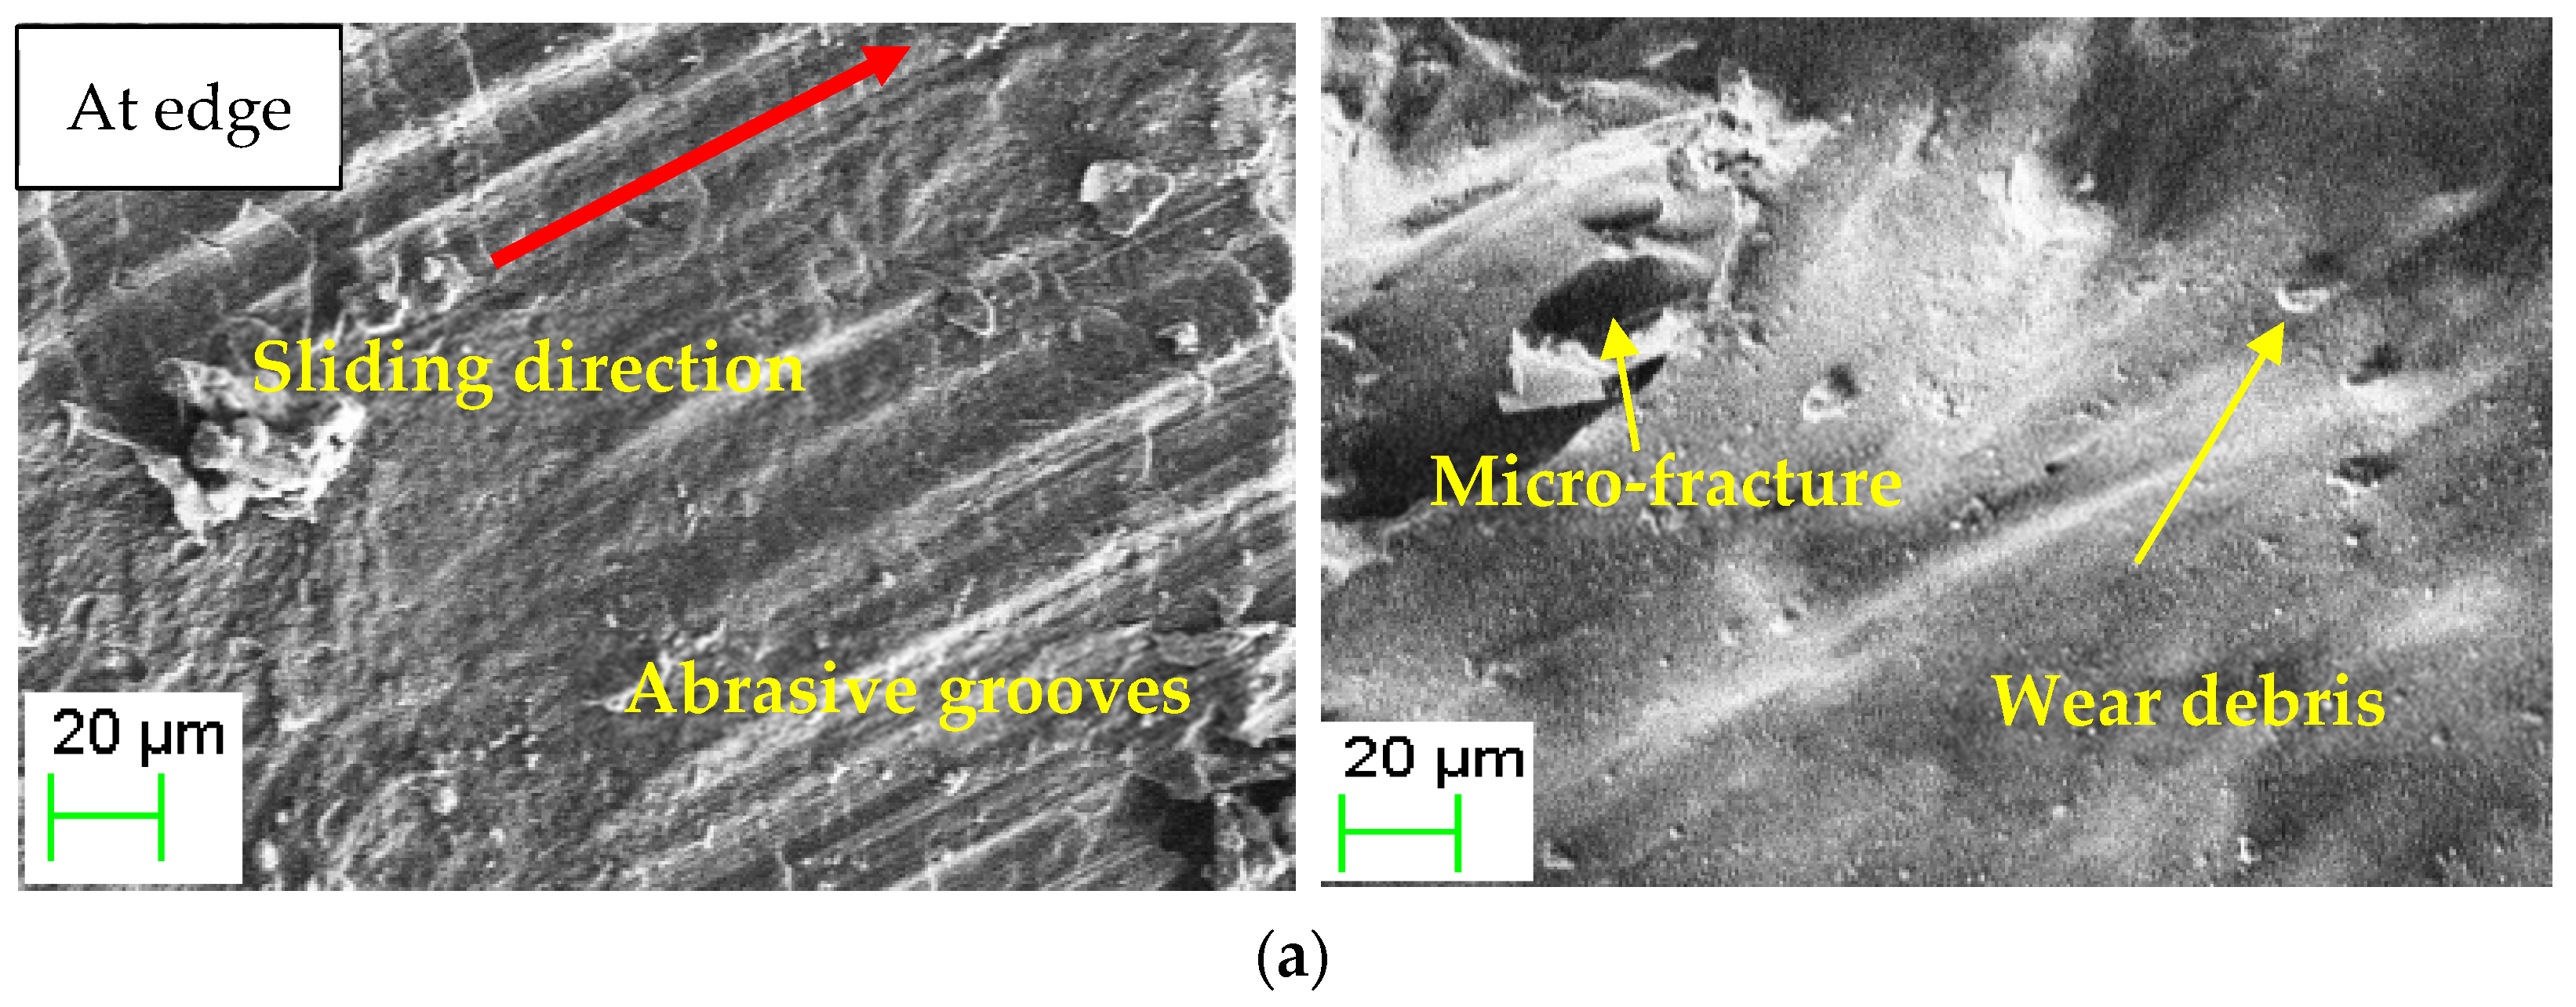
3.4. Worn Surface Analysis

The SEM images in Figure 13 provide a detailed analysis of the worn surfaces of PLA–graphene 3D-printed composites tested under different levels of process parameters. These images reveal various wear mechanisms, viz., abrasive grooves, micro-fractures, and the presence of wear debris. The specimens are considered for SEM analysis based on the levels presented in Table 9. Figure 13a exhibits the worn surface of the specimen produced at A3, B3, and C3, which is the minimum wear loss. The SEM images display fewer grooves and a more even surface. Figure 13b exhibits the worn surface of the specimen produced at A1, B1, and C2, which is the maximum wear loss. The SEM images display greater wear and greater areas of material removal and deformation along the sliding direction. Figure 13c exhibits the worn surface of the specimen produced at A—0.16 mm, B—208 °C, and C—90 mm/s, which is the moderate wear loss. Wear debris is visible along the surface, and abrasive grooves are still discernible, though they are shallower than the Figure 13b sample.

4. Conclusions

  • Layer height exerts the most significant influence on surface roughness, followed by printing speed. The printing temperature is the least significant. A notable interaction is observed between layer height and printing speed, which affects surface roughness.
  • The optimum setting for minimum surface roughness is layer height at 0.16 mm, printing temperature at 180 °C, and printing speed at 60 mm/s, i.e., A1, B1, and C2.
  • Layer height has the maximum influence on wear loss. The printing temperature and printing speed contribute almost the same towards wear loss. The interaction effects between the factors are minimal.
  • The optimum setting for minimum wear loss is layer height at 0.24 mm, printing temperature at 220 °C, and printing speed at 90 mm/s, i.e., A3, B3, and C3.
  • For the desirability function approach, scenario 2 assigns a weight fraction of 0.75 to surface roughness and 0.25 to wear loss, resulting in lower surface roughness and improved tribological properties. The layer height of 0.16 mm, printing temperature of 208 °C, and printing speed of 90 mm/s are the optimum levels for a lower surface finish and wear loss.
  • Five confirmation experiments are conducted for the optimized levels for surface roughness, wear loss, and both (multiple objective optimizations).
  • The SEM images reveal various wear mechanisms, viz., abrasive grooves, micro-fractures, and the presence of wear debris.
  • The work carried out helps make automobile door panels since they undergo wear due to excessive friction, aging and material degradation, and temperature fluctuations. These are taken care of by graphene addition in PLA with an optimized printing process, and a good surface finish helps in proper assembly.
  • The work can be extended by considering the different weight percentages of graphene, characterizing the specimens, and using soft computing techniques.

Author Contributions

Conceptualization, M.G.A. and V.R.C.; methodology, N.R. and S.P.A.; validation, M.G.A., V.R.C., N.R. and S.P.A.; formal analysis, M.G.A., V.R.C., N.R. and S.P.A.; investigation, M.G.A., V.R.C., N.R. and M.S.; writing—original draft preparation, G.R.C. and M.S.; writing—review and editing, G.R.C. and M.S.; supervision, S.P.A. and G.R.C.; project administration, S.P.A. and G.R.C. All authors have read and agreed to the published version of the manuscript.

Funding

This research received no external funding.

Data Availability Statement

The original contributions presented in this study are included in the article.

Conflicts of Interest

The authors declare no conflicts of interest.

References

  1. Bănică, C.-F.; Sover, A.; Anghel, D.-C. Printing the Future Layer by Layer: A Comprehensive Exploration of Additive Manufacturing in the Era of Industry 4.0. Appl. Sci. 2024, 14, 9919. [Google Scholar] [CrossRef]
  2. Park, S.; Shou, W.; Makatura, L.; Matusik, W.; Fu, K. 3D printing of polymer composites: Materials, processes, and applications. Matter 2022, 5, 43–76. [Google Scholar] [CrossRef]
  3. Wong, K.V.; Hernandez, A. A Review of Additive Manufacturing. ISRN Mech. Eng. 2012, 2012, 20860. [Google Scholar] [CrossRef]
  4. Jeong, M.; Radomski, K.; Lopez, D.; Liu, J.T.; Lee, J.D.; Lee, S.J. Materials and Applications of 3D Printing Technology in Dentistry: An Overview. Dent. J. 2023, 12, 1. [Google Scholar] [CrossRef] [PubMed]
  5. Tabassum, T.; Mir, A.A. A review of 3d printing technology-the future of sustainable construction. Mater. Today Proc. 2023, 93, 408–414. [Google Scholar] [CrossRef]
  6. Kristiawan, R.B.; Imaduddin, F.; Ariawan, D.; Ubaidillah; Arifin, Z. A review on the fused deposition modeling (FDM) 3D printing: Filament processing, materials, and printing parameters. Open Eng. 2021, 11, 639–649. [Google Scholar] [CrossRef]
  7. Ahmad, M.; Javaid, M.; Haleem, A. A study on fused deposition modeling (FDM) and laser-based additive manufacturing (LBAM) in the medical field. Intell. Pharm. 2024, 2, 381–391. [Google Scholar] [CrossRef]
  8. Sandanamsamy, L.; Harun, W.S.W.; Ishak, I.; Romlay, F.R.M.; Kadirgama, K.; Ramasamy, D.; Idris, S.R.A.; Tsumori, F. A comprehensive review on fused deposition modelling of polylactic acid. Prog. Addit. Manuf. 2023, 8, 775–799. [Google Scholar] [CrossRef]
  9. Nagarajan, V.; Mohanty, A.K.; Misra, M. Perspective on Polylactic Acid (PLA) based Sustainable Materials for Durable Applications: Focus on Toughness and Heat Resistance. ACS Sustain. Chem. Eng. 2016, 4, 2899–2916. [Google Scholar] [CrossRef]
  10. Somdee, P.; Shettar, M.; Prasoetsopha, N.; Ansari, M.A. Reinforcing poly(lactic acid)/poly(butylene succinate) biodegradable blends with silicon carbide (SiC): A silane-coupled approach for enhanced mechanical and thermal performance. Polym. Compos. 2024, 45, 12624–12635. [Google Scholar] [CrossRef]
  11. Ranakoti, L.; Gangil, B.; Mishra, S.K.; Singh, T.; Sharma, S.; Ilyas, R.; El-Khatib, S. Critical Review on Polylactic Acid: Properties, Structure, Processing, Biocomposites, and Nanocomposites. Materials 2022, 15, 4312. [Google Scholar] [CrossRef] [PubMed]
  12. Younus, M.M.; Naguib, H.M.; Fekry, M.; Elsawy, M.A. Pushing the limits of PLA by exploring the power of MWCNTs in enhancing thermal, mechanical properties, and weathering resistance. Sci. Rep. 2023, 13, 16588. [Google Scholar] [CrossRef] [PubMed]
  13. Urade, A.R.; Lahiri, I.; Suresh, K.S. Graphene Properties, Synthesis and Applications: A Review. JOM 2023, 75, 614–630. [Google Scholar] [CrossRef]
  14. Novoselov, K.S.; Fal’Ko, V.I.; Colombo, L.; Gellert, P.R.; Schwab, M.G.; Kim, K. A roadmap for graphene. Nature 2012, 490, 192–200. [Google Scholar] [CrossRef]
  15. Srimaneepong, V.; Skallevold, H.E.; Khurshid, Z.; Zafar, M.S.; Rokaya, D.; Sapkota, J. Graphene for Antimicrobial and Coating Application. Int. J. Mol. Sci. 2022, 23, 499. [Google Scholar] [CrossRef] [PubMed]
  16. Xie, H.; Cao, T.; Rodríguez-Lozano, F.J.; Luong-Van, E.K.; Rosa, V. Graphene for the development of the next-generation of biocomposites for dental and medical applications. Dent. Mater. 2017, 33, 765–774. [Google Scholar] [CrossRef]
  17. Mohan, V.B.; Lau, K.-T.; Hui, D.; Bhattacharyya, D. Graphene-based materials and their composites: A review on production, applications and product limitations. Compos. Part B Eng. 2018, 142, 200–220. [Google Scholar] [CrossRef]
  18. Nikzad, M.; Masood, S.; Sbarski, I. Thermo-mechanical properties of a highly filled polymeric composites for Fused Deposition Modeling. Mater. Des. 2011, 32, 3448–3456. [Google Scholar] [CrossRef]
  19. Shemelya, C.M.; Rivera, A.; Perez, A.T.; Rocha, C.; Liang, M.; Yu, X.; Kief, C.; Alexander, D.; Stegeman, J.; Xin, H.; et al. Mechanical, Electromagnetic, and X-ray Shielding Characterization of a 3D Printable Tungsten–Polycarbonate Polymer Matrix Composite for Space-Based Applications. J. Electron. Mater. 2015, 44, 2598–2607. [Google Scholar] [CrossRef]
  20. Santo, J.; Pradhik, V.; Kalakoti, S.; Saravanan, P.; Penumakala, P.K. Effect of composite processing technique on tribological properties of 3D printed PLA-graphene composites. Tribol. Int. 2024, 198, 109895. [Google Scholar] [CrossRef]
  21. Yan, T.; Ye, X.; He, E.; Gao, Q.; Wang, Y.; Ye, Y.; Wu, H. GR-Fe3O4/PLA 3D printing composite materials with excellent microwave absorption properties. J. Alloys Compd. 2024, 972, 172799. [Google Scholar] [CrossRef]
  22. Hemanth, K.; Swamy, R.; Chandrashekar, T. Taguchi Technique for the Simultaneous Optimization of Tribological Parameters in Metal Matrix Composite. J. Miner. Mater. Charact. Eng. 2011, 10, 179–188. [Google Scholar] [CrossRef]
  23. Deswal, S.; Narang, R.; Chhabra, D. Modeling and parametric optimization of FDM 3D printing process using hybrid techniques for enhancing dimensional preciseness. Int. J. Interact. Des. Manuf. 2019, 13, 1197–1214. [Google Scholar] [CrossRef]
  24. Heidari-Rarani, M.; Ezati, N.; Sadeghi, P.; Badrossamay, M.R. Optimization of FDM process parameters for tensile properties of polylactic acid specimens using Taguchi design of experiment method. J. Thermoplast. Compos. Mater. 2022, 35, 2435–2452. [Google Scholar] [CrossRef]
  25. Venkatraman, R.; Raghuraman, S. Experimental analysis on density, micro-hardness, surface roughness and processing time of Acrylonitrile Butadiene Styrene (ABS) through Fused Deposition Modeling (FDM) using Box Behnken Design (BBD). Mater. Today Commun. 2021, 27, 102353. [Google Scholar] [CrossRef]
  26. Nagendra, J.; Prasad, M.S.G. FDM Process Parameter Optimization by Taguchi Technique for Augmenting the Mechanical Properties of Nylon–Aramid Composite Used as Filament Material. J. Inst. Eng. Ser. C 2020, 101, 313–322. [Google Scholar] [CrossRef]
  27. Liesenfeld, J.; Jablonski, J.J.; da Silva, J.R.F.; Buenos, A.A.; Scheuer, C.J. Impact of annealing on the characteristics of 3D-printed graphene-reinforced PLA composite. J. Manuf. Process. 2024, 128, 133–157. [Google Scholar] [CrossRef]
  28. Giammaria, V.; Capretti, M.; Del Bianco, G.; Boria, S.; Santulli, C. Application of Poly(lactic Acid) Composites in the Automotive Sector: A Critical Review. Polymers 2024, 16, 3059. [Google Scholar] [CrossRef]
  29. Bashir, M.N.; Logesh, K.; Kannan, S.; Vijayan, D.; Kumar, S.S.; Al Obaid, S.; Lee, J.S. Studies on parametric optimization of PLA/graphene composites synthesized by fused filament fabrication for thermal applications. Therm. Sci. Eng. Prog. 2024, 54, 102788. [Google Scholar] [CrossRef]
  30. Liesenfeld, J.; Jablonski, J.J.; da Silva, J.R.F.; Buenos, A.A.; Scheuer, C.J. Exploring the influence of graphene incorporation on the characteristics of 3D-printed PLA. Int. J. Adv. Manuf. Technol. 2024, 130, 5813–5835. [Google Scholar] [CrossRef]
  31. ASTM-G-99; Test Method for Wear Testing with a Pin-on-Disk Apparatus. ASTM International: West Conshohocken, PA, USA, 2017. [CrossRef]
  32. Shettar, M.; Doshi, M.; Rawat, A.K. Study on mechanical properties and water uptake of polyester-nanoclay nanocomposite and analysis of wear property using RSM. J. Mater. Res. Technol. 2021, 14, 1618–1629. [Google Scholar] [CrossRef]
  33. Hervan, S.Z.; Altınkaynak, A.; Parlar, Z. Hardness, friction and wear characteristics of 3D-printed PLA polymer. Proc. Inst. Mech. Eng. Part J J. Eng. Tribol. 2021, 235, 1590–1598. [Google Scholar] [CrossRef]
Figure 1. Flow chart of methodology.
Jcs 09 00001 g001
Figure 2. Three-Dimensional Printing Process.
Jcs 09 00001 g002
Figure 3. (a) Wear and Surface Roughness Testing Specimen; (b) Prepared Specimens.
Jcs 09 00001 g003
Figure 4. Mitutoyo Model SJ-410 Portable Surface Roughness Tester.
Jcs 09 00001 g004
Figure 5. Main effect plots for surface roughness.
Jcs 09 00001 g005
Figure 6. Interaction Plots for Surface roughness.
Jcs 09 00001 g006
Figure 7. Three-dimensional surface plots for (a) layer height, printing temperature v/s surface roughness; (b) layer height, printing speed v/s surface roughness; (c) printing speed, printing temperature v/s surface roughness.
Jcs 09 00001 g007
Figure 8. Contour plots for surface roughness: (a) layer height and printing temperature; (b) layer height and printing speed; (c) printing temperature and printing speed.
Jcs 09 00001 g008
Figure 9. Main effect plots for wear loss.
Jcs 09 00001 g009
Figure 10. Interaction plots for wear loss.
Jcs 09 00001 g010
Figure 11. Three-dimensional surface plots for (a) layer height, printing temperature v/s surface roughness, (b) layer height, printing speed v/s surface roughness, (c) printing speed, printing temperature v/s surface roughness.
Jcs 09 00001 g011
Figure 12. Contour plots for wear loss (a) layer height and printing temperature (b) layer height and printing speed (c) printing temperature and printing speed.
Jcs 09 00001 g012
Figure 13. SEM images of worn surfaces. (a) Worn surface of specimen produced at A3, B3, and C3; (b) Worn surface of specimen produced at A1, B1, and C2; (c) Worn surface of specimen produced at A—0.16 mm, B—208 °C, C—90 mm/s.
Jcs 09 00001 g013aJcs 09 00001 g013b
Table 1. The technical features of Voolt3D’s PLA filaments.
PropertyUnitPLA with Graphene
Yield stressMPa29
Ultimate tensile strengthMPa31.06
Tensile strain%2.3
Elastic moduleMPa2180.02
Densityg/cm21.5
Table 2. Lists the technical details of the 3D printer.
Printing Capacity
X-axis travel
220 mm
Y-axis travel
220 mm
Z-axis travel
300 mm
Extruder nozzle diameter0.4 mm
File transferUSB drive, LAN, Creality cloud APP
Layer resolution0.4 mm
Maximum printing Speed150 mm/s
Maximum extruder temperature300 °C
Maximum deposition bed temperature100 °C
Table 3. Constant parameters for producing the test cases.
Three-Dimensional Printing Parameter for PLA Graphene
Bed temperature60 °C
Raster width0.48 mm
Raster angle45°
Table 4. Process parameters and corresponding levels.
FactorsLevel 1Level 2Level 3
Layer Height (A)0.160.20.24
Printing Temperature (B)180200220
Printing Speed (C)306090
Table 5. Experimental Matrix and Average Responses.
Layer Height
(A)
Printing Temperature
(B)
Printing Speed
(C)
Surface Roughness Wear Loss
(mm)(°C)(mm/s)(Ra)(gm)
0.242009015.7690.0042
0.21809012.4770.0056
0.162009010.2670.0065
0.16180609.3470.0074
0.241806015.120.0045
0.22203014.8030.0057
0.162003011.1860.0074
0.22006012.6040.0057
0.22209013.9780.0052
0.21803012.5620.0062
0.22006012.9920.0057
0.242206015.5670.0041
0.242003014.9360.0046
0.22006012.010.0058
0.16220609.8690.0068
Table 6. ANOVA for surface roughness.
SourceDFAdj SSAdj MSF-Valuep-ValuePercentage Contribution
Model959.9136.65715.480.004
Linear356.578518.859543.840.00191.16
Square32.42880.80961.880.253.92
2-Way Interaction30.90570.30190.70.591.46
Error52.15080.4302 3.46
Total1462.0638 100
Table 7. ANOVA table for wear loss.
SourceDoFAdj SSAdj MSF-Valuep-ValuePercentage Contribution
Model90.0000160.000002195.790
Linear30.0000150.000005584.25093.75
Square3000.290.8320
2-Way Interaction3002.830.1460
Error100.0000010.0000001 6.25
Total140.000016 100
Table 8. Desirability values at different weights (3 different scenarios) and corresponding factor and response values.
FactorsScenario 1 SRw1 = 0.5, WLw2 = 0.5Scenario 2
SRw1 = 0.75, WLw2 = 0.25
Scenario 3
SRw1 = 0.25, WLw2 = 0.75
Layer Height0.1720.160.24
Printing Temperature220208180
Printing Speed909055.4545
Surface roughness11.521410.0914.4
Wear loss0.0060.00650.0046
Composite Desirability value0.730.8140.7745
Table 9. Confirmation test results for optimization of each response and multiobjective optimization.
12345Theoretical Value
Surface roughness (SR)
Corresponding value of wear loss (A1, B1, C2)
9.5 10.25 9.25 10.5 10.15 9.2775 µm
0.00820.00810.00770.00790.00790.0074 gm
Wear loss (WL)
Corresponding value of wear loss
(A3, B3, C3)
17.251 17.159 16.985 16.352 16.975 16.5 µm
0.00450.00410.00380.00390.00410.0041 gm
DFA (SR
and WL)
(A—0.16 mm, B—208 °C, C—90 mm/s)
10.152 10.981 10.01 10.974 10.581 10.09 µm
0.00760.00690.00610.00670.00670.006 gm
Disclaimer/Publisher’s Note: The statements, opinions and data contained in all publications are solely those of the individual author(s) and contributor(s) and not of MDPI and/or the editor(s). MDPI and/or the editor(s) disclaim responsibility for any injury to people or property resulting from any ideas, methods, instructions or products referred to in the content.

