
Geometry and Hybridization Effect on the Crashworthiness Performances of Carbon and Flax/Epoxy Composites

 , , ,
, , ,  , ,
, ,
Abstract
1. Introduction
2. Experimental Tests
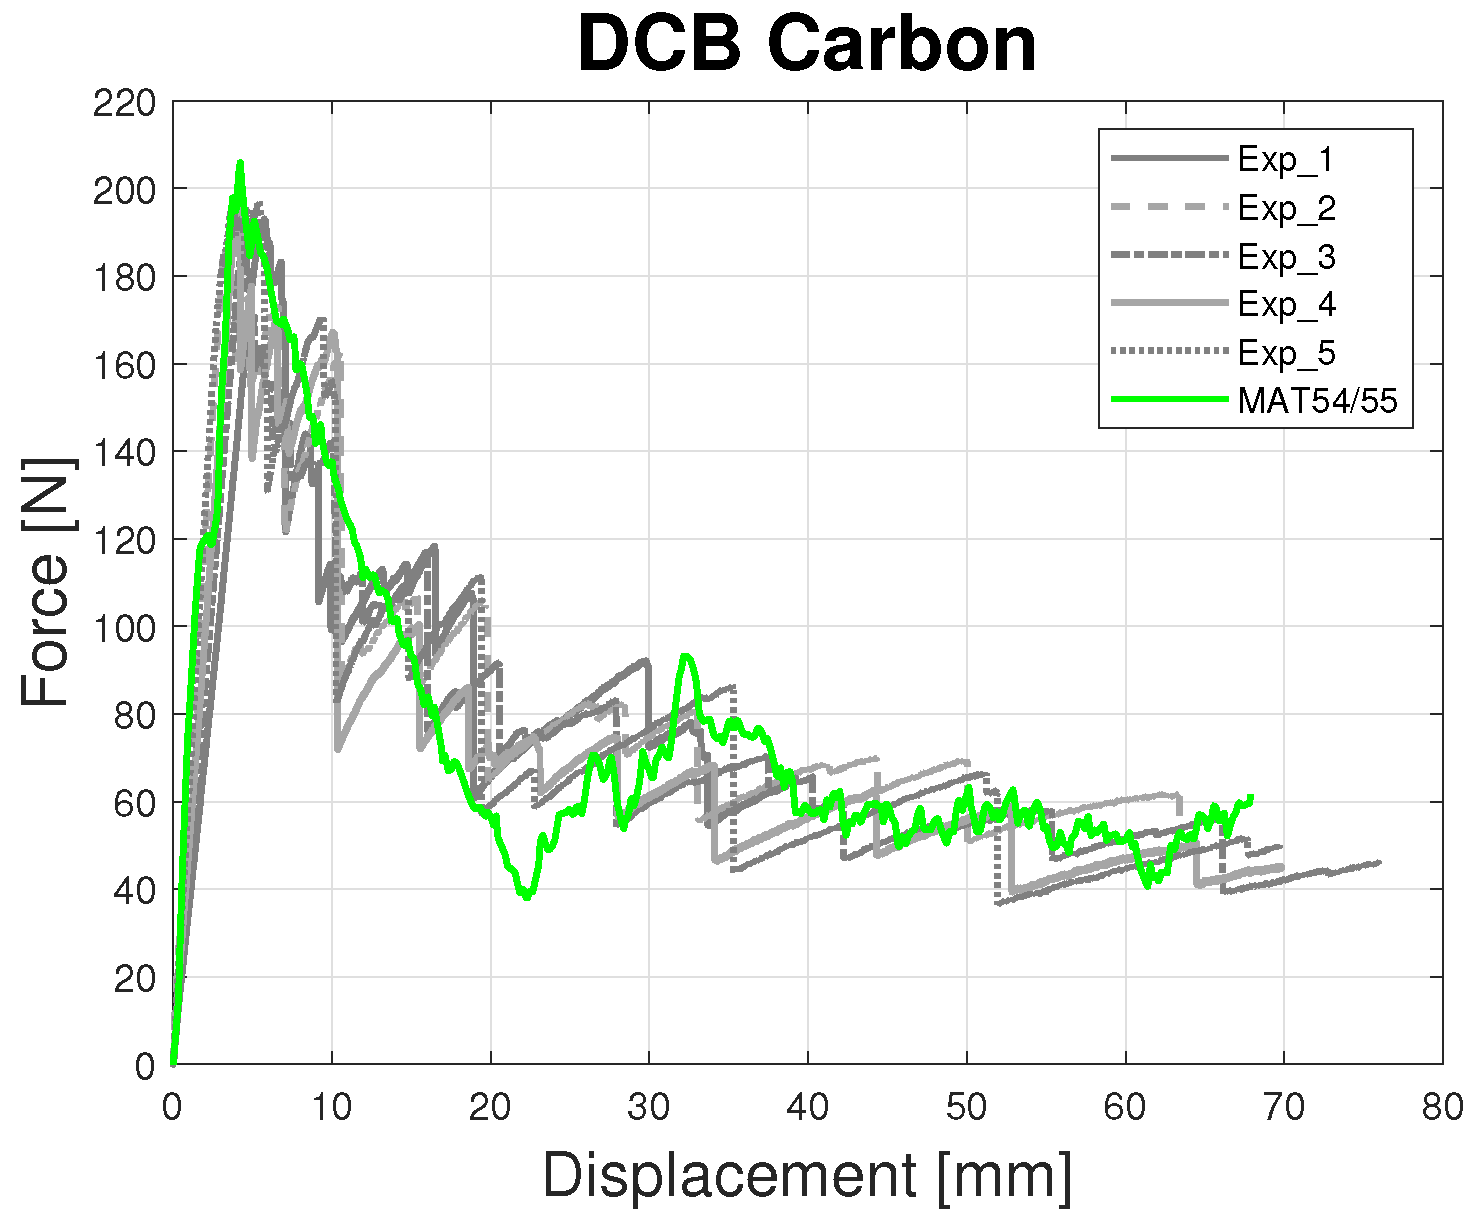
2.1. Double Cantilever Beam (DCB)
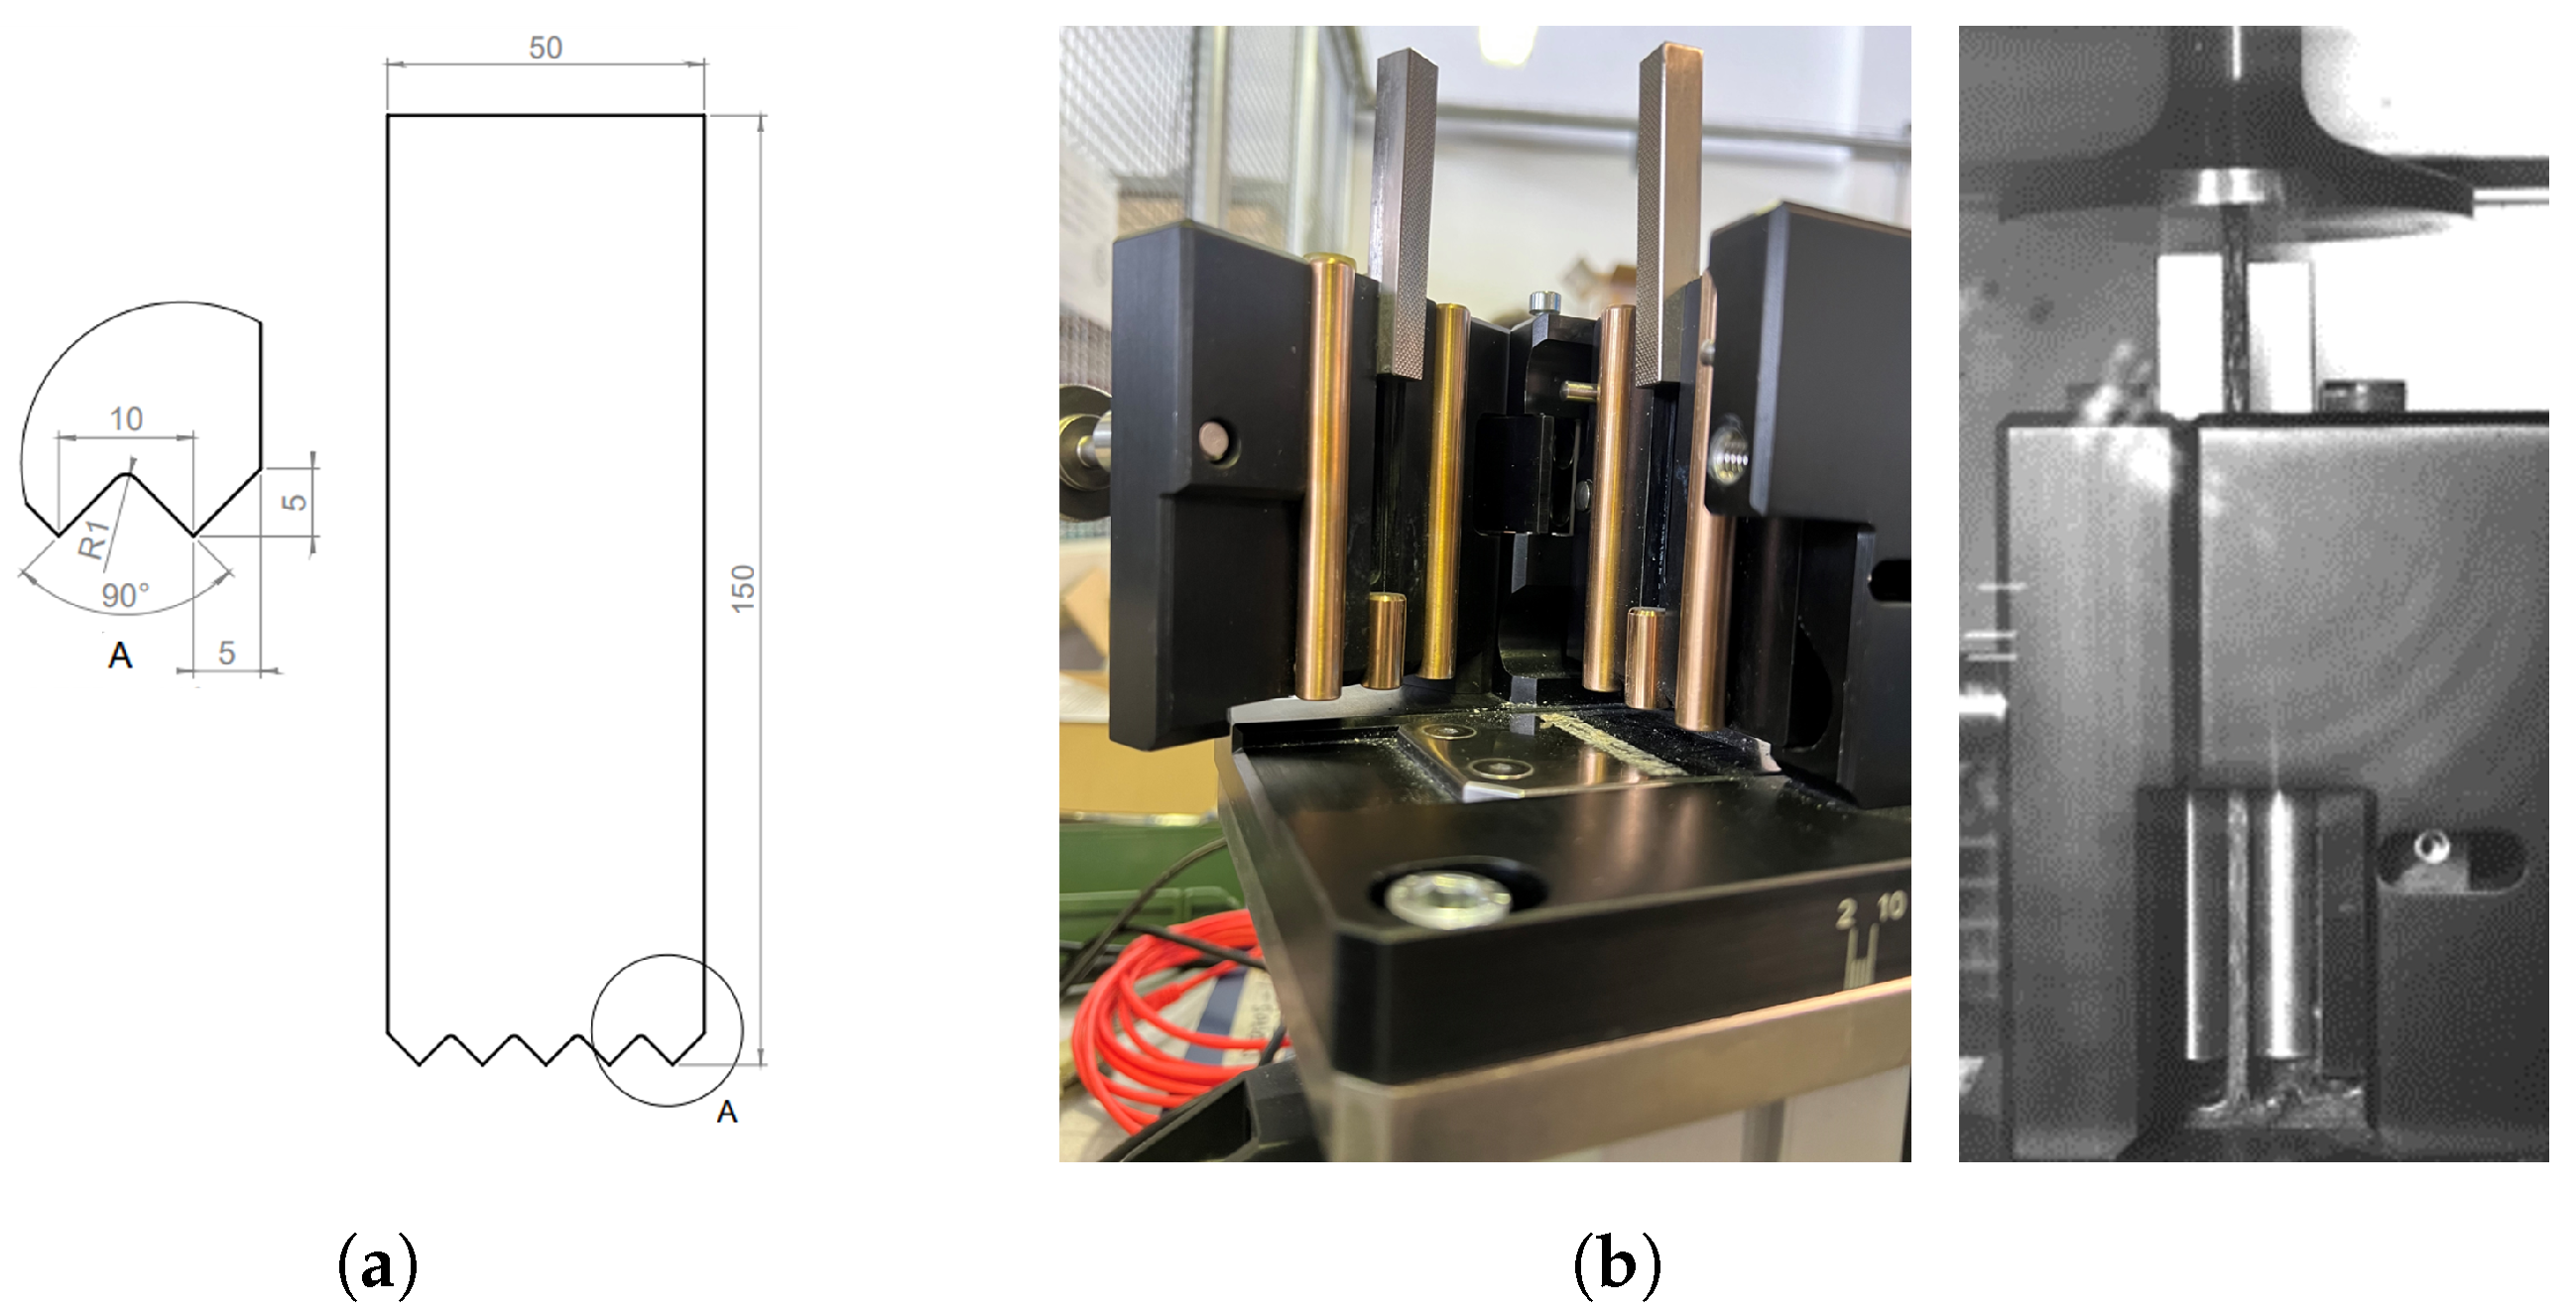
2.2. Four-Point End Notched Flexure (4ENF)
2.3. In-Plane Crashworthiness
3. Numerical Modelling
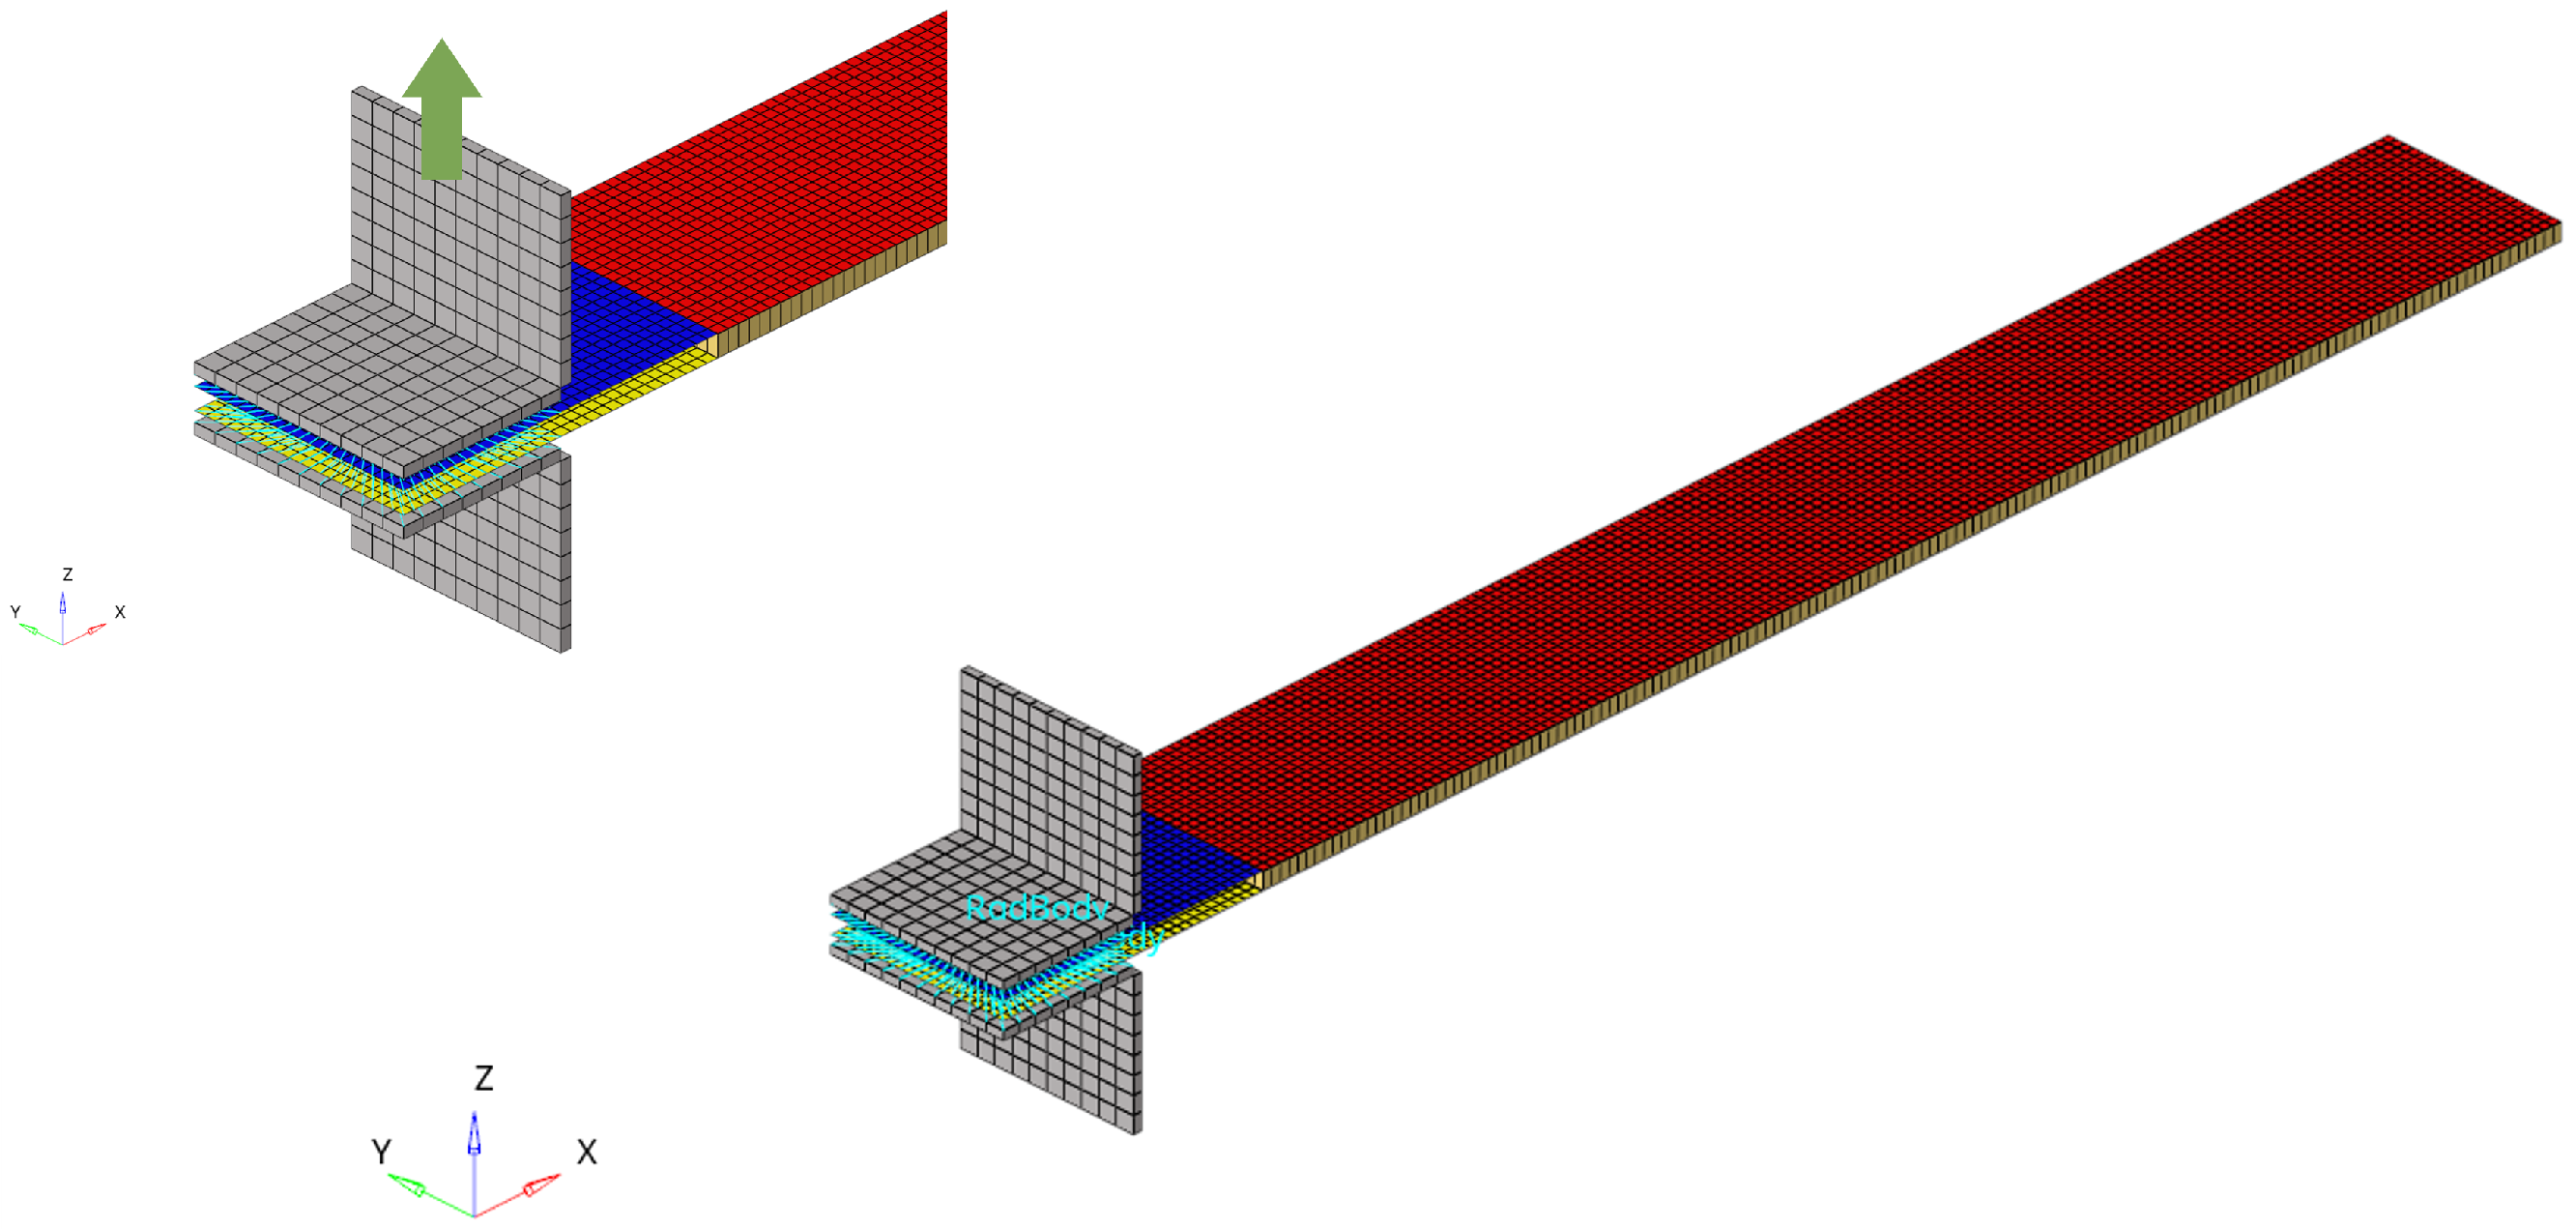
- Double Cantilever Beam (DCB)
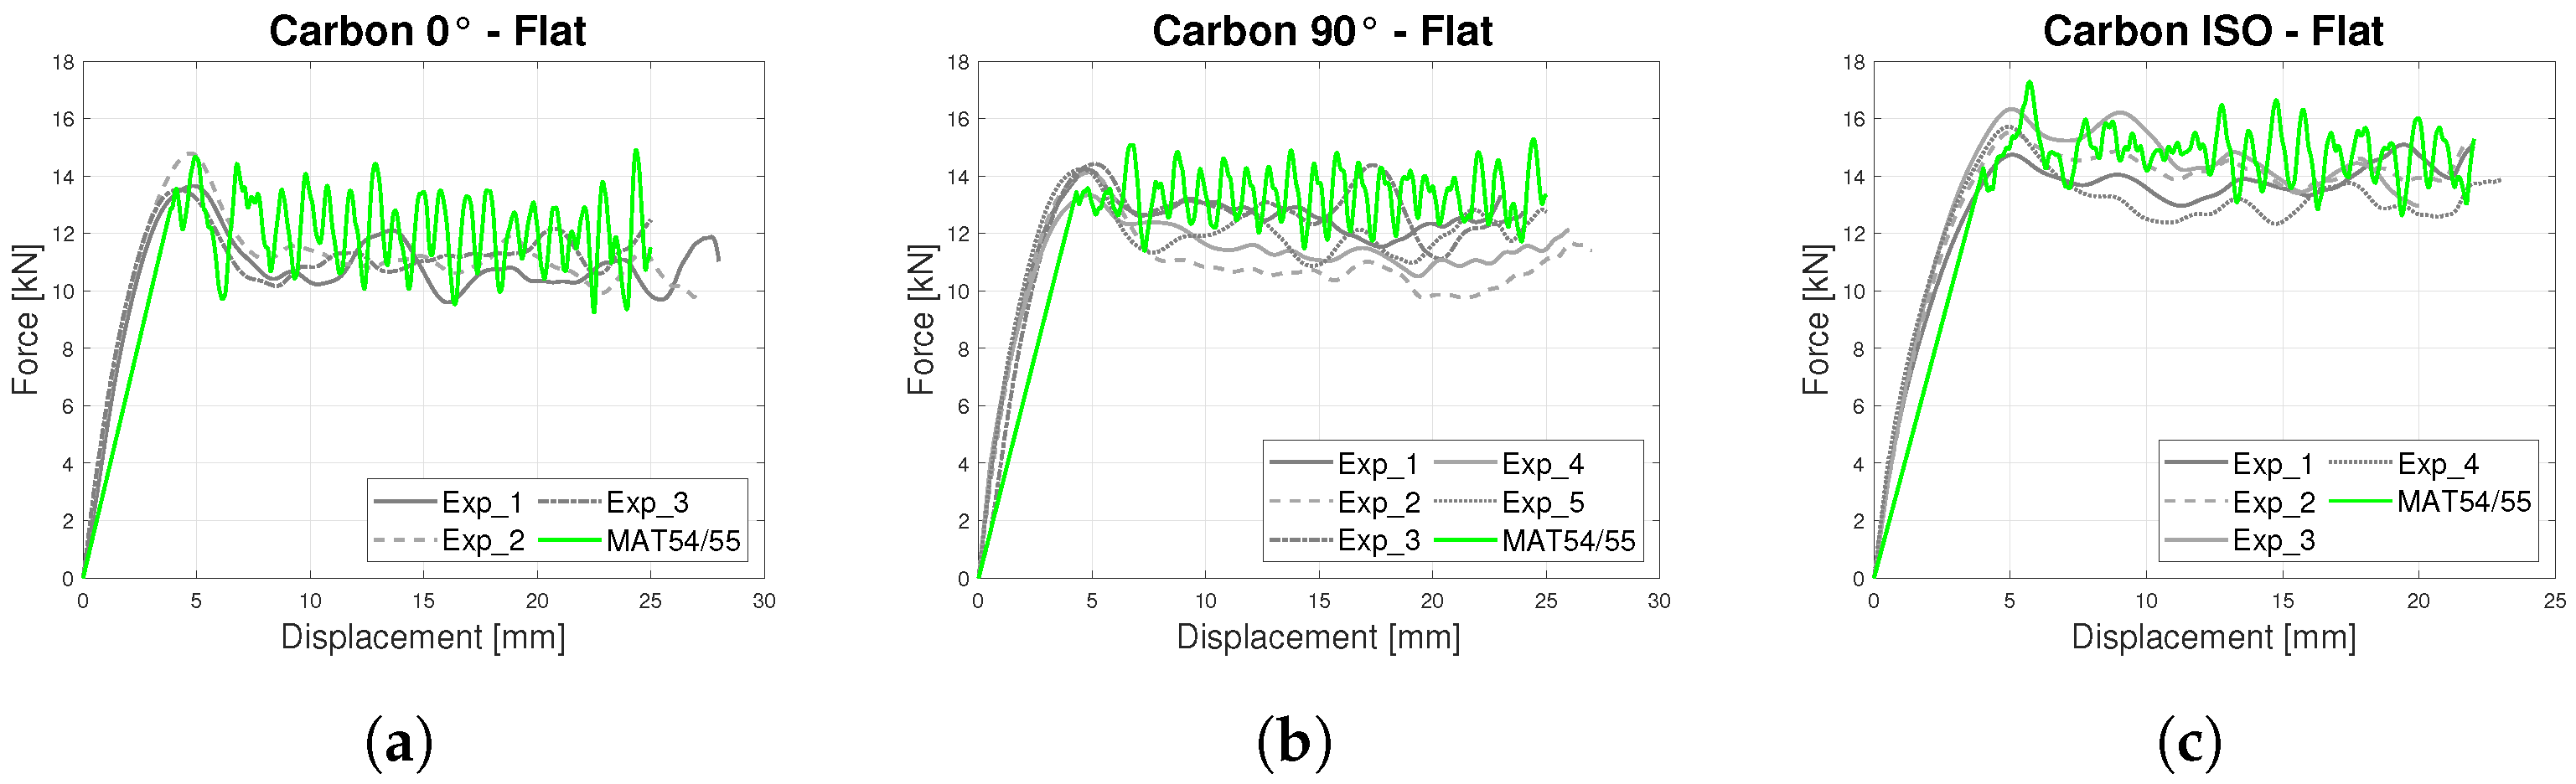
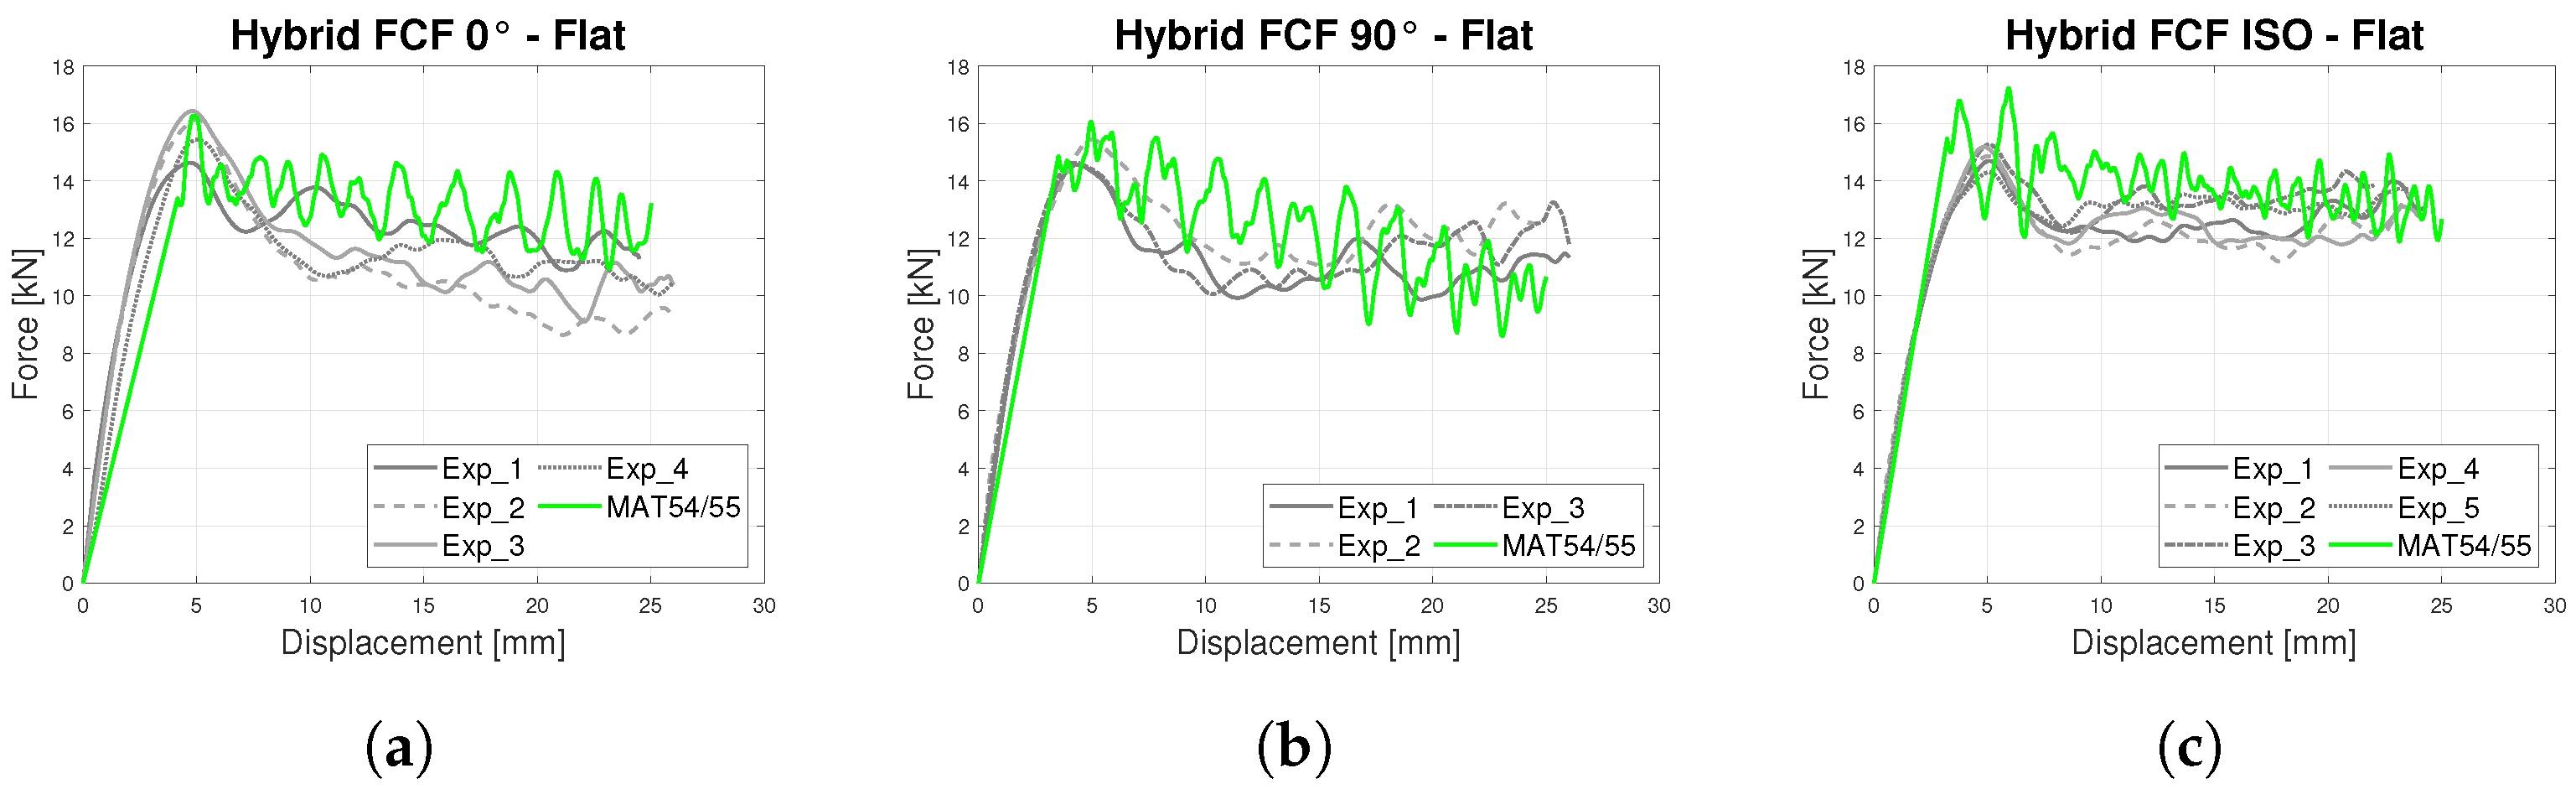
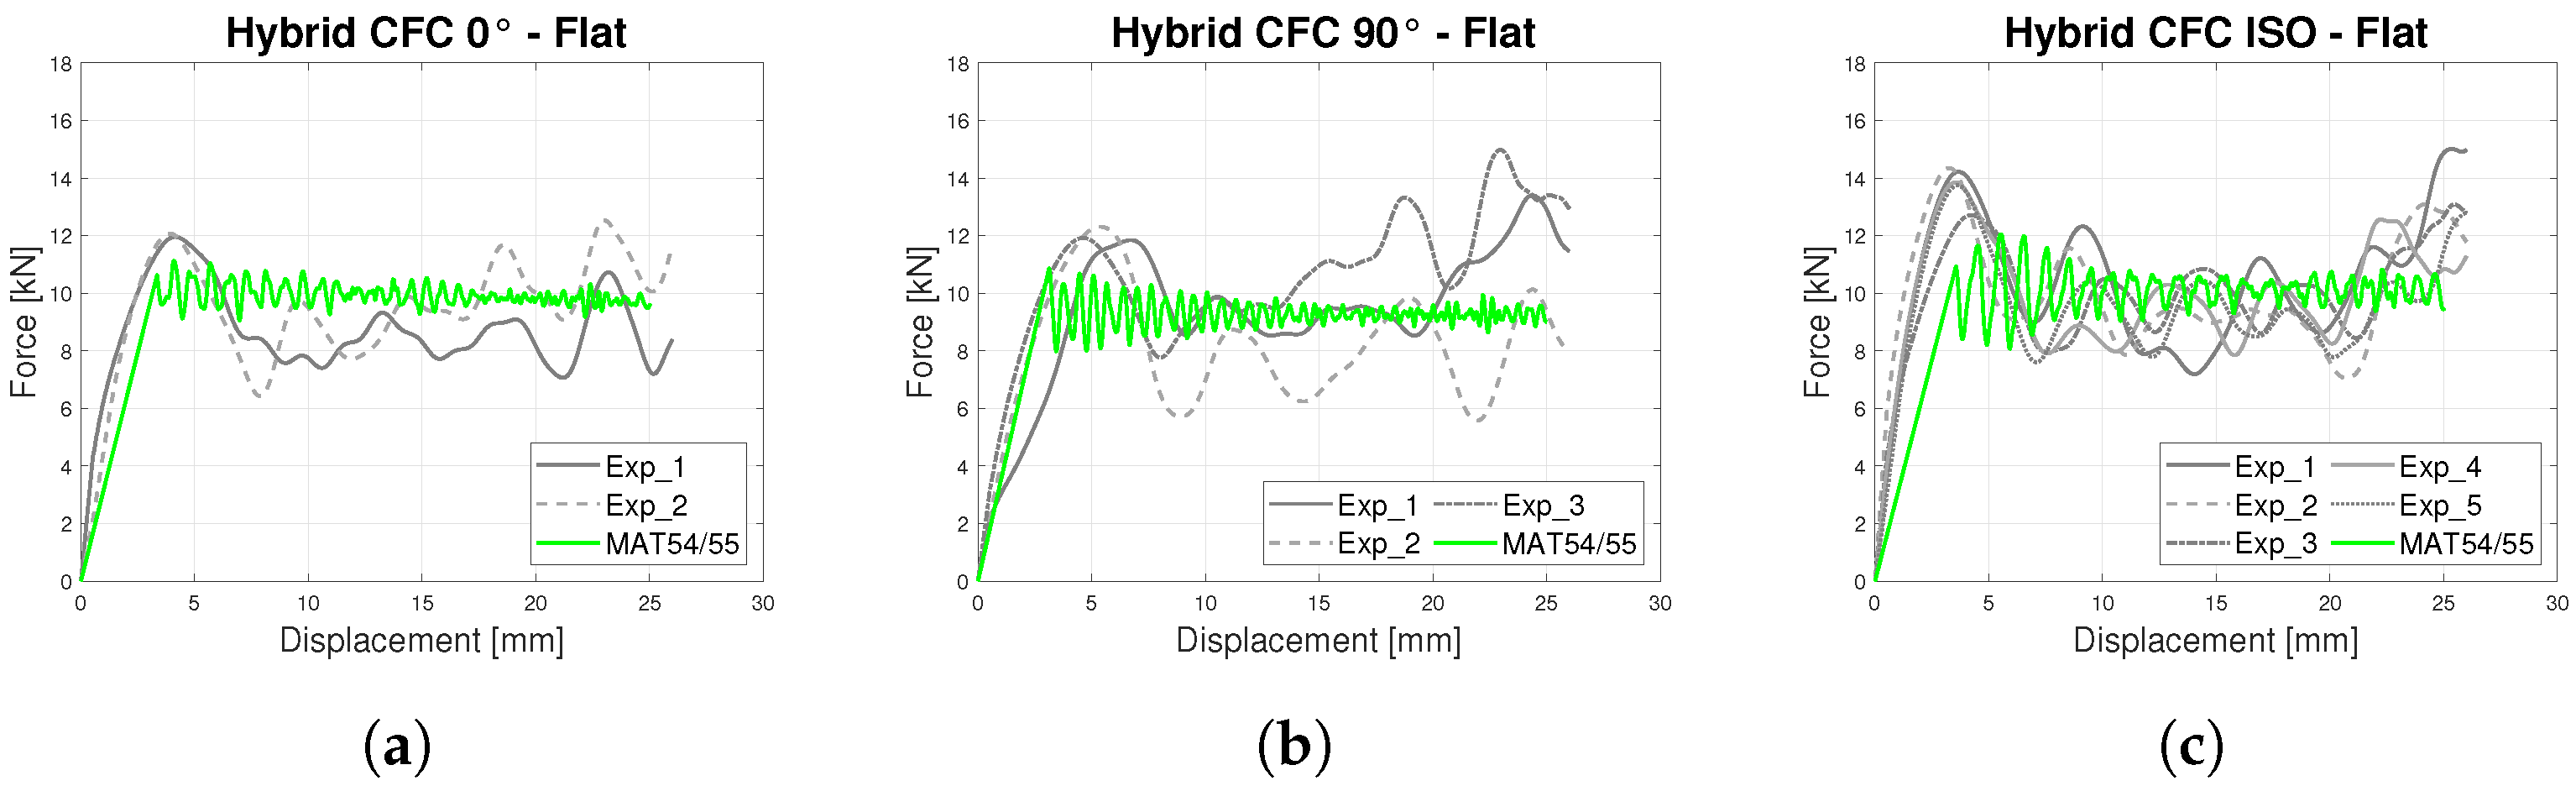
- In-plane Crashworthiness—Flat shape
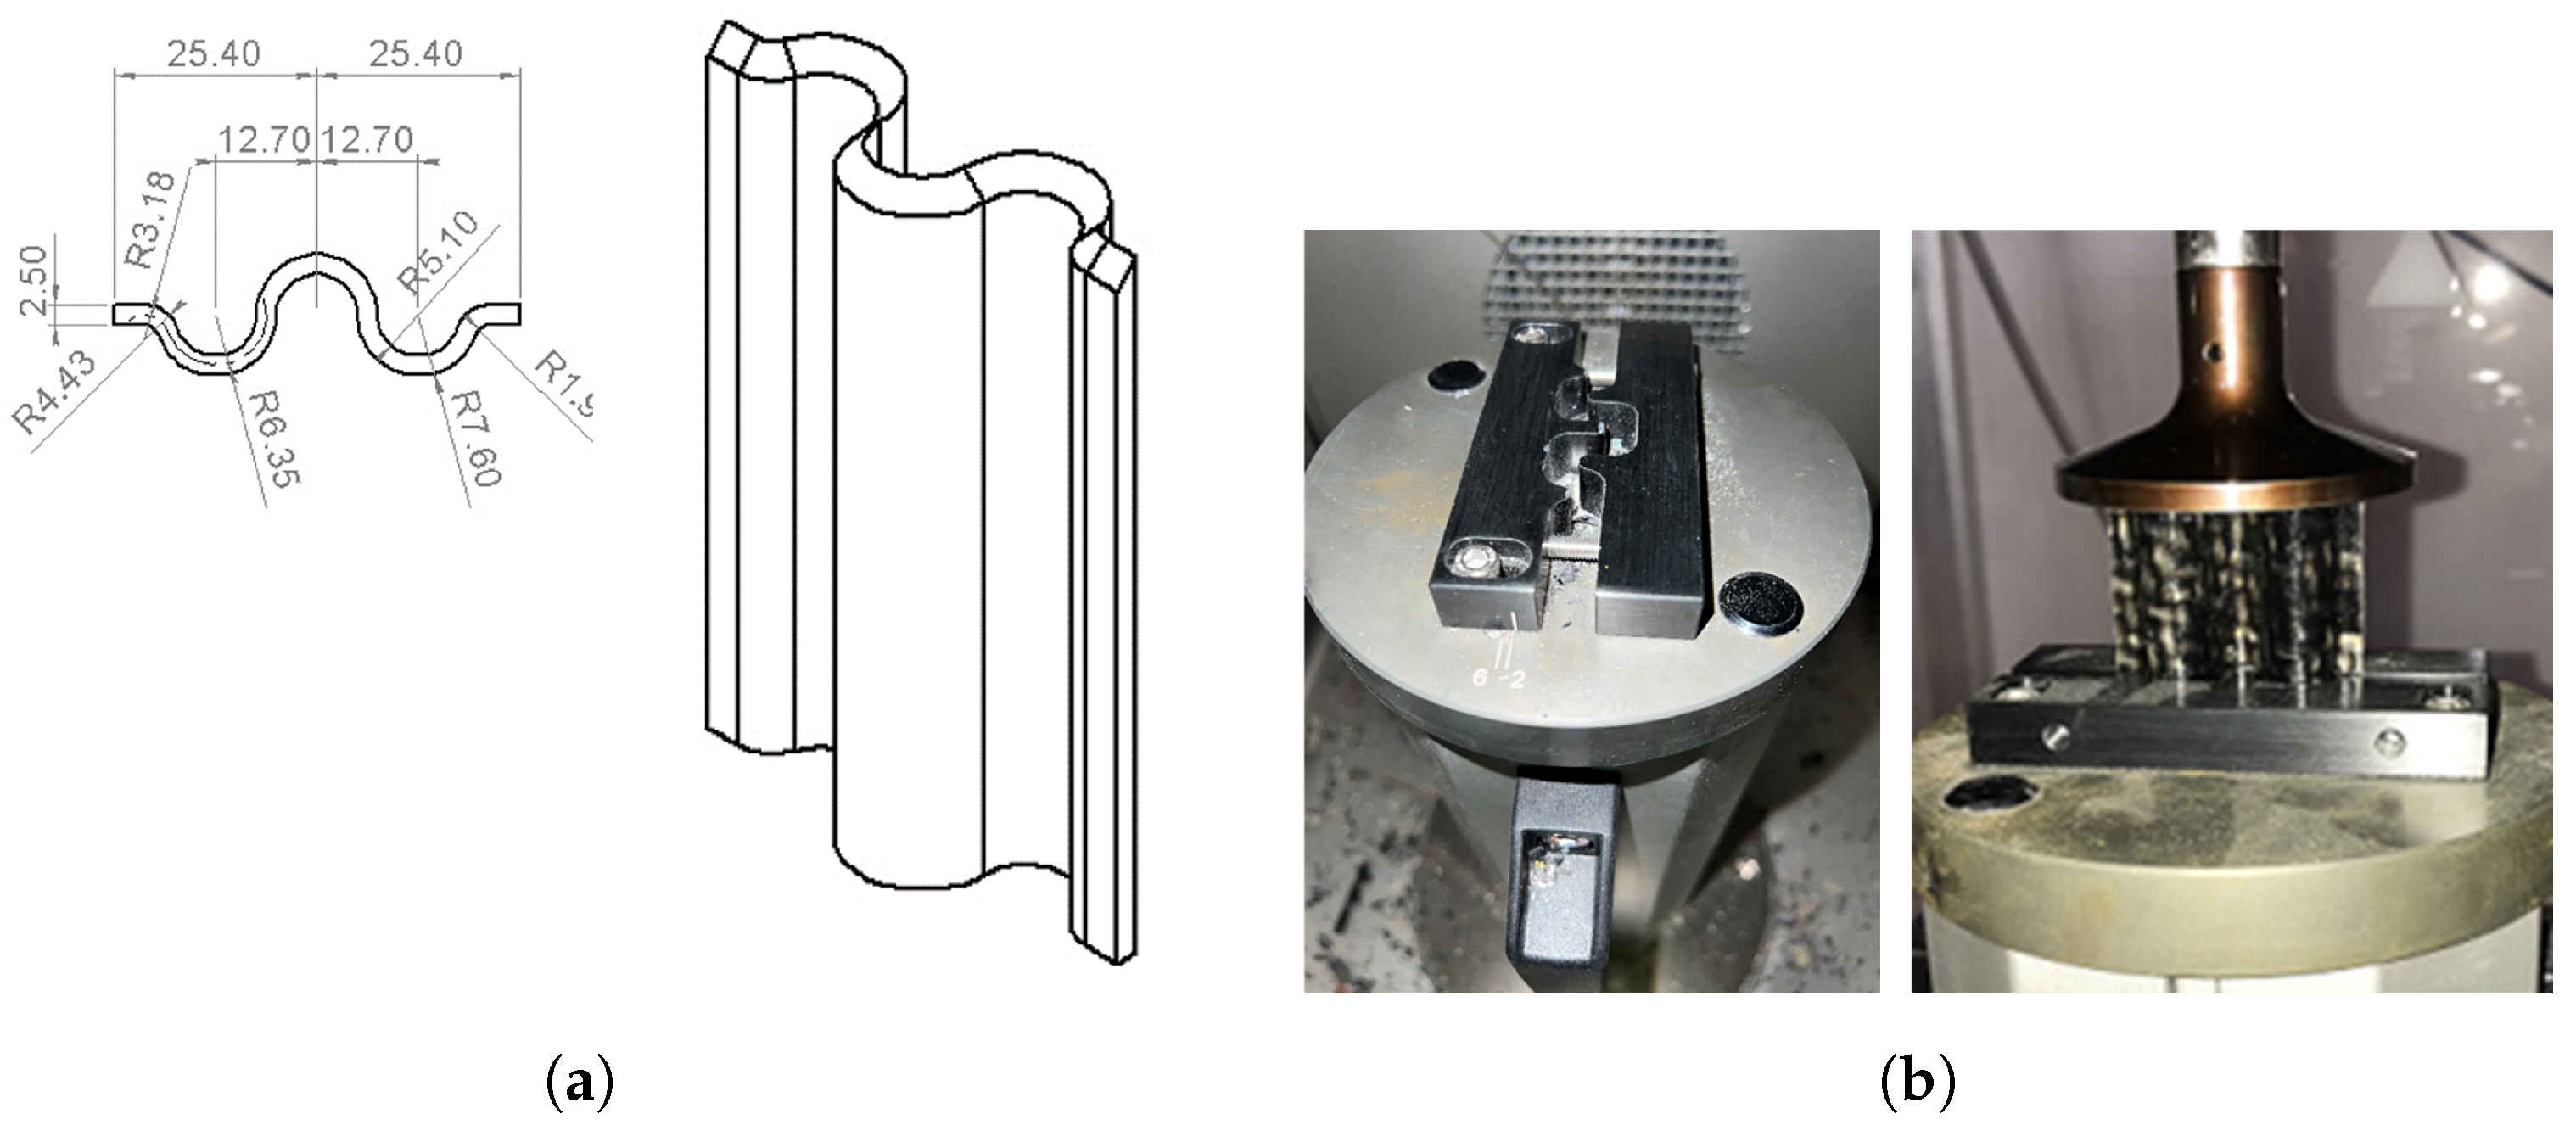
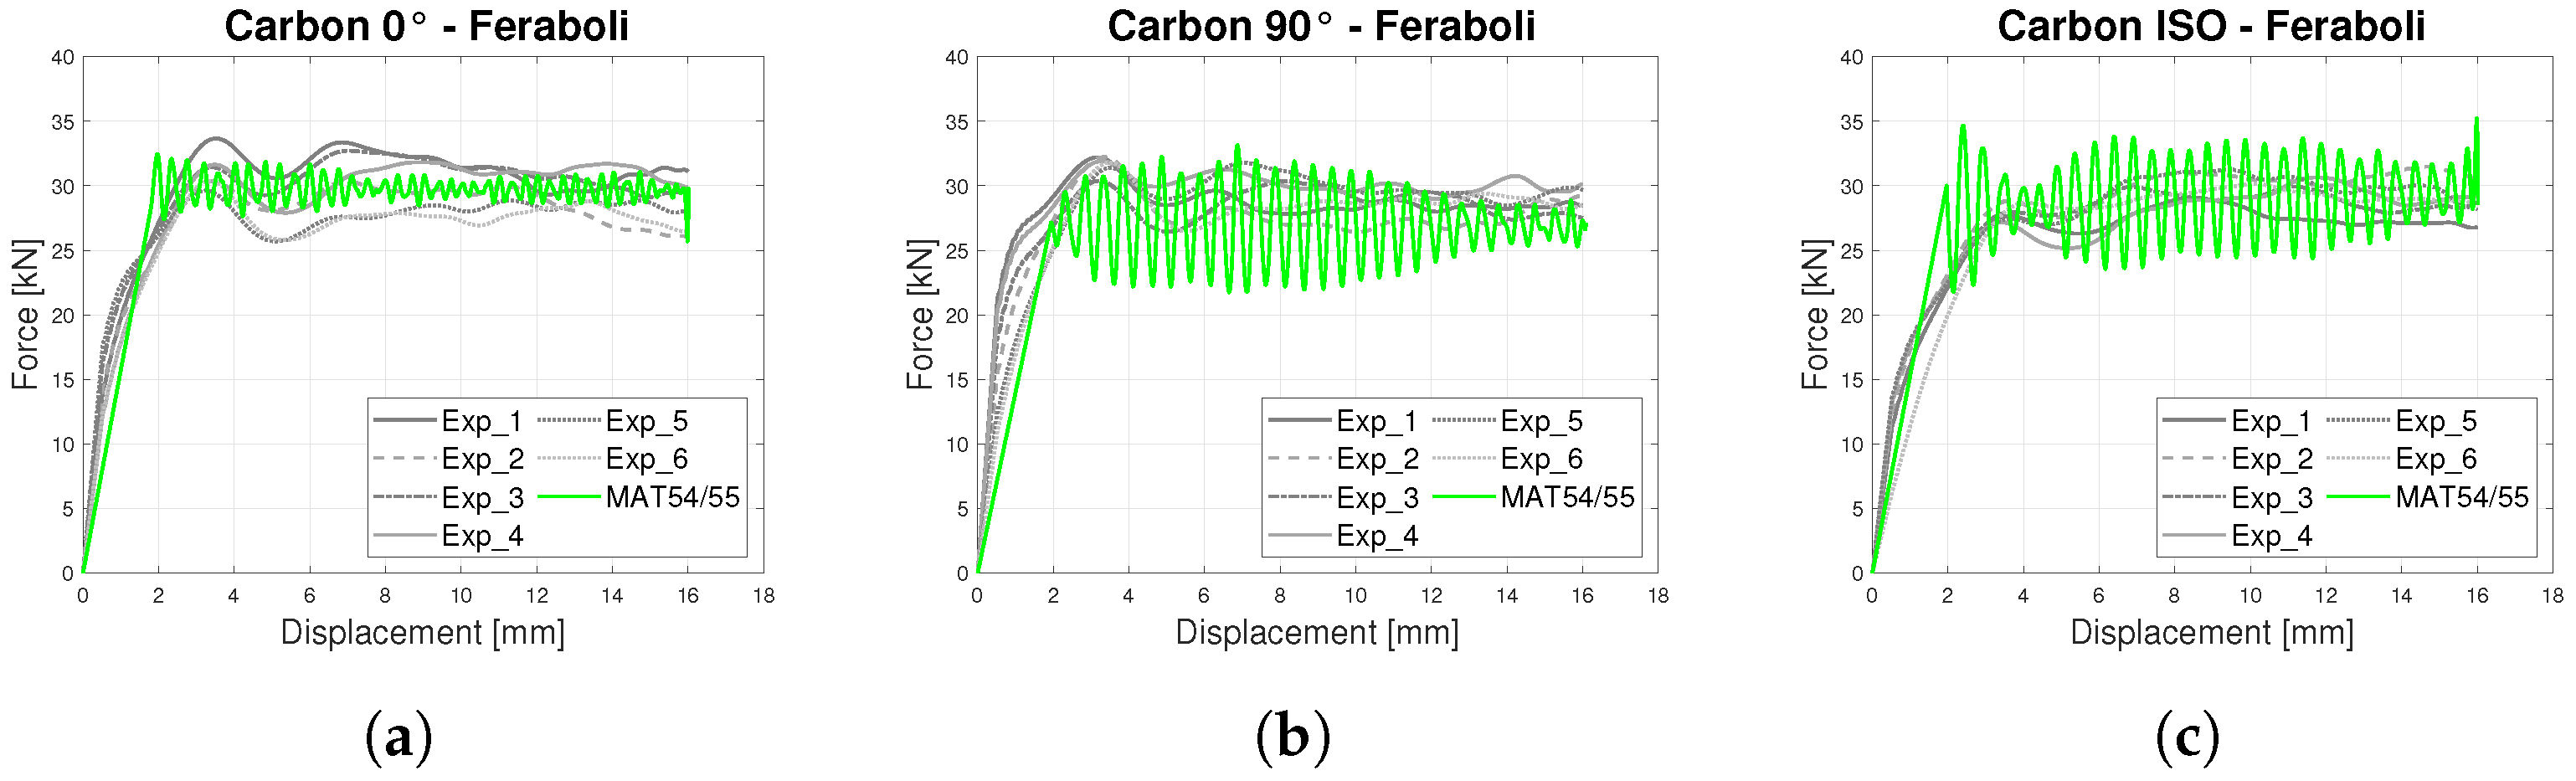
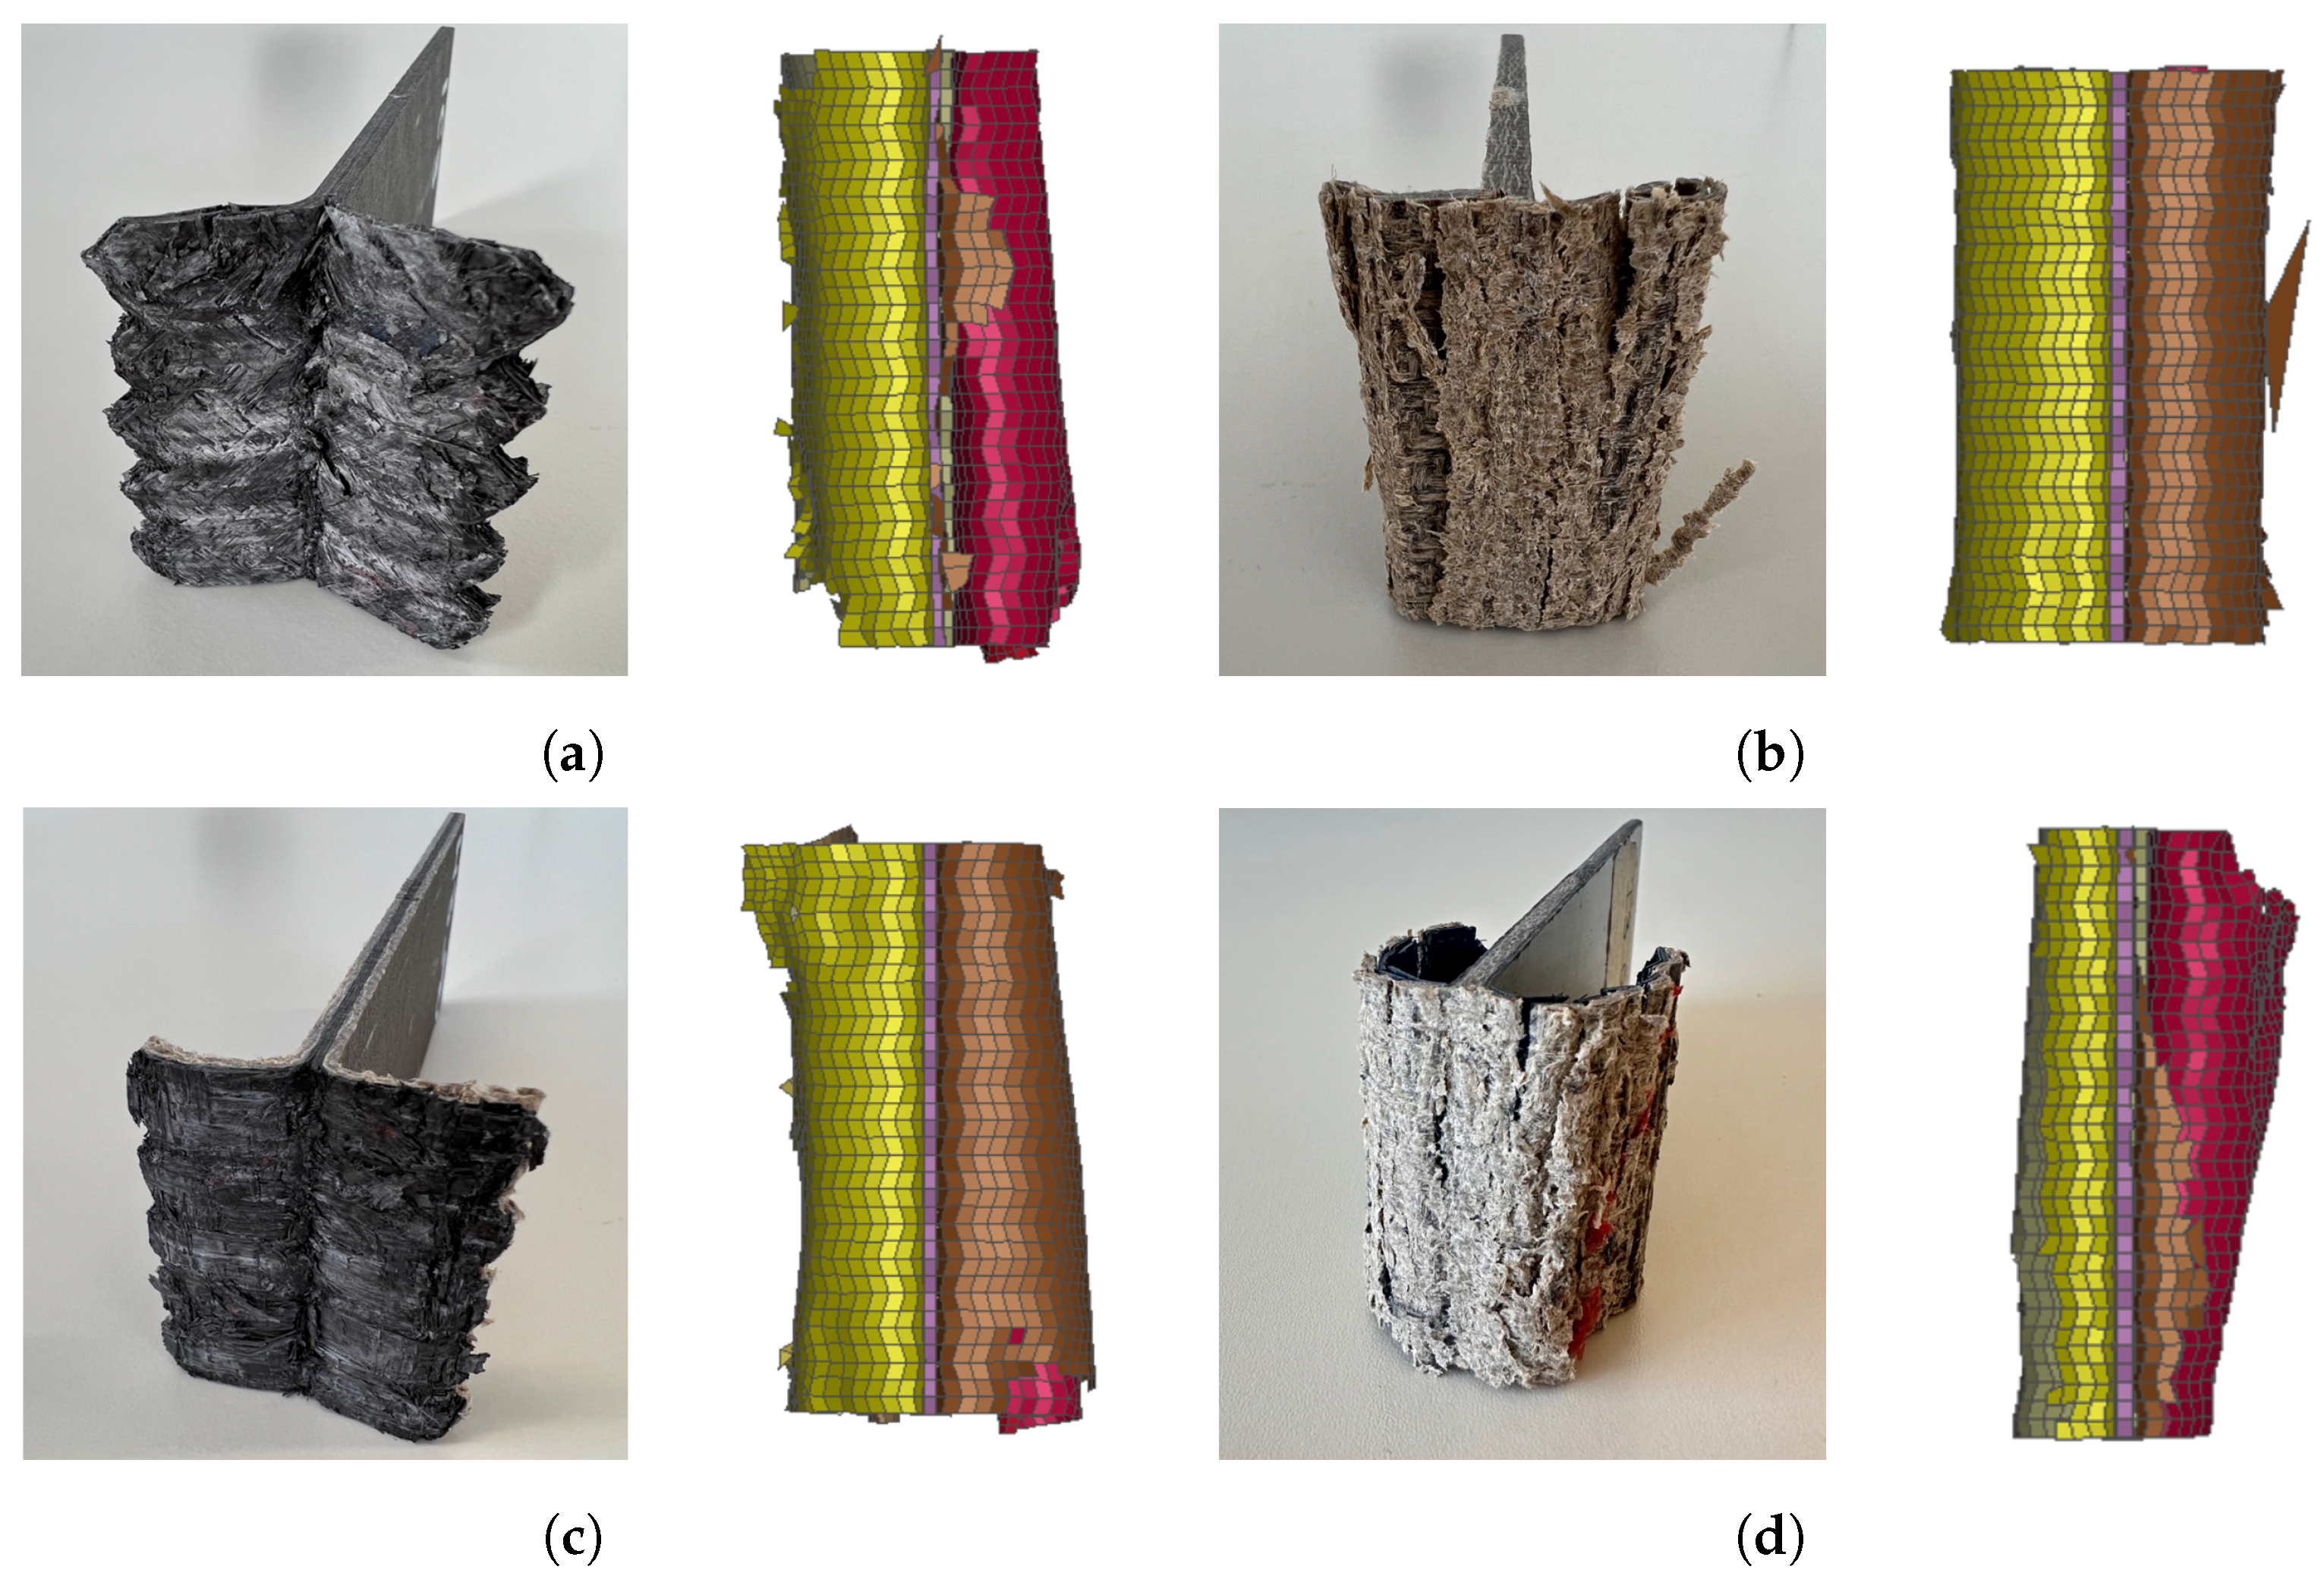
- In-plane Crashworthiness—Feraboli shape
4. Results and Discussion
- DCB
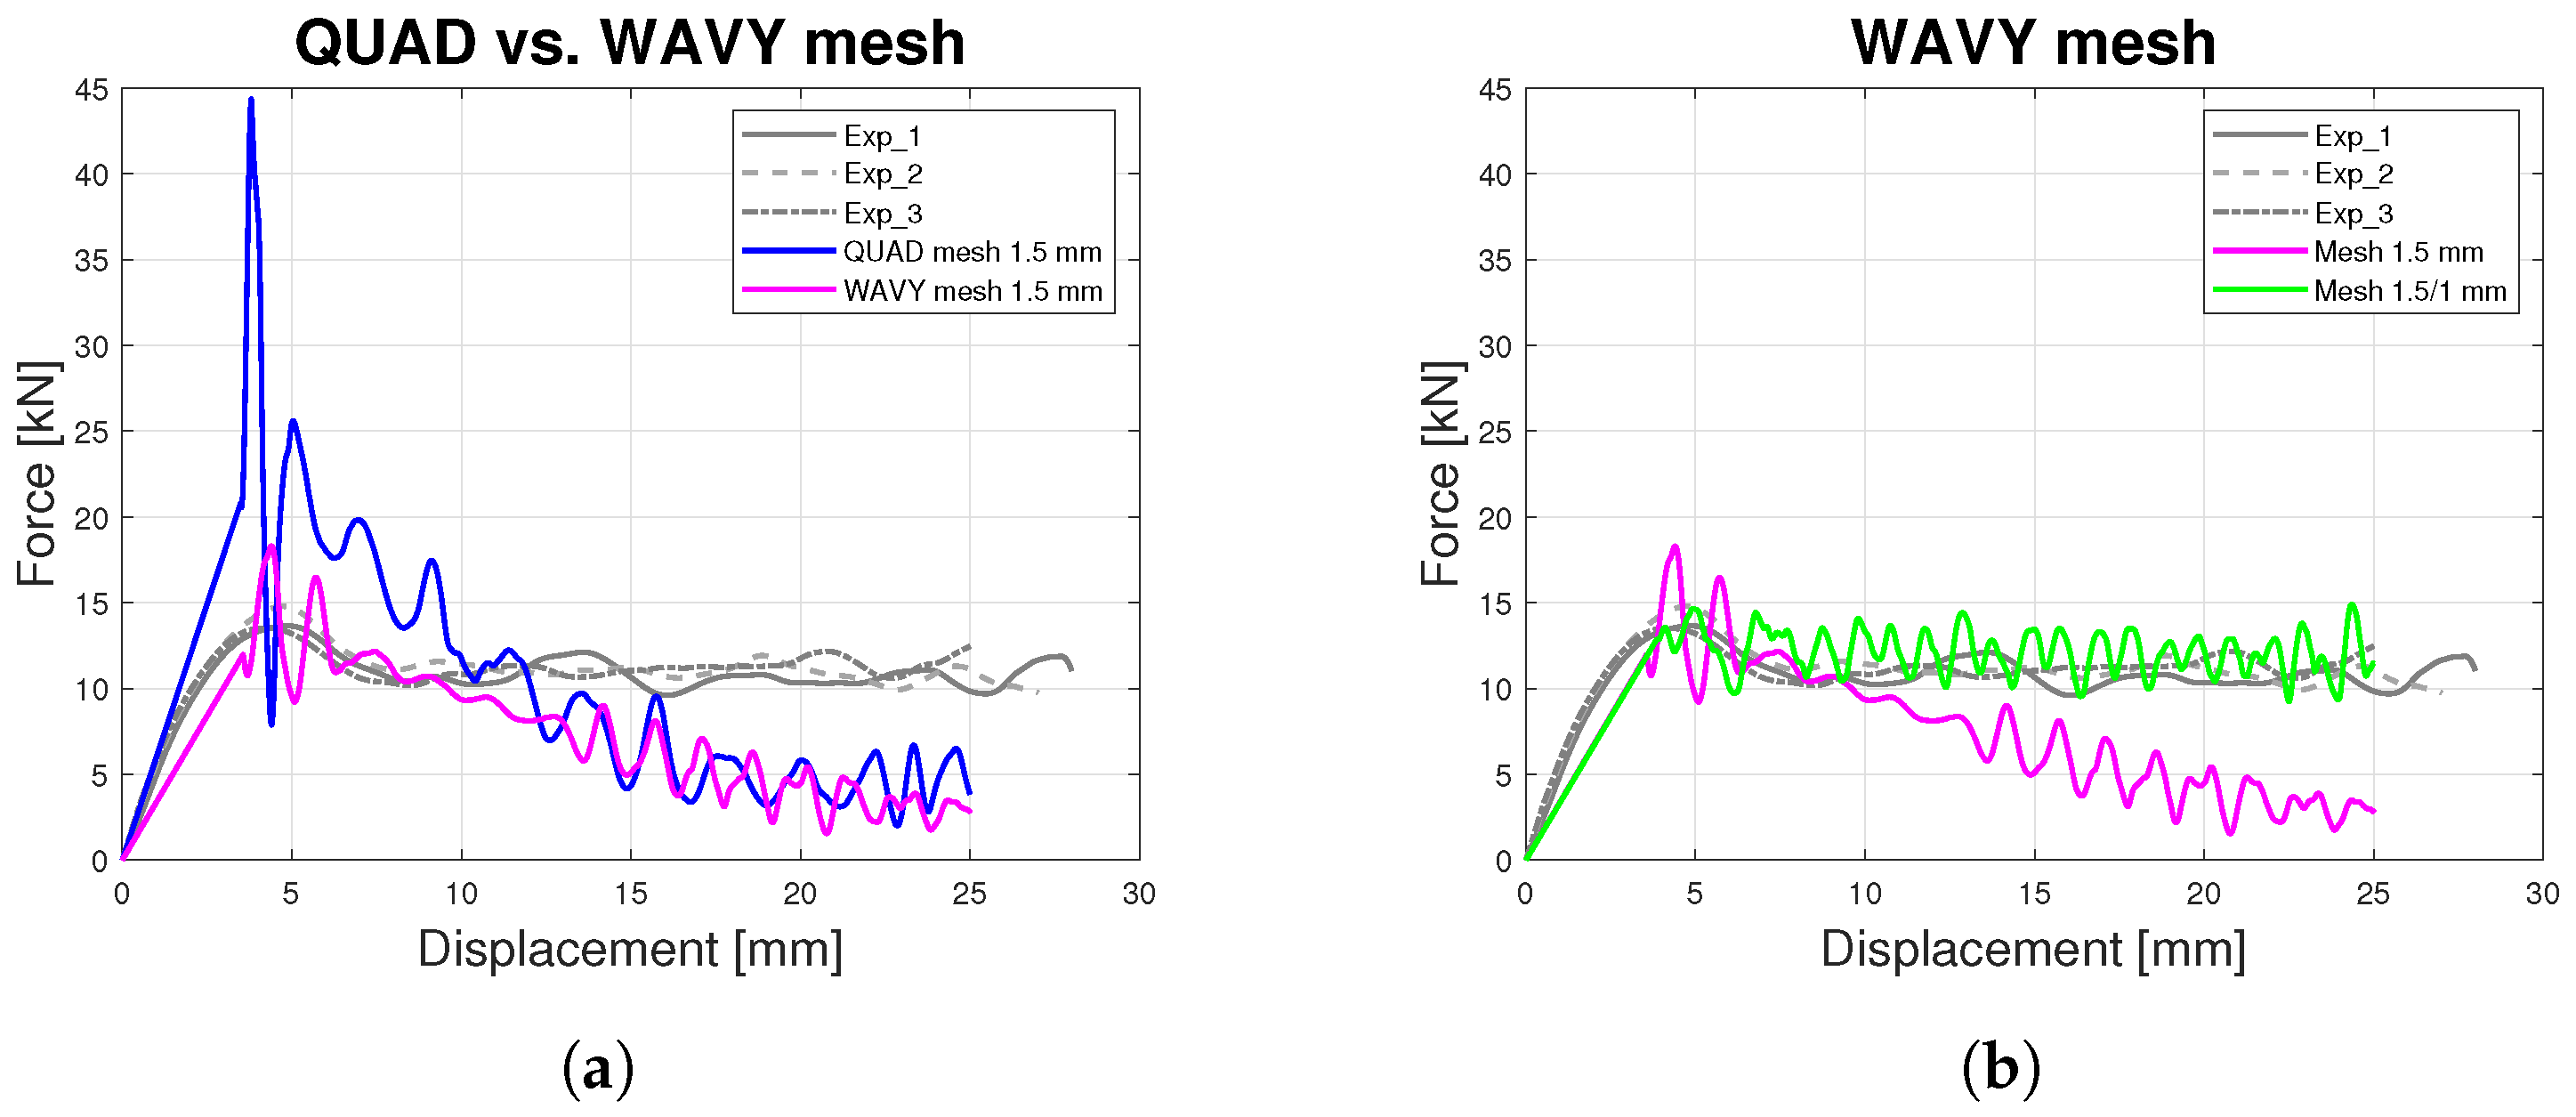
- In-plane Crashworthiness
5. Conclusions
Author Contributions
Funding
Data Availability Statement
Conflicts of Interest
Abbreviations
| NFCs | Natural Fibre Composites |
| CFE | Crush Force Efficiency |
| SEA | Specific Energy Absorption |
| ISO | Quasi-isotropic |
| FE | Finite Element |
| RC | Resin Content |
| DCB | Double Cantilever Beam |
| 4ENF | Four-Point End Notched Flexure |
| CFC | Carbon–Flax–Carbon: |
| FCF | Flax–Carbon–Flax: |
| MCC | Modified Compliance Calibration |
| CC | Compliance Calibration |
| MAT54/55 | MAT_ENHANCED_COMPOSITE_DAMAGE |
| MAT138 | MAT_COHESIVE_MIXED_MODE |
| MAT001 | MAT_ELASTIC |
| MAT020 | MAT_RIGID |
| DFAILT | Maximum Strain for Fibre Tension |
| DFAILC | Maximum Strain for Fibre Compression |
| DFAILS | Maximum Shear Strain |
| LVI | Low-Velocity Impact |
References
- Elfaleh, I.; Abbassi, F.; Habibi, M.; Ahmad, F.; Guedri, M.; Nasri, M.; Garnier, C. A comprehensive review of natural fibers and their composites: An eco-friendly alternative to conventional materials. Results Eng. 2023, 19, 101271. [Google Scholar] [CrossRef]
- Agency, E.E. Climate Change Mitigation: Reducing Emissions, December 2023. Available online: https://www.eea.europa.eu/en/topics/in-depth/climate-change-mitigation-reducing-emissions (accessed on 10 July 2024).
- Mohammed, L.; Ansari, M.N.M.; Pua, G.; Jawaid, M.; Islam, M.S. A Review on Natural Fiber Reinforced Polymer Composite and Its Applications. Int. J. Polym. Sci. 2015, 2015, 243947. [Google Scholar] [CrossRef]
- Colamartino, I.; Pinato, E.; Cavasin, M.; Tagliabue, M.; Anghileri, M.; Boniardi, M. Static, dynamic and impact properties of a high-performance flax-fiber composite. Results Mater. 2023, 20, 100493. [Google Scholar] [CrossRef]
- Peças, P.; Carvalho, H.; Salman, H.; Leite, M. Natural Fibre Composites and Their Applications: A Review. J. Compos. Sci. 2018, 2, 66. [Google Scholar] [CrossRef]
- Pulikkalparambil, H.; Varghese, S.A.; Chonhenchob, V.; Nampitch, T.; Jarupan, L.; Harnkarnsujarit, N. Recent Advances in Natural Fibre-Based Materials for Food Packaging Applications. Polymers 2023, 15, 1393. [Google Scholar] [CrossRef] [PubMed]
- Venkateshwar Reddy, P.; Saikumar Reddy, R.V.; Lakshmana Rao, J.; Mohana Krishnudu, D.; Rajendra Prasad, P. An overview on natural fiber reinforced composites for structural and non-structural applications. Mater. Today Proc. 2021, 45, 6210–6215. [Google Scholar] [CrossRef]
- Sharath Shekar, H.S.; Ramachandra, M. Green Composites: A Review. Mater. Today Proc. 2018, 5, 2518–2526. [Google Scholar] [CrossRef]
- Abdur Rahman, M.; Haque, S.; Athikesavan, M.M.; Kamaludeen, M.B. A review of environmental friendly green composites: Production methods, current progresses, and challenges. Environ. Sci. Pollut. Res. 2023, 30, 16905–16929. [Google Scholar] [CrossRef]
- Dhakal, H.N.; Zhang, Z.Y.; Guthrie, R.; MacMullen, J.; Bennett, N. Development of flax/carbon fibre hybrid composites for enhanced properties. Carbohydr. Polym. 2013, 96, 1–8. [Google Scholar] [CrossRef]
- Nisini, E.; Santulli, C.; Liverani, A. Mechanical and impact characterization of hybrid composite laminates with carbon, basalt and flax fibres. Compos. Part B Eng. 2017, 127, 92–99. [Google Scholar] [CrossRef]
- Agopian, J.C.; Téraube, O.; Hajjar-Garreau, S.; Charlet, K.; Dubois, M. Study of carbon-flax hybrid composites modified by fibre fluorination. J. Fluor. Chem. 2023, 272, 110213. [Google Scholar] [CrossRef]
- Fairlie, G.; Njuguna, J. Damping Properties of Flax/Carbon Hybrid Epoxy/Fibre-Reinforced Composites for Automotive Semi-Structural Applications. Fibers 2020, 8, 64. [Google Scholar] [CrossRef]
- Wang, A.; Liu, X.; Yue, Q.; Xian, G. Tensile properties hybrid effect of unidirectional flax/carbon fiber hybrid reinforced polymer composites. J. Mater. Res. Technol. 2023, 24, 1373–1389. [Google Scholar] [CrossRef]
- Wang, A.; Liu, X.; Yue, Q.; Xian, G. Effect of volume ratio and hybrid mode on low-velocity impact properties of unidirectional flax/carbon fiber hybrid reinforced polymer composites. Thin-Walled Struct. 2023, 187, 110764. [Google Scholar] [CrossRef]
- Yashas Gowda, T.G.; Vinod, A.; Madhu, P.; Kushvaha, V.; Rangappa, S.M.; Siengchin, S. A new study on flax-basalt-carbon fiber reinforced epoxy/bioepoxy hybrid composites. Polym. Compos. 2021, 42, 1891–1900. [Google Scholar] [CrossRef]
- Yashas Gowda, T.G.; Madhu, P.; Kushvaha, V.; Rangappa, S.M.; Siengchin, S. Comparative evaluation of areca/carbon/basalt fiber reinforced epoxy/bio epoxy based hybrid composites. Polym. Compos. 2022, 43, 4179–4190. [Google Scholar] [CrossRef]
- Yorseng, K.; Mavinkere Rangappa, S.; Parameswaranpillai, J.; Siengchin, S. Towards green composites: Bioepoxy composites reinforced with bamboo/basalt/carbon fabrics. J. Clean. Prod. 2022, 363, 132314. [Google Scholar] [CrossRef]
- Sisodia, R.; Jerry, K.; Pratim Das, P.; Gupta, P.; Gupta, S.; Chaudhary, V. Experimental study on mechanical behaviour of linen/epoxy and linen/hemp/epoxy hybrid polymer composite. Mater. Today Proc. 2023, 78, 372–377. [Google Scholar] [CrossRef]
- Chaudhary, V.; Bajpai, P.K.; Maheshwari, S. Studies on Mechanical and Morphological Characterization of Developed Jute/Hemp/Flax Reinforced Hybrid Composites for Structural Applications. J. Nat. Fibers 2018, 15, 80–97. [Google Scholar] [CrossRef]
- Guo, K.; Liu, X.; Ren, Y.; Jiang, H. Experimental study on crashworthiness and failure mechanisms of aeronautical multi-fibers hybrid composite corrugated structures with Carbon, Glass, Kevlar. Aerosp. Sci. Technol. 2023, 142, 108599. [Google Scholar] [CrossRef]
- Grauers, L.; Olsson, R.; Gutkin, R. Energy absorption and damage mechanisms in progressive crushing of corrugated NCF laminates: Fractographic analysis. Compos. Struct. 2014, 110, 110–117. [Google Scholar] [CrossRef]
- LS-DYNA, R13. Volume II, Material Models. Livermore Software Technology: Troy, MI, USA, 2021.
- ASTM D5528-13; Standard Test Method for Mode I Interlaminar Fracture Toughness of Unidirectional Fiber-Reinforced Polymer Matrix Composites. ASTM International: West Conshohocken, PA, USA, 1994.
- Belingardi, G.; Boria, A.S. Delaminazione Sperimentale e Numerica in Laminati Composito. In Proceedings of the 40° Convegno Nazionale AIAS, Palermo, Italy, 7–10 September 2011. [Google Scholar]
- ASTM D7905/D7905M-19e1; Standard Fracture Toughness of Unidirectional Fiber-Reinforced Polymer Matrix Composites. ASTM International: West Conshohocken, PA, USA, 2014.
- Cerioni, A. Simulation of Delamination in Composite Materials under Static and Fatigue Loading by Cohesive Zone Models. Ph.D. Thesis, Università degli Studi di Cagliari, Cagliari, Italy, 2009. [Google Scholar]
- Syed Abdullah, S.I.B.; Bokti, S.K.; Wong, K.J.; Johar, M.; Chong, W.W.F.; Dong, Y. Mode II and mode III delamination of carbon fiber/epoxy composite laminates subjected to a four-point bending mechanism. Compos. Part B Eng. 2024, 270, 111110. [Google Scholar] [CrossRef]
- Vigna, L. Development of an Innovative Procedure to Assess the Crashworthiness of Composite Materials. Ph.D. Thesis, ScuDo-Doctoral School Politecnico di Torino, Torino, Italy, 2023. [Google Scholar]
- Vigna, L.; Calzolari, A.; Galizia, G.; Belingardi, G.; Paolino, D.S. Effect of impact speed and friction on the in-plane crashworthiness of composite plates. Procedia Struct. Integr. 2021, 33, 623–629. [Google Scholar] [CrossRef]
- Babaei, I.; Garg, R.; Vigna, L.; Paolino, D.S.; Belingardi, G.; Cascone, L.; Calzolari, A.; Galizia, G. Newly Developed Anti-Buckling Fixture to Assess the In-Plane Crashworthiness of Flat Composite Specimens. Appl. Sci. 2020, 10, 7797. [Google Scholar] [CrossRef]
- Feraboli, P. Development of a Corrugated Test Specimen for Composite Materials Energy Absorption. J. Compos. Mater. 2008, 42, 229–256. [Google Scholar] [CrossRef]
- Barnett, P.R.; Vigna, L.; Martínez-Collado, J.L.; Calzolari, A.; Penumadu, D. Crashworthiness of recycled carbon fiber composite sinusoidal structures at dynamic rates. Compos. Struct. 2023, 311, 116847. [Google Scholar] [CrossRef]
- Rabiee, A.; Ghasemnejad, H. Finite Element Modelling Approach for Progressive Crushing of Composite Tubular Absorbers in LS-DYNA: Review and Findings. J. Compos. Sci. 2022, 6, 11. [Google Scholar] [CrossRef]
- Feindler, N. Charakterisierungs- und Simulationsmethodik zum Versagensverhalten Energieabsorbierender Faserverbundstrukturen. Ph.D. Thesis, Technische Universität München, München, Germany, 2012. [Google Scholar]
- Giammaria, V.; Del Bianco, G.; Raponi, E.; Fiumarella, D.; Ciardiello, R.; Boria, S.; Duddeck, F.; Belingardi, G. Material parameter optimization of flax/epoxy composite laminates under low-velocity impact. Compos. Struct. 2023, 321, 117303. [Google Scholar] [CrossRef]
- Feraboli, P.; Wade, B.; Deleo, F.; Rassaian, M.; Higgins, M.; Byar, A. LS-DYNA MAT54 modeling of the axial crushing of a composite tape sinusoidal specimen. Compos. Part A Appl. Sci. Manuf. 2011, 42, 1809–1825. [Google Scholar] [CrossRef]
- Abdallah, M.H.; Braimah, A. Numerical design optimization of the fiber orientation of glass/phenolic composite tubes based on tensile and radial compression tests. Compos. Struct. 2022, 280, 114898. [Google Scholar] [CrossRef]
- Kim, J.S.; Yoon, H.J.; Shin, K.B. A study on crushing behaviors of composite circular tubes with different reinforcing fibers. Int. J. Impact Eng. 2011, 38, 198–207. [Google Scholar] [CrossRef]
- Wang, Y.; Feng, J.; Wu, J.; Hu, D. Effects of fiber orientation and wall thickness on energy absorption characteristics of carbon-reinforced composite tubes under different loading conditions. Compos. Struct. 2016, 153, 356–368. [Google Scholar] [CrossRef]
- Cutting, R.A.; Rios-Tascon, F.; Goodsell, J.E. Experimental investigation of the crush performance of prepreg platelet molding compound tubes. J. Compos. Mater. 2020, 54, 4311–4324. [Google Scholar] [CrossRef]
- Feraboli, P.; Wade, B.; Deleo, F.; Rassaian, M. Crush energy absorption of composite channel section specimens. Compos. Part A Appl. Sci. Manuf. 2009, 40, 1248–1256. [Google Scholar] [CrossRef]


| Orientation | E [GPa] | [MPa] | G [GPa] | [MPa] | |
|---|---|---|---|---|---|
| Carbon | 0° | 61.4 | 999 | - | - |
| 45° | - | 115 | 3.3 | 58 | |
| 90° | 57.4 | 987 | - | - | |
| Flax | 0° | 9.5 | 128 | - | - |
| 45° | 5.2 | 80 | 1.7 | 40 | |
| 90° | 10.3 | 147 | - | - |
| Orientation | [GPa] | [MPa] | |
|---|---|---|---|
| Carbon | 0° | 55.6 | 478 |
| 90° | 59.2 | 457 | |
| Flax | 0° | 9.2 | 93 |
| 90° | 8.9 | 105 |
| MAT_COHESIVE_MIXED_MODE (MAT138) | ||
|---|---|---|
| RO [kg/mm3] | EN [kN] | ET [kN] |
| 1 | 3.2 | 2 |
| GIC [kJ/mm2] | GIIC [kJ/mm2] | UND = UTD [mm] |
| 0.0021 | 0.0018 | 0.2 |
| MAT_ENHANCED_COMPOSITE_DAMAGE (MAT54/55) | |||||
|---|---|---|---|---|---|
| RO [Kg/mm3] | EA [GPa] | EB [GPa ] | PRBA | GAB [GPa] | GBC [GPa] |
| 1.44 | 60 | 60 | 0.033 | 3.3 | 3.3 |
| GCA [GPa] | 2WAY | DFAILS | TFAIL | SOFT | DFAILT |
| 3.3 | 1 | 0.104 | 1 | 1 | 0.083 |
| DFAILC | XC [GPa] | XT [GPa] | YC [GPa] | YT [GPa] | SC [GPa] |
| −0.074 | 0.47 | 0.99 | 0.47 | 0.99 | 0.06 |
| MAT_ENHANCED_COMPOSITE_DAMAGE (MAT54/55) | |||||
|---|---|---|---|---|---|
| RO [Kg/mm3] | EA [GPa] | EB [GPa] | PRBA | GAB [GPa] | GBC [GPa] |
| 1.27 | 10 | 10 | 0.12 | 1.7 | 1.7 |
| GCA [GPa] | 2WAY | DFAILS | TFAIL | SOFT | DFAILT |
| 1.7 | 1 | 0.129 | 1 | 1 | 0.068 |
| DFAILC | XC [GPa] | XT [GPa] | YC [GPa] | YT [GPa] | SC [GPa] |
| −0.163 | 0.1 | 0.13 | 0.12 | 0.15 | 0.04 |
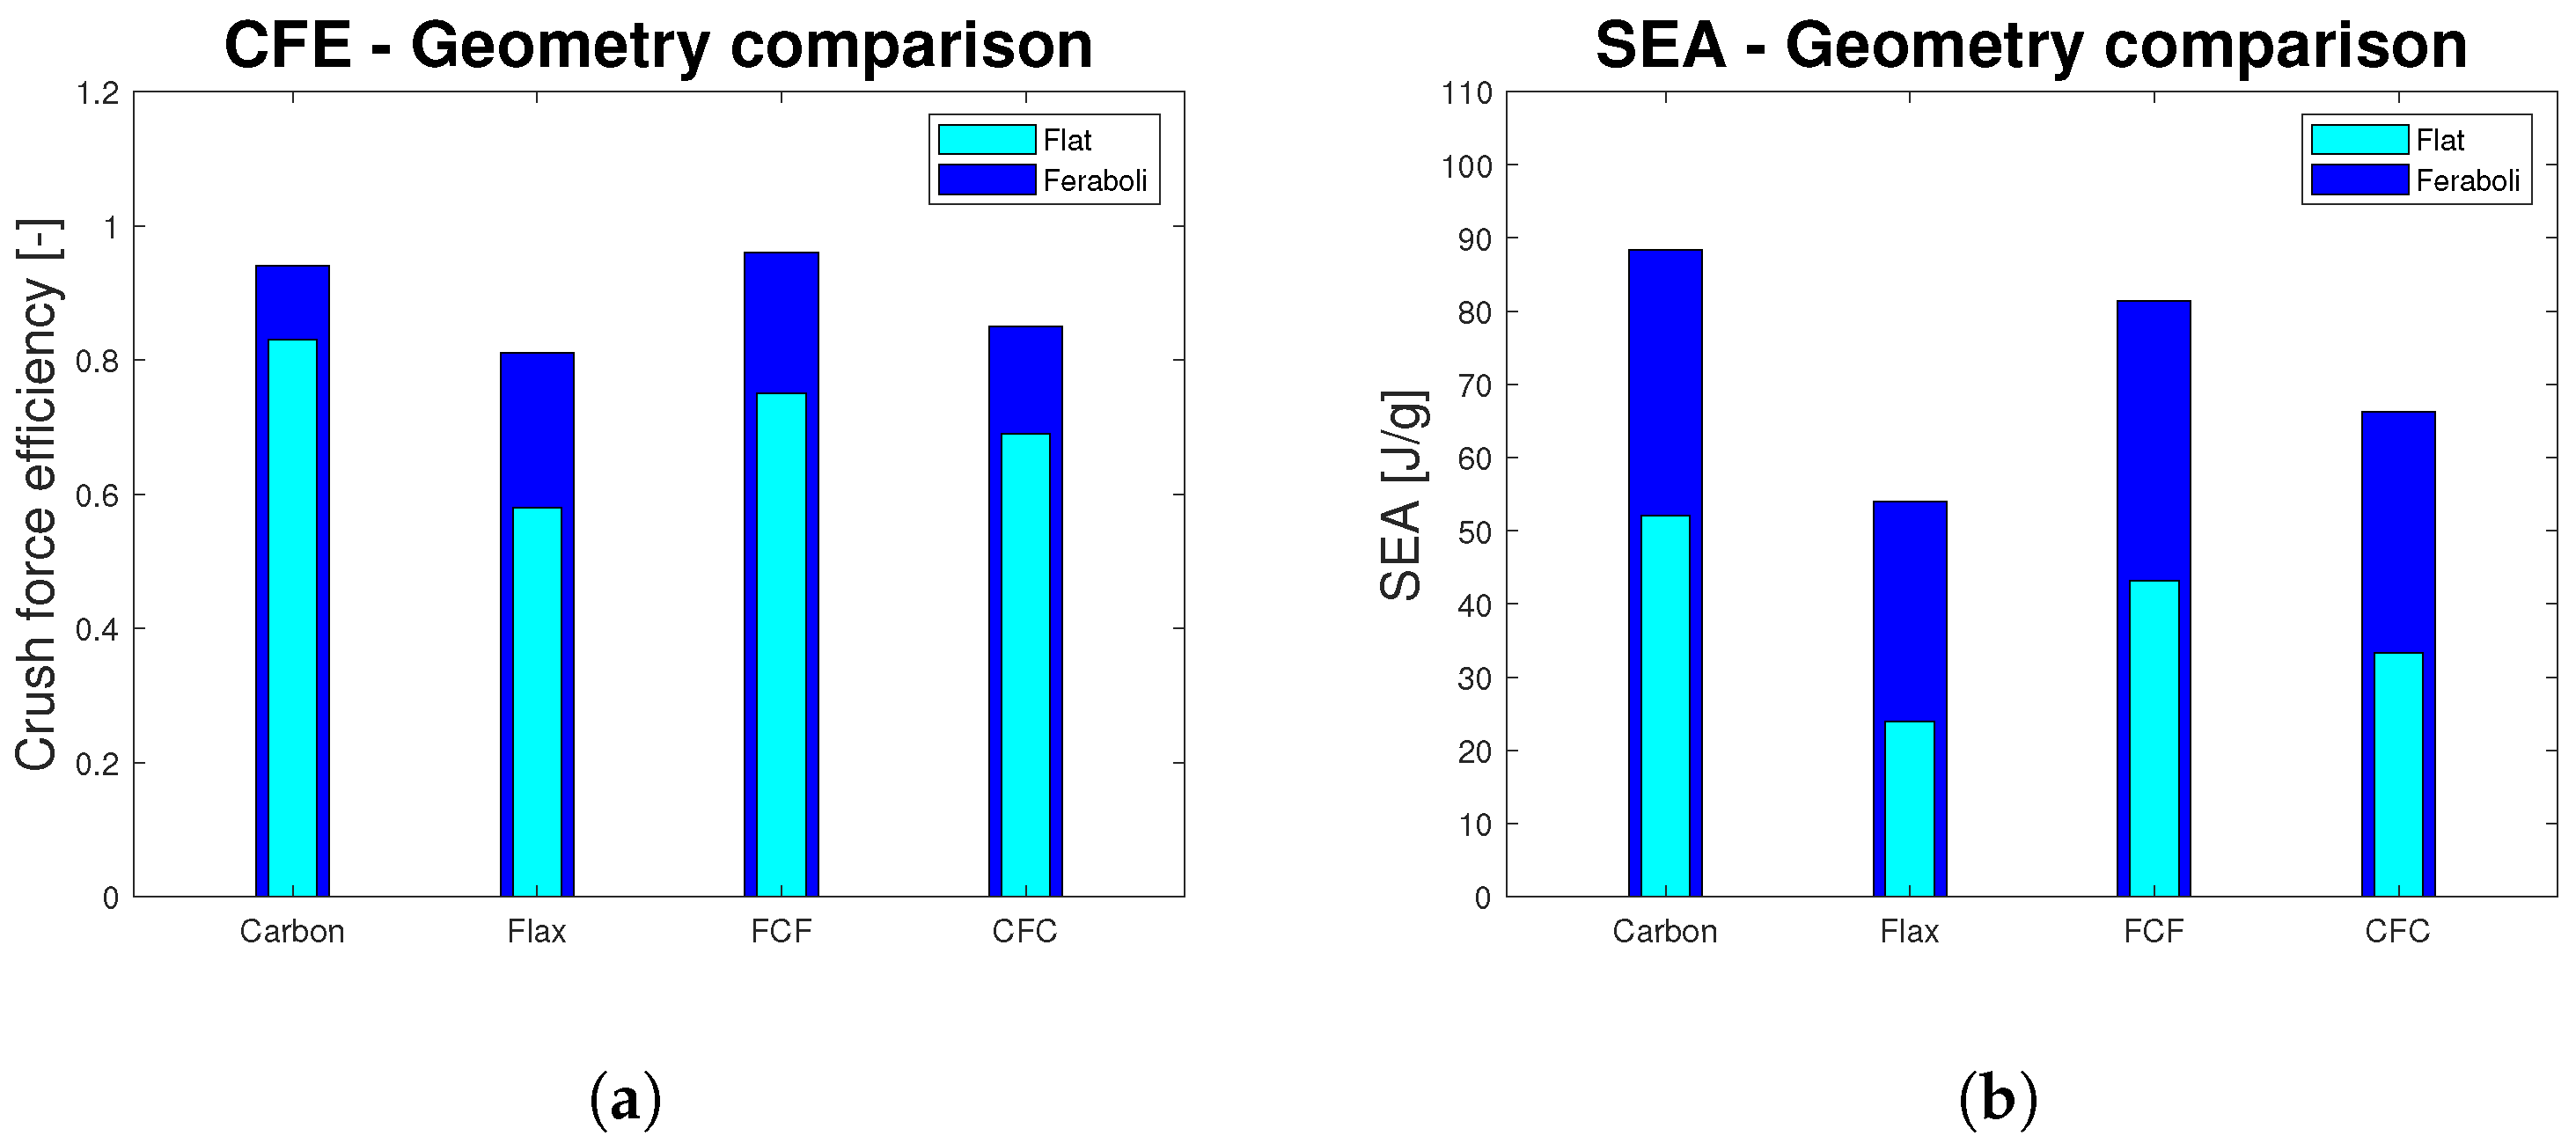
| CFE | Error [%] | SEA [J/g] | Error [%] | ||
|---|---|---|---|---|---|
| Carbon | Exp. | 0.83 | 3.59 | 52.07 | 8.47 |
| Num. | 0.84 | 54.15 | |||
| Flax | Exp. | 0.58 | 44.76 | 23.96 | 39.73 |
| Num. | 0.32 | 14.39 | |||
| FCF | Exp. | 0.75 | 10.21 | 43.17 | 8.37 |
| Num. | 0.79 | 46.60 | |||
| CFC | Exp. | 0.69 | 24.13 | 33.31 | 6.10 |
| Num. | 0.86 | 34.99 |
| CFE | Error [%] | SEA [J/g] | Error [%] | ||
|---|---|---|---|---|---|
| Carbon | Exp. | 0.94 | 8.89 | 88.36 | 4.03 |
| Num. | 0.85 | 84.82 | |||
| Flax | Exp. | 0.81 | 7.28 | 53.94 | 5.25 |
| Num. | 0.77 | 52.29 | |||
| FCF | Exp. | 0.96 | 9.67 | 81.45 | 5.14 |
| Num. | 0.87 | 77.32 | |||
| CFC | Exp. | 0.85 | 4.25 | 66.29 | 4.83 |
| Num. | 0.88 | 64.76 |
Disclaimer/Publisher’s Note: The statements, opinions and data contained in all publications are solely those of the individual author(s) and contributor(s) and not of MDPI and/or the editor(s). MDPI and/or the editor(s) disclaim responsibility for any injury to people or property resulting from any ideas, methods, instructions or products referred to in the content. |
© 2024 by the authors. Licensee MDPI, Basel, Switzerland. This article is an open access article distributed under the terms and conditions of the Creative Commons Attribution (CC BY) license (https://creativecommons.org/licenses/by/4.0/).
Share and Cite
Giammaria, V.; Del Bianco, G.; Capretti, M.; Boria, S.; Vigna, L.; Calzolari, A.; Castorani, V. Geometry and Hybridization Effect on the Crashworthiness Performances of Carbon and Flax/Epoxy Composites. J. Compos. Sci. 2024, 8, 331. https://doi.org/10.3390/jcs8080331
Giammaria V, Del Bianco G, Capretti M, Boria S, Vigna L, Calzolari A, Castorani V. Geometry and Hybridization Effect on the Crashworthiness Performances of Carbon and Flax/Epoxy Composites. Journal of Composites Science. 2024; 8(8):331. https://doi.org/10.3390/jcs8080331
Chicago/Turabian StyleGiammaria, Valentina, Giulia Del Bianco, Monica Capretti, Simonetta Boria, Lorenzo Vigna, Andrea Calzolari, and Vincenzo Castorani. 2024. "Geometry and Hybridization Effect on the Crashworthiness Performances of Carbon and Flax/Epoxy Composites" Journal of Composites Science 8, no. 8: 331. https://doi.org/10.3390/jcs8080331
APA StyleGiammaria, V., Del Bianco, G., Capretti, M., Boria, S., Vigna, L., Calzolari, A., & Castorani, V. (2024). Geometry and Hybridization Effect on the Crashworthiness Performances of Carbon and Flax/Epoxy Composites. Journal of Composites Science, 8(8), 331. https://doi.org/10.3390/jcs8080331