Article

Sensor Systems for Measuring Force and Temperature with Fiber-Optic Bragg Gratings Embedded in Composite Materials

by
Aliya Kalizhanova
1,2,
Ainur Kozbakova
1,3,*,
Murat Kunelbayev
1,
Zhalau Aitkulov
1,4,
Anar Utegenova
1,2 and
Ulzhan Imanbekova
1,2
1
Institute of Information and Computational Technologies CS MSHE RK, Almaty 050010, Kazakhstan
2
Department IT Engineering, Almaty University of Energy and Communications Named after G. Daukeyev, Almaty 050013, Kazakhstan
3
Department Information Technology, Almaty Technological University, Almaty 050013, Kazakhstan
4
Department Information Systems, Kazakh National Women’s Teacher Training University, Almaty 050000, Kazakhstan
*
Author to whom correspondence should be addressed.
J. Compos. Sci. 2024, 8(8), 321; https://doi.org/10.3390/jcs8080321
Submission received: 14 June 2024 / Revised: 31 July 2024 / Accepted: 2 August 2024 / Published: 14 August 2024
(This article belongs to the Section Fiber Composites)

Abstract

Currently, there is a lot of interest in smart sensors and integrated composite materials in various industries such as construction, aviation, automobile, medical, information technology, communication, and manufacturing. Here, a new conceptual design for a force and temperature sensor system is developed using fiber-optic Bragg grating sensors embedded within composite materials, and a mathematical model is proposed that allows one to estimate strain and temperature based on signals obtained from the optical Bragg gratings. This is important for understanding the behaviors of sensors under different conditions and for creating effective monitoring systems. Describing the strain gradient distribution, especially considering different materials with different Young’s modulus values, provides insight into how different materials respond to applied forces and temperature changes. The shape of the strain gradient distribution was obtained, which is a quadratic function with a maximum value of 1500 µ, with a maximum value at the center of the lattice and a symmetrically decreasing strain value with distance from the central part of the fiber Bragg grating. With the axial strain at the installation site of the Bragg grating sensor under applied force values ranging from 10 to 11 N, the change in strain was linear. As a result of theoretical research, it was found that the developed system with fiber-optic sensors based on Bragg gratings embedded in composite materials is resistant to external influences and temperature changes.

1. Introduction

Sensors play a crucial role in various industries such as factory automation, aerospace, the automotive industry, and construction, making systems intelligent, and have been used for different applications. Fiber-reinforced polymer composites have been widely used in sensors due to their excellent properties—their lightness, high strength, corrosion resistance, and structural properties [1,2,3,4,5]. Composite materials are produced through assemblies of at least two immiscible (but highly adhesive) components that give the assembled material properties lacking in the starting materials taken separately [6]. Composite materials are most commonly produced by combining reinforcing fibers with a matrix (a thermoplastic or thermosetting resin). Reinforcing fibers allow us to increase mechanical characteristics and material properties. They have a low saturation and are easy to handle. There are different shapes (short or continuous fibers) and different types. The most common are glass and carbon fibers. The matrix is there to guarantee the appropriate transfer of deformation to the reinforcing fibers, to protect them from external disturbances, and to ensure the geometric shape of the structures after forming. The matrix must be compatible with the reinforcing fibers while providing a certain deformability. Naturally, it is a thermoplastic or thermosetting resin. Composite materials can be made by various methods. Of course, the most elementary is molding, which can be performed simply by a contact method (reinforcing fibers are placed in a mold and manually impregnated with resin), in a vacuum, or with a more modern injection molding process. Detailed material on fabrication techniques can be found in [7]. Among all kinds of optical fiber configurations, fiber Bragg gratings (FBGs), photo-recorded in the core of the optical fiber, seem to be predominantly known for their composite applications [8]. They react to the modulation of the refractive index of the fiber core along the fiber axis and behave as wavelength-selective mirrors. They are inherently susceptible to temperature, pressure, and axial strain and produce a wavelength-encoded response that can be directly recorded and processed [9]. A recent review on strain measurements in composite laminates using FBG sensors is presented in [10]. It provides numerous references on both their uniaxial and multiaxial strain measurement applications and temperature compensation techniques. In [11,12], the authors developed a method which consisted of adding free tube protection around the optical fiber at the edge of a composite sample. The tube can be polyvinylidene fluoride (PVDF) or polytetrafluoroethylene (PTFE, also known as Teflon). This method is useful for laboratory testing, but it is unrealistic for industrial applications because it prevents the proper cutting and polishing of the edges of the composite material at the location of the optical fiber. In [13,14], a secure connection was developed using standard optical fiber connectors by mounting them on top of a composite material sample, which allows for the easy cutting and polishing of the material.
In [15,16], SHM was considered for composites using FBGs, and these studies covered the more defined topic of SHM used for FBGs integrated into a composite. In [10], the strain measurement of composite laminates using integrated FBGs and their limitations were also thoroughly discussed. In [17], the probability of using FBGs for temperature and strain measurements as sensors in aeronautics and astronautics was discussed. In [18], methods were considered for measuring temperature in uncomplicated and low-cost SHM systems using FBGs. In [19], the authors considered optical fiber sensors integrated into an aperture and presented all sorts of beliefs on the fundamental aspects of their approach, materials, fabrication, and sensor responses for strain measurements. In [20], the probable integration of optical fiber circuitry into aircraft prediction systems that include airframe observations, flight environment investigations, aircraft navigation, and the observation of topically needed pilot well-being characteristics was considered.
Specifically, composites show high potential as structural materials for spacecraft. However, the space environment in which spacecraft are operated can significantly degrade the performance of composites due to the infinitely harsh effects of the high vacuum of space, thermal cycling, atomic oxygen, ultraviolet radiation, radiation, and the presence of space debris [21,22,23]. A fiber-reinforced composite exposed to the space environment suffers from changes in strength, interface delamination, surface cracking, weak fractures, molecular chain breakage, and other types of damage [24,25,26,27,28,29,30,31].
Thus, the best way to predict the performance of fiberglass composites includes primarily providing them with long-term strength during their use. Multiple methods have been proposed for predicting the condition of composites, such as ultrasonic detection, radiographic inspection, sound emission observation, strain gauge testing, and optical fiber installation [32,33,34,35,36,37,38,39,40]. Although ultrasonic and radiographic inspection methods appear to be mature and often used, they can only be used for offline testing. The frequent collapse of the interface between piezoelectric sensors and composites during acoustic emission testing makes noise during the propagation of elastic waves in materials. Strain gauges are freestanding and integrated into composite materials, but their electrical signals are susceptible to electromagnetic interference. In contrast, fiber Bragg grating (FBG) sensors have attracted impressive research interest in damage detection due to their embeddability, electromagnetic interference immunity, and encoded wavelength data. Previous studies have documented the adaptability of the integrated FBG sensor for dynamic stress prediction, thermal cycle reading, and thermal strain measurement. However, harsh environmental conditions may also impact the monitoring method itself. When FBG sensors are adapted to radiation-sensing environments, it has been discovered that high-energy ionizing radiation can cause signal deflection and transmission loss in the FBG, which can lead to errors in temperature or strain measurements. Based on this, relevant studies have focused on increasing the radiation resistance of FBGs, mainly through the modulation of fiber composition, grating inscription methods, and pre-treatment methods to mitigate the effects of radiation on FBGs. However, it is still unknown whether FBG sensors are designed for monitoring materials in radiative environments.
The FBG sensor is an optical fiber with a uniformly distributed grating. The grating is inscribed into the fiber core through exposure to ultraviolet light or a femtosecond laser. The refractive index of an optical fiber is periodically modified over a certain length. It is noteworthy that FBG is an unrivaled bandpass filter, which can reflect a small spectrum of incident light and simultaneously transmit another region. Sensitivity coefficients to strain and temperature are associated with fiber and lattice parameters. The wavelength shift is linearly proportional to the change in temperature and strain, which ensures the possibility of composition and temperature prediction by FBG.
For a reliable monitoring and sensing strategy in radiation environments, FBG sensors that are resistant to radiation must be carefully selected. It is currently believed that FBGs deposited on purified silica or doped fibers have low radiation sensitivity, resulting in less emission loss and wavelength shift than FBGs deposited on standard Ge-doped fibers. Additionally, FBGs fabricated using femtosecond laser technology in recent years, compared to the traditional UV laser inscription method, exhibit better stability at high temperatures and improved reliability against radiation-induced wavelength shift. The radiation reliability and commercialization of various types of FBG sensors have been comprehensively reviewed [41].
This paper presents a new conceptual design of a sensor system for force and temperature measurement, integrating FBG embedded in composite materials. The main novelty of the study lies in combining FBG with composite materials for simultaneous strain and temperature sensing. The proposed mathematical model can accurately estimate strain and temperature based on the signals obtained from the FBG, providing high accuracy and reliability of the measurements. The development and integration of FBG into composite materials enable high accuracy and reliability of strain and temperature measurements under various conditions. This is especially important for mission-critical applications such as aerospace, where data accuracy and reliability are key. The development and validation of a mathematical model for strain and temperature estimation based on signals from FBG represent a significant step forward in sensor technology. This model can accurately predict sensor behavior under different conditions, greatly improving monitoring and diagnostic capabilities.

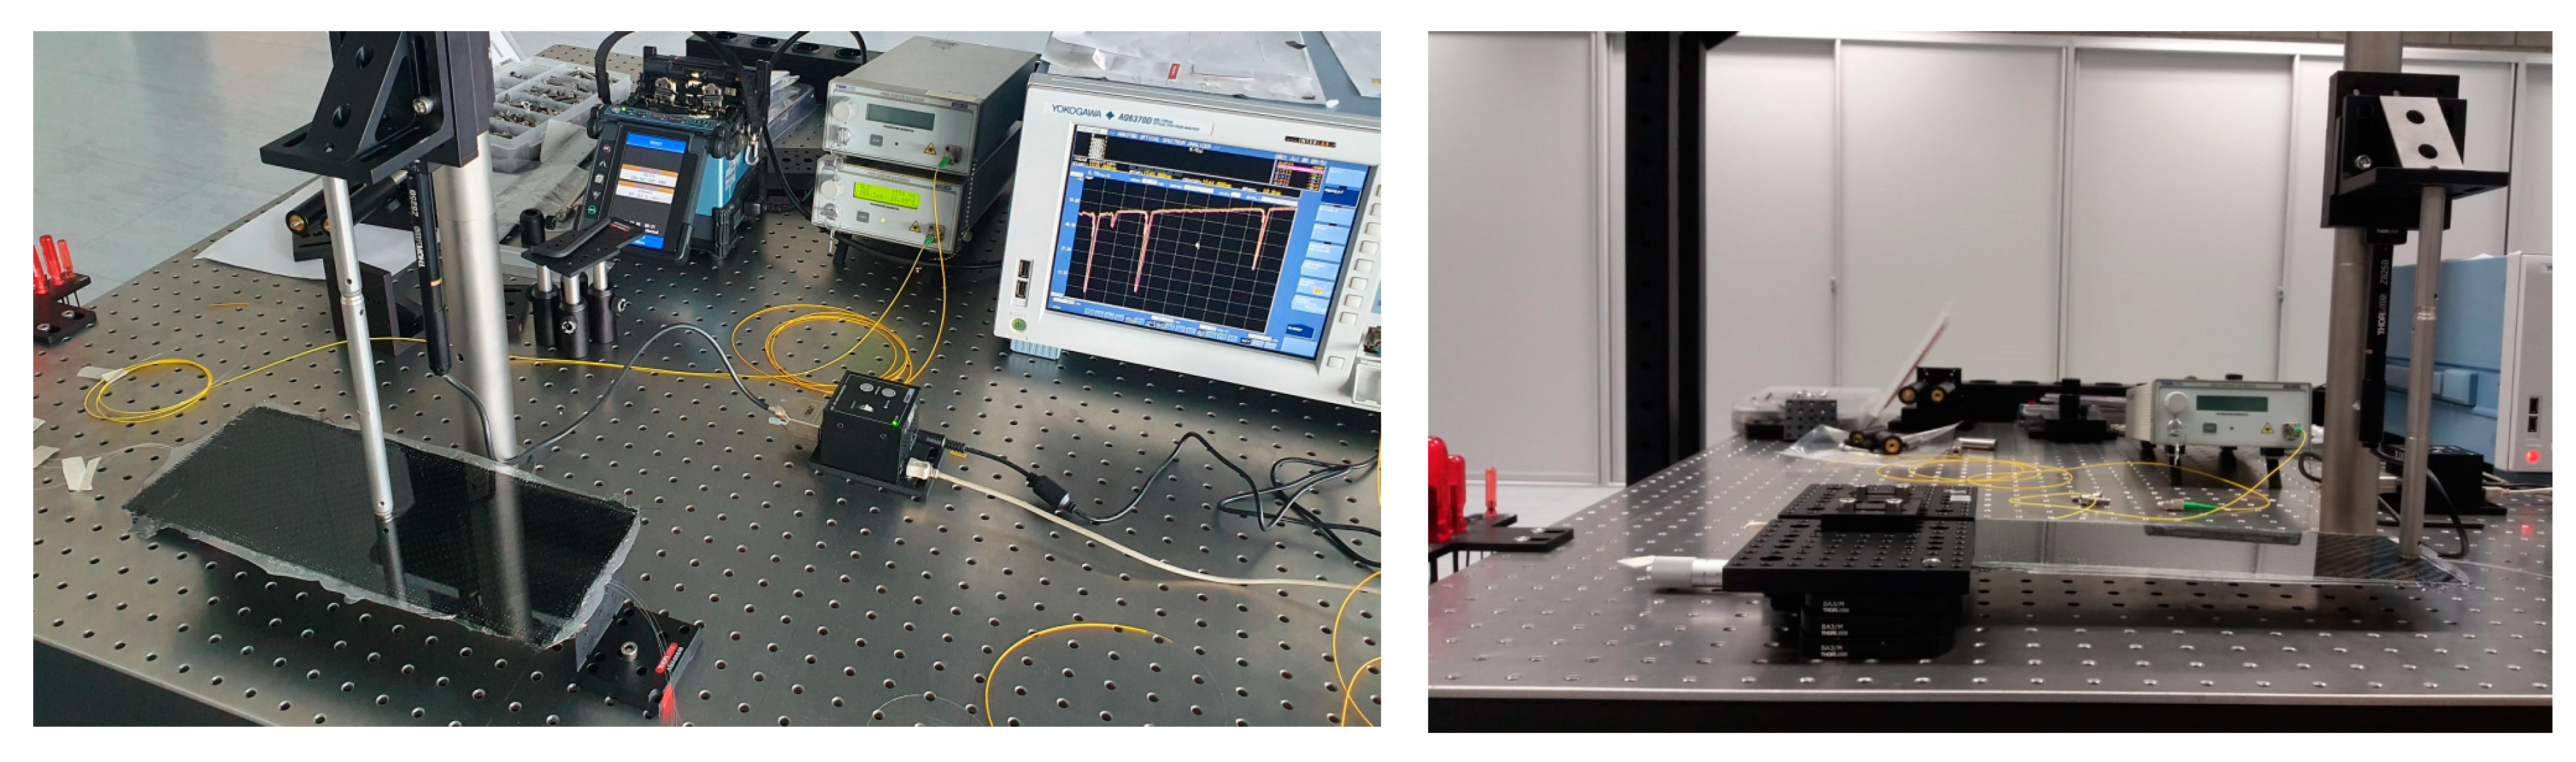
2. Materials and Methods

2.1. Sensor Diagram

Practical solutions for force measurement use optical Bragg gratings embedded in composite materials. A system in which Bragg gratings are mounted in a composite material in an arc shape is shown in Figure 1.
The sensor consists of two Bragg gratings integrated into a composite material, forming the shape of an arc. When a lateral force FFF is applied to the sensor, its bending causes the grating located below the neutral layer to stretch, while the grating above the neutral layer shortens. The solution shown in Figure 1 leverages the fact that the two resonant wavelengths of the gratings shift independently as the lateral force changes, while simultaneously shifting due to changes in ambient temperature [42].
In this work, we consider the simultaneous measurement of force and temperature using fiber-optic sensors with Bragg gratings. The dependencies mentioned are linear. The use of these elements enhances the sensitivity of measurements of specific physical quantities, makes the measurements temperature-insensitive, and increases the linear resolution.
It is also possible to establish the dependence (preferably linear) of the grating’s spectral width on the force causing the grating strain. FBG-based force and temperature sensors are currently being investigated, with gratings mounted to allow inhomogeneous strain under a transverse force. When installing Bragg gratings in composite materials, it is assumed that the dimensions of the optical fiber are significantly smaller compared to the sensor module, so its effect on sensor strain is negligible. Experimental studies were conducted in the Laboratory of Optoelectronics and Laser Technologies at the Lublin University of Technology (see Figure 2).
Due to the specific nature of the measured quantities, the results of an analysis of mechanical conditions and groups of sensor systems currently being developed for the simultaneous measurement of force and temperature are presented.
The method of determining the measured values (forces and temperatures) can also be used in variable temperature conditions. The chirp caused by the transfer of the measured force to the lattice strain can then be described by an appropriate mathematical function. Figure 3 shows a schematic view of a device for measuring force and temperature using a Bragg grating mounted on a special holder that transmits the applied force to a linear or quadratic chirp, described by a specially designed function.
The measurement setup shown in Figure 3 uses a specially designed holder on which the FBG is mounted. In this case, the rectangular holder has length L, thickness g, and width s. The two ends A and B are free, and the middle part of the holder is fixed. A Bragg grating of length L and Bragg wavelength λB is installed on the surface of the middle part of the holder. The grating is installed so that the lengths of the fixed parts of the grating and the holder are the same. In this case, they are designated as zu. Thus, the holder is divided into two parts of length L1zu/2 and L2−zu/2. The parts are intentionally designated by different indices because L1 ≠ L2. From the analysis of Figure 3, it also follows that L = L1 + L2. In such sensors, two parts of the beam are subjected to opposing forces FA and FB. This design of the sensor leads to a shift in the spectrum towards longer wavelengths of the part of the grating that is being stretched—the right side of the holder in Figure 3. At the same time, there is a shift in the spectrum towards shorter wavelengths of the part of the FBG that is being compressed—located on the left side holder. In the area where the holder and grille are fixed, i.e.,  zu/2 < z < zu/2, the strain value is theoretically zero. However, assuming that the holder is elastic and that the region zu is very small, the FBG strain distribution within z does not change dramatically. We assume that this is a quasi-homogeneous change in the gradient from the minimum value ( zu/2 < z < zu/2) to the maximum (|z| = zu/2). Thus, a uniform Bragg grating is subject to chirp caused by strain of the holder. The closer to the stationary part, the greater the FBG strain value. The holder on which the grille is fixed is symmetrical, so the FBG has a certain strip width. However, the grating spectrum does not consist of a single Bragg resonance, but of many resonance peaks.

2.2. Theory

The solution presented in Figure 2 leverages the fact that the two resonant wavelengths of the gratings shift independently with changes in lateral force and shift simultaneously with changes in ambient temperature [42]. The corresponding dependencies are linear. In sensors for measuring force and temperature, a Bragg grating (or several solutions, such as two placements in different locations) [43] is also installed on special supports. Their shape and design transmit the lateral force to the strain support of the attached mesh [44,45]. When embedding Bragg gratings in composite materials, it is assumed that the optical fiber dimensions are much smaller compared to the sensor module, making its effect on sensor strain negligible. A change in the lateral force F and the associated change in strain Δε will result in changes in the Bragg wavelength, denoted as 〖∆λ〗_B^ε.
λ B ε = K ε Δ ε ,
where  K ε  is the sensitivity of the Bragg wavelength shift under the strain. At the same time, changing the temperature ΔT of the environment will also lead to a change in the Bragg wavelength of each of the gratings, which in turn is denoted as  λ B T .
λ B T = K T Δ T ,
where  K T  is the sensitivity of the Bragg wavelength shift at the given temperature.
The total change  Δ λ B  in Bragg wavelength of each grating can be expressed as:
Δ λ B = K ε Δ ε + K T Δ T .
Since the described design is intended for the simultaneous measurement of force and temperature, the dependence of the wavelength of both gratings on the applied lateral force has been determined. According to Hooke’s law, the strain ε_z along the z-axis shown in Figure 1 can be described as
ε z = σ z E ,
where E is the Young’s modulus of the material used in the composite. The stress σ_z along the z-axis is related to the bending moment M that occurs when a force F is applied, the distance y from the Bragg grating to the neutral layer, and the moment of inertia I, according to the following relationship:
σ z = M y I
and
I = s g 3 12 ,
where s is the width of the composite,  g  is its thickness, and the bending moment is equal to:
M = F z 2
To simplify calculations and due to the symmetry of the design, only the left half of the sensor can be considered, so the z variable can be limited to the range 0 ≤ z ≤ L/2. Consequently, the sensor experiences maximum strain along the z-axis in the central part, where z = L/2. Considering the relations in Equations (5)–(7),  ε z  can be described by the following equation:
ε z = y z 2 I E × F ( 0 z L 2 ) .
The strain in the central part of the sensor, at the location where the Bragg grating is attached, is given by the following relationship:
ε z ( z = L 2 ) = L y 4 I E × F ,
Therefore, the result of Equation (6) takes the form
ε z ( z = L 2 ) = 3 L y s g 3 E × F .
The product  K ε Δ ε  from Equation (3) is represented as:
K ε Δ ε = 3 L y s g 3 E × Δ F
Here, the sensitivity of the array to changes in force,  K F , is described by the following equation:
K F = 3 L y s g 3 E
For a sensor designed to measure force and temperature simultaneously in the configuration shown in Figure 2, this is expressed as follows:
Δ λ B 1 Δ λ B 2 = K T 1 K F 1 K T 2 K F 2 × Δ T Δ F ,
where  K T 1  and  K F 1  are the sensitivities of the Bragg wavelength shift  Δ λ B 1  of the corresponding Bragg grating, denoted as FBG1, respectively, to changes in temperature ΔT and force ΔF, and  K T 2  and  K F 2  are the sensitivities of the Bragg wavelength shift  Δ λ B 2  of the Bragg grating, denoted as FBG2, also to a change in temperature ΔT and force ΔF, respectively. The force sensitivity of the gratings, according to Equation (12), can be easily controlled by changing the width and thickness of the composite in which the grating is installed. Equation (13) allows us to write down the changes in wavelength FBG1 and FBG2 in the following form:
Δ λ B 1 = K T 1 Δ T + K F 1 Δ F
and
Δ λ B 2 = K T 2 Δ T + K F 2 Δ F .
Figure 3 shows the arrangement of two FBGs in the laminate. Based on the analyses performed, we can conclude that the sensitivity coefficients to the applied force of both gratings in the system shown in Figure 4 satisfy the following equality:
K F 1 = K F 2 .
The temperature sensitivity coefficients of FBG1 and FBG2 are given by:
K T 1 = K T 2
if the gratings have approximately the same Bragg wavelength and are made from the same optical fiber using the same phase mask. Simultaneous measurement of temperature change ΔT and force change ΔF in the presented system can be achieved based on Equations (16) and (17), by adding or subtracting the Bragg wavelengths of both gratings using the following dependencies:
Δ λ B 1 + Δ λ B 2 = 2 K T 1 Δ T
and
Δ λ B 1 Δ λ B 2 = 2 K F 1 Δ F .
This allows temperature and force to be measured simultaneously by detecting the wavelengths FBG1 and FBG2, since the following equation holds:
Δ F = Δ λ B 1 Δ λ B 2 2 K F 1
and at the same time, the following equation is executed:
Δ T = Δ λ B 1 + Δ λ B 2 2 K T 1 .
In the case when Bragg gratings, which are elements of a force and temperature sensor, are installed in composite materials, the curing process of the entire sensor that contains the composite along with the gratings is crucial. The type of composite material, as well as its structure and shape, plays a significant role in enhancing sensitivity to lateral force.
Below is a method for deriving matrix equations for force sensors operating in the system shown in Figure 4. It is assumed that for a system with a linearly chirped homogeneous grating, the forces applied to the free ends are equal in magnitude:
F 1 = F 2 = F .
Information about changes in temperature and force is contained in the sum and difference of wavelengths between two parts of the grating: stretched—marked on the right in Figure 4, and compressed—marked on the left in Figure 3. We denote the sum of changes in wavelengths of both parts of the gratings as:
Δ λ 1 + 2 = Δ λ B 1 + Δ λ B 2
and their difference, respectively, as:
Δ λ 1 2 = Δ λ B 1 Δ λ B 2 .
The matrix equation of such a designed sensor for simultaneous measurement of temperature and force will take the following form:
| Δ λ 1 2 | Δ λ 1 + 2 = K F 1 K T 1 K F 2 K T 2 × F Δ T ,
where  K F 1  and  K T 1  are the sensitivity coefficients of the absolute difference in wavelengths   Δ λ 1 2 , respectively, to force and temperature change, and  K F 2  and  K T 2  denote the sensitivity of the sum of the wavelengths of both parts of the grating   Δ λ 1 + 2 , respectively, to force and temperature change.
Equation (23) describes the dependence of the change in wavelength on the quantities under consideration (force and temperature). This relationship can be proved using analytical relations, considering the principles of mechanics. The equation describing the dependence of the change in the Bragg wavelength of the first part of the grating on the applied force Δλ_1 = f (F_1) is:
Δ λ 1 ( F ) = 6 ( 1 p e ) ( L 1 z u 2 ) E s g 2 × F 1 × λ B ,
where  p e  is the photo-elastic constant and  λ B  is the wavelength used for the Bragg grating (the nominal one for which the grating was designed and tuned). A similar equation,  Δ λ 2  = f ( F 2 ), can be written for the second part of the grating.
Δ λ 2 ( F ) = 6 ( 1 p e ) ( L 2 z u 2 ) E s g 2 × F 2 × λ B ,
The wavelength value for both parts of the grating also changes due to temperature changes, as reflected in the coefficient of thermal expansion of the stand on which the Bragg grating is installed, according to the following equation:
Δ λ 1 ( Δ T ) = Δ λ 2 ( Δ T ) = α Λ + α n + ( 1 p e ) ( α w ) × Δ T × λ B ,
where α_w is the coefficient of thermal expansion of the rack, α_n is the coefficient of thermal expansion of the holder, and α_s is the coefficient of thermal expansion of the stand on which the Bragg grating is installed, depending on the material of the stand.
Analyzing Equation (26), it can be noted that the difference in the change in wavelength for both parts of the grating will be zero, which contributes to a better matrix condition due to the zeroing of one of the sensitivity coefficients in the sensor-processing matrix. To prove this statement, the equations describing the dependence of wavelength shifts on the measured values are written as follows:
  • where  α w  is the coefficient of thermal expansion of the rack,  α n  is the coefficient of thermal expansion of the holder, and  α w  is the coefficient of thermal expansion of the stand on which the Bragg grating is installed, depending on the material of the stand.
Analyzing this Equation (26), it can be noted that the difference in the change in wavelength for both parts of the array will be zero, which contributes to a better matrix condition due to the zeroing of one of the sensitivity coefficients in the sensor-processing matrix. To prove this statement, the equations describing the dependence of wavelength shifts on the measured values are written as follows:
Δ λ 1 ( F , Δ T ) = 6 ( 1 p e ) ( L 1 z u 2 ) E s g 2 × F 1 + α Λ + α n + ( 1 p e ) ( α w α Λ ) Δ T λ B
Δ λ 2 ( F , Δ T ) = 6 ( 1 p e ) ( L 1 z u 2 ) E s g 2 × F 2 + α Λ + α n + ( 1 p e ) ( α w α Λ ) Δ T λ B
Thus, the processing equations will take the following form:
Δ λ 1 + 2 F , Δ T = 6 1 p e L 1 + L 2 z u λ B E s g 2 F + 2 λ B α Λ + α n + 1 p e α w α Λ Δ T
Δ λ 1 2 ( F , Δ T ) = 6 ( 1 p e ) ( L 1 L 2 z u ) λ B E s g 2 F
Based on Equation (23), the values of the individual sensitivity coefficients can be determined because the following equations occur:
Δ λ 1 2 ( F , Δ T ) = K F 1 F + K T 1 Δ T
Δ λ 1 + 2 ( F , Δ T ) = K F 2 F + K T 2 Δ T
Analyzing Equations (31) and (32) and the derived processing Equations (29) and (30), it can be seen that one of the sensitivity coefficients (K_T1) is zero. The matrix Equation (23) can be inverted. Given that K_T1 = 0, it will take the form:
F Δ T = D 1 K T 2   0 K F 2 K F 1 × | Δ λ 1 2 | Δ λ 1 + 2
where, in this case, the determinant of the matrix is equal to:
D = K F 1 K T 2
and the following inequality holds:
K F 1 / K F 2 K T 1 / K T 2 .
It should be noted that the sensor is capable of measuring both the applied force and the change in temperature simultaneously. In the case under consideration, the lattice parameters are the Bragg wavelength (λ_B) and the width of the grating reflection spectrum, designated as ΔFWHM.
The equation describing the dependence of the Bragg wavelength of the sensor on the applied force and temperature change λB = f(F, ΔT) will take the form:
λ B F , Δ T = 32 1 p e 2 n e f f Λ z ( 1 + z / L ) 3 E π d 3 × F + α Λ + α n + ( 1 p e ) ( α w α Λ ) 2 n e f f Λ × Δ T ,
where  n e f f  is the effective refractive index of the fiber on which the Bragg grating is applied, and Λ is its period.
A similar equation ΔFWHM = f (F, ΔT) can be written as follows:
Δ F W H M F , Δ T = 64 n e f f Λ 1 p e E π d 3 × z 2 ( 1 + z 2 / L ) 3 z 1 ( 1 + z 1 / L ) 3 × F
In this case, Equation (23) will take the form:
Δ F W H M λ B = K F 1 K T 1 K F 2 K T 2 × F Δ T .
Based on Equation (38), it is possible to calculate the values of each of the sensitivity coefficients, since the following equalities are satisfied:
Δ F W H M F , Δ T = K F 1 F + K T 1 Δ T
and
λ B ( F , Δ T ) = K F 2 F + K T 2 Δ T .
Again, analyzing Equations (39) and (40) and processing Equations (36) and (37), it can be seen that one of the sensitivity coefficients (KT1) takes on a zero value. The matrix Equation (38) can be inverted. In this situation, in view of the fulfillment of the equality KT1 = 0, Equation (33) can be rewritten by
F Δ T = D 1 K T 2   0 K F 2 K F 1 × Δ F W H M λ B ,
In addition, analyzing Equation (37), one can notice that the width of the spectral characteristic depends linearly on the applied force and does not depend on temperature changes.
In theoretical studies for the steel, the temperature sensitivity of FBG1  K T 1  = 9.45 pm/°C, FBG2  K T 2  = 14.34 pm/°C.
Δ F W H M λ B = 2,6 × 10 3 9.45 1,2 × 10 3   14.34 × F Δ T
In addition, the sensitivity coefficient  K F  is equal to:
K F = F W H M F
From here, we can find
F Δ T = 1 16,8 × 10 3 14.34 0 1,2 × 10 3 2,6 × 10 3 × Δ F W H M λ B
Table 1 shows the parameters used in this work.
Advantages of FBG: The advantages of fiber Bragg gratings (FBGs) are as follows: high signal-to-noise ratio; high sensitivity to deformations (less than 0.5 × 10⁻⁶); the possibility of interrogation along a single fiber; multiplexing in multiple fiber-optic networks (FON); and triaxle deformation sensitivity. The deformation sensitivity of the Bragg wavelength arises from the change in the period of the fiber grating during deformation, which leads to a change in the refractive index. This phenomenon is known as the strain-optic effect [46]. When strain is applied to the grating, the Bragg reflected wavelength changes [47]. The wavelength shift Δλε for the elongation value ΔL is determined by the expression [48]:
Δ λ ε = λ B ( 1 Λ Λ L + 1 n 0 n 0 L ) Δ L
where Δλε is the wavelength shift and λB is the Bragg reflected wavelength.
In practice, the applied strain can be estimated by measuring the reflected wavelength shift caused by deformation. The typical strain sensitivity of FBGs at a wavelength of 1550 nm is ~1.2 pm/µε.
The Bragg wavelength shift can also occur due to temperature changes. For a temperature change ∆T, the corresponding wavelength shift ∆λT is determined by the expression [49]:
Δ λ T = λ B ( 1 Λ Λ T + 1 n 0 n 0 T ) Δ T
Temperature sensitivity of the Bragg wavelength arises from changes in lattice pitch associated with thermal expansion of the fiber and changes in the refractive index resulting from the thermo-optical effect. Thus, Equation (46) can also be written as [47,48]:
Δ λ T = ( α 0 + β 0 ) λ Б · Δ T
where α0 is the coefficient of thermal expansion (CTE) of the fiber, and β0 is the change in the refractive index of the fiber with temperature. The values of α0 and β0 are constants for silica fiber-optical radiation and are 0.55 × 10⁻⁶/°C and 6.6 × 10⁻⁶/°C, respectively [49]. The typical temperature sensitivity of FBG at a wavelength of 1550 nm is ~11.6 pm/°C.
FBGs are commonly used for measuring axial strain as well as temperature. This is because the sensitivity to axial strain is actually higher since the change in the FBG period is directly proportional to the applied longitudinal strain.

3. Results

This work focuses on measuring temperature and strain simultaneously. The proposed methods involve simultaneous relative methods and forces acting in two directions, uneven stresses, and their distribution, including theoretical preconditions for developing specific methodological solutions.
In this study, integrated composite materials are used. Each type of bracket, made of a different material (steel, PMMA, and glass), has unique mechanical, thermal conductive, and optical properties. Studying different brackets allows us to evaluate how these differences in material properties can affect the behavior of the sensor system under different operating conditions. Thus, studying three types of brackets in this study aims to provide insight into how different materials affect the performance of integrated sensors and help select the best option for specific applications.
When a vertical force is applied to the measurement section, as shown in Figure 3, the grid experiences inhomogeneous deformation, resulting in inhomogeneous deformation. Figure 5 shows the axial strain shape of the grid corresponding to different values of the applied force. The graphs indicate the location where the Bragg grating is mounted. Using Equations (20)–(26) and data in Table 1, the calculations are given by applied force values F = 10 N, F = 10.5 N, F = 11 N.
Where the mesh is located, the shape of the strain gradient distribution is quadratic, with the maximum value in the center of the mesh and the strain value symmetrically decreasing as we move away from the central part of the FBG.
At the grating position, the shape of the gradient strain distribution is a quadratic function forming a parabola and has a maximum value in the center of the bracket; the strain value decreases symmetrically as it moves away from the center part of the FBG.
The maximum strains of the steel, PMMA, and glass brackets are 1430, 1535, and 1345 με, respectively.
Figure 6a–c shows the graphs of axial deformation at the location of the Bragg gratings for different materials. According to them, it can be assumed that for given values of force (10–11 N), the change in deformation is linear. Also important from the point of view of the amount of strain is the material from which the bracket in Figure 7(a1–a3) is made. The characteristics shown here were obtained for three different materials with different Young’s modulus values. The materials considered were steel (Young’s modulus around 200 GPa—red line in Figure 7(a1–a3)), glass (Young’s modulus about 73.5 GPa—blue line in Figure 7(c1–c3)), and PMMA—polymathic methacrylate (Young’s modulus about 3 GPa—green line in Figure 7(b1–b3)). Figure 6 shows the strain characteristics for different values of the cantilever length. Note that it is possible to choose a length such that the direction of strain varies. In this way, it is possible to cause an increase or decrease in the strain values along the z-axis.
Examples of processing characteristics for force and temperature measurements using an optical Bragg grating, in which linear chirp is induced by its placement on a special support, are presented in Figure 8 and Figure 9.
Figure 8 shows examples of the difference and sum characteristics of the Bragg wavelength variation in a sensor with a linear chirp at constant temperature under varying force conditions. Analogous results for wavelength and bandwidth measurements as a function of temperature for a system using a Bragg grating with a quadratic chirp function are shown in Equations (3) and (4).
As shown in Figure 9, the change in grating spectral width with temperature is negligible compared to the difference in Bragg wavelength caused by temperature changes. Based on the slope of the characteristics from Figure 6 and Figure 7, it is possible to determine the values of all sensitivity coefficients of the characteristic parameters of the gratings (for example, Bragg wavelength, grating spectral width) for force and temperature, and it is possible to determine the discussed quantities from indirect measurements of the Bragg grating parameters. According to the theoretical results of the work, the new model has improved sensitivity compared to the existing model.
As can be seen in Figure 8 and Figure 9, Bragg gratings with linearly decreasing slope transmission characteristics can be successfully used to measure temperature and strain in composite structures. Fiber-optic interferometric sensors, in addition to all the advantages that other fiber-optic sensors have, are characterized by very high sensitivity, unattainable for other types of sensors. The extremely high sensitivity of these sensors is due to their mode of operation based on light interference. Their all-fiber-optic design means that light passes through an enclosed optical fiber. The above advantages have brought about wide interest in these sensors, both from manufacturers and from users of measuring instruments.
It would be reasonable to expect widespread use of these sensors in industrial measurements. However, progress in their distribution is very slow. There are several reasons for this, the main ones being high sensitivity to influencing quantities (including temperature), non-linear processing characteristics, and complex detection systems.
Currently, interferometric sensors of many physical quantities, such as temperature, pressure, linear displacement, deformation, and refractive index of solutions, as well as single- and multichannel measuring instruments with various dynamic properties interacting with them, are commercially available. In variable-period gratings, the Bragg wavelength is a linear function of position along the grating axis, so different wavelengths contained in the input light pulse are reflected at different locations in the grating, which corresponds to different mutual delay times.
The characteristics of the transformation of the control element deformation change into the shift of the central wavelength of each Bragg sensor are linear. This confirms that the embedding of the fiber-optic sensor using epoxy resin ensures accurate transfer of the element elongation to the sensor elongation itself.
The experimental studies were carried out in a measuring system, the light source for the periodic sensors was a THORLABS S5FC1550S–A2 SLED diode, and the spectra were measured using a YOKOGAWA AQ6370D optical spectrum analyzer. Three fibers were embedded in the test plate structure, with three FBGs recorded in each fiber. Measuring the spectra of the gratings placed on successive fibers required connecting the successive fibers to the light source and the analyzer. Figure 10 below shows the transmission spectra measured for each fiber: (a) fiber 1 (top layer); (b) fiber 2 (middle layer); (c) fiber 3 (bottom layer).
The sensitivity of the central Bragg wavelength changes to the relative elongation changes in the fiber with the grating, determined from the experiments, allows us to determine the relative elongation of the grating and, consequently, the elongation of the plate along this section. The sensitivity was determined at the level of 1.188 pm/µε. Based on this, the average value of the relative elongation of the plate section along the length of the FBG grating (10 mm) was determined Figure 11.
When comparing the results of this study with the results of previous studies, it can be said that, moreover, systems have been developed in which Bragg modes with chirps intentionally caused during measurement by non-uniform strain are being developed [49,50], and force and temperature sensors are also being investigated based on FBGs, in which the meshes are installed in such a way as to ensure their uneven strain as a result of the appearance of shear force [51].

4. Discussion

The discrepancy in the results for the glass bracket compared to other materials is predominantly attributed to the material’s intrinsic mechanical properties, most notably its Young’s modulus. The Young’s modulus of a material is a measure of its stiffness and is a fundamental factor in determining how it will deform under stress. Glass typically has a higher Young’s modulus than many polymers, including polymethyl methacrylate (PMMA), which means it deforms less under the same applied force.
During the application of force, as outlined in Figure 2 of the provided documentation, inhomogeneous strain occurs in the Bragg grating. This strain affects the grating’s reflected wavelength due to the strain experienced by the grating’s fibers. Given that the glass bracket has a different Young’s modulus (approximately 73.5 GPa, as per the context provided), the strain gradient distribution across it would naturally differ from that of brackets made of other materials, such as steel or PMMA. In Figure 4 and Figure 5, the graphs exhibit a linear change in strain for forces ranging between 10 and 11 N, which is expected behavior under elastic strain.
Furthermore, it is crucial to consider the implications of the composite structure in which the FBG sensors are embedded. The composite matrix’s behavior, including its response to temperature changes and external influences, can also affect the measurement and performance of the sensor system. In particular, the response of the composite material to environmental factors and its subsequent impact on the embedded FBG sensors are critical to the sensors’ ability to measure force and temperature accurately. It is plausible that the distinct axial strain of the glass bracket under the same applied forces may be the combined result of the glass’s high modulus of elasticity and its interaction within the composite structure.
In addition to the material properties, the design of the FBG sensor system—namely, the symmetry of the holder and the mounting location of the Bragg grating—can influence the spectral width and wavelength shift, further affecting the strain measurement. As such, the resulting graphs indicate that the developed system exhibits improved sensitivity and the ability to withstand external and temperature-induced influences, as observed in the theoretical findings.
The observed difference in the strain characteristics of the glass bracket, therefore, underscores the importance of material selection in designing FBG sensor systems for specific applications, especially when considering the composite materials’ mechanical properties and the operational environment.
In summary, the disparity in the strain behavior of the glass bracket is a multifactorial outcome, determined by the material’s Young’s modulus, the structural design of the FBG sensor system, and the composite material’s response to force and temperature. Further research should consider these aspects to optimize the sensor system for diverse materials and applications.

5. Conclusions

In this paper, a new conceptual framework is developed for a system with fiber-optic Bragg lattice sensors for strength and temperature measurement embedded in composite materials. This study shows that the width of the spectral characteristic linearly depends on the applied force and does not depend on temperature changes, and also calculates sensitivity coefficients and strain characteristics for different values of the length of the holder. When calculating strain, attention should be given to the possibility of choosing a length that could alter the direction of strain. Thus, it is possible to create increasing or decreasing strain values along the z-axis. The characteristics of the change in the difference and sum of Bragg wavelengths for a fiber-optic sensor with a linear chirp signal at a constant temperature, under varying forces for different values of applied axial deforming forces along a truncated cone-shaped holder at different lengths, are analyzed. Temperature changes have a more significant effect on the Bragg wavelength than on the width of the lattice spectrum. This is because temperature variations lead to changes in the optical refractive index of the fiber, which in turn causes changes in the Bragg wavelength. Future research will focus on using three, four, and five sensors, as well as developing a simulation model for monitoring engineering structures with these sensors.

6. Patents

Patent for utility model “Cable temperature measurement system with a fiber Bragg grating”/Kalizhanova A.U., Kunelbaev M., Kozbakova A.Kh. No. 8209, Reg. application number 2023/0373.2, dated 4 July 2023.

Author Contributions

Conceptualization, A.K. (Aliya Kalizhanova), A.K. (Ainur Kozbakova) and M.K.; software, Z.A., A.U. and U.I.; validation, A.K. (Aliya Kalizhanova), A.K. (Ainur Kozbakova) and M.K.; investigation, U.I.; resources Z.A., A.U. and U.I.; data curation, A.K. (Aliya Kalizhanova), A.K. (Ainur Kozbakova) and M.K.; supervision, A.K. (Aliya Kalizhanova) and A.K. (Ainur Kozbakova); project administration, A.K. (Aliya Kalizhanova). All authors have read and agreed to the published version of the manuscript.

Funding

The work was supported by a grant and funding from the Ministry of Science and Higher Education of the Republic of Kazakhstan within the framework of the Project № AP19679153, Institute Information and Computational Technologies CS MSHE RK.

Data Availability Statement

The original contributions presented in the study are included in the article, further inquiries can be directed to the corresponding author.

Conflicts of Interest

The authors declare no conflicts of interest.

References

  1. Xian, G.; Guo, R.; Li, C. Combined effects of sustained bending loading, water immersion and fiber hybrid mode on the mechanical properties of carbon/glass fiber reinforced polymer composite. Compos. Struct. 2022, 281, 115060. [Google Scholar] [CrossRef]
  2. Das, T.K.; Ghosh, P.; Das, N.C. Preparation, development, outcomes, and application versatility of carbon fiber-based polymer composites: A review. Adv. Compos. Hybrid Mater. 2019, 2, 214–233. [Google Scholar] [CrossRef]
  3. Chung, D.D.L. Processing-structure-property relationships of continuous carbon fiber polymer-matrix composites. Mater. Sci. Eng. R Rep. 2017, 113, 1–29. [Google Scholar] [CrossRef]
  4. Akman, F.; Ogul, H.; Ozkan, I.; Kaçal, M.R.; Agar, O.; Polat, H.; Dilsiz, K. Study on gamma radiation attenuation and non-ionizing shielding effectiveness of niobium-reinforced novel polymer composite. Nucl. Eng. Technol. 2022, 54, 283–292. [Google Scholar] [CrossRef]
  5. Ramadan, W.; Sakr, K.; Sayed, M.; Maziad, N.; El-Faramawy, N. Investigation of acrylic/boric acid composite gel for neutron attenuation. Nucl. Eng. Technol. 2020, 52, 2607–2612. [Google Scholar] [CrossRef]
  6. Berthelot, J.M. Composite Materials: Mechanical Behavior and Structural Analysis; Springer: New York, NY, USA, 1999. [Google Scholar]
  7. Gay, D.; Hoa, S.V.; Tsai, S.W. Composite Materials: Design and Applications; CRC Press: Boca Raton, FL, USA, 2002. [Google Scholar]
  8. Othonos, A.; Kalli, K. Fiber Bragg Gratings: Fundamentals and Applications in Telecommunications and Sensing; Artech House: New York, NY, USA, 1999. [Google Scholar]
  9. Kersey, A.; Davis, M.A.; Patrick, H.J.; Leblanc, M. Fiber grating sensors. J. Light. Technol. 1997, 15, 1442–1463. [Google Scholar] [CrossRef]
  10. Luyckx, G.; Voet, E.; Lammens, N.; Degrieck, J. Strain measurements of composite laminates with embedded fibre Bragg gratings: Criticism and opportunities for research. Sensors 2011, 11, 384–408. [Google Scholar] [CrossRef] [PubMed]
  11. Luyckx, G.; Kinet, D.; Lammens, N.; Chah, K.; Caucheteur, C.; Mégret, P.; Degrieck, J. Temperature-insensitive cure cycle monitoring of cross-ply composite laminates using the polarization dependent loss property of FBG. In Proceedings of the 15th European Conference on Composite Materials, Venice, Italy, 24–28 June 2012. [Google Scholar]
  12. Kinet, D.; Garray, D.; Wuilpart, M.; Dortu, F.; Dusermont, X.; Giannone, D.; Mégret, P. Behaviour of optical fibre Bragg grating sensors embedded into composite material under flexion. In Proceedings of the 14th European Conference on Composite Materials, Budapest, Hungary, 7–10 June 2010; pp. 289–292. [Google Scholar]
  13. Peairs, D.M.; Sterner, L.; Flanagan, K.; Kochergin, V. Fiber optic monitoring of structural composites using optical backscatter reflectometry. In Proceedings of the 41st International SAMPE Technical Conference, Wichita, KS, USA, 19–22 October 2009. [Google Scholar]
  14. Beukema, R.P. Embedding technologies of FBG sensors in composites: Technologies, applications and practical use. In Proceedings of the 6th European Workshop on Structural Health Monitoring, Dresden, Germany, 3 July 2012. [Google Scholar]
  15. Qiu, Y.; Wang, Q.-B.; Zhao, H.-T.; Chen, J.-A.; Wang, Y.-Y. Review on composite structural health monitoring based on fiber Bragg grating sensing principle. J. Shanghai Jiaotong Univ. Sci. 2013, 18, 129–139. [Google Scholar] [CrossRef]
  16. Lau, K.-T. Structural health monitoring for smart composites using embedded FBG sensor technology. Mater. Sci. Technol. 2014, 30, 1642–1654. [Google Scholar] [CrossRef]
  17. Takeda, N.; Okabe, Y. Fiber Bragg grating sensors: Recent advancements industrial applications and market exploitation. In Fiber Bragg Grating Sensors in Aeronautics and Astronautics; Bentham Science Publishers: Sharjah, United Arab Emirates, 2011; pp. 171–184. [Google Scholar]
  18. Tosi, D.; Olivero, M.; Perrone, G.; Vallan, A.; Arcudi, L. Simple fiber Bragg grating sensing systems for structural health monitoring. In Proceedings of the 2009 IEEE Workshop on Environmental, Energy, and Structural Monitoring Systems, Crema, Italy, 25 September 2009; pp. 80–86. [Google Scholar]
  19. Leal-Junior, A.G.; Marques, C. Diaphragm-embedded optical fiber sensors: A review and tutorial. IEEE Sens. J. 2021, 21, 12719–12733. [Google Scholar] [CrossRef]
  20. Marques, C.; Leal-Júnior, A.; Kumar, S. Multifunctional integration of optical fibers and nanomaterials for aircraft systems. Materials 2023, 16, 1433. [Google Scholar] [CrossRef] [PubMed]
  21. Jang, J.; Hong, S.; Kim, J.; Goo, N.; Yu, W. Accelerated testing method for predicting long-term properties of carbon fiber-reinforced shape memory polymer composites in a low earth orbit environment. Polymers 2021, 13, 1628. [Google Scholar] [CrossRef] [PubMed]
  22. Wang, L.; Zhang, F.; Liu, Y. γ-rays radiation resistant shape memory cyanate ester resin and its composites with high transition temperature. Smart Mater. Struct. 2019, 28, 075039. [Google Scholar] [CrossRef]
  23. Nishida, M.; Hongo, A.; Hiraiwa, Y.; Higashide, M. Effects of gamma ray irradiation on penetration hole in and fragment size from carbon fiber reinforced composite plates in hypervelocity impacts. Compos. Part B Eng. 2019, 169, 229–238. [Google Scholar] [CrossRef]
  24. Pastore, R.; Delfini, A.; Albano, M.; Vricella, A.; Marchetti, M.; Santoni, F.; Piergentili, F. Outgassing effect in polymeric composites exposed to space environment thermal-vacuum conditions. Acta Astronaut. 2020, 170, 466–471. [Google Scholar] [CrossRef]
  25. Jang, J.H.; Hong, S.B.; Kim, J.; Goo, N.S.; Lee, H.; Yu, W. Long-term properties of carbon fiber-reinforced shape memory epoxy/polymer composites exposed to vacuum and ultraviolet radiation. Smart Mater. Struct. 2019, 28, 115013. [Google Scholar] [CrossRef]
  26. Zheng, L.; Wang, L.; Wang, Z.; Wang, L. Effects of γ-ray irradiation on the fatigue strength, thermal conductivities and thermal stabilities of the glass fibres/ epoxy resins composites. Acta Metall. Sin. (Engl. Lett.) 2018, 31, 105–112. [Google Scholar] [CrossRef]
  27. Sekulic, D.; Stevanovic, M.M. Effects of gamma irradiation and post-irradiation annealing on carbon/epoxy UDC properties deduced by methods of local loading. J. Nucl. Mater. 2011, 412, 190–194. [Google Scholar] [CrossRef]
  28. Wu, Z.X.; Li, J.W.; Huang, C.J.; Huang, R.J.; Li, L.F. Effect of gamma irradiation on the mechanical behavior, thermal properties and structure of epoxy/glassfiber composite. J. Nucl. Mater. 2013, 441, 67–72. [Google Scholar] [CrossRef]
  29. Liu, L.; Feng, L.; Ma, T.; Xu, Z.; Pei, X.; Liu, Y.; Shi, H.; Tang, Y.; Liu, L.; Deng, H.; et al. Mechanical properties, thermal stability and microstructure evolution of carbon fiber-reinforced epoxy composites exposed to high-dose grays. Radiat. Phys. Chem. 2022, 194, 110056. [Google Scholar] [CrossRef]
  30. Li, R.; Gu, Y.; Yang, Z.; Li, M.; Wang, S.; Zhang, Z. Effect of g irradiation on the properties of basalt fiber reinforced epoxy resin matrix composite. J. Nucl. Mater. 2015, 466, 100–107. [Google Scholar] [CrossRef]
  31. Hoffman, E.N.; Skidmore, T.E. Radiation effects on epoxy/carbon-fiber composite. J. Nucl. Mater. 2009, 392, 371–378. [Google Scholar] [CrossRef]
  32. Hassani, S.; Mousavi, M.; Gandomi, A.H. Structural health monitoring in composite structures: A comprehensive review. Sensors 2022, 22, 153. [Google Scholar] [CrossRef] [PubMed]
  33. Goossens, S.; Berghmans, F.; Sharif Khodaei, Z.; Lambinet, F.; Karachalios, E.; Saenz-Castillo, D.; Geernaert, T. Practicalities of BVID detection on aerospacegrade CFRP materials with optical fibre sensors. Compos. Struct. 2021, 259, 113243. [Google Scholar] [CrossRef]
  34. Tuloup, C.; Harizi, W.; Aboura, Z.; Meyer, Y.; Khellil, K.; Lachat, R. On the use of insitu piezoelectric sensors for the manufacturing and structural health monitoring of polymer-matrix composites: A literature review. Compos. Struct. 2019, 215, 127–149. [Google Scholar] [CrossRef]
  35. Wronkowicz, A.; Dragan, K.; Lis, K. Assessment of uncertainty in damage evaluation by ultrasonic testing of composite structures. Compos. Struct. 2018, 203, 71–84. [Google Scholar] [CrossRef]
  36. Sikdar, S.; Liu, D.; Kundu, A. Acoustic emission data based deep learning approach for classification and detection of damage-sources in a composite panel. Compos. Part B Eng. 2022, 228, 109450. [Google Scholar] [CrossRef]
  37. Grassia, L.; Iannone, M.; Califano, A.; D’Amore, A. Strain based method for monitoring the health state of composite structures. Compos. Part B Eng. 2019, 176, 107253. [Google Scholar] [CrossRef]
  38. Ahmed, O.; Wang, X.; Tran, M.; Ismadi, M. Advancements in fiber-reinforced polymer composite materials damage detection methods: Towards achieving energy-efficient SHM systems. Compos. Part B Eng. 2021, 223, 109136. [Google Scholar] [CrossRef]
  39. Rifaie-Graham, O.; Apebende, E.A.; Bast, L.K.; Bruns, N. Self-reporting fiberreinforced composites that mimic the ability of biological materials to sense and report damage. Adv. Mater. 2018, 30, 1705483. [Google Scholar] [CrossRef]
  40. Di Sante, R. Fibre optic sensors for structural health monitoring of aircraft composite structures: Recent advances and applications. Sensors 2015, 15, 18666–18713. [Google Scholar] [CrossRef] [PubMed]
  41. Frieden, J.; Cugnoni, J.; Botsis, J.; Gmür, T.; Coric, D. High-speed internal strain measurements in composite structures under dynamic load using embedded FBG sensors. Compos. Struct. 2010, 92, 1905–1912. [Google Scholar] [CrossRef]
  42. Hao, J.Z.; Ong, L.C.; Gong, Y.D.; Cai, Z.H.; Ng, J.H.; Varghese, P. A Temperature-independent Lateral Force Sensor using a Pair of FBGs. In Proceedings of the 2007 Asia-Pacific Microwave Conference, Bangkok, Thailand, 11–14 December 2007. [Google Scholar] [CrossRef]
  43. Pant, J.; Mitra, A.; Tiwari, U.; Mondal, S.; Singh, N.; Jain, S.; Kapur, P. Temperature Compensated Transverse Load Sensor Based on Dual FBG Sensor. In Proceedings of the 2008 International Conference on Recent Advances in Microwave Theory and Applications, Jaipur, India, 21–24 November 2008; pp. 395–397. [Google Scholar] [CrossRef]
  44. Dong, B.; Zhao, Q.; Zhao, L.; Jin, L.; Miao, Y.; Liao, T.; Zeng, X. Simultaneous measurement of temperature and force based on a special- strain-function-chirped FBG. Sens. Actuators A Phys. 2008, 147, 169–172. [Google Scholar] [CrossRef]
  45. Sorensen, L.; Botsis, J.; Gmur, T.; Cugnoni, J. Delamination detection and characterisation of bridging tractions using long FBG optical sensors. Compos. Part A Appl. Sci. Manuf. 2007, 38, 2087–2096. [Google Scholar] [CrossRef]
  46. Zhou, Z.; Graver, T.W.; Hsu, L.; Ou, J.P. Techniques of Advanced FBG sensors: Fabrication, demodulation, encapsulation and their application in the structural health monitoring of bridges. Pac. Sci. Rev. 2003, 5, 116–121. [Google Scholar]
  47. Sahota, J.K.; Gupta, N.; Dhawan, D. Fiber Bragg grating sensors for monitoring of physical parametrs: A comprehensive review. Opt. Eng. 2020, 59, 060901. [Google Scholar] [CrossRef]
  48. Ramakrishnan, M. Hybrid Optical Fiber Sensors for Smart Materials and Structures. Ph.D Thesis, Technological University Dublin, Dublin, Ireland, 2016. [Google Scholar]
  49. Shen, C.; Zhong, C. Novel temperature-insensitive fiber Bragg grating sensor for displacement measurement. Sens. Actuators A Phys. 2011, 170, 51–54. [Google Scholar] [CrossRef]
  50. Zhang, W.; Dong, X.; Zhao, Q.; Kai, G.; Yuan, S. FBG-Type Sensor for Simultaneous Measurement of Force (or Displacement) and Temperature Based on Bilateral Cantilever Beam. IEEE Photonics Technol. Lett. 2001, 13, 1340–1342. [Google Scholar] [CrossRef]
  51. Dong, B.; Zhao, Q.; Liu, L.; Huang, G.; Jin, L.; Zhou, J.; Liao, T. Tunable Chirped Fiber Bragg Grating Filter Based on Special Strain Function Modulation and Its Application in Fiber Sensor. J. Light. Technol. 2008, 26, 2286–2290. [Google Scholar] [CrossRef]
Figure 1. Photo of the measuring system for stress testing using the example of applying a load to the edge of a plate.
Jcs 08 00321 g001
Figure 2. Sensor diagram for simultaneous force and temperature measurement with designated FBG mounting location.
Jcs 08 00321 g002
Figure 3. Schematic of the sensor design for simultaneous measurement of strain and temperature based on a single FBG, mounted on a specially designed holder that ensures the transfer of shear force to the chirp.
Jcs 08 00321 g003
Figure 4. View of a laminate section with a schematic.
Jcs 08 00321 g004
Figure 5. Distributions of axial strains along the measuring arm of the sensor in Figure 3 for different brackets with different applied forces. (a) Steel, (b) PMMA, and (c) glass brackets.
Jcs 08 00321 g005aJcs 08 00321 g005b
Figure 6. Graph of axial strain along the support in the form of a truncated cone with the Bragg grating location marked, ((a)—steel bracket, (b)—PMMA bracket, (c)—glass bracket) graphs plotted for different values of applied forces.
Jcs 08 00321 g006
Figure 7. Graph of axial strain along the support in the form of a truncated cone with the Bragg grating location marked.
Jcs 08 00321 g007aJcs 08 00321 g007b
Figure 8. Processing characteristics of an optical Bragg grating sensor in which a linear chirp is caused by an applied force when the force value changes and the temperature is constant.
Jcs 08 00321 g008aJcs 08 00321 g008b
Figure 9. Processing characteristics of an optical Bragg grating temperature sensor in which the linear chirp is induced by an applied force. There is a change in temperature and no load (no applied force).
Jcs 08 00321 g009aJcs 08 00321 g009b
Figure 10. Changes in spectral characteristics in successive layers of a plate subjected to bending, (a) fiber 1 (top layer); (b) fiber 2 (middle layer); (c) fiber 3 (bottom layer).
Jcs 08 00321 g010
Figure 11. Central wavelength shift in the spectrum for FBG1, FBG2, and FBG3 ((a)—top, (b)—center, (c)—bottom).
Jcs 08 00321 g011
Table 1. Parameters used in this work.
BracketSteel (Unit)PMMA (Unit)Glass (Unit)
Parameters
K ε 1.2 nm/mε0.554 mn/mε0.987 mn/mε
E Young’s modulus200 GPa3 GPa73.5 GPa
s the width of the composite10 mm10 mm10 mm
g is its thickness1 mm1 mm1 mm
K T 1 9.45 pm/°C7.6745 pm/°C14.3445 pm/°C
K F 1 2.6 × 10⁻³ nm/N1.2 × 10−3 nm/N3.5 × 10−3 nm/N
K T 2 8.35 pm/°C5.57 pm/°C6.24 pm/°C
K F 2 1.2 × 10⁻³ km/N2.78 × 10−3 km/N3.89 × 10−3 km/N
p e  photo-elastic constant210 GPa45 GPa71.4 GPa
λ B  the wavelength used for the Bragg grating1555 nm1555 nm1555 nm
α Λ  coefficient of thermal expansion of the rack1.2 × 10−5 1/K5 × 10−5 1/K5.8 × 10−7 1/K
α n  coefficient of thermal expansion of the holder1.3 × 10−6 1/K4.6 × 10−6 1/K8.6 × 10−6 1/K
α w  the coefficient of thermal expansion of the stand0.55 × 10−6 1/K3.5 × 10−6 1/K4 × 10−6 1/K
z u  the length of the Bragg grating530 nm530 nm530 nm
n e f f  the effective refractive index of the fiber100100150
Λ period100 mkm100 mkm100 mkm
z 1 55 nm55 nm55 nm
z 2 60 nm60 nm60 nm
Disclaimer/Publisher’s Note: The statements, opinions and data contained in all publications are solely those of the individual author(s) and contributor(s) and not of MDPI and/or the editor(s). MDPI and/or the editor(s) disclaim responsibility for any injury to people or property resulting from any ideas, methods, instructions or products referred to in the content.

