1. Introduction
According to Klaiber et al. (1988), during that decade, the primary method for strengthening steel bridges involved bonding steel I-beams with steel plates [
1]. However, this method presented several drawbacks, including the logistical challenge of transporting and installing heavy steel plates at bridge sites, high costs, limited corrosion resistance, and potential disruption to traffic flow. These challenges prompted researchers to explore alternative solutions, leading to the adoption of carbon fiber-reinforced polymer (CFRP) plates for strengthening purposes, as documented in several studies [
2,
3,
4]. CFRP plates offer various advantages over steel plates, including higher strength, improved fatigue life, enhanced corrosion resistance, greater resilience to environmental hazards, and lightweight properties [
5,
6].
The traditional technique of bonding CFRP plates onto the tension flange was further developed by prestressing the CFRP plates before installation, which aimed at improving material efficiency. Additionally, researchers such as Mertz and Gillespie [
6] investigated the feasibility of using CFRP plates to strengthen steel beams. In certain cases, the implementation of CFRP plates alone for bridge strengthening proved insufficient to enhance bridge efficiency [
7,
8]. Various factors contributed to this, including excessive stresses, high traffic volume, design errors, or damage resulting from environmental disasters. Consequently, additional strengthening measures were required to address these challenges and ensure the structural integrity and functionality of the bridges.
The post-tensioning technique has emerged as one of the most prominent strengthening methods over the past two decades. By mitigating deflection and augmenting the stiffness and load-bearing capacity of structural elements, this technology empowers designers and engineers to optimize material utilization effectively. This strengthening strategy has been the subject of numerous research, most of which focus on how well it works to improve the performance of structural parts under various stress conditions [
9,
10].
An experimental investigation on external post-tensioning steel–concrete composite beams (CBs) was carried out by Ayyoub et al. [
11]. They stated that although draped tendon profiles performed better in terms of capacity and deflection, straight tendon profiles are preferred since they are more economical.
Chen et al. conducted experiments on CBs reinforced with external post-tensioning tendons under positive moments [
12]. Their findings indicated that incorporating these tendons increased both the yield load and ultimate resistance by approximately 49% and 53%, respectively. They also observed that the ultimate moment of the unreinforced specimens closely approached the plastic moment of the steel section, whereas for the reinforced beams, the ultimate moment ranged from 1.03 to 1.11 times the yield moment at which the compression flange initiated yielding.
De Lee et al. investigated full-scale non-prestressed and pre-stressed CBs with corrugated webs under flexural loads [
13]. Their study revealed that prior to composite with concrete, the accordion effect significantly increased the pre-stress in the top and bottom flanges of the steel beam. Subsequently, after composite with concrete, the pre-stressed specimens exhibited superior flexural strength and stiffness compared to the non-prestressed specimens.
El-Zohairy et al. developed a 3D finite-element (FE) model to simulate the nonlinear flexural behavior of CBs reinforced with post-tensioned tendons [
7,
8]. They utilized incremental-iterative load techniques to analyze nonlinear material behavior and geometry. They thoroughly investigated the behavior of strengthened beams by comparing their FE analysis with experimental data. This included examining the impact of external post-tensioning on stiffness, induced stresses, slippage of steel beams and concrete slabs, and shear connector moments. According to the study’s findings, adding external post-tensioning ten-dons to CBs’ positive moment region enhanced the bridge structural system’s overall performance by 33% and its ultimate capacity by 25%.
Elbelbisi et al. advocate for sustainability by reinforcing existing buildings with durable materials like fiber-reinforced polymer (FRP) to minimize the need for new construction [
14]. They highlight the effectiveness of post-tensioned (PT) FRP systems in strengthening structures and reducing cracks. Their study investigates the flexural behavior of CBs reinforced with external PT FRP tendons using a 3D finite element model. Results show carbon FRP as the optimal material with a PT level of 30–40%.
Many authors have examined the shear and flexural behavior of fiber-reinforced polymer (FRP)-reinforced concrete beams, revealing remarkable reinforcing outcomes. The impact of externally bonded CFRP sheets on the shear strength of shear-deficient reinforced concrete beams attached to the beam’s soffit was investigated by Hawileh et al. [
15]. When compared to control specimens, they discovered that reinforced concrete beams’ shear strength increased by 10–70%. They also pointed out that the shear strength of reinforced beams is affected by the flexural horizontal reinforcement ratio.
Using internally bonded and externally unbonded draped CFRP tendons, Grace and Abdel-Sayed investigated four bridge models under static, repeated, and ultimate loads [
16]. The remaining bridges were skew bridges, and two of the bridges were right-angle bridges. Remarkably, during testing, none of the tendons that were wrapped externally ruptured. Furthermore, they noticed that at maximum load, the post-tensioning force in the exterior tendons was almost twice the initial values.
The main aim of this paper is to enhance the ultimate flexural strength and ductility of a CB by adding post-tensioned CFRP tendons to reinforce a bonded prestressed CFRP plate. To achieve this goal, a finite element model (FEM) was developed using ANSYS software [
17]. The FEM was validated using experimental studies available in the literature. Furthermore, a parametric study was executed to investigate the impact of various parameters on the response of the strengthened CBs using CFRP tendons. These parameters include the level of prestress in CFRP tendons, tendon profile, degree of shear connection, and optimal beam load level for incorporating CFRP tendons. Through this comprehensive analysis, the effectiveness of the strengthening approach and the influence of different design parameters on the structural response were evaluated.
2. Finite Element Model
In this research, ANSYS 2023 R2 software was used to model several components such as the concrete slab, steel I-beam, steel reinforcement, shear connectors, the interface between the concrete slab and steel I-beam, and external post-tension tendons and plates [
10,
14].
Figure 1 illustrates the finite element mesh for the CB cross-section.
SOLID (65) element was employed to simulate the concrete, featuring eight nodes with three degrees of freedom for each node, encompassing translations in the nodal directions x, y, and z. This element is adept at simulating plastic deformation, cracking in three orthogonal directions, and crushing [
10]. Its capability to simulate cracking and crushing enables the model to capture the post-peak behavior of concrete by gradually reducing the compressive strength after reaching the peak.
For the reinforcing bars and external post-tensioning tendons, the model utilized a LINK (180) 3D spar element. This element, with two nodes and three degrees of freedom each, was chosen [
18]. The CFRP plate and epoxy were modeled using the SOLID (45) element, chosen for its capability to handle plasticity deformation, large deflection, and strain stresses. This element features eight nodes with three degrees of freedom at each node, allowing translations in the directions of x, y, and z.
In ANSYS, CONTACT (178) elements facilitate interactions between surfaces, crucial for simulating contact, sliding, friction, large deformations, and nonlinear material behavior, accurately representing real-world interactions in various industries for performance evaluations. Therefore, the interface between the upper steel flange and the concrete slab was modeled using surface-to-surface CONTACT ELEMENT (178), involving four nodes [
14]. The steel I-beam and loading plates were modeled using the SOLID (185) element, defined by eight nodes with three degrees of freedom at each node, mirroring translations in the nodal x, y, and z directions [
19]. This element boasts plasticity, hyper-elasticity, stress stiffening, creep, large deflection, and large strain capabilities.
To model the shank of the shear connector, the uniaxial beam element BEAM (23), was used. The shear slippage behavior of the shear connector was simulated using the unidirectional spring element COMBINE (39), with the stud’s shear-slippage curve serving as a force-deformation relation for the spring element, resulting in an ANSYS element actual contact approach.
For headed studs, the constitutive relationship proposed by Ollgaard et al. [
20] was used to construct the shear slippage curve of the shear connection [
8,
21,
22]. Equation (1) analyzes the relationship between the shear force (Fj) and slip (Sj) of a typical stud, yielding reasonable findings using a curve with α and β values of 0.558 and 1.0, respectively [
22].
where,
Fj: Shear force.
PU: Ultimate strength of the shear connectors.
Sj: Slip between the slab and the steel profile.
α and β: Parameters managing the initial slope and the shape of the curve.
2.1. Real Constants
In order to simulate the initial posttensioning force, a temperature load effect was used. The initial temperature, determined using Equation (2), determines the relationship between the temperature load and the tension force. The phrase “initial temperature” refers to the corresponding temperature change required to obtain the necessary post-tensioning force.
where,
F: The posttension force.
E: Tendon modulus of elasticity.
α: Coefficient of thermal expansion.
Ap: Cross-section of the tendon.
2.2. Modeling of Materials Behavior
Concrete was simulated to be homogeneous and isotropic. ANSYS requires input of the uniaxial stress–strain curve of the concrete in compression. To fulfill this requirement, a multilinear curve was employed, connecting nine points to create a simplified stress–strain curve, as depicted in
Figure 2a [
23,
24].
For simulating the nonlinear behavior of the steel beam, the bilinear isotropic hardening model was adopted. The model parameters, including the elastic modulus and yield stress, were determined experimentally [
25], as shown in
Figure 2b.
Since the steel rebars are slender; they are primarily considered to transfer axial forces only [
26,
27]. A bilinear isotropic hardening model was used for the steel rebar, similar to the approach taken with the steel beam.
In contrast, to simulate the brittle behavior of the FRP material, a linear elastic material model was utilized. Continuous monitoring ensured that the maximum strain of the tendon did not exceed the failure strain.
Figure 3 illustrates the stress–strain relationship of the utilized materials in comparison to that of steel.
2.3. Validation
Experimental data selected from the literature were chosen based on their recognized accuracy and relevance to the study parameters, ensuring comprehensive validation across various conditions and rigorous benchmarking against established standards in the field to enhance the credibility and applicability of our findings. Therefore, experimental data from Chen et al. [
12] and Emam et al. [
28] were selected from the literature to validate the FEM. In the research conducted by Chen et al.,
Figure 4a,b illustrates the dimensions, specifics, and configurations of the post-tensioned tendons used in the examined beams [
12]. These beams, with a total length of 5150 mm and a simply supported span (L) of 5000 mm, featured a beam height (H) of 200 mm and a tendon elevation (He) of 30 mm. They underwent quasi-static testing using a four-point bending setup.
Each flange was equipped with two rows of shear studs measuring 8 mm in diameter and 65 mm in height. The transverse spacing between these rows was 76 mm, spaced 200 mm apart along the beam’s span. The concrete slabs were reinforced in two perpendicular directions with eight deformed bars, each 8 mm in diameter. A straight tendon profile was positioned 30 mm above the bottom flange. Detailed material properties of all beam components can be found in
Table 1.
Comparing the FEM results with the experimental data from Chen et al. [
12], it was evident that there is a good agreement between the FEM and the experimental work. The FEM predicted the experimental results with a 4% difference, as demonstrated in
Table 2 and
Figure 5.
Emam determined the final flexural behavior of an externally prestressed CFRP plate through experimental research utilizing a CB integrated with it.
Figure 6a,b illustrates the dimensions, specifications, and configurations of the prestressed CFRP plate utilized in the beams. The beam was simply supported over a 5600 mm span and loaded symmetrically at two locations, with a total length of 6000 mm. The top flange was welded to two rows of 16 mm diameter shear studs, each measuring 28.56 mm in length. The rows were positioned 90 mm apart longitudinally and 30 mm apart transversely. Two perpendicular 4.1 mm diameter bars were used to reinforce the concrete slab.
The prestressed plate was 80 mm in width and 1.2 mm thick, and it was attached to the bottom steel flange the whole way around the steel I-beam. As shown in
Figure 6b, Sikadur 30 epoxy, which has a thickness of 1 mm and a Young’s modulus of 4.5 GPa, was employed as the adhesive to connect the plate to the steel I-beam’s tension flange.
Table 3 provides a complete list of the material qualities of the components used.
In general, the finite element model (FEM) exhibited good agreement with the experimental results. In the linear range, the moment–deflection response of the FEM aligned closely with that obtained from the experiments. However, as the moment–deflection curve transitions from linear to nonlinear, signifying the onset of beam yielding, slight discrepancies arise. Following this point, the stiffness of the FEM becomes slightly higher than that of the experimental beam. This discrepancy can be attributed to variations in the behavior of the shear connector between the experimental and theoretical models, as illustrated in
Figure 7. The validation of the FEM results was achieved with an agreement rate of 97% when compared to the experimental results of Emam [
28], as demonstrated in
Table 4.
2.4. Parametric Investigation
The model, created to simulate the experimental work conducted by Chen et al., was employed for a parametric study involving variations in both geometric and material characteristics (see
Figure 4). Thirty-three models, categorized into nine groups (labeled A to I), were constructed to study the impact of different parameters on the response of the CBs. Details of this parametric investigation are provided in
Table 5, which also highlights the study’s limitations.
Groups A and B investigated the effects of two distinct strengthening techniques on the response of CBs that have previously been strengthened with a prestressed plate. Group A aimed to assess the impact of incorporating CFRP tendons on the CB response across various original plate materials. Four models, SP, CP, AP, and GP, were developed, each utilizing different original plate materials: steel, CFRP, AFRP, and GFRP, respectively. Material characterization of the employed tendons are detailed in
Figure 3. Meanwhile, Group B comprised models SCP, CCP, ACP, and GCP, to examine the influence of adding a second CFRP plate to the original plate on the CB response. The SCP, CCP, ACP, and GCP models incorporated steel, CFRP, AFRP, and GFRP materials, respectively, for the original plates.
Group C comprised four models: LT1, LT2, LT3, and LT4. Each model features a different tendon length expressed as a percentage of the beam length, ranging from 70% to 100%, as outlined in
Table 5. Group D consisted of four models: LP1, LP2, LP3, and LP4. These models vary in plate length, also expressed as a percentage of the beam length, ranging from 70% to 100%, as detailed in
Table 5. Group E encompassed models T1, T2, T3, and T4, each representing a different prestress level ranging from 15% to 40% of the ultimate strength of the tendon (PU), as depicted in
Table 5.
Group F comprised four models labeled U1, U2, U3, and U4, designed to determine the most effective beam load level for the addition of CFRP tendons. These models are subjected to loads equivalent to 70%, 80%, 90%, and 95% of their ultimate capacity before the post-tensioned CFRP tendons are applied. Group G consisted of three models, PT1, PT2, and PT3, aimed at studying the effect of tendon profile. These models feature straight, trapezoidal, and parabolic tendon profiles, as depicted in
Figure 8a–c.
To investigate the effect of the degree of shear connection (DOSC), Group H was established, comprising four models named DL1, DL2, DL3, and DL4. Each model varies in the DOSC, achieved by altering the number of shear connectors, as indicated in
Table 5. Finally, Group I model for B1 and B2, aimed at determining the optimal strengthening conditions for the composite beam. B1 represents a CB reinforced with a bonded CFRP plate using straight CFRP tendons, with an initial force of 30% of its ultimate tensile strength. This model operates with full composite action and is loaded to 95% of its ultimate strength. B2, on the other hand, represents a CB reinforced with post-tensioned CFRP parabolic tendons after reaching 70% of the CB ultimate strength.
2.5. Loading
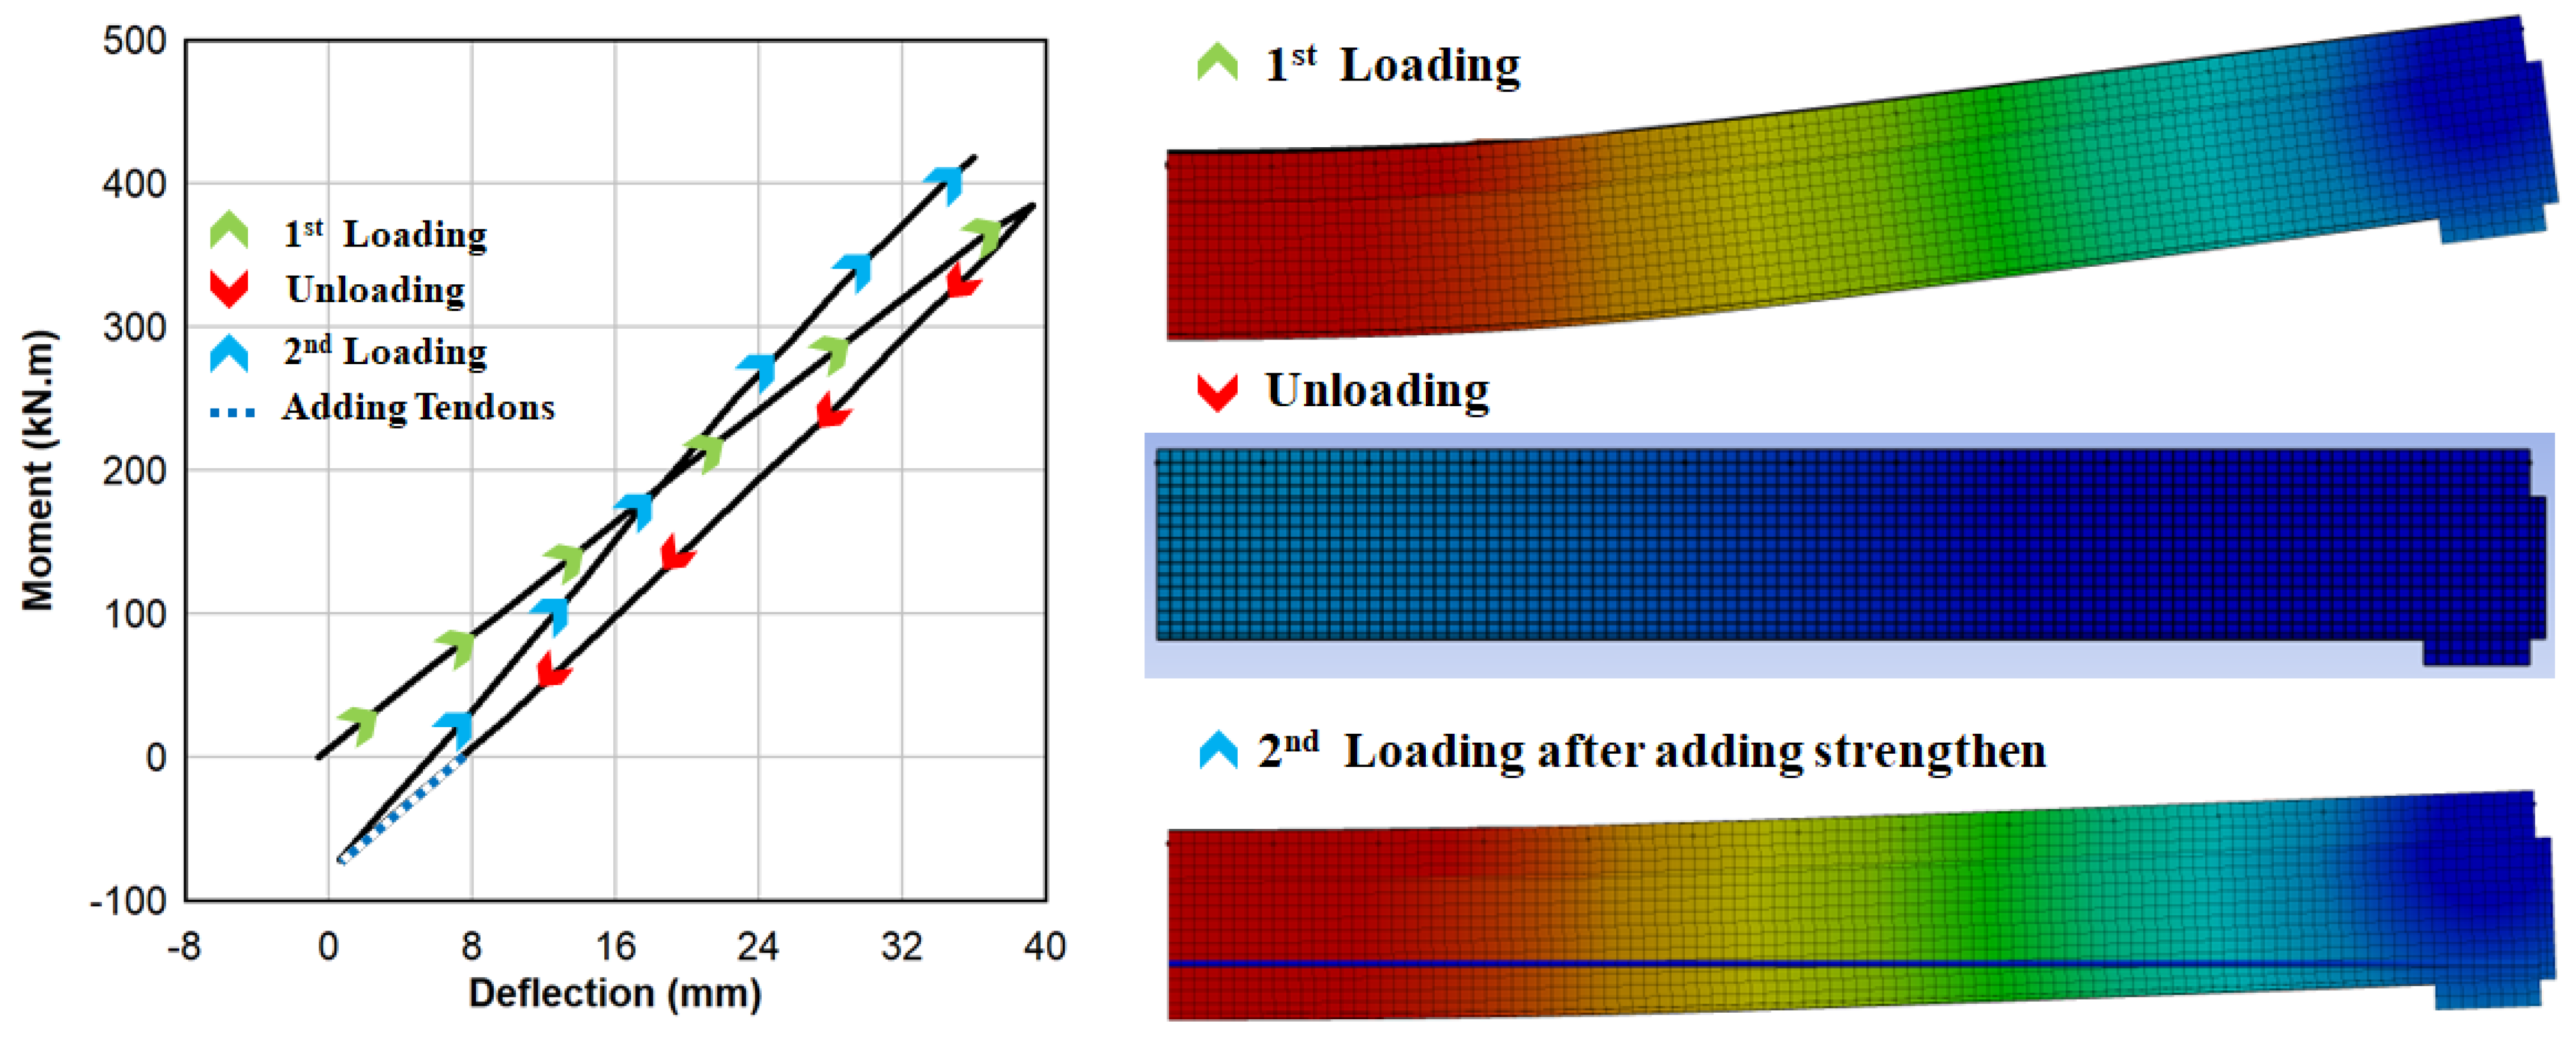
There are three steps to adding strengthening techniques. First, the CB was loaded to a percentage ranging from 70% to 95% of its ultimate capacity. Then, the CB was unloaded. After that, the strengthening technique was applied as indicated by the blue dash line, and the beam was reloaded again as shown in
Figure 9.
3. Results
The outcomes of the models, including moment–midspan deflection responses and load–slippage relationships, will be discussed in this section.
3.1. Effect of Strengthening with CFRP Tendons on Various Plate Materials
The moment–deflection responses for the strengthened beam with CFRP tendons on various plate materials are depicted in
Figure 10a. The CB model with CFRP plate, Model CP, exhibited the largest bending capacity at 420 kN·m, with a maximum deflection of 36 mm. This represents a 14% enhancement in beam capacity after the addition of the tendons. The CB models with steel and aramid plates, models SP and AP, show ultimate moments of 364.2 kN·m and 390 kN·m, respectively. Model GP displayed the lowest moment capacity at 340 kN·m, as illustrated in
Figure 10b. With the incorporation of CFRP tendons, the beam capacities for CBs with steel, aramid, and GFRP, models SP, AP, and GP, increased by 8.6%, 11%, and 17%, respectively. Consequently, the moment capacity of the CB model with CFRP plate surpassed that of the CB model with GFRP plate by 23.5%.
In general, the results highlight the significant improvement in beam capacity achieved through the application of CFRP tendons across various plate materials. The CB model with the CFRP plate emerged as the most robust, exhibiting the highest moment capacity, while the CB model with the GFRP plate had the lowest capacity. The observed enhancements in beam capacities underscore the effectiveness of CFRP tendon reinforcement in strengthening structural elements.
3.2. Effect of Strengthening with CFRP Plate on Various Plate Materials
The moment–deflection responses for the strengthened beam with CFRP plates on various plate materials are illustrated in
Figure 11a. Among the models, the CB model with CFRP plate (CCP) demonstrates the highest beam capacity at 400 kN·m, with a maximum deflection of 37 mm. This signifies an 8% enhancement in beam capacity following the addition of the second CFRP plate. The CB models with steel and aramid plates (models SCP and ACP) exhibit ultimate moments of 359.8 kN·m and 382 kN·m, respectively. The CB model with GFRP plate (GCP model) presents the lowest moment capacity at 315 kN·m, as depicted in
Figure 11b. Upon incorporating CFRP plates, the beam capacities for models with steel, aramid plates, and GFRP plates increase by 7.4%, 8%, and 8.6%, respectively. Consequently, the moment capacity of the CCP beam surpasses that of model GCP by 27%.
Overall, the results demonstrate notable improvements in beam capacity through the addition of CFRP plates across various plate materials. The CB model with the CFRP plate emerges as the most robust model, showcasing the highest moment capacity, while the CB model with the GFRP plate exhibits the lowest. Moreover, the observed enhancements underscore the efficacy of CFRP plate reinforcement in strengthening structural elements, offering promising implications for practical applications in engineering.
3.3. Effect of Tendon Length
The moment–deflection curves at the middle of the strengthened beam with different tendon lengths are shown in
Figure 12a. With a maximum deflection of 38 mm, the CB model with 70% tendon length (LT1 model) has the lowest moment capacity among the models at 391 kN·m. The CB models with 80% and 90% tendon length (models LT2 and LT3) achieve maximum moments of 400 kN·m and 411 kN·m, respectively. Notably, the CB model with 100% tendon length (model LT4) boasts the highest beam moment capacity at 420 kN·m, with a deflection of 36 mm, representing a 13.5% enhancement after the addition of the tendon, as shown in
Figure 12b. Additionally, adding tendons with lengths of 70%, 80%, and 90% enhances the capacity of the CB by 5.6%, 8.1%, and 11%, respectively.
In general, increasing the length of tendons proves beneficial in augmenting the ultimate strength of the composite section and enhancing the overall behavior of the reinforced beam. However, owing to construction challenges, it is advisable to utilize tendons spanning 90% of the beam span. The findings underscore the importance of tendon length in strengthening composite sections, with longer tendons significantly contributing to improved structural performance.
3.4. Effect of Plate Length
The moment–deflection curves at the center of the strengthened beam with different plate lengths are shown in
Figure 13a. The CB model with 70% plate length (LP1 model) demonstrates the lowest moment capacity at 379 kN·m, accompanied by a maximum deflection of 37.2 mm. The CB models with 80% and 90% plate length (models LP2 and LP3) achieve maximum moments of 382.2 kN·m and 395 kN·m, respectively. Remarkably, The CB model with 100% plate length (LP4 model) showcases the highest beam moment capacity at 400 kN·m, with a deflection of 37 mm, marking an 8.1% enhancement after the addition of the tendon, as depicted in
Figure 13b. Furthermore, incorporating a second plate with lengths of 70%, 80%, and 90% enhances the capacity of the CB by 2.4%, 3.2%, and 6.75%, respectively.
In general, increasing the length of the plate helps to increase the ultimate strength of the composite section while also enhancing the overall behavior of the reinforced beam. However, due to construction challenges, it is recommended to utilize a plate spanning 90% of the beam span. These findings underscore the significance of plate length in strengthening composite sections, with longer tendons notably enhancing structural performance.
3.5. Effect of Prestress Level of CFRP Tendons
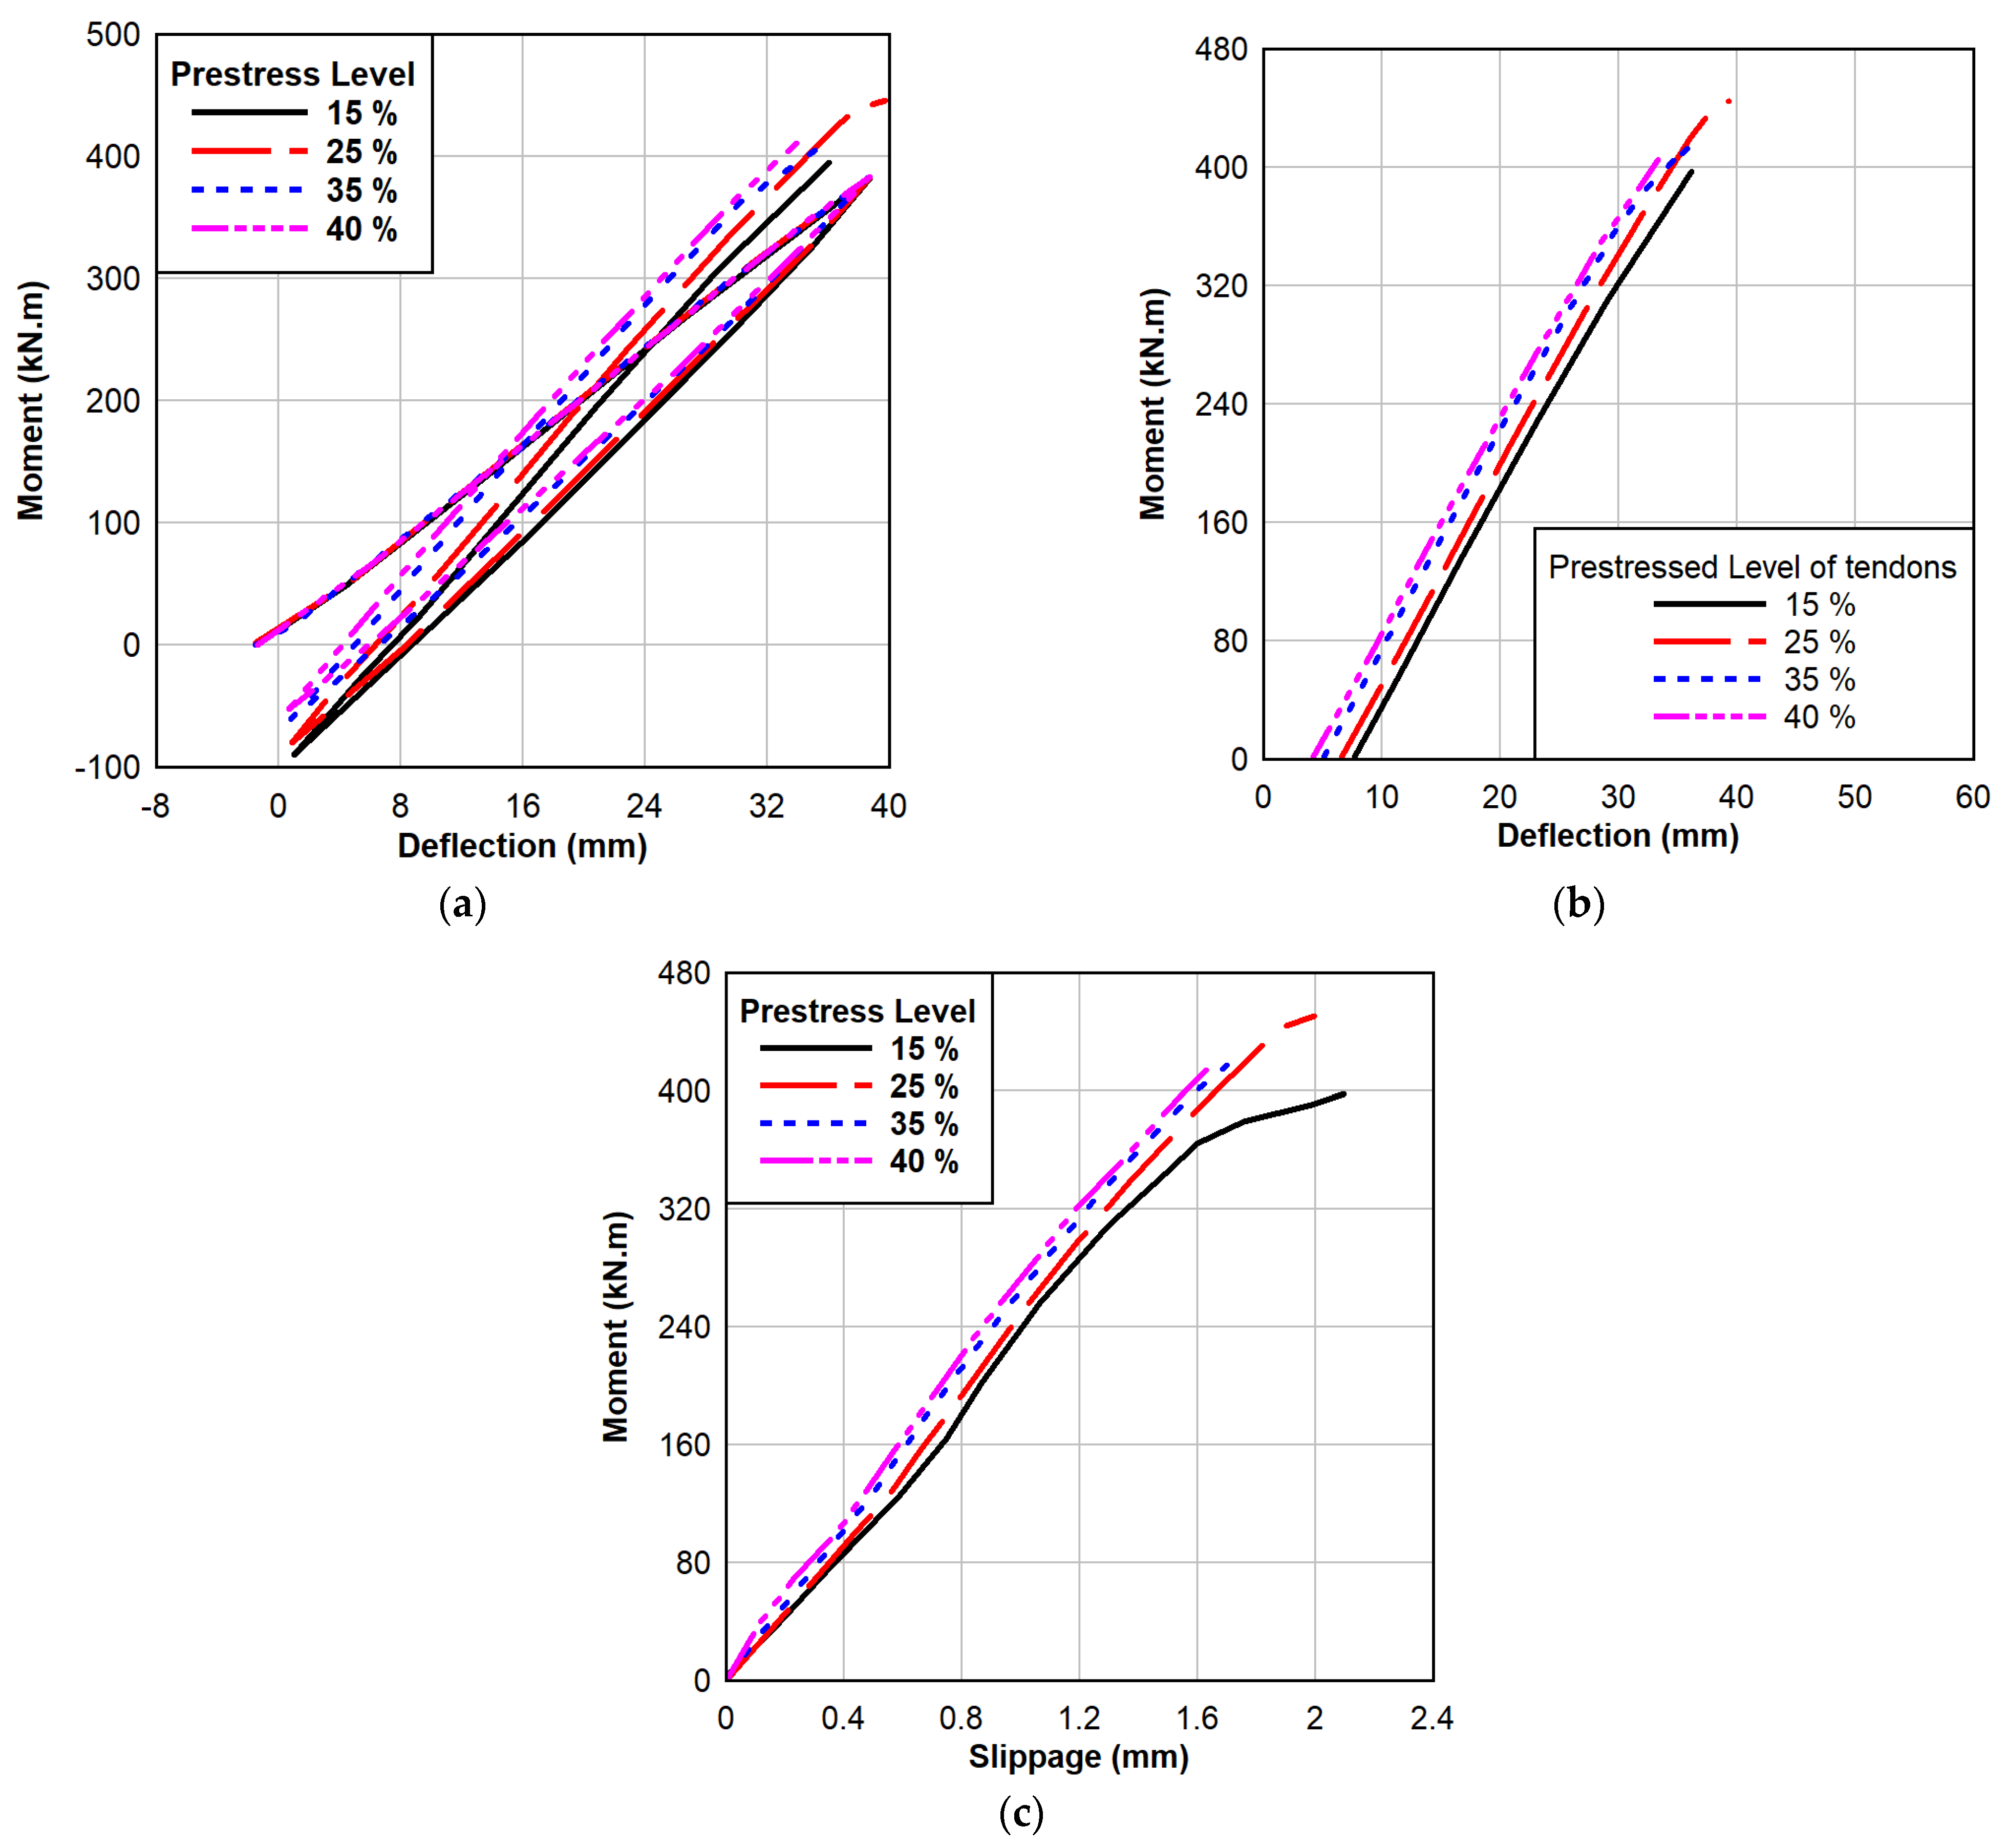
In this group, prestress ranging from 15% to 40% of tendon ultimate strength is examined. The CB model with a 15% prestress level (model T1) exhibits a moment capacity of 397 kN·m with a deflection of 36.1 mm, as depicted in
Figure 14a,b. The CB model with 25% prestress level (model T2) achieves the highest maximum moment at 447 kN·m, representing a 20.8% enhancement in beam capacity after tendon addition, making it advisable to use a prestress tendon with 25% of its ultimate strength. The CB models with 35% and 40% prestress levels (models T3 and T4) display moment capacities of 415 kN·m and 412 kN·m, respectively. The addition of tendons with prestress levels of 15%, 30%, and 40% enhances beam capacity by 7.3%, 12.2%, and 11.4%, respectively. Generally, increasing the level of prestress leads to an early collapse in concrete, while decreasing it enhances both the moment capacity and ductility of the beam.
The moment–slippage curves at the CB’s center with different post-tension level values are shown in
Figure 14c. It has been noted that slippage between the concrete and steel top flange is decreased when the post-tension level is raised.
In general, the findings emphasize the importance of carefully selecting prestress levels to balance structural performance and ductility. Higher prestress levels enhance moment capacity, but may lead to early collapse, while lower levels improve ductility but sacrifice some moment capacity. Additionally, increasing post-tension levels reduces slippage, contributing to improved structural integrity. These insights can guide optimal design choices for reinforced beams, ensuring both strength and durability.
3.6. The Most Effective Beam Load Level to Add CFRP Tendons
To add the tendon, the beam was loaded to 70%, 80%, 90%, and 95% of its ultimate capacity, as depicted in
Figure 15a. It was observed that adding the tendon after loading it to 70% of its ultimate capacity increased the capacity of the CB by 74.9%. Model U1 exhibited the highest moment capacity at 453 kN·m compared to other models, indicating that the most effective beam load level to add CFRP tendons was 70%. However, as shown in
Figure 15b, adding the tendon after loading the beam to 80%, 90%, and 95% enhanced the beam capacity by 52%, 34%, and 13.5%, respectively. The moment capacities for models where the tendon was added after loading the beam to 80%, 90%, and 95% (models U2, U3, and U4) were 450 kN·m, 447 kN·m, and 420 kN·m, respectively.
Overall, the results highlight the significant impact of loading level on the effectiveness of adding CFRP tendons. Loading the beam to 70% of its ultimate capacity before adding the tendon resulted in the highest increase in capacity. These findings can inform optimal loading strategies for strengthening beams with CFRP tendons, ensuring maximum structural enhancement.
3.7. Effect of Tendon Profile
Figure 16a depicts the moment–deflection curves at the middle of a steel–concrete CB with different tendon profiles. The CB model with straight tendons (model PT1) exhibits a maximum moment of 420 kN·m and a maximum deflection of 36 mm, enhancing the beam capacity by 13.5%. The CB models with trapezoidal and parabola tendons (models PT2 and PT3) showcase the highest moments at 504 kN·m and 593 kN·m, respectively, with deflections of 21.6 mm and 27.4 mm.
Observing the initial upward movement and behavior during the elastic zone, the strengthened beams exhibit similar characteristics. The beam with a straight tendon profile has higher ductility after yielding. The CB model with parabola tendons outperforms the other models in terms of moment capacity and deflection.
Overall, post-tensioned tendons with trapezoidal and parabolic shapes show promising results in reducing deflection and significantly increasing the yield load and ultimate load of CBs by 36% and 60%, respectively, as depicted in
Figure 16b. These findings underscore the importance of tendon profile selection in optimizing the performance and structural integrity of reinforced beams.
3.8. Effect of Degree of Shear Connection
Figure 17a shows the middle span moment-deflection responses of a CB with varying DOSC. Model DL1 (60% DOSC) has the least moment capacity at 370 kN·m, with a displacement of 33.5 mm. Failure occurs in the studs, improving the beam capacity by 13.8%. Models DL2 (80% DOSC) and DL3 (90% DOSC) have moments of 395 kN·m and 408 kN·m, correspondingly, increasing CB capacity by 16.2% and 14.6%. Model DL4 (100%) had the highest beam capacity at 420 kN·m, but failed due to concrete crushing. Using 100% DOSC in DL4 boosts the CB’s ultimate capacity by 13.5% compared to DL1. Overall, a rise in the DOSC is associated with an increase in CB capacity.
The midspan moment–slippage responses of a CB with varying DOSC are shown in
Figure 17b. Increasing the DOSC decreases slippage between the concrete and steel top flanges, as demonstrated by Model DL4, which exhibits the best strength with the least amount of slippage. Furthermore, the moment vs. bottom flange stress curves at the center for the steel-concrete CB with several DOSCs are shown in
Figure 17c. Shear connection capacity controls the beam’s capabilities; model DL1’s low shear connection capacity, in comparison to beams with higher DOSC, causes early failure.
In conclusion, to fully capitalize on the benefits of employing externally post-tensioned tendons, achieving a degree of composite action of 80% or higher between the concrete flange and the steel beam is recommended. This ensures optimal structural performance and resilience, mitigating premature failure and enhancing overall beam capacity.
3.9. The Optimum Strengthening Condition
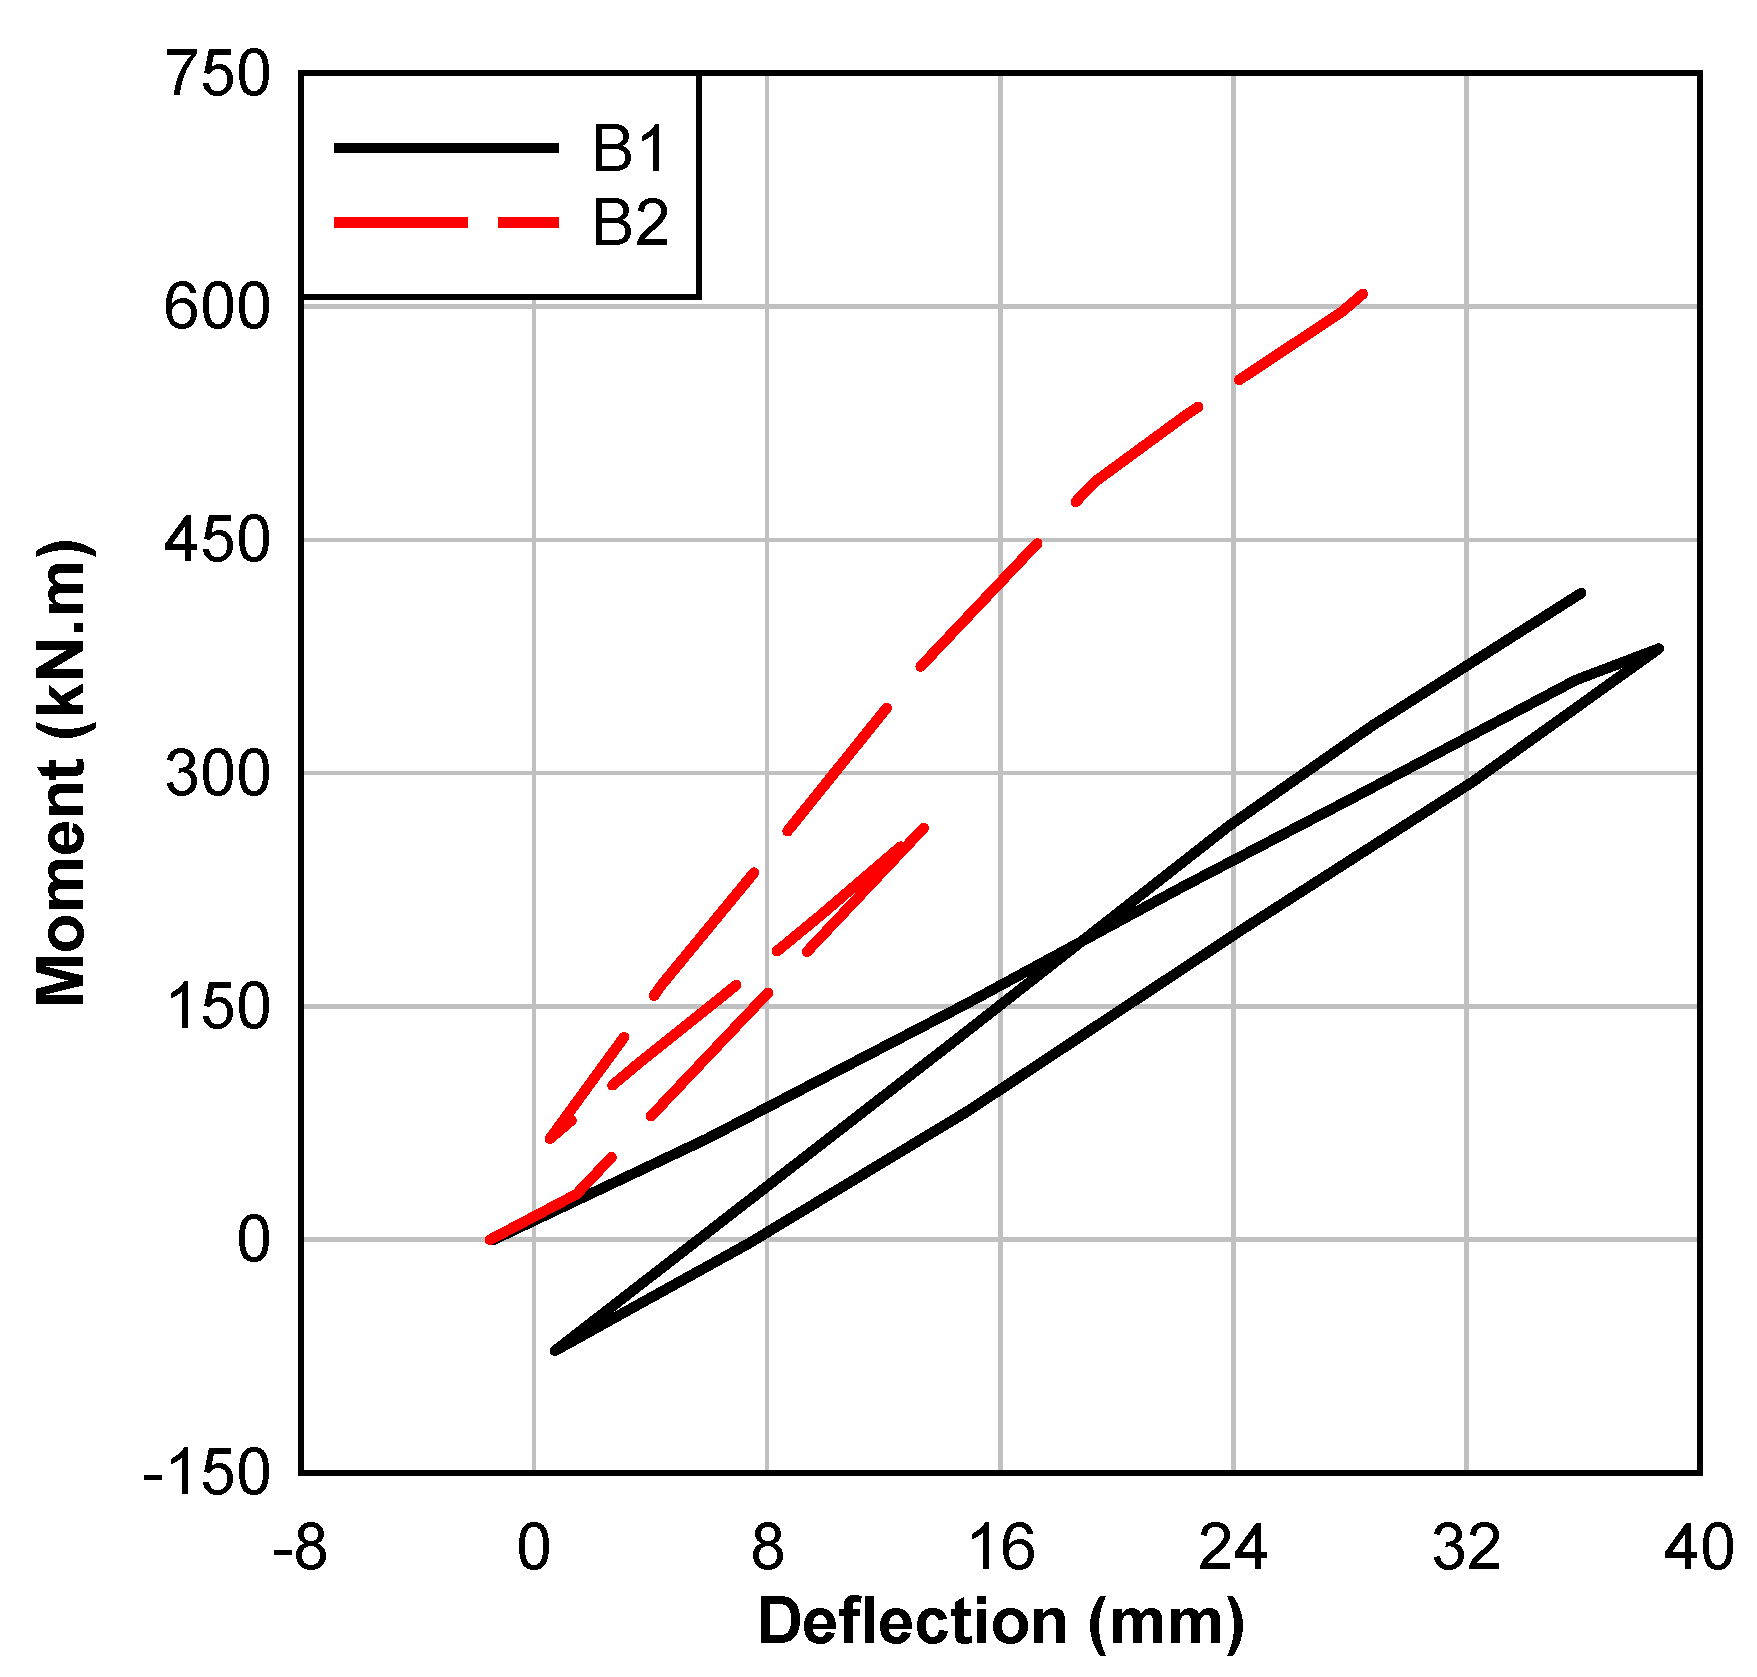
Figure 18 presents a comparison between B1 (strengthened with CFRP plate) and B2 (strengthened with CFRP tendon), representing the worst and best strengthening techniques, respectively. B1 exhibits a maximum capacity of 630 kN·m, enhancing the beam capacity by 143.2%. B2 achieves a maximum capacity of 420 kN·m, enhancing the beam capacity by only 13.5%. Consequently, the moment capacity of B2 is 130% higher than that of B1.
In general, to achieve optimal strengthening techniques, B2 reinforced with a parabolic tendon, 100% DOSC, 25% prestress level, and 70% beam load level, should be utilized. This combination demonstrates superior performance in enhancing the moment capacity of the beam compared to other techniques. These findings underscore the importance of selecting appropriate strengthening methods tailored to specific structural requirements, ensuring efficient and effective reinforcement strategies for improved structural integrity.


 ,
, 


