Article

Valorization of Cork and High-Density Polyethylene and Polypropylene Wastes in Cork–Plastic Composites: Their Morphology, Mechanical Performance, and Fire Properties

by
Svetlana Petlitckaia
1,
Virginie Tihay-Felicelli
1,
Laurent Ferry
2,*,
Sylvain Buonomo
2,
Camille Luciani
1,
Yann Quilichini
1,
Paul-Antoine Santoni
1,
Elisabeth Pereira
1 and
Toussaint Barboni
1
1
CNRS UMR 6134 SPE, Campus Grimaldi, University of Corsica, BP 52, 20250 Corte, France
2
Polymers Composites and Hybrids (PCH), IMT Mines Ales, 30100 Ales, France
*
Author to whom correspondence should be addressed.
J. Compos. Sci. 2024, 8(6), 195; https://doi.org/10.3390/jcs8060195
Submission received: 6 May 2024 / Revised: 13 May 2024 / Accepted: 16 May 2024 / Published: 22 May 2024
(This article belongs to the Special Issue Progress in Polymer Composites, Volume III)

Abstract

:
The recycling of waste materials is a way of limiting over-consumption and optimizing the value of resources. Within the framework of a circular economy, this can be applied to post-consumer plastic wastes, but also to biobased by-products. Hence, this work deals with the design of composite materials by combining recycled high-density polyethylene (HDPE) and polypropylene (PP) coming from bottle caps and virgin cork of insufficient quality for cork stoppers. Different fractions (0, 5, 10, 15, and 20 wt%) of virgin cork were incorporated into recycled polymers (HDPEr and PPr). These composites were prepared without a coupling agent or fire retardant. The morphology and mechanical properties of the different conditionings were studied and compared. The thermal decomposition and the fire behavior of the composites were also investigated. Microscopy revealed the poor adhesion between the cork particles and polymer matrices. However, this limited interaction affected only the tensile strength of the PPr composites, while that of the HDPEr composites remained almost constant. The addition of cork was shown to reduce the time to ignition, but also to promote charring and reduce the heat released during the composite’s combustion. The feasibility of composites based on cork and HDPEr/PPr waste opens the way for their reuse.

1. Introduction

Plastics are a revolutionary material that have become ubiquitous in everyday life, thanks to their extraordinary physical and chemical properties [1]. They are cheap, easy to form, and lightweight. However, the use of plastics is associated with many environmental impacts related to their production and poor waste management practices [2]. It is important to find a new way to recycle and reuse these plastics, as there are millions of tons of used plastics accumulating in the natural environment [3,4]. Plastic pollution damages the environment, human health, and the economy of various countries. The social, environmental, and economic problems of plastic waste pollution require immediate and decisive actions. Waste valorization is one of the current research areas that has attracted a lot of attention in recent years [5]. The large volume of plastic requires strategies to improve the reuse of post-consumer waste in order to minimize its impact [6]. In fact, a study highlighted that in 2010, only 7.6% of the 31 million tons of plastic waste generated in the USA was recycled [7]. According to the OECD, only 9% of global plastic waste was recycled in 2019 [8], while the annual global use of plastics, including fibers and additives, exceeds 460 million tons [9]. The reusing and recycling of polymer materials reduces their environmental impact and the use of virgin plastics. There are various products made from post-consumer plastics, such as floor carpets, flower vases, wastepaper baskets, park benches, and picnic tables [7,10]. The most common polymers are polypropylene (PP), polyethylene (PE), and polyvinyl chloride (PVC). High-density polyethylene (HDPE) and polypropylene (PP) are thermoplastic polymers that are widely used in consumer products and can be recycled and used in packaging materials [11,12].
Several works have shown that the use of recycled polymers as a raw material source for production could be a viable alternative from an economic and environmental point of view [6,13,14]. Recycled plastic can be used in wood–plastic composites [15]. Wood–plastic composites (WPCs) are becoming increasingly popular due to their properties (low moisture absorption, low density, resistance to biological attack, good dimensional stability, and a combination of high specific stiffness and strength) [16,17,18]. Some wood–plastic composites are commercially produced in the USA using recycled plastic [19]. Considerable research attention has been given to the development of composite materials based on natural wood fibers from the waste of wood industries and plastics [20,21,22]. Research into new composites derived from cork and cork products has attracted considerable attention, driven by the need for effective waste recovery strategies. This interest stems from the recognition of cork as a versatile and sustainable material, offering not only unique properties but also a valuable avenue for waste reuse. Cork is a natural, renewable, reusable, and biodegradable material with a number of compelling properties. Its low density, elasticity, impermeability, and exceptional acoustic and thermal insulation properties make it not only a versatile resource, but also a sustainable choice [23,24]. Cork is a material obtained by extracting the outer layer of a tree trunk, which is removed periodically every 9–12 years. The cork of the first extraction, called “virgin cork”, is very porous with an irregular thickness. Virgin cork is not suitable for the production of stoppers and must, therefore, be valued differently. The chemical composition of cork has been extensively studied [25,26,27,28]. Cork is composed of suberin (40 wt%), lignin (20 wt%), cellulose and hemicellulose (18 wt%), extractives (15 wt%), and other materials [14,15]. Its composition varies and depends on the geographical origin, climate, soil, genetics, dimensions, age, and condition of the tree. The structure of cork is similar to a honeycomb due to the rectangular cells [29]. This structure has a strong influence on the mechanical properties of cork-based materials [30,31,32]. Cork has poor mechanical behavior, but by combining it with a matrix with sufficient mechanical resistance, such as polymers, this can lead to the development of different products with innovative applications. Cork-based thermoplastic composites are one of the most promising fields for the valorization of cork and plastic wastes. Different composites based on cork and cork products with polyethylene (PE), polypropylene (PP), and polylactic acid (PLA) have been produced [4,20,21,33,34]. The effect of coupling agent addition, chemical modification, and cork content have been studied in the literature [33,35,36,37,38,39]. However, there are few studies on the valorization of virgin cork waste and recycled plastic.
This study focuses on the valorization of waste materials, specifically cork and recycled plastic polymers (HDPEr and PPr), through the formulation of novel composite materials without coupling agents or flame retardants. The composite fabrication process involved combining HDPEr or PPr, derived from bottle caps, with granulated virgin cork. Different formulations based on recycled polymers and virgin cork powder were manufactured, with cork loadings ranging from 0 wt% to 20 wt%. The maximal cork rate was chosen according to the literature results [20]. For the first time, the feasibility, morphology, and mechanical properties of the composites are analyzed, as well as their thermal decomposition and fire behavior. The results for the HDPEr and PPr–cork composites are compared. The final objective is to promote the valorization of waste streams, specifically cork and plastic polymers (HDPEr and PPr), with the ultimate aim of synthesizing a novel biosourced material. The aim is to transform discarded materials into a sustainable and environmentally friendly composite material, thus contributing to a paradigm shift towards circular and eco-conscious material use.

2. Materials and Methods

2.1. Preparation of Composites

In this study, recycled high-density polyethylene (HDPEr) and polypropylene (PPr) were used as the matrix, and virgin cork was used as the filler for the new composite. The plastic feedstock came from post-consumer bottles, in particular from plastic caps. The preparation of the plastic raw materials was carried out in 4 steps: the collection of plastic waste, sorting, washing, and grinding. The caps were collected and then manually sorted, according to their resin identification code (PP—5, HDPE—2). The categorized caps were then washed to remove any impurities and dried to remove moisture. The plastic waste was grinded (Shredder, Precious Plastic) to obtain 5 mm plastic chips. The virgin cork (Porto-Vecchio, Southern Corsica, France) was pre-cut and grinded (Polymix® PX-MCF 90 D KINEMATICA, Antwerp, Belgium). The virgin cork was then sieved in the laboratory using a 2 mm sieve, resulting in particles between 0.2 and 0.8 mm representing 65% of the mass. The polymer matrix (PPr or HDPEr) and the cork particles were mixed together in a Clextral BC21 twin-screw extruder (CLEXTRAL SAS & AFREM, Firminy, France). Five different cork loadings (0, 5, 10, 15, and 20 wt%) were used for each matrix. The rotational speed was kept at 150 rpm, the temperature range was between 160 and 200 °C, and the mixture output was 4.5 kg·h−1. The extruded compound rods were cooled in water and granulated. The pellets were dried for 4 h at 80 °C in an air-pulsed apparatus. Normalized, square sheet specimens (100 × 100 × 4 mm3, 20 samples for each composition) and dog-bone samples for mechanical testing (tensile test) were prepared by injection molding using 50-ton KraussMaffei equipment (Munich, Germany) and a temperature range of 180 to 200 °C.

2.2. Characterization of Composites

2.2.1. Morphology Study

Optical microscopy was used to analyze the surface aspect of the PPr–cork and HDPEr–cork composites. The images were obtained at 40× magnification on Leica Microsystems MD500 equipment, with an ICC 50E capture camera.
The morphology of the developed composites was examined using a Hitachi H3400N scanning electron microscope (SEM) (Ibaraki, Japan). The samples were mounted on conductive silver plates with conductive copper tape. The images were taken using a BSE detector with a beam acceleration voltage of 15 kV. The SEM images were taken at different magnifications with direct observation.

2.2.2. Mechanical Properties

The tensile properties of the cork–polymer composites were measured using a SYNTAX II Universal machine (3R, Montauban, France) with a 50 kN cell and a speed of 5 mm·min−1, according to the ISO 527 standard [40]. All the tests were performed at 23 ± 2 °C and 50% ± 10% RH. Three conditionings were considered for the samples for mechanical testing. The average deviations for the tensile properties were determined from seven samples for each conditioning set. For the first set of samples, no treatment was carried out for the PPr–cork and HDPEr–cork composites prior to the tensile strength test. For the second set, the samples were tested after an immersion in distilled water for 24 h. For the third conditioning, the composites were tested after storage at 60 °C for 24 h in an oven.

2.2.3. Thermal Decomposition

The thermal decomposition of the virgin cork and the composites were investigated using a TGA 8000 Pyris thermogravimeter (Shelton, WA, USA). The composite sheets and the virgin cork were cut into small pieces with a characteristic length of about 2 mm. A piece was then placed in a platinum crucible, corresponding to an initial mass of 5.9 (±1.1) mg and 3.0 (±0.7) mg for the composites and the virgin cork, respectively. The sample was heated to between 50 and 800 °C under air conditioning (flow of 60 mL·min−1) at a heating rate of 20 °C·min−1.

2.2.4. Fire Behavior

The higher heating value (HHV) was measured with a bomb calorimeter calibrated by the combustion of benzoic acid. The composite sheets and the virgin cork were cut into small pieces with a characteristic length of about 5 mm for the composites and 7 mm for the virgin cork. A piece was then placed in the bomb calorimeter, with an initial mass of 104.1 (±4.1) mg for the composites and 110.9 (±2.8) mg for the virgin cork. At least 3 replicates were performed for each composite. The fire behavior of the composites was investigated with a FTT cone calorimeter (ISO 5660 [41]). The square sheets of the composites were placed 25 mm from the cone heater in a standard holder. The samples had an initial mass of 36.98 (±0.45) g for the PPr–cork and 35.25 (±0.80) g for the HDPEr–cork. The composite surface was exposed to a total heat flux of 35 kW·m−2 and a piezoelectric igniter was used for pilot ignition. The heat release rate was measured by oxygen consumption calorimetry. For all the composites, the energy released per unit mass of O2 consumed for combustion was assumed to be equal to E O 2 = 13.1   M J · k g 1 [41]. The ambient temperature and the relative humidity were equal to 18.9 (±1.0) °C and 31.0 (±2.9)%, respectively. At least 3 replicates were performed for each composite. The reaction to fire of the composites was studied based on the time to ignition, the mass loss rate, the heat release rate during combustion, and the flame residence time.

3. Results and Discussion
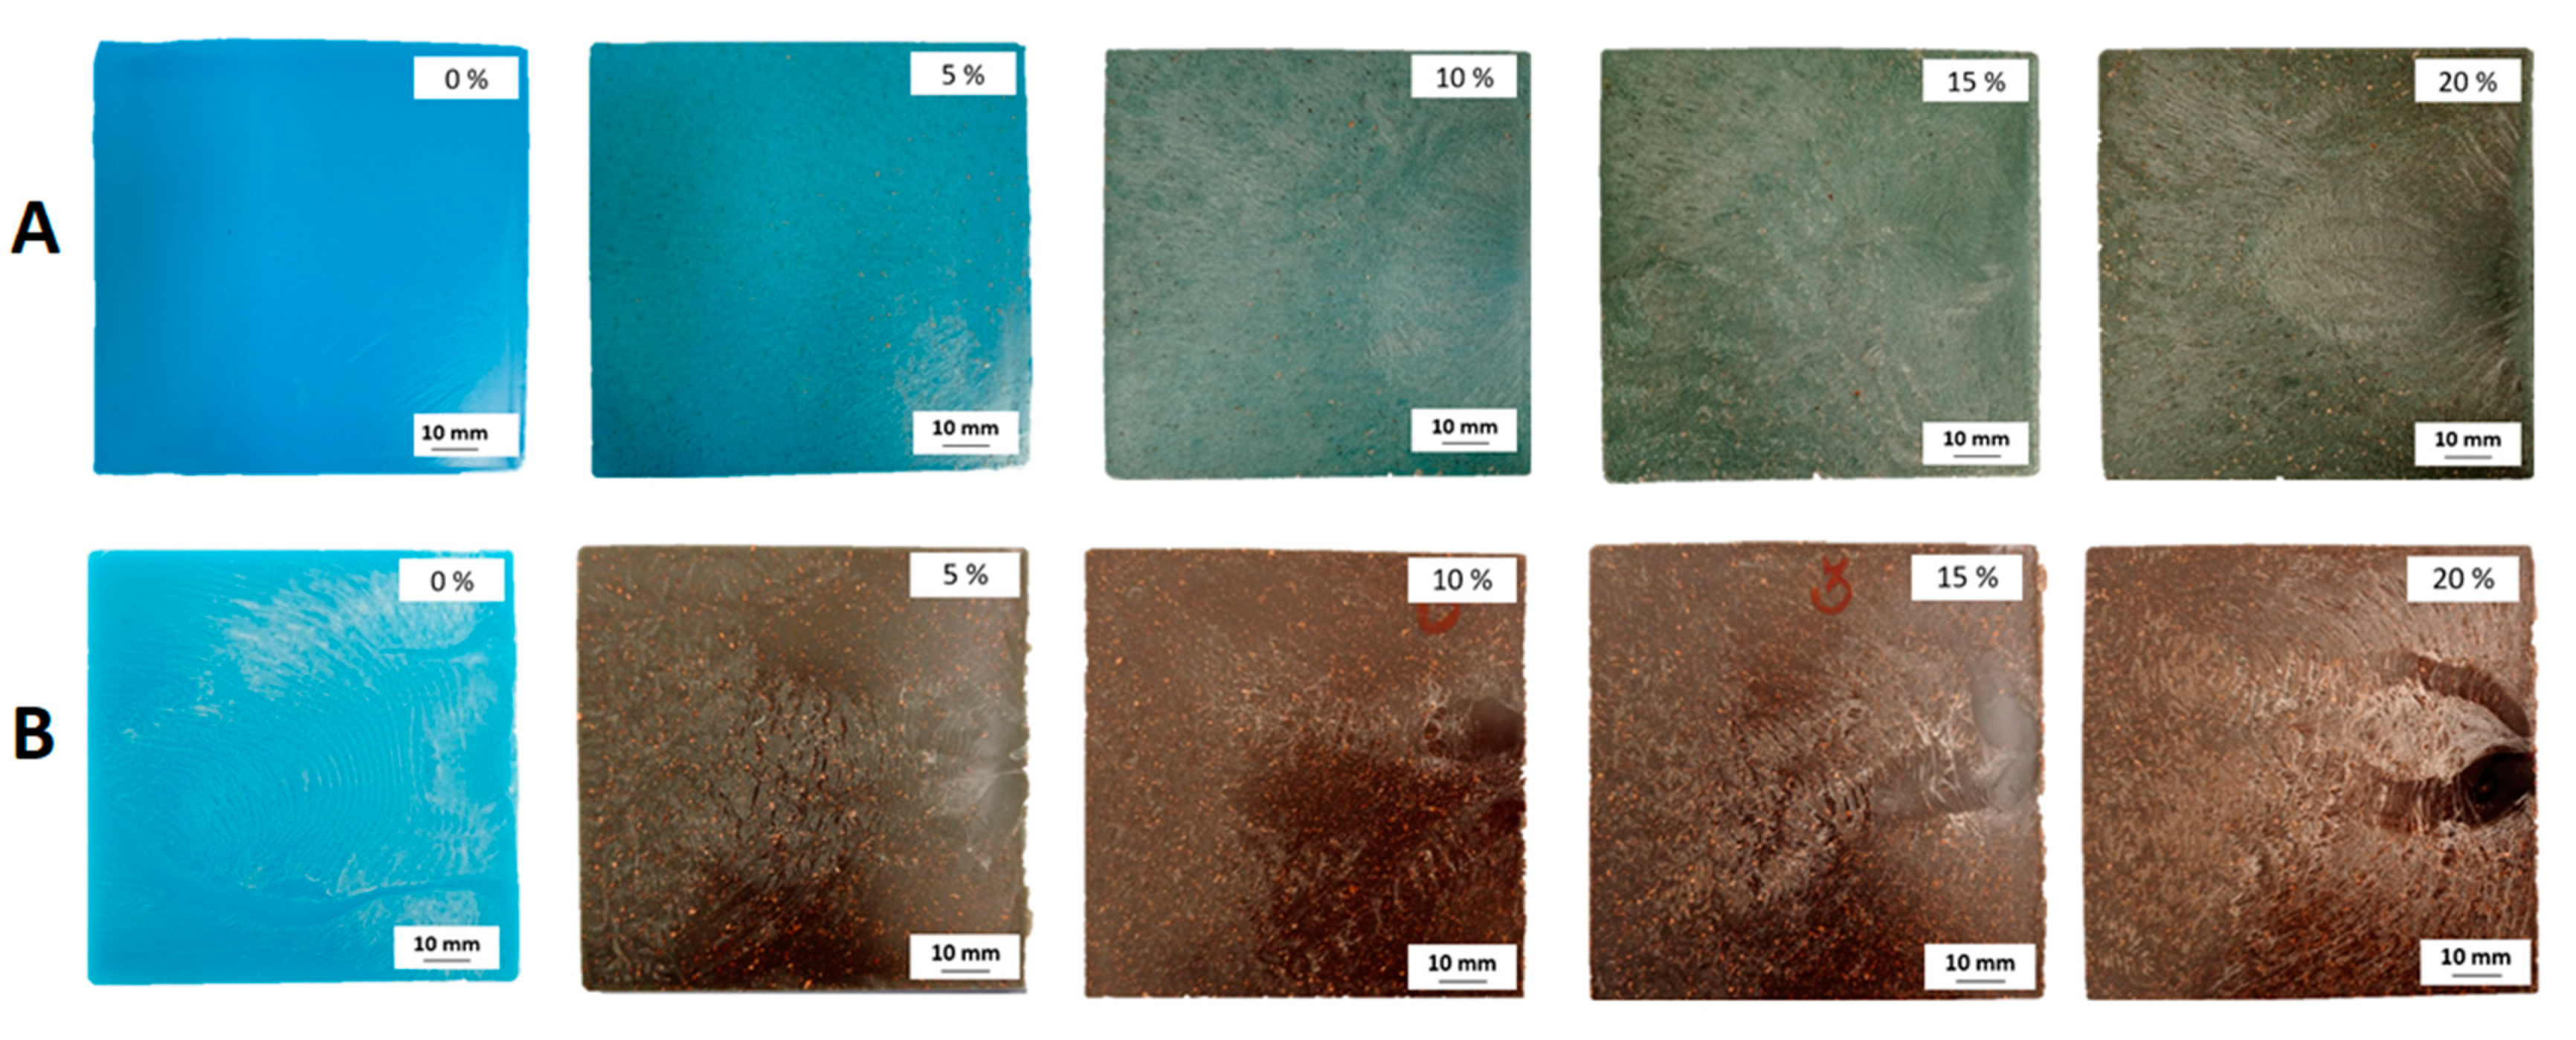
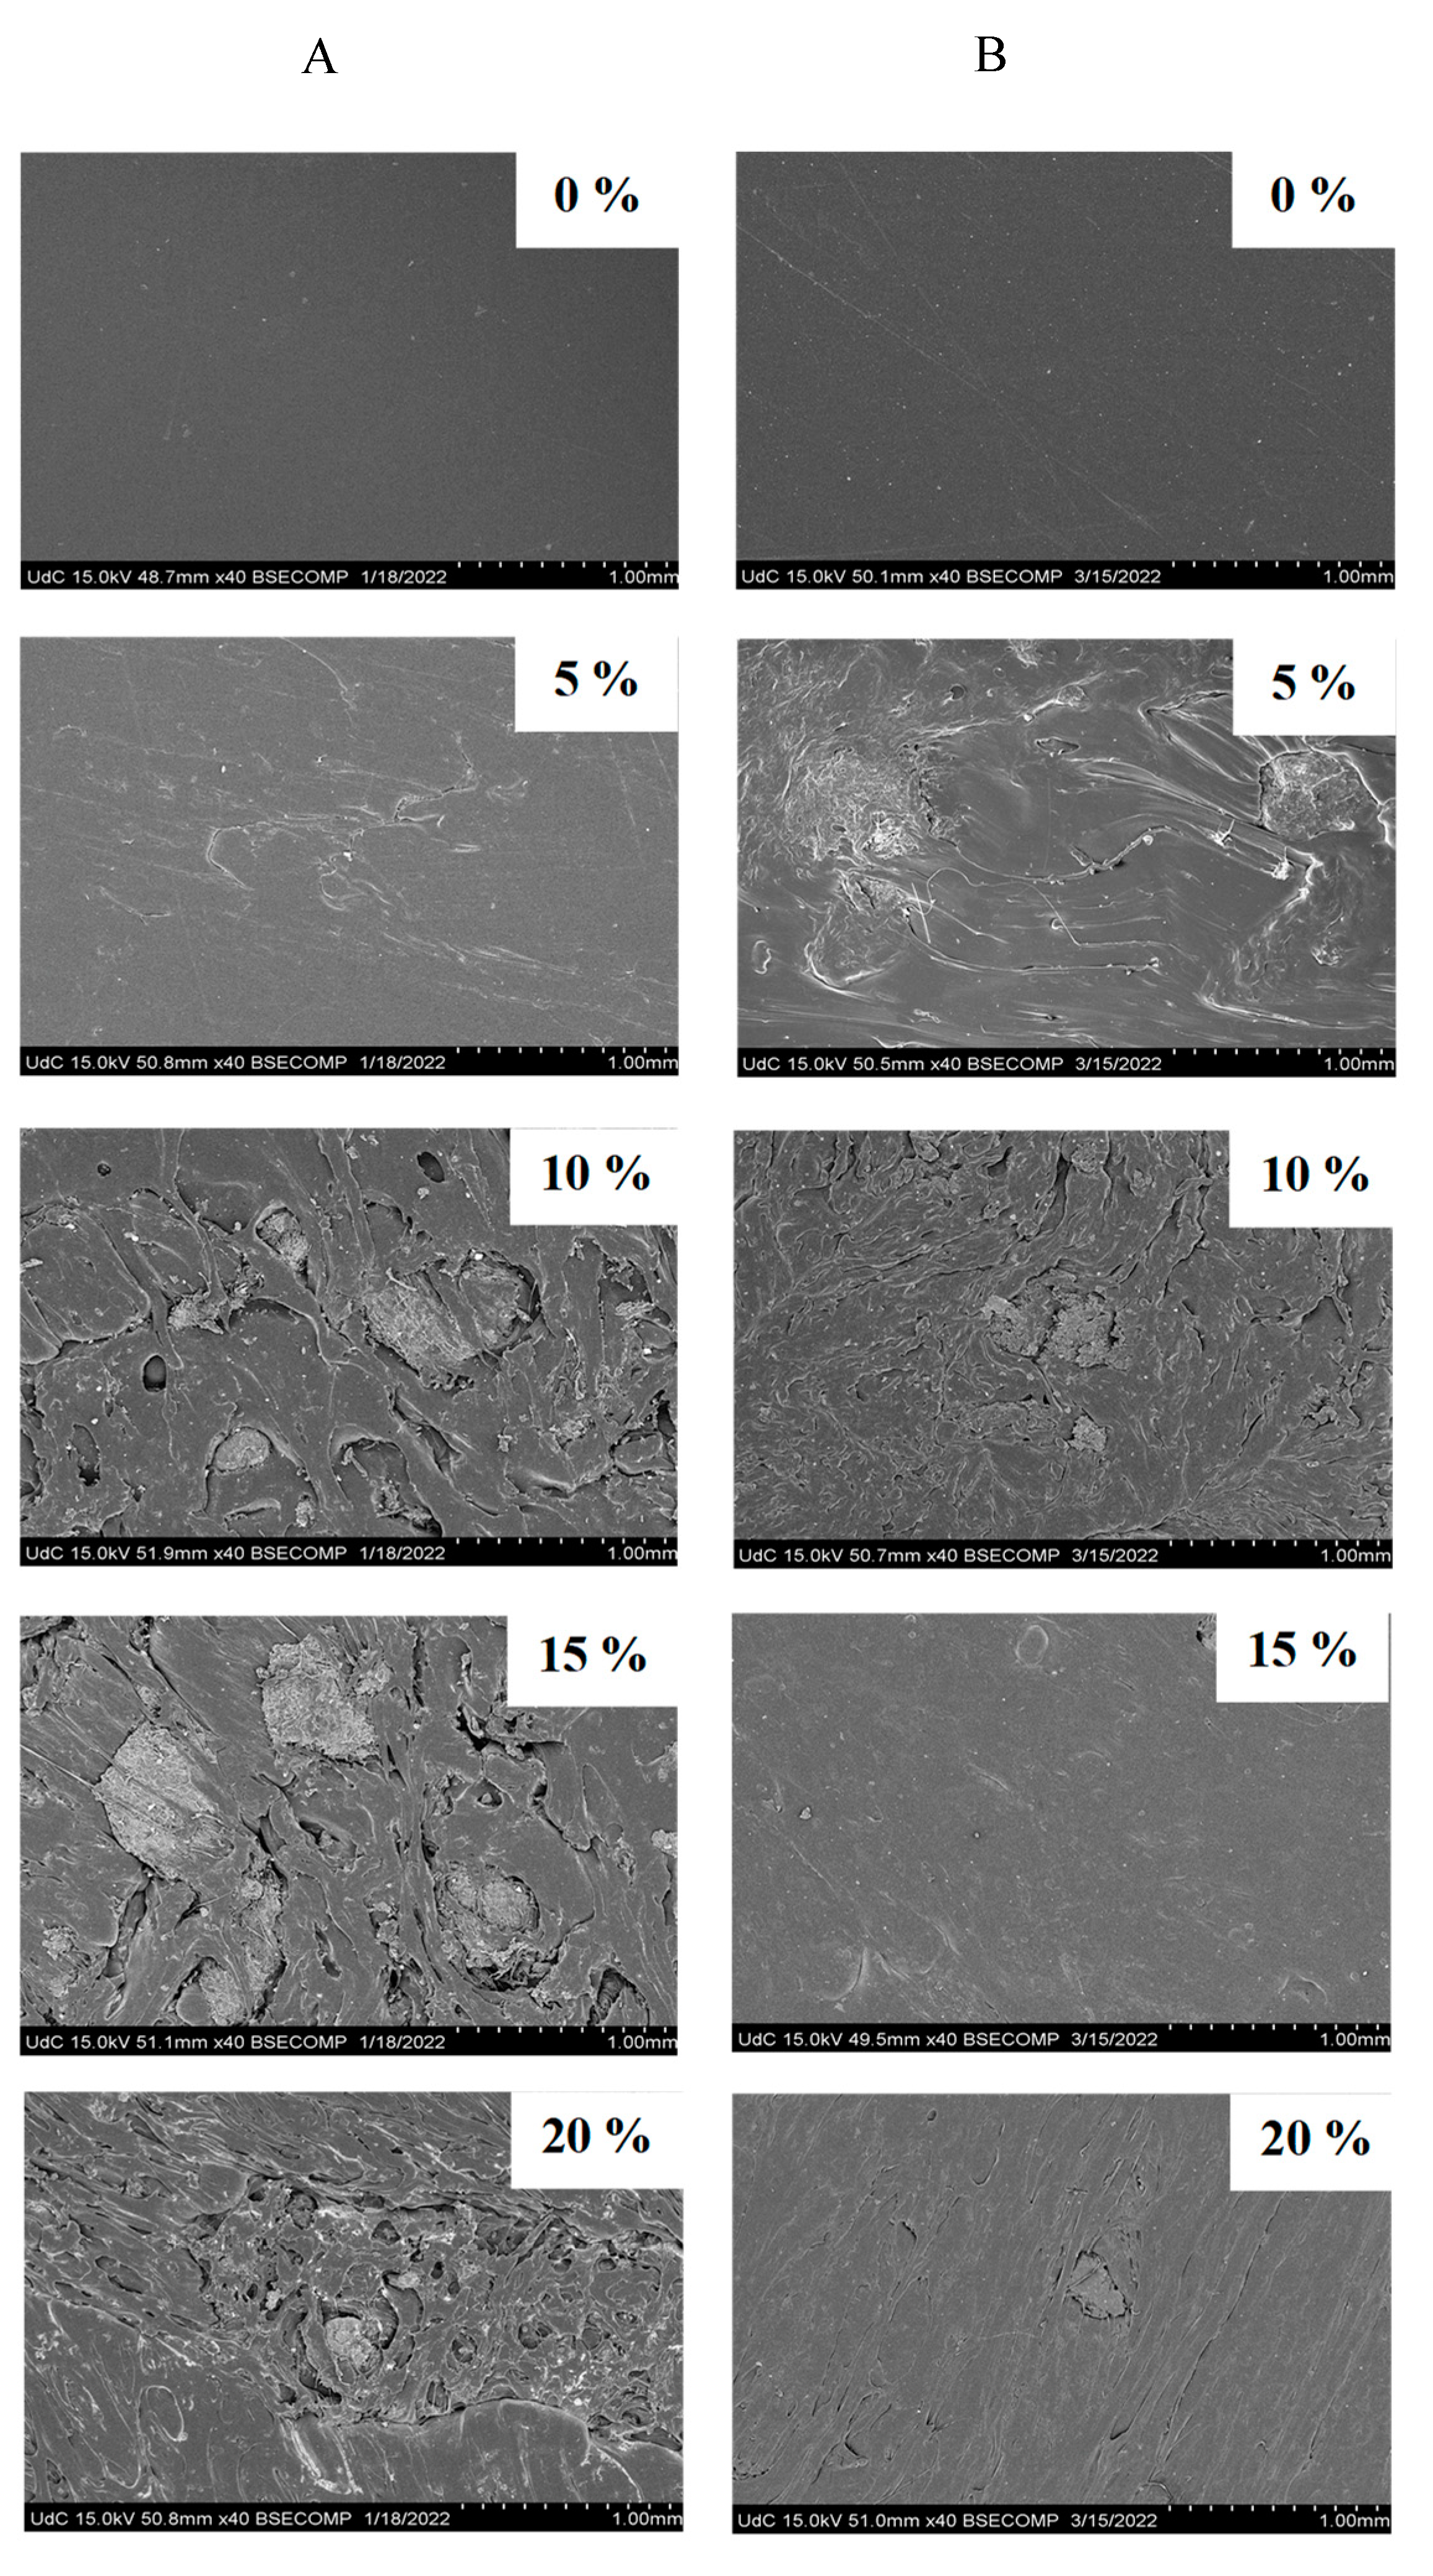
3.1. Morphology

Prior to optical microscopy and the SEM analysis, the composite samples were visually inspected. Figure 1 shows the photographs of the injection-molded composite samples.
The cork particles are clearly visible within the sample and are well dispersed throughout the matrix. There are no visible particle aggregations on the surface. However, it is not possible to say anything about how well this phase (cork particles) is dispersed and distributed in the volume of the PPr and HDPEr matrices. The cork composites show strong visual surface variations. The blue color of the sample without any cork particles is due to the original color of the plastic caps. A color change is observed with an increasing cork content. The global color is slightly darker than the initial state for the PPr–cork and HDPEr–cork composites. However, the composites based on HDPEr are darker than those for PPr, and the color of the reference samples (without cork) is similar for PPr and HDPEr. It is known that the structural properties of cork are strongly dependent on the temperature and may affect its color [42,43,44]. The color of cork changes at 150 °C, although cork does not undergo any significant chemical decomposition. This results from the extractives and hydrolyzed carbohydrates and their reactions with the cork cell wall components, especially cork lignin [45,46]. Both types of composites have a surface with a glossy aspect due to the injection molding process. The HDPEr and PPr composites also have imperfections on their surfaces at the right edge of the specimens, due to the manufacturing process and the rheology of the melt polymers.
Figure 2 shows the surface aspects of the samples of PPr–cork and HDPEr–cork composites assessed by optical microscopy as a function of the different cork contents (0, 5, 10, 15, and 20 wt%). The results of this characterization confirm the change in color with the increasing cork content of the composites.
The cork particles are clearly visible by optical microscopy (Figure 2). Different sizes of cork particles are present in both matrices (PPr–cork and HDPEr–cork composites). The results show the presence of large particles mixed with a high number of smaller particles. The difference in the size of the cork particles was already observed during the preparation of the raw materials. For the composites with 5 wt% cork in the PPr and HDPEr matrices, the cork particles are completely enclosed in the matrices. For the PPr–cork composites with higher cork contents (10, 15 and 20 wt%), a variation in the surface roughness is observed. However, the cork particles are still embedded in the matrices, but it seems that there are cavities on the surface and they are rougher. The same trend can be observed for the samples of HDPEr–cork composites.
The SEM images in Figure 3 show the structure of the composites as a function of the cork content and matrix type. In both cases, there is a change in the structure as the cork content increases, confirming the observations made of Figure 1B and Figure 2. The composites show some pull-out of the polymeric phase and a region with a gap between the two phases. It is possible to observe the voids, which indicate a low adhesion between the cork particles and the matrix. This may be due to the lack of a coupling agent or chemical treatment of the cork particles to improve the interface bonding [33]. This result differs from the work of Fernandes et al., who observed the good adhesion of cork particles to polypropylene with or without a coupling agent [20]. In addition, some microcracks are observed on the surface. In Figure 3, therefore, we observe medium-sized crushed cork particles initially produced (<2 mm). Thus, the size of the crushed cork particles observed under the microscope is around 300–400 µm, which corresponds to the majority of the crushed cork.

3.2. Mechanical Properties

In order to characterize the mechanical performance of the developed polymer–cork composites, tensile tests were carried out on the different series of samples. The mechanical tests were first carried out on the samples without conditioning prior to the mechanical tests on both sets of conditioned samples. All loads (0, 5, 10, 15, 20 wt%) of cork content were considered. The samples were stored under laboratory conditions (T = 20°, HR 50%) for 7 days before the tests. Figure 4 shows the tensile strength of the PPr–cork and HDPEr–cork composites and the photographs of the composite samples before and after the mechanical test for the particular content of 20 wt%. For the PPr–cork composites, the higher the cork content (from 0 to 20 wt%), the lower the tensile strength was. The highest tensile strength was obtained for the sample without cork particles, with a value of 30 MPa. The sample of PPr–cork composites with 20 wt% of cork content had the lowest tensile strength of these composites, with a value of 19 MPa. Several factors can explain this decrease in mechanical resistance, including the nature of the filler (cork) and the insufficient adhesion between the cork and the matrix. These factors lead to increased microstructural voids and cavities, which negatively affected the mechanical properties of the composites. The PPr–cork composites were found to have the highest tensile strength compared to the HDPEr–cork composites. This can be explained by the difference in the crystallinity of PP and HDPE, which is higher for PP [47]. For the HDPEr composites, the increase in cork content did not have a significant effect on the mechanical properties of the composite. The results show that the value of the tensile strength of the HDPEr–cork composite was quasi-constant, and about 19 MPa.
When formulating composites incorporating natural fillers, several considerations must be taken into account, such as humidity and temperature, which play a key role in the degradation of these materials. These environmental conditions can have a negative impact on the mechanical properties of the composites [48]. In order to study the degradation of cork composites by short-term aging, the PPr–cork and HDPEr–cork samples were stored in different conditions, such as in distilled water at 20 °C for 24 h and in an oven at 60 °C for 24 h. The tensile strength of the PPr–cork and HDPEr–cork composites are presented in Table 1. The results of the mechanical tests for the PPr–cork composites after total immersion in distilled water for 24 h showed a decrease in tensile strength, from 30 MPa to 19 MPa, as the filler content increases from 0 to 20 wt%. The same results were obtained for the samples stored under laboratory conditions. It is obvious that there was no significant effect on the mechanical properties of the PPr–cork composites after a short storage in water. The decrease in tensile strength was due to the interfacial adhesion between the filler and the matrix. The same trend was observed for the HDPEr–cork composites. The tensile strengths of the composites stored under laboratory conditions and in water for 24 h were similar. The effect of temperature on the mechanical properties of the PPr and HDPEr composites was also studied by storing the samples in an oven at 60 °C for 24 h. From the results presented in Table 1, it can be seen that for the PPr–cork composites, the tensile strength decreased, similar to the sample stored under laboratory conditions. For the HDPEr–cork composites, oven storage did not have a significant effect either on the mechanical properties. The value of the tensile strength was similar to that of the samples stored in laboratory conditions. Thus, the results of the mechanical tests for the PPr and HDPEr composite samples show that short storage times in the different conditions do not have a significant effect on the mechanical properties of the composites.

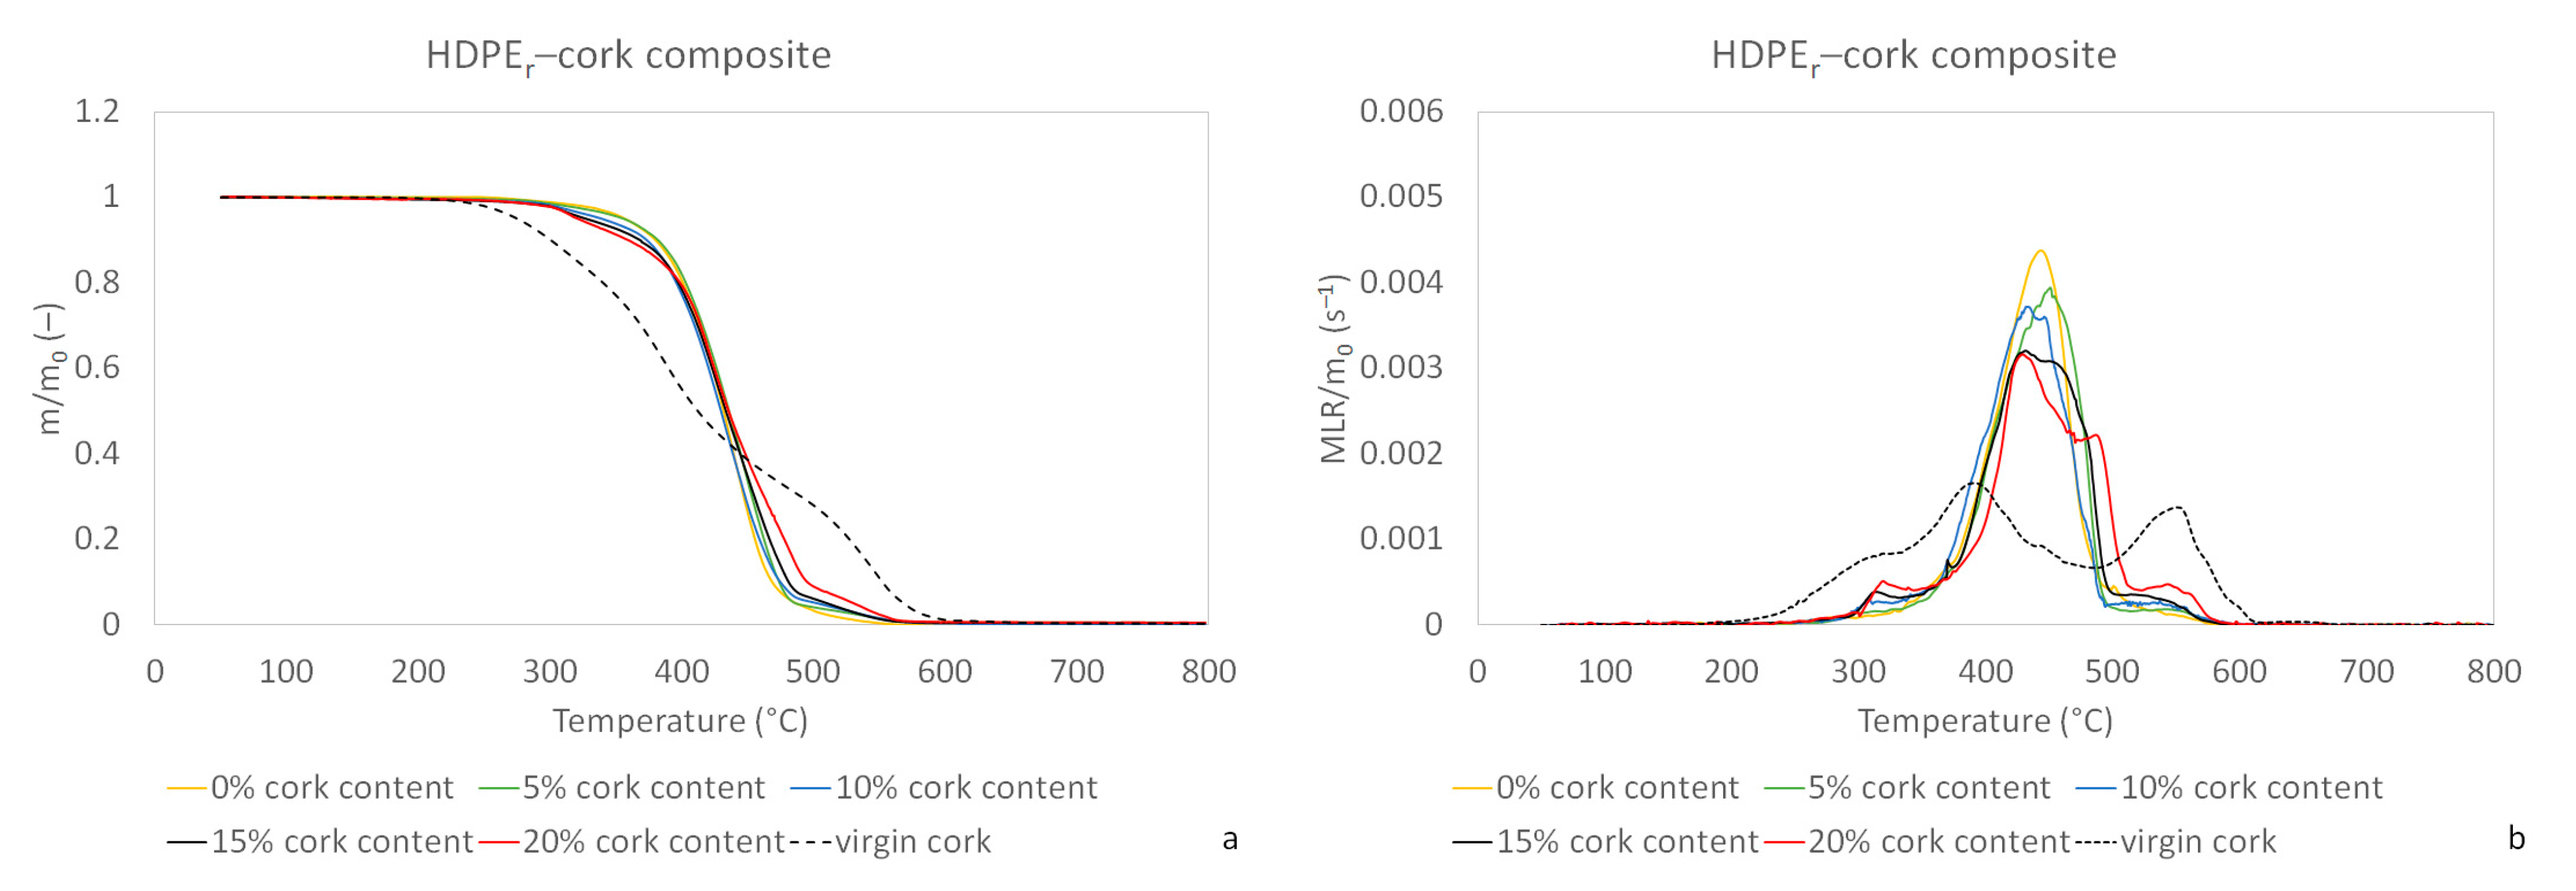
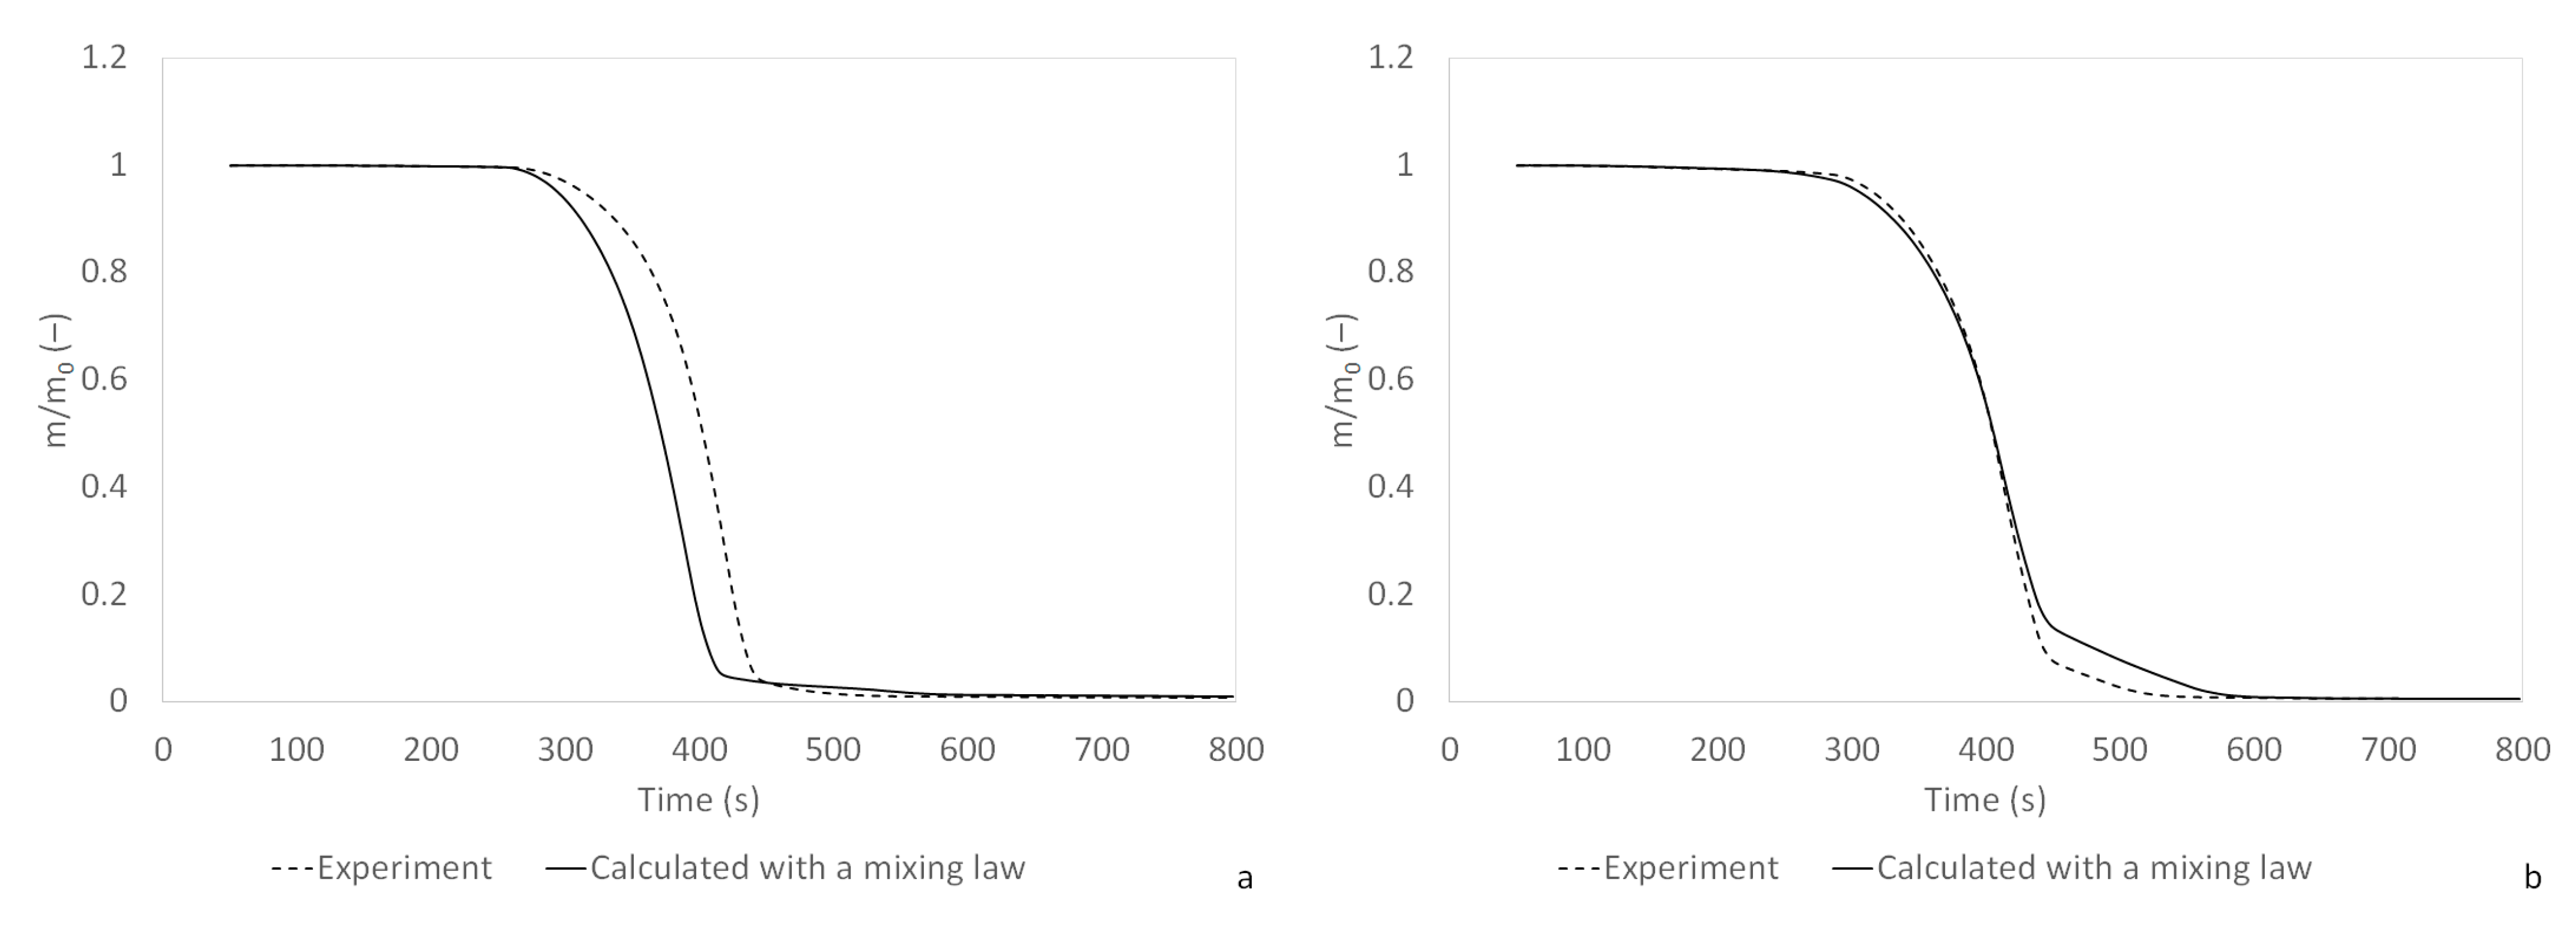
3.3. Thermal Decomposition

Figure 5 and Figure 6 present the mean mass loss and the mass loss rate divided by the initial mass (calculated over the three tests) for the different composites and the virgin cork obtained by thermogravimetry. Table 2 summarizes the peak of the MLR divided by the initial mass and the temperature at which the peak occurred for the composites. The thermal decomposition of virgin cork starts at 180 °C. The MLR curves show three main stages of decomposition. The first peak occurs at 320 °C, followed by the main decomposition peak at 390 °C. The last peak occurs at 550 °C, during char oxidation. This behavior is consistent with the literature [42,44,49,50]. For PPr and HDPEr alone (without cork), the MLR curves show a single peak. The thermal decomposition takes place between 254 °C and 500 °C for PPr, and between 298 °C and 583 °C for HDPEr. PPr, therefore, degrades at lower temperatures than HDPEr. These results are in agreement with the literature [51,52,53,54]. For PPr, the peak of the MLR occurs at 391 (±6) °C and reaches 4.45 (±0.02) × 10−3 s−1. For HDPEr, the peak of the MLR occurs at a higher temperature (443 (±3) °C) than for PPr, but is slightly lower (4.38 (±0.13) × 10−3 s−1). Thermal oxidation occurs, therefore, at a lower temperature and with a higher MLR for PPr than for HDPEr. As cork degrades, the addition of cork changes the shape of the MLR curves. For the PPr composites, a change in the onset temperature of thermal decomposition is observed, resulting in a shift of the main decomposition peak from 392 °C to 410 °C. There is also an additional plateau after 450 °C. For HDPEr, the changes are more visible, as three peaks occur: a first one around 320 °C, a second one between 400 and 500 °C and, finally, a third one around 550 °C. The peaks observed above 450 °C for both composites correspond to the char oxidation caused by the decomposition of the cork. The addition of cork to PPr delays the onset of thermal decomposition towards a higher temperature. For HDPEr, there is no significant change in the onset of thermal decomposition. By contrast, the MLR peak varies little with the cork content of PPr, whereas the MLR peak decreases with an increasing cork content of HDPEr. For all the composites, the total mass loss is greater than 99%. In order to investigate the possibility of describing the thermal decomposition of the composites from their constituents, the mass loss ( m m 0 c a l ) is calculated using the following mixing law:
m m 0 c a l = 1 Y c o r k m m 0 m a t r i x + Y c o r k m m 0 c o r k
where Y c o r k is the cork content, m m 0 m a t r i x is the mass loss of the pure HDPEr and PPr, and m m 0 c o r k is the mass loss of the virgin cork.
Figure 7 and Figure 8 show the results for HDPEr and PPr, respectively. For HDPEr, the mixing law gives results very close to the experimental behavior. The RMSE between the experimental and calculated mass loss is between 0.016 and 0.018, and tends to increase slightly with increasing cork content. For PPr, the mixing law does not allow for the description of the behavior of the composites with cork contents between 5 and 15 wt%. In fact, the RMSE is between 0.084 and 0.098 for these contents. However, the modeling is close to the experiments for a cork content of 20 wt%, with an RMSE of 0.022. This result highlights the strong influence of cork on the PPr composite.

3.4. Fire Behavior

Table 3 gives the higher heating values (HHV) for the different composites. The HHV ranges between 43.2 and 47.7 kJ·g−1 for the PPr–cork composites and between 43.4 and 47.5 kJ·g−1 for the HDPEr–cork composites. For virgin cork, the HHV is 29.6 (±0.1) kJ·g−1. The values obtained for plastics alone and virgin cork are higher than those found in the literature: 27.9 kJ·g−1 for Q. variabilis cork [55], 45.2 and 46.5 kJ·g−1 for PP, and between 43.3 and 46 5 kJ·g−1 for HDPE [56,57,58,59]. For the same cork content, the values for HDPEr–cork are slightly higher. The addition of cork reduces the HHV of the composites: −176.3 J·g−1 per percentage of cork added for the PPr–cork composites (R2 = 0.995), and −180.7 J·g−1 per percentage of cork added for the HDPEr–cork composites (R2 = 0.997).
Figure 9 shows the time to ignition of the different composites as a function of cork content. The values are also given in Table 3. Up to a cork content of 15 wt%, the ignition times of the PPr–cork composites are lower than those of the HDPEr–cork composites. This observation is in agreement with the tests performed with pure PP and HDPE [60]. At a cork content of 20 wt%, the ignition times of both composites are almost identical. These results are in agreement with the temperatures of the peak MLR measured by thermogravimetry, which are lower for the PPr–cork composites. The PPr–cork composites are, therefore, more flammable than those made with HDPE. Regarding the influence of the cork content, the ignition time decreases as the cork content increases. Therefore, the addition of cork increases the flammability of both composites. Figure 10 shows the average evolution of the mass loss divided by the initial mass, as well as the mass loss rate per unit area (MLRPUA) as a function of time for both composites, with a 15 wt% cork content. Initially, a slow mass loss is observed. Then, after ignition, the mass loss rate increases significantly, reaching a plateau corresponding to the stationary combustion phase of the whole sample. The mass loss then decreases until the flame is extinguished. For the samples with cork, an oxidation phase of the char appears after the flameout, characterized by a low mass loss rate until total extinction. This stage is more visible for the HDPEr–cork composites. In order to compare the influence of the cork on the mass loss, the average value of the MLRPUA was calculated during the quasi-stationary phase (Table 3). Figure 11 shows the results for both composites as a function of the cork content. For the PPr–cork composites, the average MLRPUA varies little with the cork content (9.8 ± 0.3 g·s−1.m−2). For the HDPEr composites, the average MLRPUA decreases linearly for a cork content ranging between 0 and 10 wt% (−0.37 g·s−1.m−2 per percentage of cork, R2 = 0.99), and then stabilizes around 9.8 ± 0.1 g·s−1.m−2. These observations are in agreement with the thermogravimetric measurements (Figure 6). In fact, the MLRs recorded for the PPr–cork composites by thermogravimetry varied little with the cork content, while those for the HDPEr composites initially decreased with an increasing cork content and then stabilized at 15 wt% cork. The MLPRUA is, therefore, higher for the HDPEr-based composites, up to 15 wt% cork. Thereafter, the values for both types of composites are equivalent.
Figure 12 shows the average evolution of the heat release rate (HRR) (calculated for the three replicates) during the combustion of the different composites. The curves follow the same trends as those for the MLRPUA. The shape of the curves change depending on the cork content. For plastics alone, the HRR increases after ignition, reaching a plateau for PPr and a shoulder for HDPEr. The HRR then increases again, reaching a peak. The HRR then decreases until the flame is extinguished. This behavior is in agreement with the literature [60,61,62], and is characteristic of the heat release rate of a thermally thick non-charring sample [63]. When cork is added, the shape of the curves change. For the PPr–cork composites, the heat release rate reaches a peak after ignition, and then a plateau appears. With an increasing cork content, the first peak becomes more dominant and the plateau disappears at a 20 wt% cork content. For the HDPEr–cork composites, the shoulder after ignition is only visible at a 5 and 10 wt% cork content. For 15 and 20 wt% cork, the HRR increases, reaching a peak and then decreasing until total extinction (without a plateau). The shape of the HRR curves for the PPr–cork and HDPEr–cork composites are representative of the behavior of thermally thick charring samples [63]. The decrease in HRR after the initial increase is due to char formation. For the PPr–cork composites, the peak HRR varies little with the cork content and is, on average, equal to 448.7 (±19.5) kW·m−2. However, the total heat release (THR) decreases linearly as the cork content increases (−0.248 MJ·kg−1 per percentage of cork, R2 = 0.95). For the HDPEr–cork composites, the peak HRR decreases linearly with the cork content (−7.6 kW·m−2 per wt% cork, R2 = 0.99). However, the THR varies little with the cork content and is, on average, equal to 38.74 (±0.23) MJ·kg−1. To complete the study of the fire behavior of the composites, the effective heat of combustion was calculated for the different samples. For each test, an average effective heat of combustion was determined by dividing the total heat released by the total mass lost [64]. The mean values for each cork content are shown in Table 3. The effective heat of combustion is equal to 42.3 (±1.2) kJ·g−1 and to 41.5 (±0.7) kJ·g−1 for PPr and HDPEr, respectively. The values are in agreement with the literature (between 40 and 44 kJ·g−1 for PP [60,61] and 42 kJ·g−1 for HDPE [60]). For both composites, the effective heat of combustion decreases with an increasing cork content. This is due to the fact that the HHV of virgin cork is lower than that of PPr and HDPEr. Except for the samples with plastic only, the effective heat of the HDPEr composites is higher than that of the PPr composites for a given cork content. This is consistent with the higher HHV values of the HDPEr composites measured with the bomb calorimeter (Table 3). The effect of cork on fire behavior can, therefore, be summarized as follows. On the one hand, the addition of cork reduces the ignition time for both composites. On the other hand, the addition of cork changes the material from a non-charring polymer to a charring material. However, the influence of cork on the heat release varies depending on the associated plastic. For the PPr–cork composites, it reduces the total heat release but does not change the peak HRR. For the HDPEr–cork composites, it reduces the peak HRR but does not affect the total heat release.

4. Conclusions

In this work, composites were prepared from recycled HDPE or PP with different virgin cork contents. The feasibility of these types of composites; the mechanical properties after different types of conditioning, which is an important property for the use of this new product; the microstructure, which has an important effect on the mechanical properties; and the thermal decomposition and fire behavior, which have to be taken into account in fire risk management, were investigated. The mechanical properties of the composites made with PPr and virgin cork were better than those made with HDPEr. Observations of the morphology of the samples suggested that a coupling agent is necessary to improve the interfacial bonding between the matrix and the filler. The addition of cork to PPr delayed the onset of thermal decomposition towards a higher temperature, whereas no significant change was observed for HDPEr. The test of the reaction of the composites to fire (imposed heat flux of 40 kW.m−2) showed that the higher the cork content, the shorter the ignition time for both composites, resulting in the higher ignitability of the composites compared to plastic alone. However, the combustibility of the composites also decreased with an increasing cork content. For the PPr–cork composites, this was observed at the THR, while for the HDPEr–cork composites it was observed at the peak HRR. The next stage of this study will concern the addition of a flame retardant to the composites in order to promote their use, particularly in building elements.

Author Contributions

Conceptualization, S.P. and T.B.; methodology, S.P. and T.B.; software, S.P. and T.B.; validation, S.P., P.-A.S. and T.B.; formal analysis, S.P., V.T.-F., C.L., Y.Q., L.F. and E.P.; investigation, S.P., S.B. and T.B; resources, S.B., L.F. and T.B; data curation, S.P., V.T.-F., C.L., Y.Q., L.F. and E.P.; writing—original draft preparation, S.P., V.T.-F. and T.B.; writing—review and editing, S.P., V.T.-F., P.-A.S., L.F. and T.B.; visualization, P.-A.S. and T.B.; supervision, P.-A.S. and T.B.; project administration, T.B.; funding acquisition, not applicable. All authors have read and agreed to the published version of the manuscript.

Funding

This research received no external funding.

Data Availability Statement

The original contributions presented in this study are included in the article; further inquiries can be directed to the corresponding author.

Conflicts of Interest

The authors declare no conflicts of interest.

References

  1. Penca, J. European Plastics Strategy: What Promise for Global Marine Litter? Mar. Policy 2018, 97, 197–201. [Google Scholar] [CrossRef]
  2. Evode, N.; Qamar, S.A.; Bilal, M.; Barceló, D.; Iqbal, H.M.N. Plastic Waste and Its Management Strategies for Environmental Sustainability. Case Stud. Chem. Environ. Eng. 2021, 4, 100142. [Google Scholar] [CrossRef]
  3. Castro-Amoedo, R.; Granacher, J.; Kantor, I.; Dahmen, A.; Barbosa-Povoa, A.; Maréchal, F. On the Role of System Integration in Plastic Waste Management. Resour. Conserv. Recycl. 2024, 201, 107295. [Google Scholar] [CrossRef]
  4. Petlitckaia, S.; Barboni, T.; Santoni, P.-A. Valorization of Plastic and Cork Wastes in the Production of New Composite Materials. In Proceedings of the 8th World Congress on Civil, Structural, and Environmental Engineering (CSEE’23), Lisbon, Portugal, 29–31 March 2023. [Google Scholar]
  5. Baillie, C.; Matovic, D.; Thamae, T.; Vaja, S. Waste-Based Composites—Poverty Reducing Solutions to Environmental Problems. Resour. Conserv. Recycl. 2011, 55, 973–978. [Google Scholar] [CrossRef]
  6. de Araújo Veloso, M.C.R.; Scatolino, M.V.; Gonçalves, M.M.B.P.; Valle, M.L.A.; de Paula Protásio, T.; Mendes, L.M.; Junior, J.B.G. Sustainable Valorization of Recycled Low-Density Polyethylene and Cocoa Biomass for Composite Production. Environ. Sci. Pollut. Res. 2021, 28, 32810–32822. [Google Scholar] [CrossRef]
  7. Kazemi Najafi, S. Use of Recycled Plastics in Wood Plastic Composites—A Review. Waste Manag. 2013, 33, 1898–1905. [Google Scholar] [CrossRef]
  8. OECD Global Plastics Outlook; OECD: Paris, France, 2022; ISBN 9789264654945.
  9. Seier, M.; Archodoulaki, V.-M.; Koch, T. The Morphology and Properties of Recycled Plastics Made from Multi-Layered Packages and the Consequences for the Circular Economy. Resour. Conserv. Recycl. 2024, 202, 107388. [Google Scholar] [CrossRef]
  10. DeWeese, A. New Uses for Old Plastics. World Wastes 1998, 41, 46–50. [Google Scholar]
  11. Ashok, A.; Rejeesh, C.R.; Renjith, R. Biodegradable Polymers for Sustainable Packaging Applications: A Review. Int. J. Bionics Biomater. 2016, 2, 1–11. [Google Scholar]
  12. Anto, T.; Rejeesh, C.R. Synthesis and Characterization of Recycled HDPE Polymer Composite Reinforced with Nano-Alumina Particles. Mater. Today Proc. 2023, 72, 3177–3182. [Google Scholar] [CrossRef]
  13. Teuber, L.; Osburg, V.-S.; Toporowski, W.; Militz, H.; Krause, A. Wood Polymer Composites and Their Contribution to Cascading Utilisation. J. Clean. Prod. 2016, 110, 9–15. [Google Scholar] [CrossRef]
  14. Jubinville, D.; Esmizadeh, E.; Tzoganakis, C.; Mekonnen, T. Thermo-Mechanical Recycling of Polypropylene for the Facile and Scalable Fabrication of Highly Loaded Wood Plastic Composites. Compos. B Eng. 2021, 219, 108873. [Google Scholar] [CrossRef]
  15. Sommerhuber, P.F.; Wenker, J.L.; Rüter, S.; Krause, A. Life Cycle Assessment of Wood-Plastic Composites: Analysing Alternative Materials and Identifying an Environmental Sound End-of-Life Option. Resour. Conserv. Recycl. 2017, 117, 235–248. [Google Scholar] [CrossRef]
  16. Zimmermann, M.V.G.; Zattera, A.J. Recycling and Reuse of Waste from Electricity Distribution Networks as Reinforcement Agents in Polymeric Composites. Waste Manag. 2013, 33, 1667–1674. [Google Scholar] [CrossRef]
  17. Valente, M.; Sarasini, F.; Marra, F.; Tirillò, J.; Pulci, G. Hybrid Recycled Glass Fiber/Wood Flour Thermoplastic Composites: Manufacturing and Mechanical Characterization. Compos. Part A Appl. Sci. Manuf. 2011, 42, 649–657. [Google Scholar] [CrossRef]
  18. Sommerhuber, P.F.; Welling, J.; Krause, A. Substitution Potentials of Recycled HDPE and Wood Particles from Post-Consumer Packaging Waste in Wood–Plastic Composites. Waste Manag. 2015, 46, 76–85. [Google Scholar] [CrossRef]
  19. Winandy, J.E.; Starck, N.M.; Clemons, C.M. Considerations in Recycling of Wood-Plastic Composites. In Proceedings of the 5th Global Wood and Natural Fibre Composites Symposium, Kassel, Germany, 27–28 April 2004. [Google Scholar]
  20. Fernandes, E.M.; Correlo, V.M.; Mano, J.F.; Reis, R.L. Polypropylene-Based Cork–Polymer Composites: Processing Parameters and Properties. Compos. B Eng. 2014, 66, 210–223. [Google Scholar] [CrossRef]
  21. Fernandes, E.M.; Correlo, V.M.; Mano, J.F.; Reis, R.L. Cork–Polymer Biocomposites: Mechanical, Structural and Thermal Properties. Mater. Des. 2015, 82, 282–289. [Google Scholar] [CrossRef]
  22. Stanaszek-Tomal, E. Recycling of Wood-Polymer Composites in Relation to Substrates and Finished Products. IOP Conf. Ser. Mater. Sci. Eng. 2020, 960, 022053. [Google Scholar] [CrossRef]
  23. Silva, S.P.; Sabino, M.A.; Fernandes, E.M.; Correlo, V.M.; Boesel, L.F.; Reis, R.L. Cork: Properties, Capabilities and Applications. Int. Mater. Rev. 2005, 50, 345–365. [Google Scholar] [CrossRef]
  24. Rives, J.; Fernandez-Rodriguez, I.; Gabarrell, X.; Rieradevall, J. Environmental Analysis of Cork Granulate Production in Catalonia–Northern Spain. Resour. Conserv. Recycl. 2012, 58, 132–142. [Google Scholar] [CrossRef]
  25. Pereira, H. Chemical Composition and Variability of Cork from Quercus suber L. Wood Sci. Technol. 1988, 22, 211–218. [Google Scholar] [CrossRef]
  26. Pereira, H. Studies on the Chemical Composition of Virgin and Reproduction Cork of Quercus suber L. In Anais do Instituto Superior de Agronomia; Instituto Superior de Agronomia: Lisbon, Portugal, 1982; Volume 40, pp. 17–25. [Google Scholar]
  27. Leite, C.; Oliveira, V.; Miranda, I.; Pereira, H. Cork Oak and Climate Change: Disentangling Drought Effects on Cork Chemical Composition. Sci. Rep. 2020, 10, 7800. [Google Scholar] [CrossRef]
  28. Filomena Bento, M.; Aurea Cunha, M.; Moutinho, A.M.C.; Pereira, H.; Fortes, M.A. A Mass Spectrometry Study of Thermal Dissociation of Cork. Int. J. Mass Spectrom. Ion Process. 1992, 112, 191–204. [Google Scholar] [CrossRef]
  29. Pereira, H.; Tomé, M. Non-Wood Products, Cork Oak. In Encyclopedia of Forest Sciences; Burley, J., Evans, J., Youngquist, J.A., Eds.; Elsevier Academic Press: Amsterdam, The Netherlands, 2004; pp. 613–621. [Google Scholar]
  30. Gibson, L.J. Biomechanics of Cellular Solids. J. Biomech. 2005, 38, 377–399. [Google Scholar] [CrossRef]
  31. Gibson, L.J. Cellular Solids. MRS Bull. 2003, 28, 270–274. [Google Scholar] [CrossRef]
  32. Gibson, L.J.; Easterling, K.E.; Ashby, M.F. The Structure and Mechanics of Cork. Proc. R. Soc. Lond. A Math. Phys. Sci. 1981, 377, 99–117. [Google Scholar] [CrossRef]
  33. Fernandes, E.M.; Correlo, V.M.; Chagas, J.A.M.; Mano, J.F.; Reis, R.L. Cork Based Composites Using Polyolefin’s as Matrix: Morphology and Mechanical Performance. Compos. Sci. Technol. 2010, 70, 2310–2318. [Google Scholar] [CrossRef]
  34. Vilela, C.; Sousa, A.F.; Freire, C.S.R.; Silvestre, A.J.D.; Pascoal Neto, C. Novel Sustainable Composites Prepared from Cork Residues and Biopolymers. Biomass Bioenergy 2013, 55, 148–155. [Google Scholar] [CrossRef]
  35. Fernandes, E.M.; Correlo, V.M.; Chagas, J.A.M.; Mano, J.F.; Reis, R.L. Properties of New Cork–Polymer Composites: Advantages and Drawbacks as Compared with Commercially Available Fibreboard Materials. Compos. Struct. 2011, 93, 3120–3129. [Google Scholar] [CrossRef]
  36. Magalhães da Silva, S.P.; Lima, P.S.; Oliveira, J.M. Rheological Behaviour of Cork-Polymer Composites for Injection Moulding. Compos. B Eng. 2016, 90, 172–178. [Google Scholar] [CrossRef]
  37. Andrzejewski, J.; Szostak, M.; Barczewski, M.; Łuczak, P. Cork-Wood Hybrid Filler System for Polypropylene and Poly(Lactic Acid) Based Injection Molded Composites. Structure Evaluation and Mechanical Performance. Compos. B Eng. 2019, 163, 655–668. [Google Scholar] [CrossRef]
  38. Dairi, B.; Bellili, N.; Hamour, N.; Boulassel, A.; Djidjelli, H.; Boukerrou, A.; Bendib, R. Cork Waste Valorization as Reinforcement in High-Density Polyethylene Matrix. Mater. Today Proc. 2022, 53, 117–122. [Google Scholar] [CrossRef]
  39. Vasconcelos, G.C.M.S.D.; Carvalho, L.H.D.; Barbosa, R.; Idalino, R.D.C.D.L.; Alves, T.S. Effects of Weathering on Mechanical and Morphological Properties Cork Filled Green Polyethylene Eco-Composites. Polímeros 2020, 30, e2020011. [Google Scholar] [CrossRef]
  40. ISO 5660-1:2015; Reaction-to-Fire Tests–Heat Release, Smoke Production and Mass Loss Rate–Part 1: Heat Release Rate (Cone Calorimeter Method) and Smoke Production Rate (Dynamic Measurement). ISO: Geneva, Switzerland, 2015.
  41. ISO 527-1:2012; Plastics—Determination of Tensile Properties. ISO: Geneva, Switzerland, 2012.
  42. Rosa, M.E.; Fortes, M.A. Thermogravimetric Analysis of Cork. J. Mater. Sci. Lett. 1988, 7, 1064–1065. [Google Scholar] [CrossRef]
  43. Rosa, M.E.; Fortes, M.A. Temperature-Induced Alterations of the Structure and Mechanical Properties of Cork. Mater. Sci. Eng. 1988, 100, 69–78. [Google Scholar] [CrossRef]
  44. Şen, A.; Van den Bulcke, J.; Defoirdt, N.; Van Acker, J.; Pereira, H. Thermal Behaviour of Cork and Cork Components. Thermochim. Acta 2014, 582, 94–100. [Google Scholar] [CrossRef]
  45. Pereira, H. Cork: Biology Production and Uses; Elsevier: Amsterdam, The Netherlands, 2007; ISBN 9780444529671. [Google Scholar]
  46. Şen, A.; Marques, A.V.; Gominho, J.; Pereira, H. Study of Thermochemical Treatments of Cork in the 150–400 °C Range Using Colour Analysis and FTIR Spectroscopy. Ind. Crops Prod. 2012, 38, 132–138. [Google Scholar] [CrossRef]
  47. Gulitah, V.; Liew, K.C. Morpho-Mechanical Properties of Wood Fiber Plastic Composite (WFPC) Based on Three Different Recycled Plastic Codes. Int. J. Biobased Plast. 2019, 1, 22–30. [Google Scholar] [CrossRef]
  48. Espert, A.; Vilaplana, F.; Karlsson, S. Comparison of Water Absorption in Natural Cellulosic Fibres from Wood and One-Year Crops in Polypropylene Composites and Its Influence on Their Mechanical Properties. Compos. Part A Appl. Sci. Manuf. 2004, 35, 1267–1276. [Google Scholar] [CrossRef]
  49. Pereira, H. The Thermochemical Degradation of Cork. Wood Sci. Technol. 1992, 26, 259–269. [Google Scholar] [CrossRef]
  50. Şen, U.; Pereira, H. Pyrolysis Behavior of Alternative Cork Species. J. Therm. Anal. Calorim. 2022, 147, 4017–4025. [Google Scholar] [CrossRef]
  51. Briceno, J.; Lemos, M.A.; Lemos, F. Kinetic Analysis of the Degradation of HDPE+PP Polymer Mixtures. Int. J. Chem. Kinet. 2021, 53, 660–674. [Google Scholar] [CrossRef]
  52. Westerhout, R.W.J.; Waanders, J.; Kuipers, J.A.M.; van Swaaij, W.P.M. Kinetics of the Low-Temperature Pyrolysis of Polyethene, Polypropene, and Polystyrene Modeling, Experimental Determination, and Comparison with Literature Models and Data. Ind. Eng. Chem. Res. 1997, 36, 1955–1964. [Google Scholar] [CrossRef]
  53. Kim, H.T.; Oh, S.C. Kinetics of Thermal Degradation of Waste Polypropylene and High-Density Polyethylene. J. Ind. Eng. Chem. 2005, 11, 648–656. [Google Scholar]
  54. Gianelli, W.; Ferrara, G.; Camino, G.; Pellegatti, G.; Rosenthal, J.; Trombini, R.C. Effect of Matrix Features on Polypropylene Layered Silicate Nanocomposites. Polymer 2005, 46, 7037–7046. [Google Scholar] [CrossRef]
  55. Wu, S.; Song, X.; Lei, Y.; Zhu, M. Characterizations and Properties of Torrefied Quercus Variabilis Cork. Wood Res. 2018, 63, 947–957. [Google Scholar]
  56. Chattopadhyay, J.; Pathak, T.S.; Srivastava, R.; Singh, A.C. Catalytic Co-Pyrolysis of Paper Biomass and Plastic Mixtures (HDPE (High Density Polyethylene), PP (Polypropylene) and PET (Polyethylene Terephthalate)) and Product Analysis. Energy 2016, 103, 513–521. [Google Scholar] [CrossRef]
  57. Petrovič, A.; Čolnik, M.; Prša, A.; Fan, Y.V.; Škerget, M.; Knez, Z.; Klemeš, J.K.; Čuček, L. Comparative Analysis of Virgin and Recycled Thermoplastic Polymer Based on Thermochemical Characteristics. Chem. Eng. Trans. 2022, 94, 1321–1326. [Google Scholar] [CrossRef]
  58. Pietrelli, L.; Poeta, G.; Battisti, C.; Sighicelli, M. Characterization of Plastic Beach Debris Finalized to Its Removal: A Proposal for a Recycling Scheme. Environ. Sci. Pollut. Res. 2017, 24, 16536–16542. [Google Scholar] [CrossRef]
  59. Al-Salem, S.M.; Lettieri, P.; Baeyens, J. Recycling and Recovery Routes of Plastic Solid Waste (PSW): A Review. Waste Manag. 2009, 29, 2625–2643. [Google Scholar] [CrossRef]
  60. Scudamore, M.J.; Briggs, P.J.; Prager, F.H. Cone Calorimetry—A Review of Tests Carried out on Plastics for the Association of Plastic Manufacturers in Europe. Fire Mater. 1991, 15, 65–84. [Google Scholar] [CrossRef]
  61. Hernandez, N.; Sonnier, R.; Giraud, S. Influence of Grammage on Heat Release Rate of Polypropylene Fabrics. J. Fire Sci. 2018, 36, 30–46. [Google Scholar] [CrossRef]
  62. Patel, R.J.; Wang, Q. Prediction of Properties and Modeling Fire Behavior of Polyethylene Using Cone Calorimeter. J. Loss Prev. Process Ind. 2016, 41, 411–418. [Google Scholar] [CrossRef]
  63. Schartel, B.; Hull, T.R. Development of Fire-retarded Materials—Interpretation of Cone Calorimeter Data. Fire Mater. 2007, 31, 327–354. [Google Scholar] [CrossRef]
  64. Babrauskas, V. Effective Heat of Combustion for Flaming Combustion of Conifers. Can. J. For. Res. 2006, 36, 659–663. [Google Scholar] [CrossRef]
Figure 1. Produced (A) PP–cork and (B) HDPE–cork composite square sheet.
Jcs 08 00195 g001
Figure 2. Surface aspects of specimens of (A) PPr–cork and (B) HDPEr–cork composites assessed by optical microscopy.
Jcs 08 00195 g002
Figure 3. SEM images of the (A) PPr–cork and (B) HDPEr–cork composites.
Jcs 08 00195 g003
Figure 4. (A) Tensile strength of PPr–cork (green) and HDPEr–cork (blue) composites. (B) Photographs of samples of composites with 20 wt% of cork before and after mechanical test.
Jcs 08 00195 g004
Figure 5. (a) Mass loss divided by the initial mass. (b) Mass loss rate divided by the initial mass—as a function of the temperature for the PPr–cork composites.
Jcs 08 00195 g005
Figure 6. (a) Mass loss divided by the initial mass. (b) Mass loss rate divided by the initial mass—as a function of the temperature for the HDPEr–cork composites.
Jcs 08 00195 g006
Figure 7. Comparison of the experimental mass loss and the mass loss calculated with the mixing law for (a) 95% of HDPEr and 5 wt% of cork (RMSE = 0.016) and (b) 80% of HDPEr and 20 wt% of cork (RMSE = 0.018).
Jcs 08 00195 g007
Figure 8. Comparison of the experimental mass loss and the mass loss calculated with the mixing law for (a) 95% of PPr and 5 wt% of cork (RMSE = 0.096) and (b) 80% of PPr and 20 wt% of cork (RMSE = 0.021).
Jcs 08 00195 g008
Figure 9. Ignition time of the PPr–cork and HDPEr–cork composites.
Jcs 08 00195 g009
Figure 10. Mean mass and MLRPUA for (a) PPr composite and (b) HDPEr composite—with a cork content of 15 wt%.
Jcs 08 00195 g010
Figure 11. Average of the MLRPUA calculated during the quasi-stationary phase of combustion.
Jcs 08 00195 g011
Figure 12. Mean heat release rate for the (a) PPr–cork and (b) HDPEr–cork composites.
Jcs 08 00195 g012
Table 1. Tensile strength of the PPr–cork and HDPEr–cork composites stored in different conditions.
CompositesCork Content (wt%)Maximal Tensile Strength (MPa)
Laboratory ConditionsWater, 20 °C, 24 hOven, 60 °C, 24 h
PP–Cork030.3 (±0.1)30.1 (±0.2)30.3 (±0.1)
527.4 (±0.1)27.2 (±0.4)27.6 (±0.2)
1023.5 (±0.3)23.8 (±0.4)23.5 (±0.5)
1521.2 (±0.1)21.0 (±0.2)20.7 (±0.2)
2019.0 (±0.2)18.8 (±0.3)18.9 (±0.1)
HDPE–Cork018.9 (±0.3)18.5 (±0.4)19.7 (±0.2)
518.7 (±0.1)19.1 (±0.1)18.7 (±0.1)
1017.8 (±0.1)18.1 (±0.3)18.0 (±0.2)
1517.9 (±0.2)17.9 (±0.3)17.8 (±0.2)
2017.9 (±0.2)17.8 (±0.3)17.7 (±0.1)
Table 2. Characteristic quantities of thermal decomposition of composites.
CompositesCork Content (wt%)Peak of MLR Divided Temperature of the Peak of MLR (°C)
by the Initial Mass (10−3 s−1)
PPr–Cork04.45 (±0.02)391 (±6)
54.46 (±0.11)392 (±2)
104.82 (±0.03)408 (±1)
154.45 (±0.05)409 (±1)
204.31 (±0.10)410 (±3)
HDPEr–Cork04.38 (±0.13)443 (±3)
53.95 (±0.21)450 (±8)
103.72 (±0.55)434 (±1)
153.21 (±0.16)431 (±6)
203.16 (±0.19)429 (±4)
Table 3. Higher heating values of the PPr–cork and HDPEr–cork composites and ignition time, mean MLRPUA, and peak of HRR and THR for the reaction to fire tests performed with the cone calorimeter.
CompositesCork Content (wt%)High Heating ValueTime toMean MLRPUA (g·s−1·m−2)Peak of HRR (kW·m−2)THR (MJ·kg−1)Heff
(kJ·g−1)Ignition (s)(kJ·g−1)
PPr–Cork047.7 (±0.4)72 (±17)9.3 (±0.2)436 (±22)40.7 (±0.9)42.3 (±1.2)
546.6 (±0.0)32 (±6)10.1 (±1.2)470 (±50)39.4 (±0.7)40.2 (±0.4)
1045.1 (±0.1)31 (±1)10.0 (±1.3)447 (±64)37.3 (±0.8)38.1 (±0.4)
1543.9 (±0.1)31 (±3)10.1 (±1.2)470 (±23)37.0 (±0.6)37.5 (±0.4)
2043.2 (±0.2)34 (±6)9.6 (±1.3)420 (±61)35.7 (±1.1)37.3 (±0.9)
HDPEr–Cork047.5 (±0.2)87 (±19)13.7 (±0.0)559 (±25)38.4 (±0.9)41.5 (±0.7)
547.0 (±0.2)52 (±8)11.7 (±1.8)527 (±61)38.9 (±1.4)40.9 (±0.2)
1045.9 (±0.2)46 (±9)9.9 (±0.8)488 (±24)38.6 (±0.1)40.1 (±0.2)
1545.4 (±0.2)38 (±11)9.8 (±1.6)446 (±55)39.0 (±0.7)39.3 (±1.1)
2043.4 (±0.5)32 (±5)9.7 (±0.6)409 (±31)38.7 (±1.1)38.2 (±0.7)
Disclaimer/Publisher’s Note: The statements, opinions and data contained in all publications are solely those of the individual author(s) and contributor(s) and not of MDPI and/or the editor(s). MDPI and/or the editor(s) disclaim responsibility for any injury to people or property resulting from any ideas, methods, instructions or products referred to in the content.

