Article

Experimental Comparative Analysis of the Through-Thickness and In-Plane Compression Moduli of Unidirectional CFRP Laminates

by
Raffael Bogenfeld
German Aerospace Center, Institute of Lightweight Systems, Lilienthalplatz 7, 38108 Braunschweig, Germany
J. Compos. Sci. 2024, 8(2), 76; https://doi.org/10.3390/jcs8020076
Submission received: 28 November 2023 / Revised: 22 December 2023 / Accepted: 7 February 2024 / Published: 13 February 2024
(This article belongs to the Special Issue Characterization and Modelling of Composites, Volume III)

Abstract

:
This study explores the experimental characterization of the through-thickness compression properties in unidirectional laminates using cube compression tests. Cubical specimens, each with an edge length of 10 mm, were symmetrically outfitted with biaxial strain gauges and subjected to a compression test. While similar methodologies exist in the literature, this work primarily addresses the potential biases inherent in the testing procedure and their mitigation. The influence of friction-induced non-uniform deformation behavior is compensated through a scaling of the stiffness measurements using finite element (FE) analysis results. This scaling significantly enhances the accuracy of the resulting parameters of the experiments. The ultimate failure of the specimens, originating from stress concentrations at the edges, resulted in fracture angles ranging between 60 ° and 67 ° . Such fracture patterns, consistent with findings from other researchers, are attributed to shear stress induced by friction at the load introduction faces. The key findings of this research are the comparisons between the through-thickness modulus ( E 33 c ) and strength ( X 33 c ) and their in-plane counterparts ( E 22 c and X 22 c ). The results indicate deteriorations of E 33 c and X 33 c from E 22 c and X 22 c by margins of 5 % and 7 %, respectively. Furthermore, the results for E 22 c and X 22 c were compared with the results obtained through a standard test, revealing a 12 % enhancement in strength X 22 c and 4 % underestimated stiffness E 22 c in the cube compression test.

1. Introduction

Composite laminates are extensively used in diverse industries, including aerospace, automotive, and civil engineering. They offer superior design options due to their high strength-to-weight ratio, design flexibility, and tailorability of their mechanical properties. The fiber-reinforced plies from which a composite is made provide enhanced strength and stiffness in the plane of the laminate. However, the out-of-plane properties of a laminate remain unaffected by the superior capabilities of the fiber reinforcement. Consequently, composites are primarily designed to withstand in-plane loads. Still, there are various scenarios where composite laminates can be subjected to significant out-of-plane loads affecting the overall performance and longevity of a composite structure.
For example, through-thickness loading occurs at the mounting areas of composite rotor blades [1], clamped joints, or fasteners [2]. The localized loading around a fastener introduces significant out-of-plane compression stress, and the through-thickness modulus crucially determines the deformed state. Furthermore, hemispherical composite bearings for tracked vehicles need to withstand significant out-of-plane loads [3]. The respective load scenarios require a sufficient through-thickness strength and stiffness to prevent failure. In addition, many composite structures are exposed to accidental out-of-plane impact loading [4,5]. While such impact events do not represent the design load, they might cause significant damage to the laminate because an impact locally applies a notable out-of-plane force. The consequential bending deformation is accompanied by large through-thickness stresses [6,7]. The evolution of laminate damage significantly depends on the laminate’s capability to deform elastically [8] and the ply strength parameters. The local surface indentation according to the Hertzian contact law [9] is driven by the laminate’s through-thickness modulus and the Young’s modulus of the indentor. The resulting permanent dent is key to the determination of the design points for the damage tolerance [10]. Hence, reliable through-thickness properties are required for an enhanced assessment of a composite laminate’s performance.
One of the pivotal properties characterizing the through-thickness properties is the compression modulus E 33 c , which is a measure of a material’s resistance to deformation in its thickness direction when subjected to compression load. The out-of-plane force affects the overall performance and durability of the structures, particularly when dealing with out-of-plane loads and impacts.
A common assumption is that the out-of-plane stiffness E 33 is often obtained by setting it equal to the in-plane stiffness E 22 [11,12,13,14,15]. Due to the closeness of both values and sparse experimental data for the out-of-plane behavior, assumption is the best practice approach. Nonetheless, for any problem which is sensitive to out-of-plane parameters [16], a more accurate approach might improve the validity of the analysis. In particular cases like woven or braided composites, the through-thickness properties of the composite laminates might even differ substantially from the in-plane properties. The in-plane properties predominantly reflect the high stiffness and strength introduced by the reinforcement fibers. The through-thickness properties are largely influenced by the matrix material and the bond quality between the laminar layers, both of which are typically weaker than the reinforcing fibers. Because of this, the through-thickness compression modulus is often significantly lower than the in-plane modulus. This discrepancy can lead to potential weaknesses and vulnerabilities in composite structures, particularly under out-of-plane loading conditions, causing delamination or interlaminar failure. Hence, a reliable determination and a solid understanding of the through-thickness compression parameters can be essential to the design and application of composite laminates.

Experimental Characterization of the Out-of-Plane Properties

The DIN, EN, or ISO standard test procedures for the determination of the laminate compression properties require long, slender specimens [17]. There is no standard test available to characterize the through-thickness stiffness and strength of a composite laminate. The standard procedures for the determination of the in-plane properties cannot be applied, as the laminate would have to be stacked along the specimen axis. Such a stack would be expensive and hard to manufacture properly. Consequently, these standard tests are not applicable to the determination of the out-of-plane properties. Nevertheless, different researchers presented diverse experimental determination methods. Abot and Daniel [18] used flatwise composite specimens bonded to steel shanks. This configuration permitted conducting the through-thickness compression modulus testing in a similar manner to in-plane compression testing. Gning et al. [19] characterized the out-of-plane properties through Arcan’s fixture [20]. Next to the determination of E 33 under tension and compression, this method also permits measuring the out-of-plane shear moduli G 13 and G 23 . This method’s disadvantage is the geometry of the Arcan specimen requiring a 30 mm laminate stack to be manufactured.
Zhang et al. [21] proposed characterizing a laminate’s through-thickness compression properties through prism specimens compressed between carbon steel collars. Likewise, Kim et al. [22] experimentally determined the through-thickness compression modulus and strength, where they used cubical and cylindrical specimens with an edge length and diameter of 10 mm. These pellet tests work with simplified specimens as the load is introduced through the specimen end faces. The specimens do not allow the introduction of shear stress and make the method less flexible than the Arcan test. Furthermore, a certain parameter influences the result and the deformation behavior. Already, Zhang et al. [21] discovered the significance of the friction coefficient between the laminate specimen and the steel collars. Due to the friction at the specimen–machine contact face, the lateral expansion of the specimen introduces shear stress at the load’s introduction. This shear stress is inhomogenous and prevents a uniform deformation state in the entire specimen. Gruebler et al. solved this through numerical simulation in their experiment [1]. They obtained the relevant parameters through calibration of the respective model parameters.
This research presents cube compression tests conducted with similar methodology to that presented by Zhang et al. [21] in 2000 and by Kim et al. [22] in 2010. The present work endeavors to fill a crucial knowledge gap by employing a known experimental methodology for assessing the through-thickness compression modulus. A direct comparison between the experimental outcomes and the predictions of a computational simulation model entails the enhancement of the experimental results through correction factors from the simulation. The second objective of this comparative analysis is the evaluation of the through-thickness behavior of UD laminates in comparison with the in-plane behavior. Eventually, we aim to benchmark the experimental findings from the cube compression test against those obtained from standard planar compression testing.

2. Methods and Procedures

The focal point of this study is the experimental evaluation of the through-thickness compression properties, specifically through cube compression tests. While the test set-up was informed by methodologies used in previous research, it is important to note that there is no universally accepted standard for this type of experiment. Consequently, I provide a detailed description of the experimental set-up. For comparative purposes, another series of tests was performed in accordance with the DIN EN ISO 14126 standard [17] which precisely outlines the set-up and procedure. Therefore, the description of these standard tests is succinctly presented in this study.

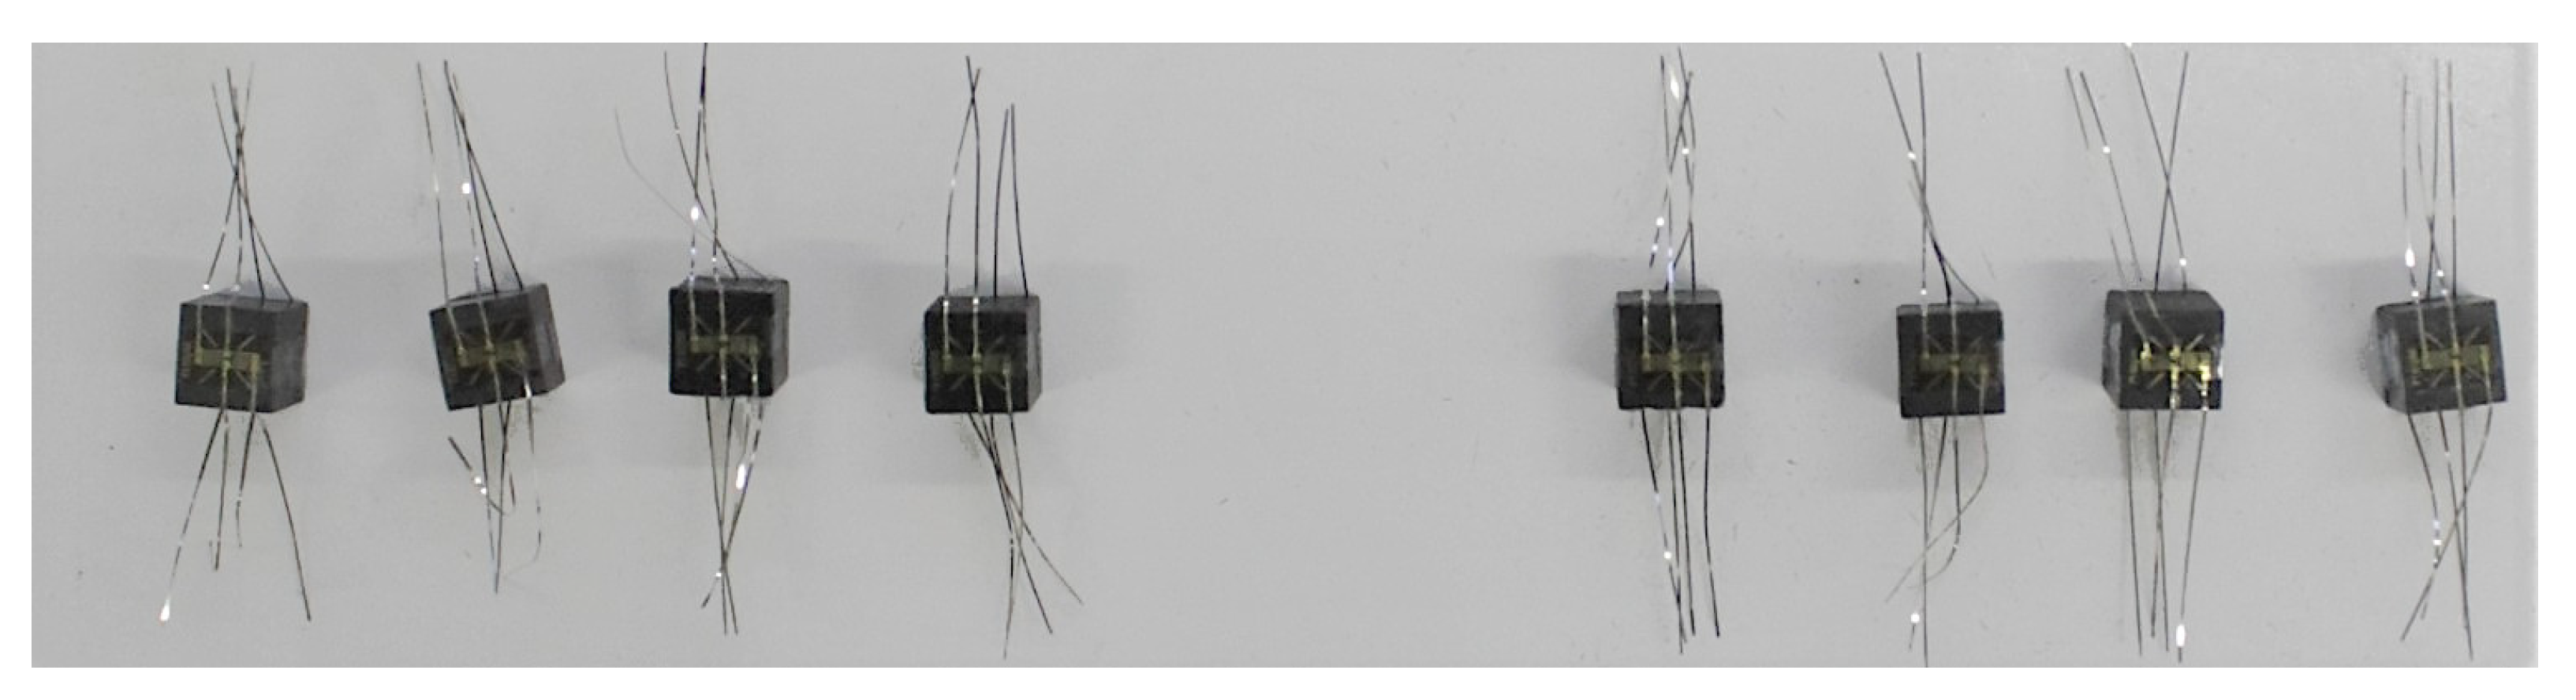
2.1. Experimental Set-Up

The experimental set-up for the cube compression tests in this study was designed in reference to the configuration presented by Kim et al. [22]. A cubical pellet specimen was compressed uniaxially to determine the through-thickness properties. Figure 1 presents both the schematic diagram and an actual image illustrating the configuration of the test set-up as implemented. The core component of this set-up was a 100 kN universal testing machine equipped with parallel compression plates. A further critical aspect is the use of hardened steel plates (gauge blocks) between the compression plates and the composite specimen. These plates were positioned above and below the cubical specimen. The choice of hardened steel was deliberate, aimed at reducing the risk of indentation or damage to the test machine. The high shape tolerance requirement of the gauge blocks also ensured parallel load introduction on both sides of the specimen, which permitted uniform distribution of the compression load across the specimen’s surfaces.
Despite stringent requirements for parallelism, achieving perfectly uniform load application remains challenging. To accurately capture the strain experienced by the specimen, we utilized biaxial strain gauges of type HBK 1-XY1x-1.5/120 [23] attached to two opposite faces of the cube. These gauges were specifically chosen for their ability to measure the strain both parallel and perpendicular to the direction of the applied load on the respective surfaces. This configuration was critical for precisely quantifying both the compressive and lateral deformations of the specimen under load.
Under compressive loading, composites exhibit lateral expansion, leading to sliding at the interface between the specimen and the loading face. Zhang et al. [21] highlighted the significant influence of the friction coefficient on the maximum shear stress within the specimen. Consequently, they considered μ to be a critical parameter for strength determination, using values of 0.1 and 0.3 in their analyses. In a contrasting approach, Gruebler et al. [1] utilized a broader range of friction coefficients between 0.1 and 0.5 . Gruebler et al. reported that variations in the friction coefficient did not significantly alter the material response, attributing this to the high compression levels effectively suppressing any sliding, even at lower friction coefficients. Kim et al. [22] applied lubrication grease to reduce the friction at the interface. Nonetheless, they did not mention a value. Due to the quasi-static load application, the static coefficient of friction μ 0 was the relevant value. In a comparative study about the frictional behavior of a CFRP, Schön reported [24] that the friction coefficient depends on the fiber orientation, whereupon the coefficient for the transverse direction is reported to be higher than that in the longitudinal direction. Lateral deformation of a compressed cube specimen occurs primarily in the transverse direction. The divergence of the Poisson’s ratios ν 21 < < ν 23 and ν 31 < < ν 32 yields a lateral expansion Δ 22 > > Δ 11 (see Equation (1)). Thus, the static friction coefficient between a CFRP and a steel surface was assumed with μ 0 = 0.25 , as employed by Schön and according to Matsunaga et al. [25]:
Δ 22 = ν 23 ε 33 Δ 11 = ν 31 ε 33

2.2. Specimen Configurations

The cubical specimens were designed with an edge length of 10 mm. Zhang et al. did not find a siginificant size effect in their experimental investigation of different specimen sizes between 8.5 mm and 15 mm [21]. Therefore, the dimension of 10 mm was chosen as the minimal size that would comfortably apply the strain gauges. The specimens were made from unidirectional (UD) prepreg material arranged in a 0 54 ply stack. The specific composite material used was Hexcel’s medium-grade IMA/M21e with a nominal ply thickness of 0.184 mm.
The carbon fiber composite parts of the Airbus A350 aircraft were manufactured from this material [26], and the characterization of its elastic behavior has been studied various times in the literature, such as by Caminero et al. in 2016 for the analysis of impact [27] or by García-Moreno et al. with regard to aging [28]. Still, the referenced data sets do not include separate information about the out-of-plane behavior.
The specimens were manufactured in an autoclave process according to the manufacturer specifications from the data sheet [29]. Accordingly, the part was cured for 120 min at 180 ° and 7 bar. Particular attention had to be paid to ensure that all surfaces were parallel and smooth, requiring flat steel plates from the top and the bottom side of the specimen during the process. This careful preparation was crucial to minimize any potential experimental error due to misalignment or uneven stress distribution. A high level of accuracy was required to ensure a uniform load introduction. This could be achieved through a sufficient alignment of the specimen faces within the contact faces of the machine. While the gauge blocks guarantee the parallel state of the load introduction, biased stress distributions might still result from a minimally skewed specimen shape. To mitigate this, the composite plate was initially milled to a consistent thickness of 10 mm. Subsequently, the cubic specimens were extracted from this uniformly thick plate using a secondary milling process. This two-step approach was employed to address potential uncertainties and ensure the integrity and uniformity of the specimens for the compression tests. Through this process, accurate specimen dimensions were obtained:
  • Thickness: 9.99   mm ± 0.05   mm ;
  • In-plane dimensions: 10.00   mm ± 0.04   mm .
The specimens were equipped with biaxial strain gauges on two opposing faces. This configuration allowed the determination of the compression stiffness E 33 c and one Poisson’s ratio, ν 32 or ν 31 , from a single test, depending on which specimen faced where the gauges were applied. To account for a potentially different behavior, the specimens were separated into two groups, as Figure 2 depicts. For the experiments with 3-direction loads, these groups were called the ν 32 configuration with the strain gauges applied to the 23-plane (normal to the fiber orientation) and the ν 31 configuration with the strain gauges applied to the 13-plane (parallel to the fiber orientation). Similarly, the 2-direction compression tests were conducted in the ν 23 configuration and the ν 21 configuration. The specimens equipped with strain gauges are shown in Figure 3.

2.3. Test Procedure

Prior to each individual test, the surfaces of the compression plates and the hardened steel plates were cleaned to eliminate any residual particles from the previous tests. Afterward, the instrumented specimen was placed between the steel plates in the compression testing machine. Before the actual test, the specimen was compressed to achieve a preload of 20 N. Afterward, the machine applied the compressive test load under displacement control with a load speed of 0.5 mm min . The specimen was thus gradually loaded until the failure point, indicated by a load drop of at least 30 % from F m a x . Throughout this process, the strain gauges and the load cell of the testing machine collected data, providing a detailed account of the specimen’s stress–strain response.

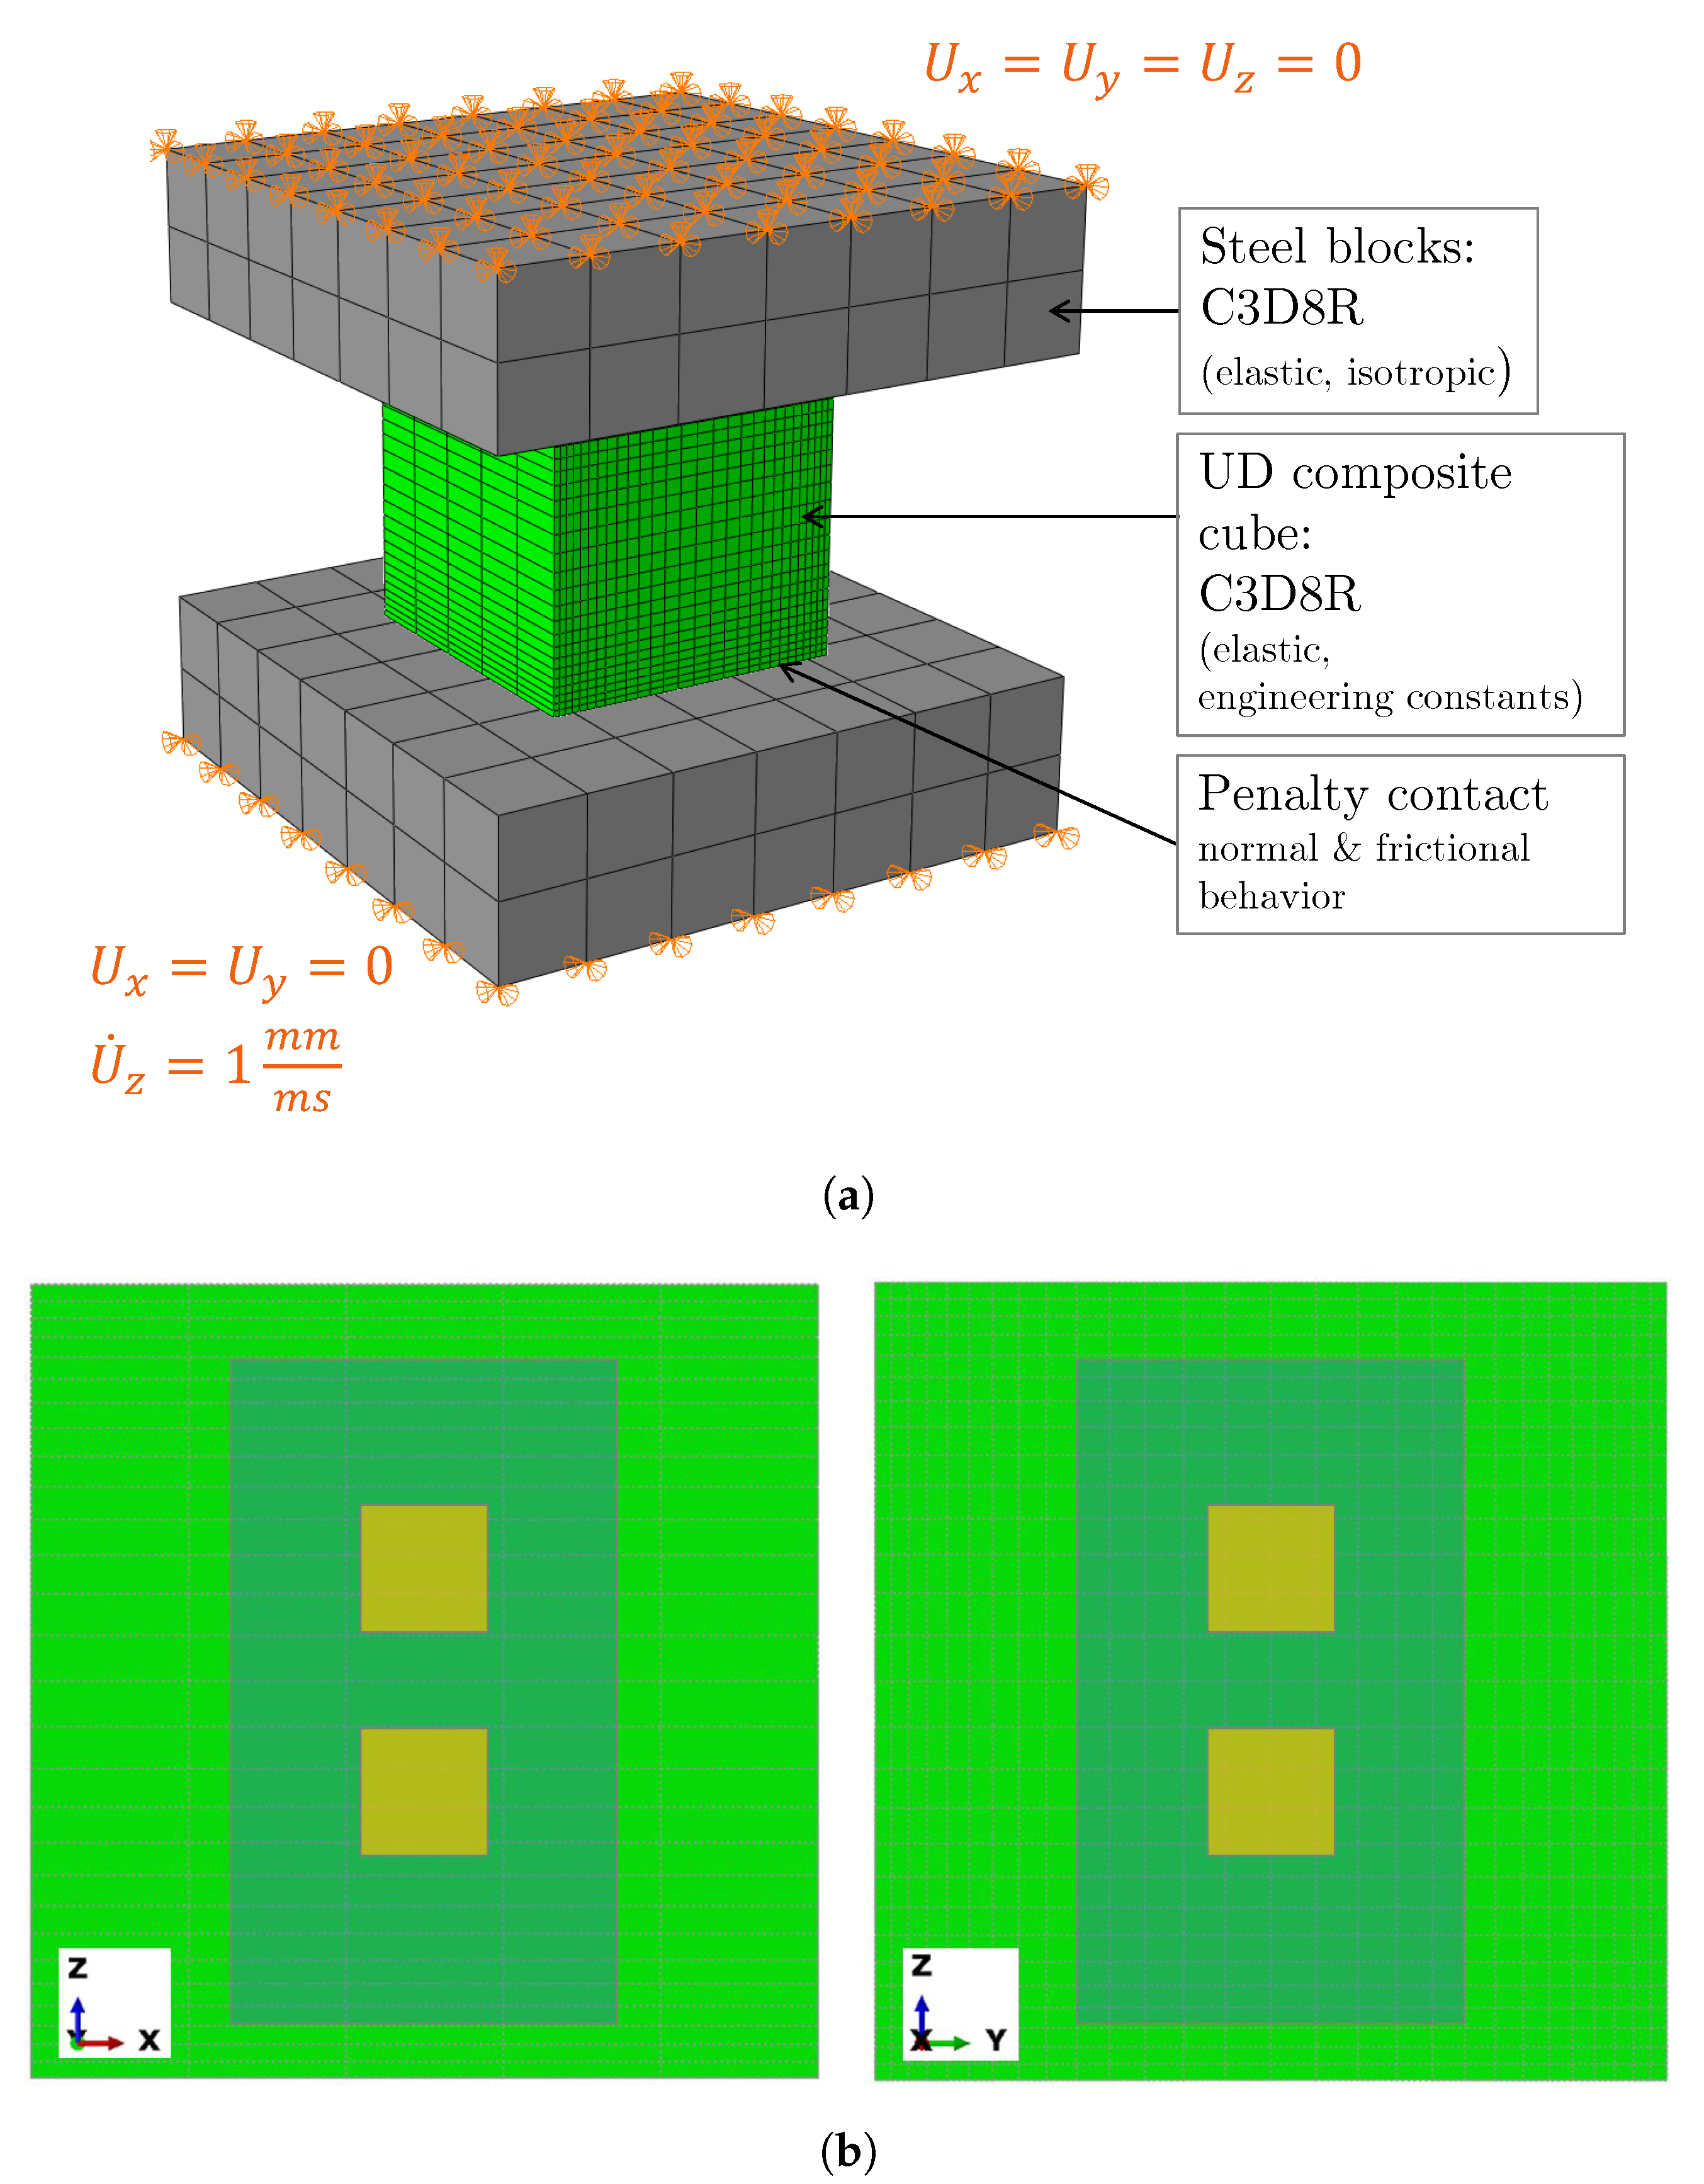
2.4. Finite Element Model of the Test Set-Up

Static friction between the specimen and the steel blocks introduces a challenge, as it disrupts the uniformity of compressive deformation across the specimen. This non-uniformity means that surface strain measurements cannot directly yield the compression modulus when applying Hooke’s law in a unidirectional manner. To overcome this limitation, a finite element (FE) model was utilized to perform a virtual compression test analogous to the physical test. This computational approach was crucial for determining linear scaling factors, which are essential to accurately calibrate the target parameters derived from the experimental characterization.
Figure 4a illustrates the FE model employed for this purpose. The model encapsulates the specimen and the adjacent hardened steel blocks. The interfaces between these components were modeled using a penalty contact approach to simulate both the normal and frictional behaviors accurately. Given the complexities introduced by the contact interactions, Abaqus/Explicit was selected as the simulation environment. Due to the limited stable simulation time in an explicit simulation, the loading speed had to be significantly higher than in the real experiment. A displacement boundary condition of 1 mm ms was applied as a smooth step to prevent non-physically high accelerations. To rule out any influence by this artificially high loading speed, the energy balance in the model was monitored, revealing less than 0.01% kinetic energy compared with the elastic energy throughout the entire simulation.
The loading boundary condition for Δ U z was applied at the bottom surface of the lower steel block while the lateral degrees of freedom were set to zero, where U x = U y = 0 . On the top surface of the other steel block, all degrees of freedom were set to zero, where U x = U y = U z = 0 .
The meshing of the cubical specimen’s 23-plane is particularly noteworthy. It features a biased mesh design, utilizing 0.2 mm elements near the corners to accurately capture the high strain gradient expectations in these areas. Progressing toward the center, the element edge length gradually increased to 0.6 mm, effectively reducing the overall element count while maintaining model integrity. An investigation of the mesh density’s influence on the predicted elastic response revealed no significant difference if a refined mesh was used. In fact, even a coarser mesh with a 1 mm element in the center region yielded similar results.
In the 1-direction, where minimal lateral expansion was expected, a coarser mesh sufficed. An element edge length of 2 mm met the corresponding meshing requirements, striking a balance between accuracy and computational efficiency. However, the similarity of the deformation behavior along the 1-direction would even allow a coarser mesh to obtain meaningful results. To keep the aspect ratio of all elements below 10, an element edge length of 2 mm should not be exceeded.
In total, the cube comprised 3920 elements, a configuration that provided a detailed representation while optimizing computational resources. The element type C3D8R was used for both the gauge blocks and the specimen. To prevent hourglassing effects, the enhanced hourglass control option of Abaqus was applied. The composite was modeled as the elastic, orthotropic material type “engineering constants”. Similar material properties were assigned to all elements. The material orientation was chosen according to the fiber direction and the stacking direction of the laminate. Nevertheless, the 54 individual plies of the laminate were not distinguished in the model, as the model’s level of abstraction was the entire laminate.
The contact model was created as a pure slave-master interaction in which the coarsely meshed steel blocks provided the master surface and the surface nodes of the specimen represented the slave partner. The critical aspect of this set-up is the static friction coefficient μ 0 . Drawing on the values suggested in the literature, we adopted a coefficient of 0.2 as a reasonable estimate. However, prior to finalizing the scaling parameters, we thoroughly investigated the impact of this friction coefficient on the simulation results to ensure its validity and influence.
Material data for the M21e/IMA composite were available from an accompanying material characterization. Table 1 provides the elastic parameters for the FE analysis. The value for the out-of-plane modulus E 33 was assumed to be equal to the modulus in the transverse direction E 22 .
Figure 4b depicts the position and the size of the strain gauges, including the measuring grids on the FE mesh as a representation of scale. The measured strain in the test represents an average of the strain in the respective grid areas. Analogously, the FE strain results had to be averaged for the respective area. To obtain the surface strains in the FE model, the strain had to be obtained from the outward pointing element nodes N in the area of the strain gauge measuring grid (as the elemental strains at the integration points do not represent the surface strains). The averaged gauge strain for the node set N was calculated according to Equation (2), where the area A n is calculated as the sum of the adjacent element faces divided by four:
ε g a u g e = n = 1 N ε n A n n = 1 N A n

2.5. Numerically Obtained Scaling Factors

The simulation results in Figure 5 depict the strain distributions of the three normal strains ε 11 , ε 22 , and ε 33 at a compression load of 6   kN . Notably, the hindered lateral expansion at the top and the bottom faces induced strain peaks along the edges in the 1-direction. The high lateral expansion in the 2-direction explains this observation. For the same reason, the state of strain was constant along the 1-direction (x direction in the FE plots). Thus, the strain on the 13-plane depended only on the 3-position (z position). Conversely, the strains on the 23-plane depended on both in-plane coordinates. Still, a nearly homogeneous state of stress emerged in the middle of this surface.
To demonstrate the impact of the specimen’s non-uniform deformation, we calculated the desired output parameters as field variables, adhering to the formulas outlined in Equation (3). This approach enabled us to map the spatial distribution of our target parameters– E 33 , ν 31 , and ν 32 –as though they were directly measured at each point on the specimen’s surface. Figure 6 and Figure 7 depict these calculated field outputs. Within the framework of our FE simulation, the “real” values of the parameters were predetermined, as they constituted part of the simulation’s input data. The color spectrum of each plot is such that white represents the “real” input value, red stands for an elevated value, and blue stands for a decreased value:
E 33 = F A 12 ε 33 ν 32 = ε 22 ε 33 ν 31 = ε 11 ε 33
The distribution of E 33 follows an inverse relationship with ε 33 . It showed a dependency primarily on the position within the 13-plane, and it remained notably constant across the middle of the 23-plane. Figure 6a substantiates that the modulus measurable in the center of the 23-plane aligned closely with the actual value ( 8000 GPa), indicating minimal bias. Conversely, the measurable modulus in the 13-plane tended to be marginally higher. This observation is particularly relevant when considering lateral expansion effects.
Furthermore, the distribution of the inversely calculated Poisson’s ratio ν 32 , as shown in Figure 7a, displayed significant gradients in both the loading and transverse directions. These pronounced gradients suggest a higher potential for uncertainty in this parameter. The restricted lateral expansion at the top and bottom faces of the specimen was observed to extend almost to the specimen’s central region.
To adjust for biased moduli obtained from the strain measurements, a scaling factor was calculated for each target parameter by dividing the “real” input value by the virtually measured values. Table 2 lists these scaling factors for E 33 , ( E 22 ), ν 31 , and ν 32 . During the evaluation of the experimental results, the experimentally obtained raw values were scaled with these factors, which enabled us to deduce the material’s true physical properties.

3. Results and Discussion

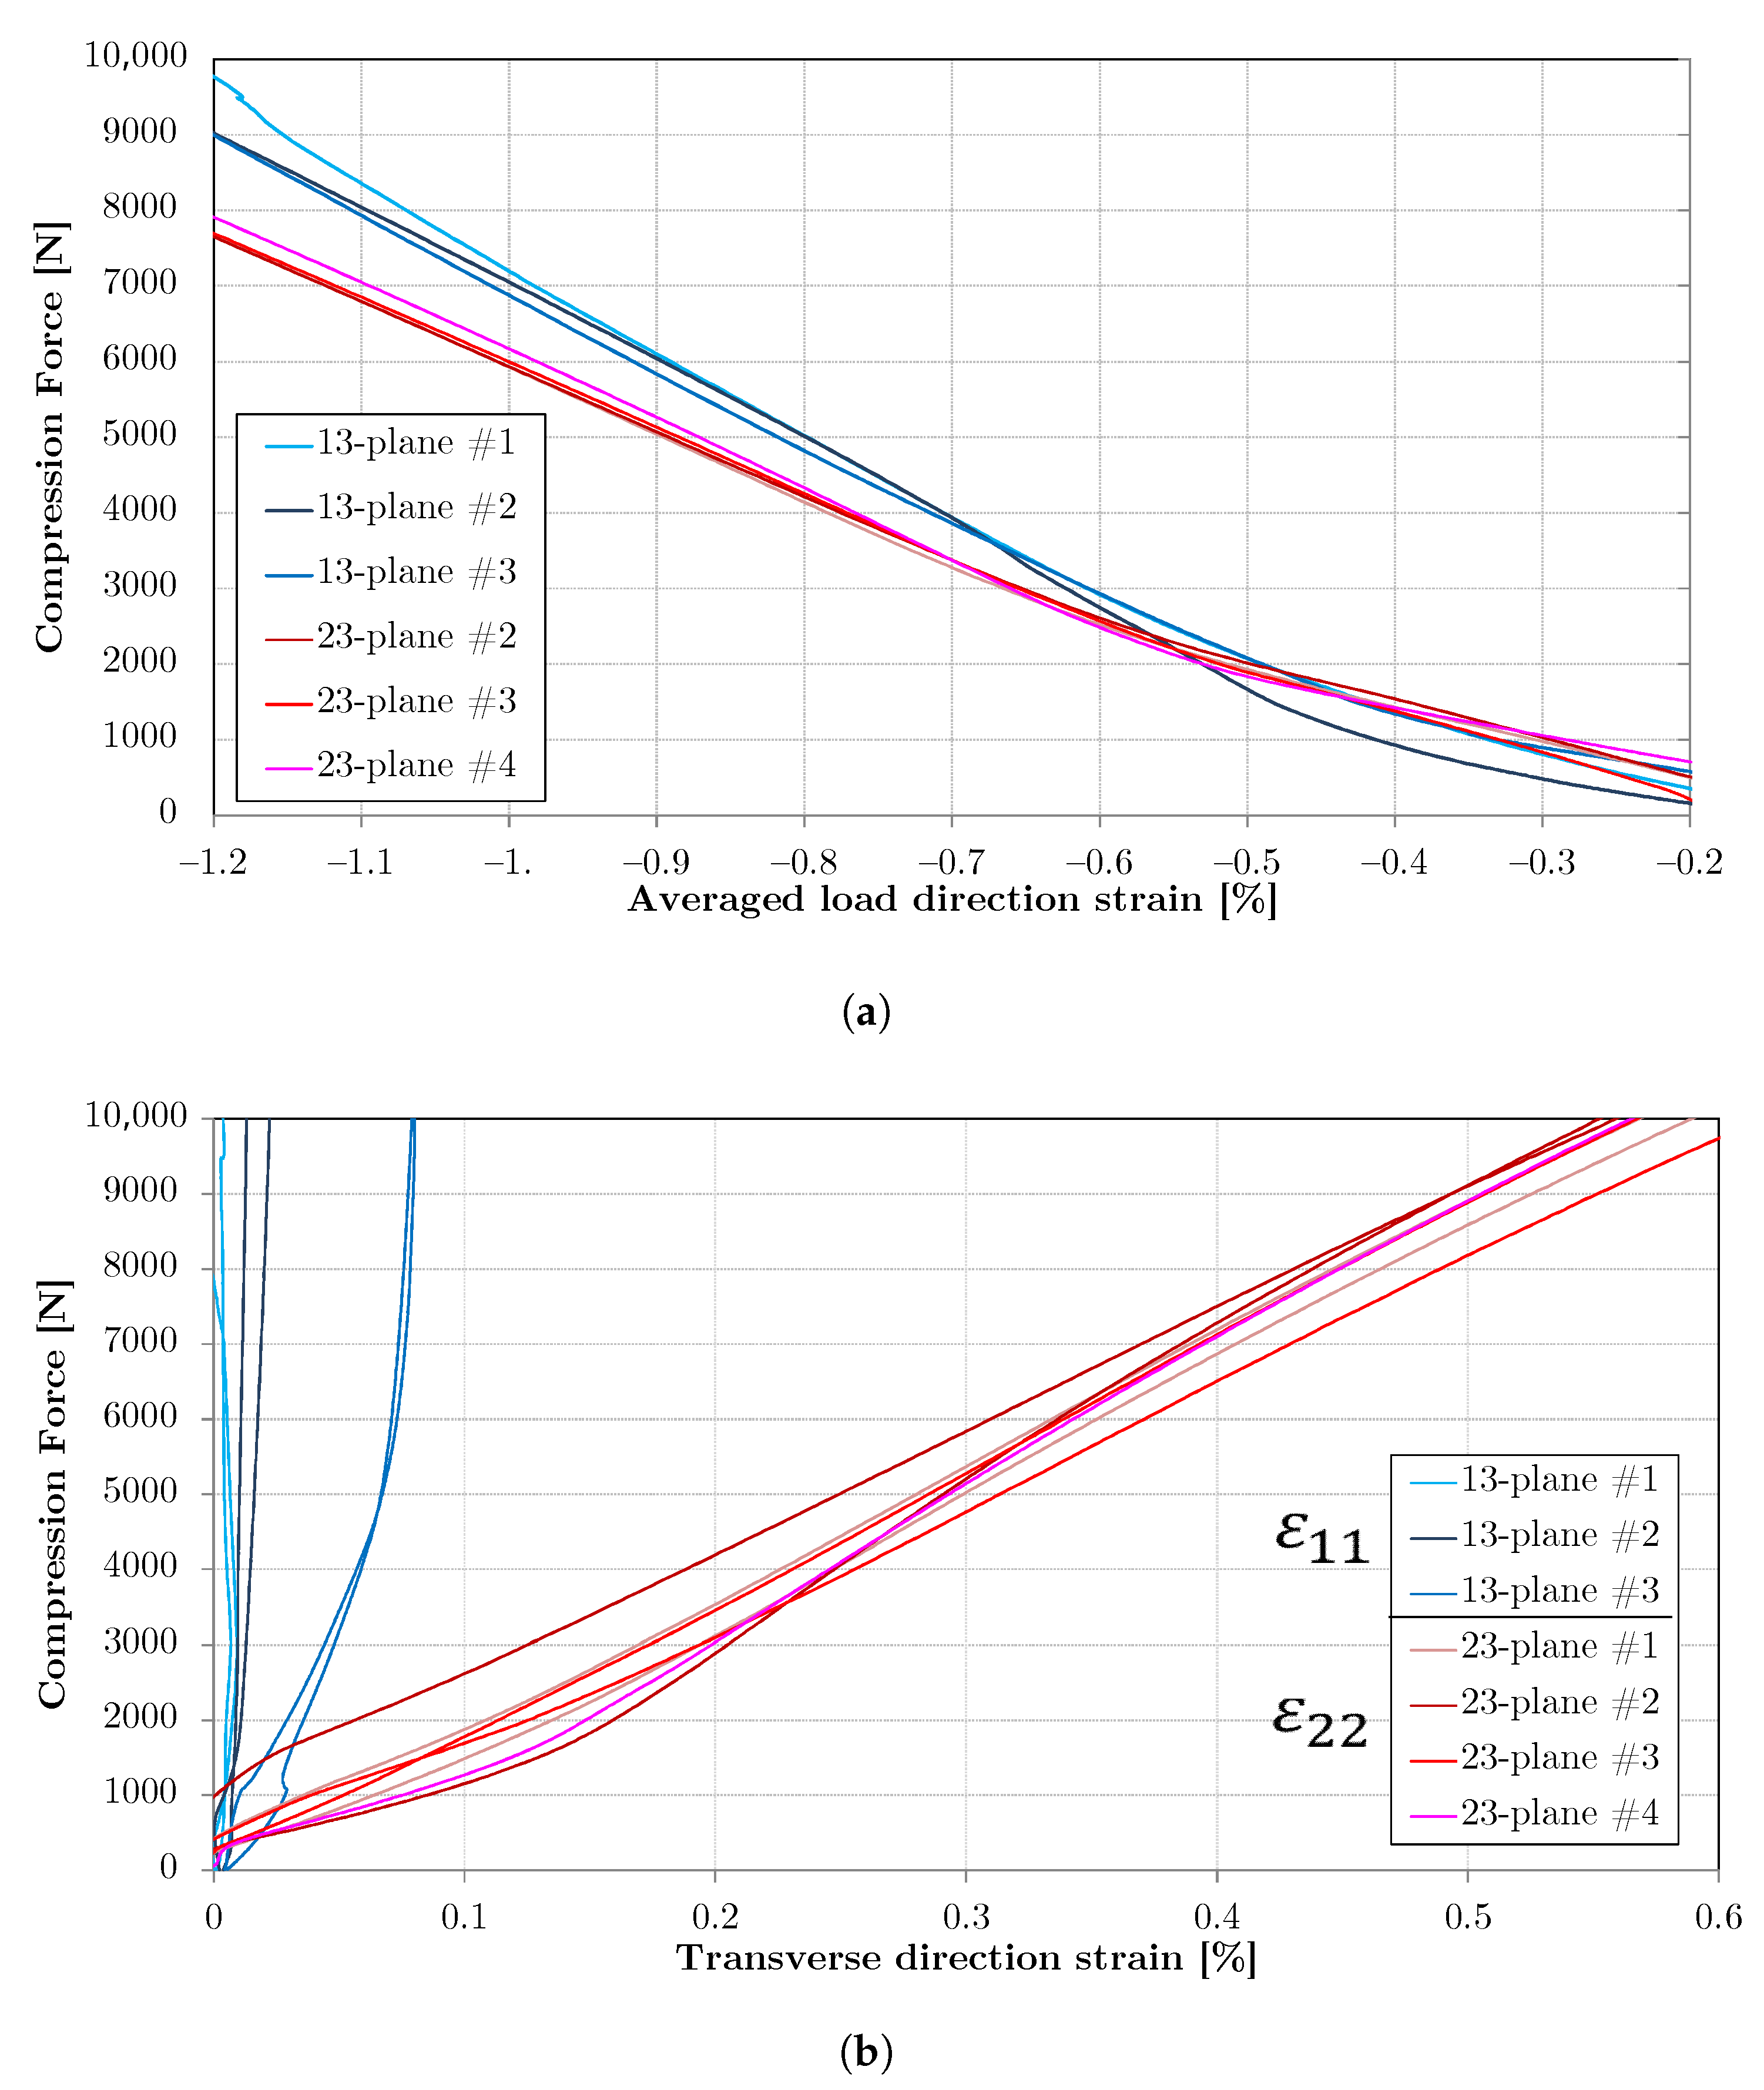
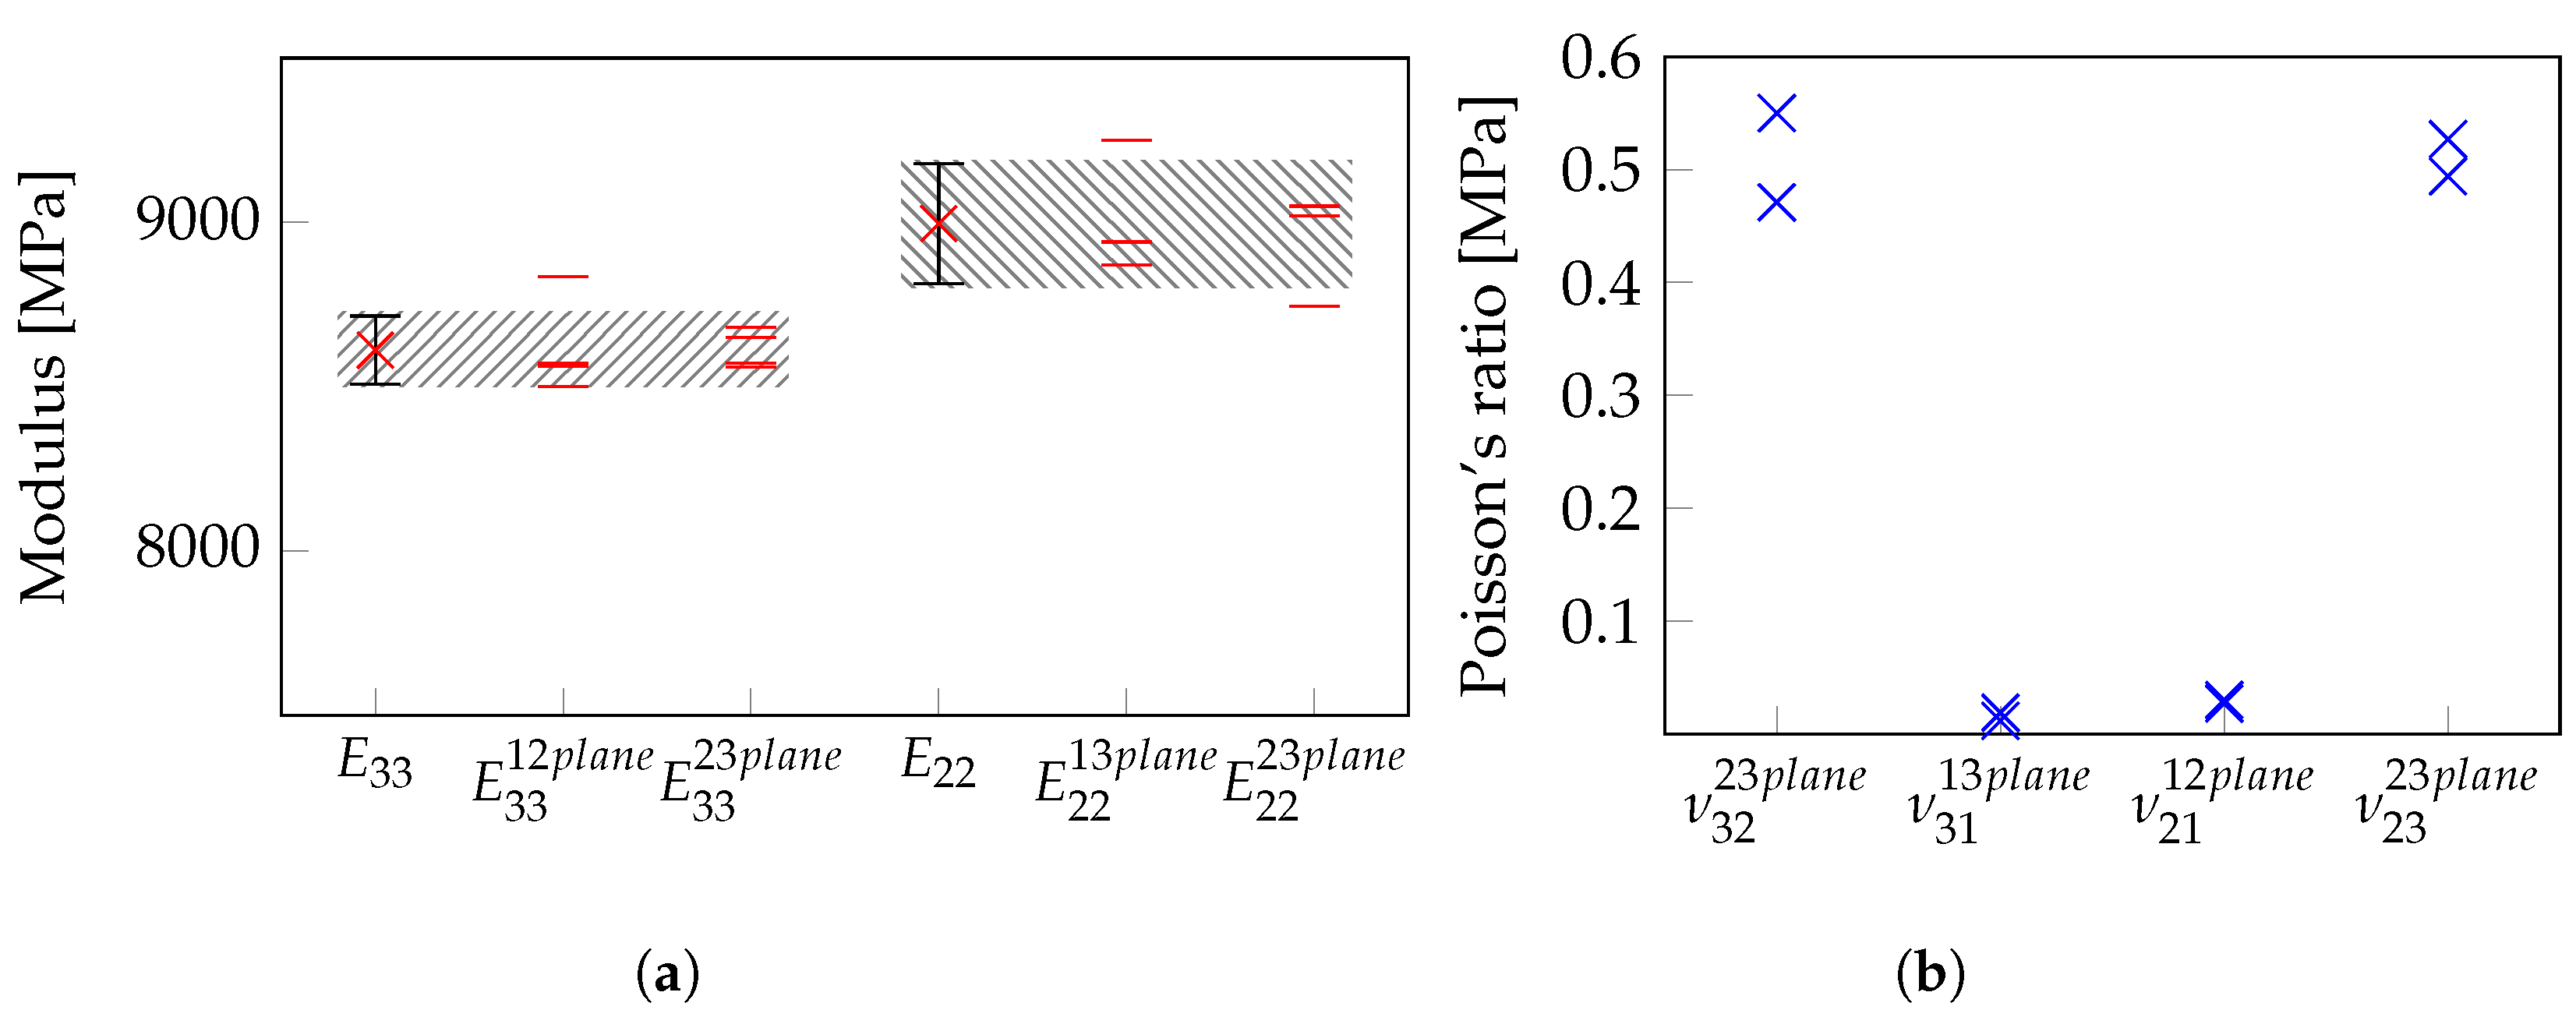
3.1. Stiffness Determination

The meaningful raw data recorded during the tests were the strains and the compression force. The diagrams in Figure 8 and Figure 9 show these measurements for the out-of-plane compression tests in the 13-configuration and the 23-configuration, respectively. The strain measurements from both sides of each specimen are depicted separately but in the same color. While a similar strain response on both sides indicates a symmetrical loading condition, the deviation of both corresponding strain curves indicates the presence of some asymmetry. Most specimens did not exhibit significant asymmetry. Only specimen 1 of the 13-configuration suddenly deformed asymmetrically above 9 kN. The corresponding kink in the curves indicates that premature failure of a single edge was the cause of this observation.
Notably, the initial response below 2 kN revealed a progressively increasing stiffness for all specimens. The most likely source of this behavior is the friction between the specimen and the steel plates. Low contact force still permitted sliding at the contact faces. Only after a certain contact pressure was reached did the static friction lead to a converging strain response. Similar to the observation of Kim et al. [22], the response on the 23-plane was slightly nonlinear, exhibiting a decreasing tangential stiffness. To obtain meaningful elastic parameters from these response curves, the force range for the determination of the secant stiffness was selected to be from 4 kN to 8 kN, corresponding to a strain level of approximately 0.005 mm 1 0.01 mm 1 . The overlay of the averaged and shifted curves for both configurations is depicted in Figure 9a, clearly showing the elevated stiffness of the 13-configuration in comparison with the 23-configuration. The scatter observed in the raw curves was nearly negligible compared with the secant stiffness in the evaluation range for modulus determination.
Analogously, the raw transverse strains in the 1-direction and the 2-direction are plotted in Figure 9b. While the lateral strain response in the 2-direction was reliably similar throughout the individual tests, the 1-direction strain exhibited large deviations between the individual tests. In particular, the strain ε 11 measured during test 3 was unexpectedly large, deviating significantly from the other curves. A strain gauge failure or an angular error in the gauge application could be excluded as a possible cause, as the lateral strains were equally large on both sides of the specimen. Thus, the Poisson’s ratio ν 13 obtained from this test set-up was considered unreliable.
After a quantitative evaluation of the elastic parameters, the raw values depicted in Figure 10 were obtained. As expected from the FE analysis, the evaluation was biased due to the friction between the specimen and the steel plates. Hence, the moduli calculated from the strains on the 23-plane and on the 13-plane (12-plane for E 22 ) differed significantly. Nonetheless, the scatter of the data points within one group was low, suggesting reasonable precision for the test configuration.
The raw parameters had to be converted by the linear scale factors given in Table 2. The diagrams in Figure 11 and Table 3 and Table 4 provide the respective result parameters. The initial deviations between the parameters obtained by different configurations appeared to vanish, and the scatter of the moduli calculated from the entire data set was not larger than the scatter within an individual group. These results eventually allowed us to compare the out-of-plane compression stiffness E 33 with the in-plane compression stiffness E 22 measured by the same method. This revealed the out-of-plane compression stiffness to be approximately 5 % below the in-plane value. This 5% value was the typical error resulting from assuming E 22 = E 33 .

3.2. Strength Determination

Beyond the determination of the elastic properties, the compression strength was calculated from the maximum compression force of each test. As this calculation did not rely on strain gauge data, it remained unaffected by the specimen’s configuration, eliminating the need for further scaling. The calculated strengths are given in Table 4. Like the stiffness, the out-of-plane compression strength was lower than the in-plane compression strength. In this case, the difference was 7%.
Figure 12 showcases the fractured specimens post-testing. It is apparent that fractures predominantly originated from the specimen edges, correlating with the significant strain peaks identified in the FE analysis (refer to Figure 5). The fracture patterns observed align with the findings of Zhang et al. [21] and Kim et al. [22], as illustrated in the side-by-side comparison in Figure 13a. In this study, the measured fracture angles ϕ f p , identified on visible fracture planes emanating from the edges, ranged between 60 ° and 67 ° . These angles were consistently higher than the theoretical values proposed by Puck [32] at 50 ° and those reported by Knops [33] at 54 ° ± 3 ° .
Further analysis of Zhang’s and Kim’s fracture patterns revealed similar angle values between 63 ° and 65 ° (see Figure 13a). This consistency suggests that the observed effect might be intrinsic to the cube compression experiment’s design. A probable explanation is the altered principal stress direction at the specimen edges, where fractures initiate. The friction at the contact faces likely induced shear stress, affecting the stress orientation. As depicted in Figure 13b, the FE simulation results indicate a tilt of approximately 7 ° in the principal stress direction at the edges, assuming a friction coefficient of 0.2 . Correcting the observed fracture angles with this tilt brought them more in line with the theoretical predictions.

3.3. Comparison with the Standard Test

In our analysis, we juxtaposed the outcomes of the cube compression tests with those obtained from standard in-plane compression tests as per DIN EN ISO 14126 [17], as indicated in the last rows of Table 3 and Table 4. The standard tests used specimens from the same manufacturing process and material batch as the cube specimens, enabling a direct comparison of the derived values for E 22 c and X 22 c between the two test types. Notably, we observed that the cube test underestimated the stiffness by 4%. Despite the strain concentrations at the cube edges, it overestimated the compression strength by 12%.
To reconcile these discrepancies with the standard test results, further scaling of the properties determined from the cube tests was necessary. Assuming mechanical similarity between E 22 and E 33 , E 33 was scaled by the same ratio as E 22 E N I S O / E 22 c u b e . This adjustment yielded a corrected modulus value of E ˜ 33 = 8969 MPa, effectively removing the cube test’s bias. Similarly, by applying this scaling approach to the strength values, we calculated a revised strength value of X ˜ 33 c = 188 MPa.

3.4. The 1-Direction Cube Compression Test

In conjunction with the previously discussed experiments, we conducted four compression tests in the 1-direction using cubical 10 mm specimens similar to those in the other tests. Still, the results from these tests are not included in this report due to significant reliability issues encountered with the experimental procedure. At extremely low load levels, fragments began to detach from all four sides of the specimens, undermining the reliability of the strain measurements and rendering the determination of a modulus infeasible. Furthermore, the 11-compression strength could not be ascertained accurately, as the specimens failed incrementally through the splitting off of fragments, leading to premature ultimate failure, which can be seen in the fracture patterns of the two specimens shown in Figure 14 after a 1-direction test.

4. Conclusions and Outlook

Employing an experimental method from the literature, this study successfully established a procedure for determining the through-thickness compression properties of unidirectional laminates using cube compression tests. The methodology, encompassing both the test procedure and specimen preparation, is notably simpler and more cost-effective compared with out-of-plane Arcan tests. The following conclusions can be drawn from the key findings of this study:
  • To enhance the accuracy of the experiment results, the stiffness measurements were scaled according to the results from a virtual test set-up in FE analysis. This approach enabled the precise determination of E 33 c and X 22 c .
  • A comparative analysis of the in-plane and out-of-plane properties revealed a slightly lower out-of-plane modulus ( E 33 c ) and strength ( X 33 c ) compared with their in-plane counterparts ( E 22 c and X 22 c . The results indicate deteriorations of E 33 c and X 33 c from E 22 c and X 22 c by margins of 5% and 7%, respectively.
  • The cube compression test results for E 22 c and X 22 c were compared with the results from a standard test, revealing 12% enhanced strength for X 22 c and 4% underestimated stiffness for E 22 c in the cube compression test.
Future research should focus on determining the through-thickness strength and stiffness of multi-directional laminates, particularly those with varying stacking sequences and ply thicknesses, as the out-of-plane properties are known to be influenced by these factors [22]. Notably, the strength of multi-directional laminates is often significantly higher compared with that of unidirectional laminates. Investigating legacy quad laminates composed of 0 ° , 90 ° , and ± 45 ° plies will be essential, especially concerning the influence of the number of interfaces on their mechanical properties [34]. Furthermore, for double-double laminate configurations [34,35], exploring how the properties vary with interface angles is of significant interest. However, the effort required in manufacturing various specimen configurations presents significant challenges for conducting extensive experimental studies with diverse layup configurations. Consequently, supplementing experimental determination with detailed numerical analyses, as proposed by Llorca et al. [36], becomes a practical approach. These analyses can effectively incorporate and evaluate the influence of different stacking sequences, offering a more comprehensive understanding of the material’s behavior.

Funding

This research was funded through the DLR project oLAF and the German research project SCHACH (20W1303E), a part of the German research program Luftfahrtforschung (LuFo V).

Institutional Review Board Statement

Not applicable.

Informed Consent Statement

Not applicable.

Data Availability Statement

The data generated during the current study is currently not publicly available due to available from the corresponding author on reasonable request.

Acknowledgments

All work related to this article was accomplished within the DLR project oLAF and the German research project SCHACH (20W1303E), a part of the German research program Luftfahrtforschung (LuFo V). The author acknowledges the DLR and the Bundesministerium für Wirtschaft und Energie (BMWi Germany) for funding this project. The author also acknowledges Airbus Helicopters for the scientific collaboration and the specimen manufacturing.

Conflicts of Interest

The author declares no conflicts of interest.

References

  1. Gruebler, K.; Thomson, D.; Petrinic, N.; Wisnom, M.R.; Hallett, S.R. Fibre reinforcement and stacking sequence influence on the through-thickness compression behaviour of polymer composites. Compos. Struct. 2023, 319, 117160. [Google Scholar] [CrossRef]
  2. Camanho, P.P.; Matthews, F.L. Delamination Onset Prediction in Mechanically Fastened Joints in Composite Laminates. J. Compos. Mater. 1999, 33, 906–927. [Google Scholar] [CrossRef]
  3. Park, D.C.; Lee, S.M.; Kim, B.C.; Kim, H.S.; Lee, D.G. Development of heavy duty hybrid carbon–phenolic hemispherical bearings. Compos. Struct. 2006, 73, 88–98. [Google Scholar] [CrossRef]
  4. Fualdes, C. Composites @ Airbus damage tolerance methodology. In Proceedings of the FAA Workshop for Composite Damage Tolerance and Maintance, Chicago, IL, USA, 19–21 July 2006. [Google Scholar]
  5. Faivre, V.; Morteau, E. Damage tolerant composite fuselage sizing–Chacterisation of accidental damage threat. Airbus SAS 2011, 48, 10–16. [Google Scholar]
  6. Xu, L.R.; Hassan, M.M.; Anderoglu, O.; Zhao, K.; Flores, M. Influence of the stacking sequence on the through-thickness Young’s moduli of fibrous composite laminates measured by nanoindentation. J. Compos. Mater. 2020, 55, 1179–1184. [Google Scholar] [CrossRef]
  7. Bogenfeld, R. A Combined Analytical and Numerical Analysis Method for Low-Velocity Impact on Composite Structures. Ph.D. Thesis, Technische Universität Carola-Wilhelmina zu Braunschweig, Braunschweig, Germany, 2019. [Google Scholar]
  8. Abrate, S. Impact on Composite Structures; Cambridge University Press: Cambridge, UK, 1998. [Google Scholar]
  9. Hertz, H. Ueber die Berührung fester elastischer Körper. J. Die Reine Angew. Math. 1881, I, 156–171. [Google Scholar] [CrossRef]
  10. Bogenfeld, R.; Freund, S.; Dähne, S.; Wunderlich, T.; Wille, T. Damage tolerance allowable calculation for the aircraft design with static ultimate load. Compos. Struct. 2023, 329, 117803. [Google Scholar] [CrossRef]
  11. Lopes, C.; Sádaba, S.; González, C.; Llorca, J.; Camanho, P.P. Physically-Sound Simulation of Low-Velocity Impact on Fibre Reinforced Laminates. Int. J. Impact Eng. 2015, 92, 1–15. [Google Scholar] [CrossRef]
  12. Hongkarnjanakul, N.; Bouvet, C.; Rivallant, S. Validation of low velocity impact modelling on different stacking sequences of CFRP laminates and influence of fibre failure. Compos. Struct. 2013, 106, 549–559. [Google Scholar] [CrossRef]
  13. Kumar, K.V.; Reddy, P.R.; Shankar, D.R. Influence of angle ply orientation of stacking on mechanical properties of glass-polyester composite laminate. Int. J. Eng. Adv. Technol. (IJEAT) 2013, 2249, 8958. [Google Scholar]
  14. Dixit, A.; Mali, H.S.; Misra, R. Unit Cell Model of Woven Fabric Textile Composite for Multiscale Analysis. Procedia Eng. 2013, 68, 352–358. [Google Scholar] [CrossRef]
  15. Lüders, C. Mehrskalige Betrachtung des Ermüdungsverhaltens Thermisch zyklierter Faserkunststoffverbunde. Ph.D. Thesis, Technischen Universität Carolo-Wilhelmina zu Braunschweig, Braunschweig, Germany, 2020. [Google Scholar]
  16. Cózar, I.; Turon, A.; González, E.; Vallmajó, O.; Sasikumar, A. A methodology to obtain material design allowables from high-fidelity compression after impact simulations on composite laminates. Compos. Part A Appl. Sci. Manuf. 2020, 139, 106069. [Google Scholar] [CrossRef]
  17. DIN EN ISO 14126; Bestimmung der Druckeigenschaften in der Laminatebene. Deutsches Institut für Normung: Berlin, Germany, 2000.
  18. Abot, J.L.; Daniel, I.M. Through-Thickness Mechanical Characterization of Woven Fabric Composites. J. Compos. Mater. 2004, 38, 543–553. [Google Scholar] [CrossRef]
  19. Gning, P.; Delsart, D.; Mortier, J.; Coutellier, D. Through-thickness strength measurements using Arcan’s method. Compos. Part B Eng. 2010, 41, 308–316. [Google Scholar] [CrossRef]
  20. Arcan, M.; Hashin, Z.; Voloshin, A. A method to produce uniform plane-stress states with applications to fiber-reinforced materials. Exp. Mech. 1978, 18, 141–146. [Google Scholar] [CrossRef]
  21. Zhang, C.; Ganesan, R.; Hoa, S.V. Through-the-thickness compressive strengths of graphite/epoxy laminated composites: Experimental characterization and statistical analysis. Sci. Eng. Compos. Mater. 2000, 9, 163–176. [Google Scholar] [CrossRef]
  22. Kim, B.C.; Park, D.C.; Kim, B.J.; Lee, D.G. Through-thickness compressive strength of a carbon/epoxy composite laminate. Compos. Struct. 2010, 92, 480–487. [Google Scholar] [CrossRef]
  23. Hottinger Brüel & Kjær A/S HBM Test and Measurement HBM Strain Gauges. Available online: https://www.hbm.com/fileadmin/mediapool/hbmdoc/technical/S01265.pdf (accessed on 6 February 2024).
  24. Schön, J. Coefficient of friction and wear of a carbon fiber epoxy matrix composite. Wear 2004, 257, 395–407. [Google Scholar] [CrossRef]
  25. Matsunaga, S.; Matsubara, T.; Wang, W.X.; Takao, Y. Effects of reciprocation number on the friction behaviors of carbon/epoxy for various fiber orientations and high contact pressures. In Proceedings of the International Congress of Chinese Mathematicians (ICCM-13), Beijing, China, 13 June 2001. [Google Scholar]
  26. Marsh, G. Automating aerospace composites production with fibre placement. Reinf. Plast. 2011, 55, 32–37. [Google Scholar] [CrossRef]
  27. Caminero, M.; Rodríguez, G.; Muñoz, V. Effect of stacking sequence on Charpy impact and flexural damage behavior of composite laminates. Compos. Struct. 2016, 136, 345–357. [Google Scholar] [CrossRef]
  28. García-Moreno, I.; Caminero, M.; Rodríguez, G.; López-Cela, J. Effect of Thermal Ageing on the Impact and Flexural Damage Behaviour of Carbon Fibre-Reinforced Epoxy Laminates. Polymers 2019, 11, 80. [Google Scholar] [CrossRef] [PubMed]
  29. Hexcel ®. HexPly ® M21 Data Sheet. 2020. Available online: https://www.hexcel.com/user_area/content_media/raw/HexPly_M21_global_DataSheet.pdf (accessed on 6 February 2024).
  30. Bogenfeld, R.; Kreikemeier, J.; Wille, T. Validation of the low-velocity impact damage prediction through analytical scaling. Compos. Struct. 2019, 209, 715–726. [Google Scholar] [CrossRef]
  31. Baeker, M. SpectrumBaker–Better Contour Plots for Abaqus. 2016, Python Plugin. Available online: https://www.researchgate.net/publication/308078647_SpectrumBaker_-_better_contour_plots_for_Abaqus (accessed on 6 February 2024). [CrossRef]
  32. Puck, A. Festigkeitsanalyse von Faser-Matrix-Laminaten: Modelle für die Praxis; Hanser: München, Germany; Wien, Austria, 1996; p. 210. [Google Scholar]
  33. Puck’s Action Plane Fracture Criteria. In Analysis of Failure in Fiber Polymer Laminates: The Theory of Alfred Puck; Springer: Berlin/Heidelberg, Germany, 2008; pp. 37–115. [CrossRef]
  34. Shrivastava, S.; Sharma, N.; Tsai, S.W.; Mohite, P. D and DD-drop layup optimization of aircraft wing panels under multi-load case design environment. Compos. Struct. 2020, 248, 112518. [Google Scholar] [CrossRef]
  35. Kappel, E. Double–Double laminates for aerospace applications—Finding best laminates for given load sets. Compos. Part C Open Access 2022, 8, 100244. [Google Scholar] [CrossRef]
  36. Llorca, J.; González, C.; Molina-Aldareguía, J.M.; Lópes, C.S. Multiscale modeling of composites: Toward virtual testing and beyond. Jom 2013, 65, 215–225. [Google Scholar] [CrossRef]
Figure 1. The experimental set-up for the compression test as schematics (left) and as an actual photo (right).
Jcs 08 00076 g001
Figure 2. Strain gauges configurations for the cubical specimens for the 3-direction test and the 2-direction test.
Jcs 08 00076 g002
Figure 3. A set of 8 specimens equipped with strain gauges.
Jcs 08 00076 g003
Figure 4. (a) Explicit FE model of the specimen and the hardened steel plates with penalty contact between the bodies, including the boundary condition model features. (b) Representation to scale of the strain gauge positions and sizes on the FE mesh (measuring grids illustrated in yellow).
Jcs 08 00076 g004
Figure 5. Strain results for the deformed cube under a compression load level of 6 kN (visualization by SpectrumBaker [31]).
Jcs 08 00076 g005
Figure 6. Distribution of the calculated modulus E 33 based on the local strain result ε 33 of the FE analysis at a load level of 6 kN (visualization by SpectrumBaker [31]). (a) E 33 as measurable on the 23-face. (b) E 33 as measurable on the 13-face.
Jcs 08 00076 g006
Figure 7. Distribution of the calculated Poisson’s ratios ν 31 and ν 32 based on the local strain results ε 33 , ε 11 , and ε 22 of the FE analysis at a load level of 6 kN (visualization by SpectrumBaker [31]): (a) locally measurable ν 32 of the deformed cube under a compression load level of 6 kN and (b) locally measurable ν 31 of the deformed cube under a compression load level of 6 kN.
Jcs 08 00076 g007
Figure 8. Raw strain vs. force measurements of the E 33 tests. (a) Individual strains measured in the loading direction on both 13-planes. (b) Individual strains measured in the loading direction on both 23-planes.
Jcs 08 00076 g008
Figure 9. Strain vs. force plots from measurements of the E 33 tests (a) Averaged strain ε 33 from both opposing planes. (b) Strains ε 11 and ε 22 measured in the transverse direction.
Jcs 08 00076 g009
Figure 10. Results for the raw moduli E 33 and E 22 for strain gauge configuration (yz planes/xz planes). (a) Raw Young’s moduli. (b) Raw Poisson’s ratios.
Jcs 08 00076 g010
Figure 11. Results for the corrected moduli E 33 and E 22 for each configuration and the averaged values. (a) Young’s moduli. (b) Poisson’s ratio.
Jcs 08 00076 g011
Figure 12. Failure pattern view on the 23-plane of the tested specimens after ultimate failure.
Jcs 08 00076 g012
Figure 13. (a) Comparison of the fracture angle between the present study and the fractured specimens shown by Zhang et al. [21] and Kim et al. [22]. (b) Directions of the major principal stress at the loading faces of the specimen.
Jcs 08 00076 g013
Figure 14. Failure patterns of the specimens of the fiber direction tests.
Jcs 08 00076 g014
Table 1. Material data used for the FE analysis as provided in [30].
MaterialIMA/M21e UD Composite
E 11 166.0 GPa
E 22 , E 33  1 8.0 GPa
G 12 5.6 GPa
G 13 5.6 GPa
G 23 3.6 GPa
ν 12 , ν 13 0.31
ν 23   2 0.4
t p l y 0.184 mm
ρ C F R P 1580   k g / m 3
MaterialSteel blocks
E 210.0 GPa
ν 0.3
ρ s t e e l 7800   k g / m 3
1  E 33 and E 22 were chosen equally, as the data were not available before the test. 2 Here, ν 23 was an assumed value, as it was not available before the test was conducted.
Table 2. FE-based correction factors for the parameter determination, accounting for the friction-induced non-uniform loading in the experiments.
Parameter23-Configuration13-Configuration
E 33 c , E 22 c 1.02 0.838
ν 32 , ν 23 1.430 -
ν 31 , ν 21 - 0.895
Table 3. Results for the modulus determination and a reference result for an E 22 standard test.
Test TypeNumber of TestsModulus (MPa)Standard Deviation (MPa)
E 33 (Cube)78611104
E 33 23 p l a n e (Cube)48617129
E 33 13 p l a n e (Cube)3 1860455
E 22 (Cube)68996183
E 22 23 p l a n e (Cube)38897153
E 22 12 p l a n e (Cube)39095155
E 22 (EN ISO 14126)69370115
1 Strain gauge failure occurred at the forth specimen, leaving only three available results.
Table 4. Results for the strength determination and a reference result for a standard test.
Test TypeNumber of TestsStrength (MPa)Standard Deviation (MPa)
X 33 c (Cube)82106
X 22 c (Cube)62242
X 22 c (EN ISO 14126)62008
Disclaimer/Publisher’s Note: The statements, opinions and data contained in all publications are solely those of the individual author(s) and contributor(s) and not of MDPI and/or the editor(s). MDPI and/or the editor(s) disclaim responsibility for any injury to people or property resulting from any ideas, methods, instructions or products referred to in the content.

