Article

Thermal Insulation Properties of Milkweed Floss Nonwovens: Influence of Temperature, Relative Humidity, and Fiber Content

1
Center for Innovation in Technological Ecodesign (CITE), University of Sherbrooke, Sherbrooke, QC J1K 2R1, Canada
2
Research Center for High Performance Polymer and Composite Systems (CREPEC), Montreal, QC H3A 0C3, Canada
*
Author to whom correspondence should be addressed.
J. Compos. Sci. 2024, 8(1), 16; https://doi.org/10.3390/jcs8010016
Submission received: 5 November 2023 / Revised: 5 December 2023 / Accepted: 28 December 2023 / Published: 2 January 2024
(This article belongs to the Section Fiber Composites)

Abstract

:
This study investigated the influence of fiber content, temperature, and relative humidity on the thermal insulation properties of nonwoven mats made of seed fibers from Asclepias Syriaca, commonly known as milkweed floss. Nonwoven mats with a 1-inch thickness were produced by uniformly arranging milkweed fibers within a mold. Various quantities of fiber were employed to obtain nonwoven mats with a fiber content ranging from 5 to 35 kg/m3. Thermal conductivity and thermal diffusivity were measured across diverse relative humidity levels and temperatures. Simultaneously, milkweed floss samples were exposed to identical environmental conditions to assess the moisture regain and specific heat capacities of the fiber. The specific heat capacity of milkweed and thermal conductivity of the nonwovens exhibited a linear increase with temperature. The thermal diffusivity and thermal conductivity of the nonwovens decreased with rising fiber content. The thermal insulation properties of the nonwovens remained partially stable below 30% relative humidity but substantially deteriorated at higher levels. The nonwovens exhibited optimal thermal insulation properties at a fiber content between 20 and 25 kg/m3. The results of this study highlighted several technical advantages of employing milkweed floss as a sustainable and lightweight solution for thermal insulation.

1. Introduction

Natural fibers are a valuable and often underutilized resource that can be used not only in textile production but also in the development of eco-friendly technologies and substitutes for non-renewable materials in commercial products and industrial applications [1,2].
A clear example of this situation can be found by studying the uses of milkweed floss (MW), an abundant fiber native to North America, primarily employed as a hypoallergenic stuffing for jackets and pillows. However, this fiber holds enormous potential for other applications, including polymer reinforcement, solvent absorption, and thermo-acoustic insulation [3,4,5,6].
MW is a short and hollow fiber that elongates from the seed of the common milkweed plant, Asclepias Syriaca. This fiber has an average diameter of 20–50 μm and a length of 20–30 mm. Like other lignocellulosic fibers, MW is primarily composed of cellulose, hemicellulose, and lignin. Moreover, it has been found that this fiber also contains a relatively high percentage of waxes that accumulate on its external surface, forming a hydrophobic protective layer that impairs good chemical resistance [4,5,7,8].
In the fashion industry, MW is characterized for its glossiness, silky texture, and lightweight nature. Recent studies have further revealed its good mechanical resistance, along with excellent thermal and acoustic insulation capacities. Most of these characteristics stem from its unusual hollow structure, resulting in a fiber with an overall porosity (θ) of 82.0 ± 4.0%, an apparent density (ρApp) of 274 ± 44 kg/m3, and a fiber wall density (ρf-w) of 1525 ± 50 kg/m3, comparable to that of other natural fibers. [4,5,7,9,10]. Figure 1 presents images of the follicle and seed fiber of the common milkweed plant.
In particular, the technical aspects of MW concerning its thermal insulation properties are of substantial interest due to its potential as a sustainable substitute to petroleum-based materials in insulation systems for vehicles, buildings, and clothing [3,4,5,6,11]. Despite the interest in this subject, most previous studies have exclusively focused on assessing the thermal insulation properties of MW in combination with other materials, such as goose down feathers, cotton, kapok, hemp, and century plant fibers [10,12,13,14].
The first report about the potential thermal insulation properties of MW dates to the 1940s [6]. However, the first actual measurement of MW’s insulation capacity was reported by P. Crews et al. in 1991 [14]. These authors assessed the use of MW as a loose fill for thermal insulation in jackets and determined that a one-inch layer of MW provided an insulation capacity of 2.24 clo, or the equivalent of 73.15 mW∙m−1∙K−1.
In a recent investigation conducted by P. Ganesan and T. Karthik, the authors evaluated the thermal conductivity (λ) of nonwoven mats made of MW, either alone or in combination with fibers from the century plant and Indian bowstring hemp. They found that a nonwoven mat with a fiber content of 34.4 kg/m3 yields an excellent thermal insulation capacity with a λ of 26.44 mW∙m−1∙K−1. The authors attributed the low λ of this nonwoven to its high porosity of 96.18% and reduced air permeability of 70 cm∙s. Additionally, they observed a decrease in λ by increasing the proportion of MW in hybrid nonwoven mats [13]. However, the authors did not report the temperature at which the measurements were taken.
However, the results obtained by P. Ganesan and T. Karthik differ from those obtained in a more recent investigation conducted by the authors. In this study, the λ of nonwoven mats made of MW with a fiber content of 7, 14, 21, and 28 kg/m3 was measured at 25 °C. The authors observed a decrease in the λ of the nonwovens with increasing fiber content. However, beyond 21 kg/m3, further increases in fiber content did not result in an additional decrease in λ. The nonwoven mat with a fiber content of 21 kg/m3 exhibited the lowest λ of 31.4 mW∙m−1∙K−1 [9].
The results from these studies suggest that nonwoven mats made of MW exhibit a λ comparable to common insulators like expanded polystyrene and polyurethane foams [15]. Despite these promising results, a comprehensive understanding of the impact of weather conditions, moisture content, and aging on the thermal insulation properties of MW is still needed for further investigation and eventual commercial applications [16].
This study aimed to examine the influence of temperature (T) and relative humidity (RH) on the thermal conductivity (λ), specific heat capacity (Cp), and thermal diffusivity (α) of nonwoven mats made of MW with a fiber content (ρ) ranging from 5 to 35 kg/m3. These results served to determine the optimal value of ρ to obtain the best thermal insulating properties in nonwovens made of MW alone.

2. Materials and Methods
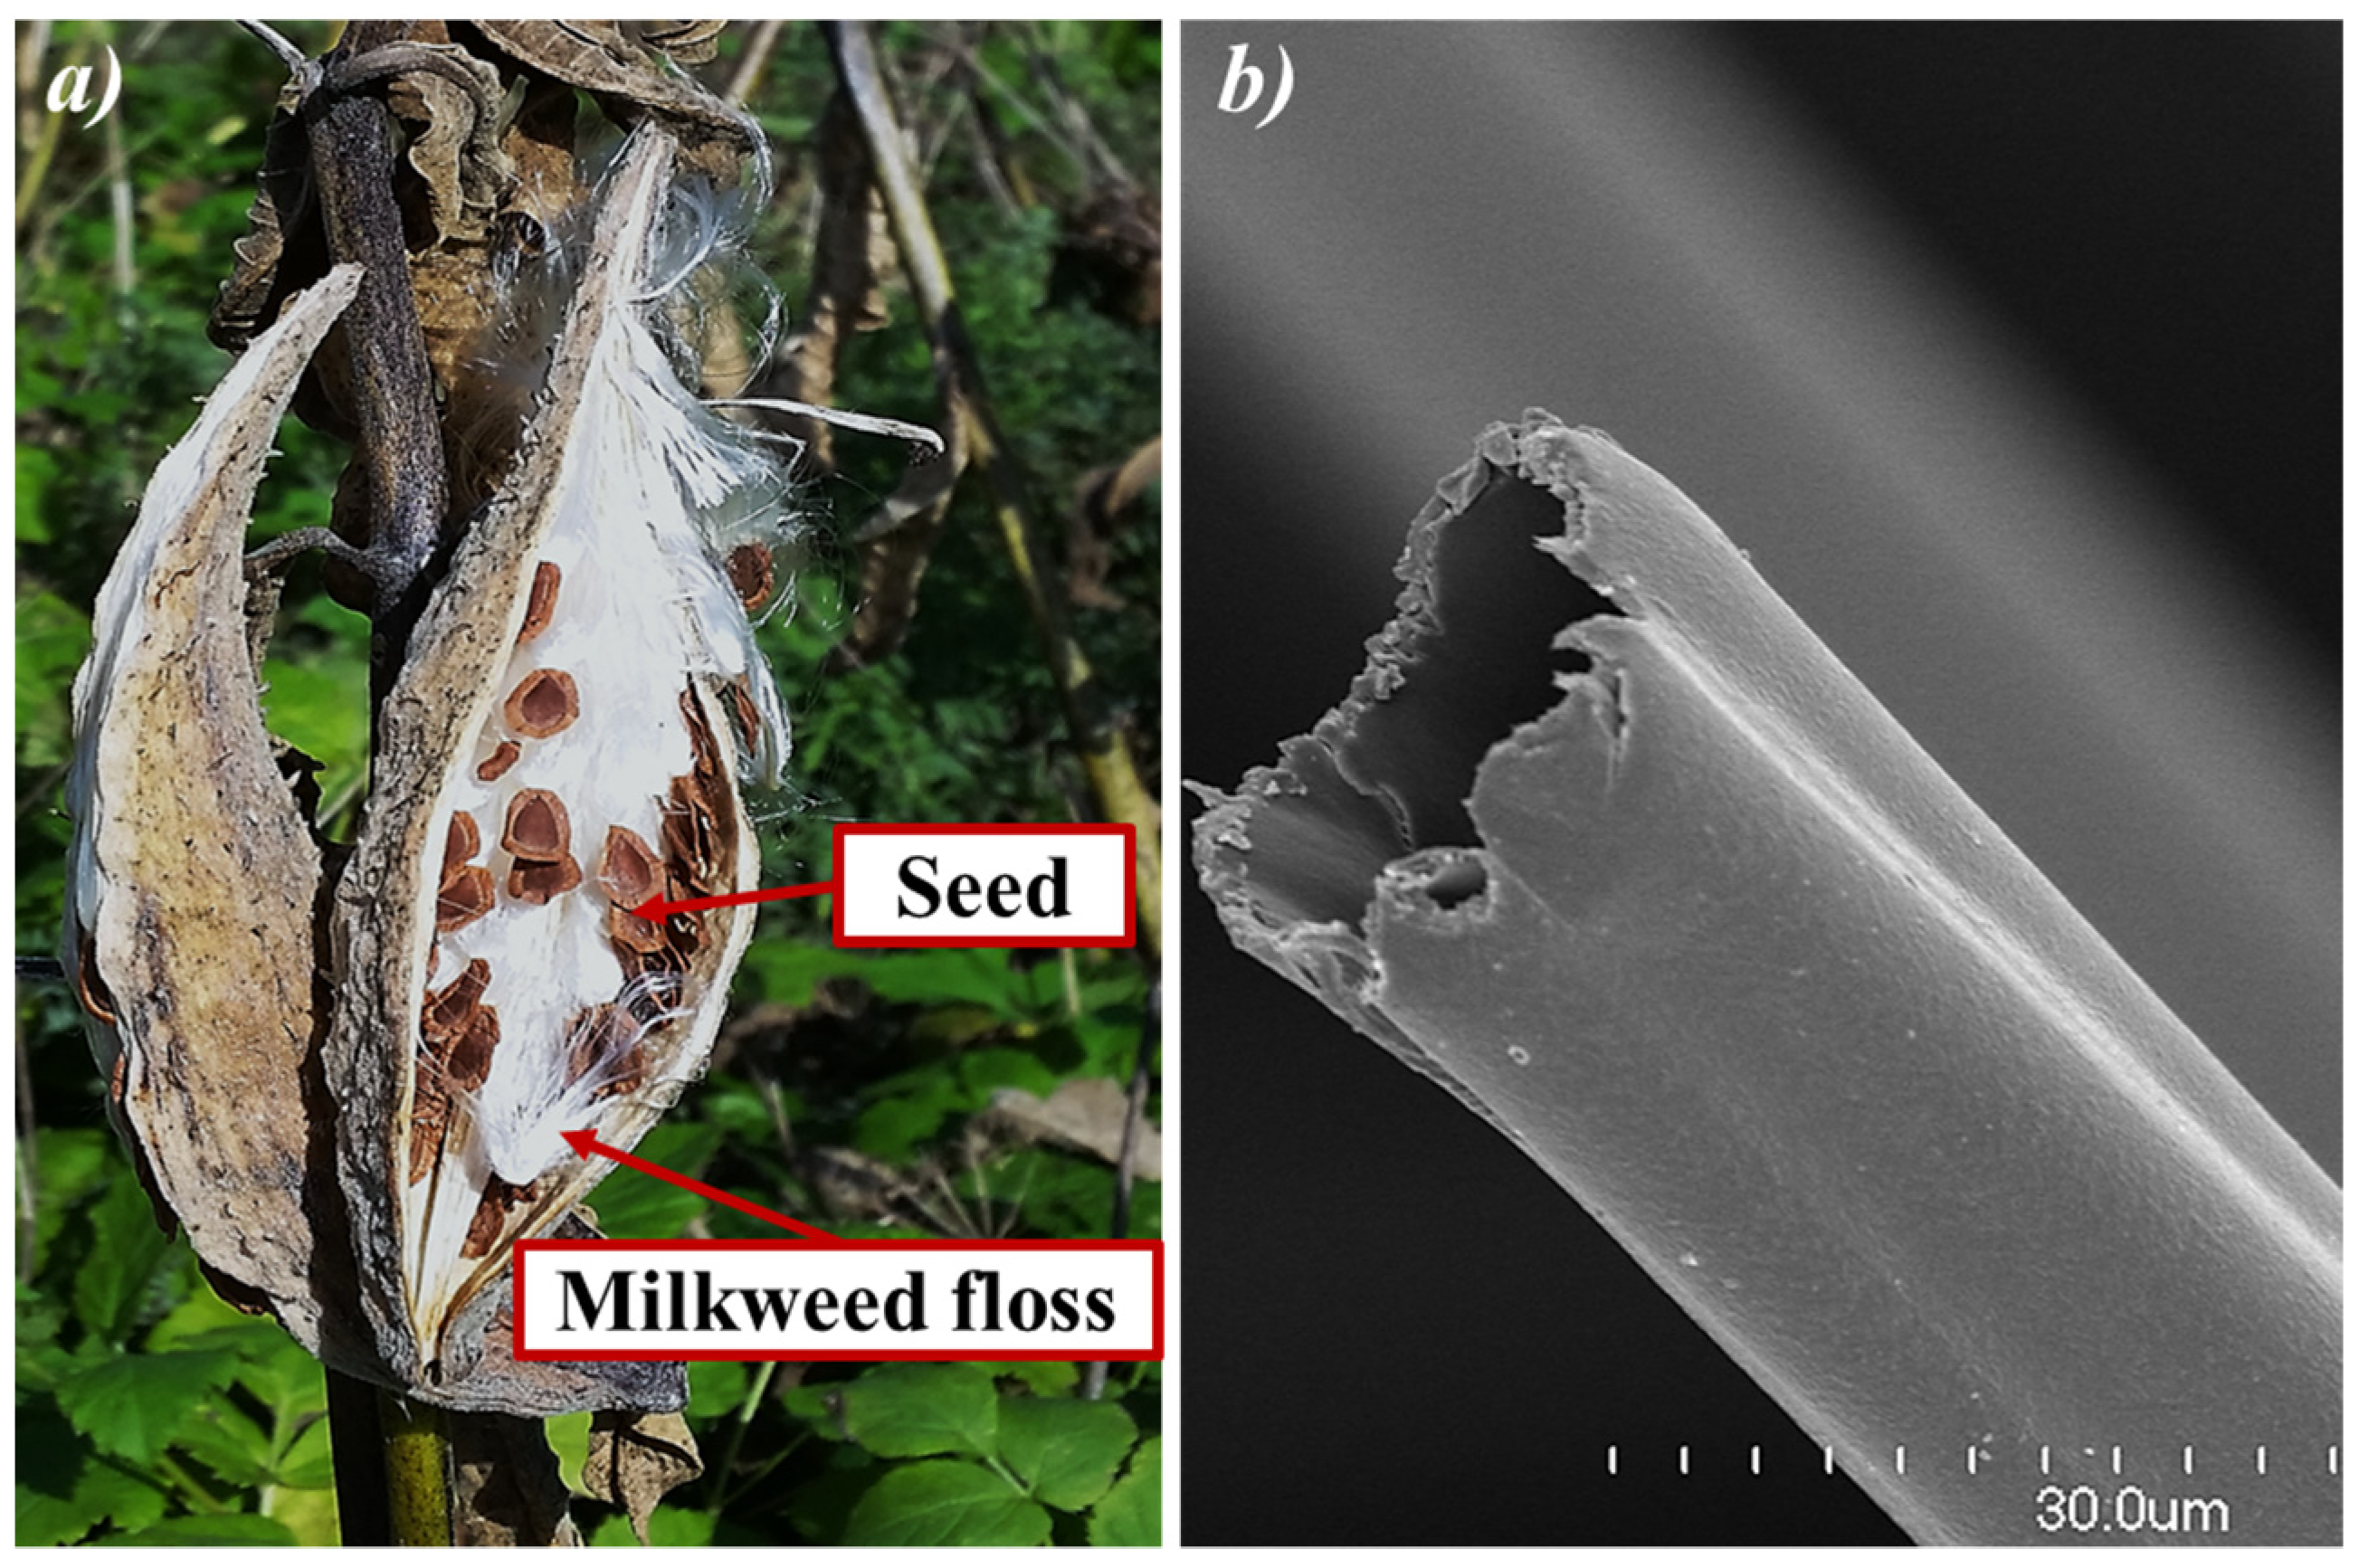
2.1. Materials

Milkweed floss (MW) was obtained from the Coopérative Monark, Saint-Michel-de-Bellechasse, QC, Canada. In a previous study, the authors established that these fibers possessed a length of 28 ± 7 mm, an external diameter of 23 ± 4 μm, and a wall thickness of 0.82 ± 0.27 μm [9].

2.2. Plant Guidelines

The experimental research and field studies on plants (either cultivated or wild), including the collection of plant material, comply with relevant institutional, national, and international guidelines and legislation. This includes compliance with the Sustainable Forest Development Acts of Quebec and the Textile Labelling and Advertising regulation from Canada.

2.3. Experimental and Analytical Evaluations of the Thermal Properties of Milkweed Floss

Nonwoven mats with various ρ were employed to evaluate the λ, Cp, and α of MW.

2.3.1. Drying and Measurement of Moisture Content of Milkweed Floss

The fibers were dried at 105 °C in a forced convection oven (SVAC4, Geneq Inc., Montreal, QC, Canada) until the change in mass between two successive measurements was less than 0.01%. The moisture content (MC) of MW was calculated using Equation (1), following the standard ASTM D2654 [17]. “Wwet” and “Wdry” are the weights before and after the drying step, respectively.
M C % = W w e t W d r y W w e t × 100

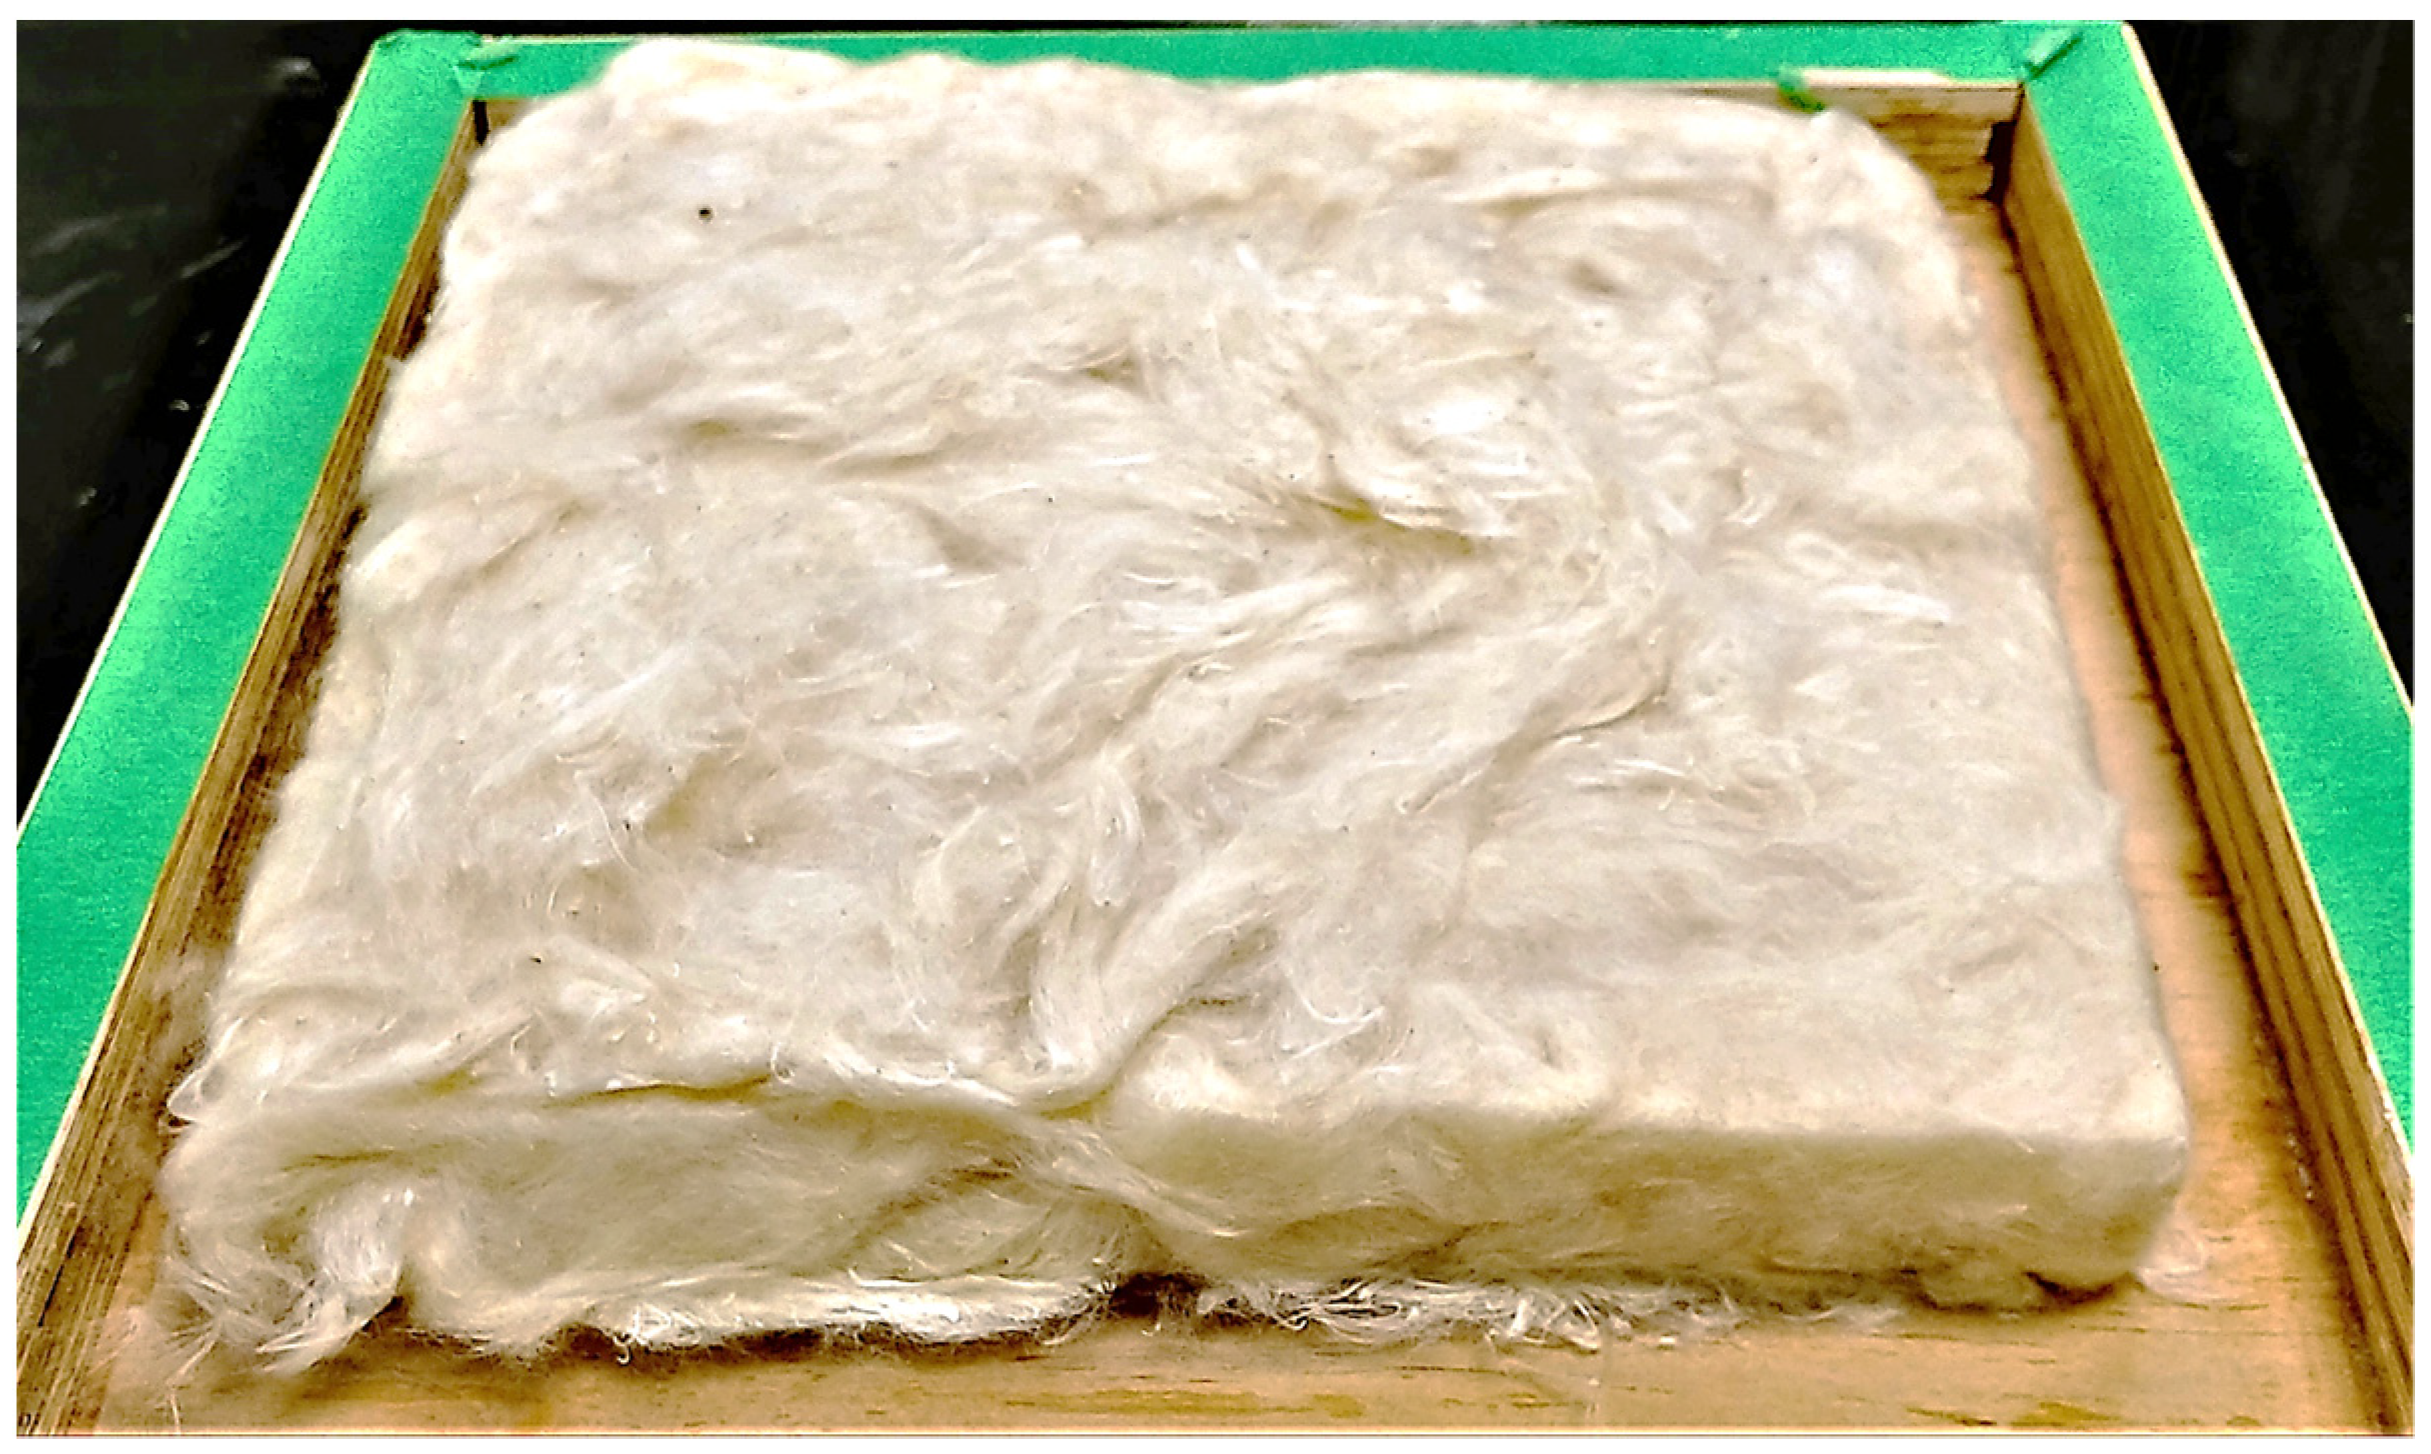
2.3.2. Production of Nonwoven Mats

After drying, the MW fibers were mechanically separated and uniformly aligned across the surface of a mold measuring 305 × 305 cm2 (12 × 12 inches) to produce nonwoven mats with a thickness of 2.54 cm (1 inch). The fiber content (ρ) of each sample was adjusted to 5, 10, 15, 20, 25, 30, and 35 kg/m3. The nonwovens were compressed to maintain a standard thickness of 2.54 cm. Figure 2 shows an image of a nonwoven mat made of MW.

2.3.3. Conditioning and Measurement of Moisture Regain of the Nonwoven Mats

The nonwoven mats were placed inside a humidity chamber (Multitron Pro, INFORS HT, Anjou, QC, Canada) kept at a constant temperature of 25 °C and subjected to varying RH levels of 30, 60, and 90%. Samples of MW with the same characteristics as the nonwoven mats were placed at the same time inside the humidity chamber to be used as standards to measure the MC and moisture regain (MR) of the MW at different RH levels following the standards ASTM D2654 [17] and ASTM D1776 [18]. The nonwoven mats and the standards were kept inside the humidity chamber until the change in the mass of the standards was less than 0.01% between successive weightings. MR and MC were calculated using Equations (2) and (3) and the Wdry and Wwet of the standards.
M R % = W w e t W d r y W d r y × 100
M C % = M R ( 1 + M R ) × 100
Hailwood and Horribin’s model, represented by Equation (4), was used to analyze the experimental data and predict the water absorption isotherm of MW at 25 °C. This model is commonly used to describe the water adsorption behavior of natural fibrous polymers such as wood, cotton, wool, and proteins. According to this model, the adsorption of water vapor by polymers is governed by the formation of a solid phase of water within the polymer, as well as the formation of polymer hydrates at the interface between the solid water and the polymer. The model assumes that the phases separate at a negligible rate, and they can be considered as a single phase [19].
In this model, “MW” represents the molecular weight of the polymer unit; “K” is the equilibrium constant between the dissolved water and surrounding water vapor; and “K1” is the equilibrium constant between the polymer hydrates and dissolved water [19,20,21,22,23]. These parameters were determined by minimizing the sum of squared errors between the experimental data and the model.
M W · M R % 1800 = K · R H 100 1 K · R H 100 + K · K 1 · R H 100 1 + K · K 1 · R H 100  
The Kelvin equation (Equation (5)) was used to analyze the possible formation of a water meniscus in the fibers’ lumen at 25 °C and different levels of RH. In this equation, “r” represents the theoretical radius of the water meniscus; “T” is the temperature in Kelvin; “R” is the ideal gas constant; and “σw”,MW-water, and “ρw” are the surface tension, molecular weight, and density of water, respectively. If the radius of the fiber is lower than “r”, the water does not evaporate, and a water meniscus is formed inside the lumen of the fibers [22].
r = 0.87 · σ w · M w w a t e r ρ w · R · T · ( 2 log R H )  

2.3.4. Estimation of Total Porosity and Mesoporosity of the Nonwoven Mats

The mesoporosity (θmeso) represents the volume fraction of empty spaces among the fibers, while the total porosity (θtotal) is the volume fraction of empty spaces that includes both the empty spaces among the fibers and their hollow portion or lumen. The θtotal of the nonwovens can be calculated by assuming that the fiber-wall density of the moist fibers (ρfwwet) can be described by Equation (6).
ρ f w w e t = ν w · ρ w + ( 1 ν w ) · ρ f w
In this equation, “ρfw” represents the fiber-wall density of MW (1525 kg/m3); “ρw” corresponds to the density of water at a given temperature; and “νw” represents the volumetric fraction of water in the fiber, which can be determined using Equation (7). “Vw” and “Ww” denote the volume and weight of water in a wet fiber, respectively. “Vfwet” and “Wfwet” represent the total volume and weight of a wet fiber, respectively. By combining Equations (3), (6), and (7), the fiber-wall density of a wet fiber can be estimated using Equation (8).
ν w = V w V f w e t = W w · ρ f w w e t   ρ w · W f w e t = ρ f w w e t ρ w · M C
ρ f w w e t = ρ f w · ρ w · 1 + M R ρ w · 1 + M R + M R · ( ρ f w ρ w )
When the fibers swell but the volume of the nonwoven mats remains constant, the volume fraction of wet fibers (“νfwet”) in the nonwoven can be calculated using Equation (9). In this equation, “Vi”, “Wi”, “Wfi”, and “Wa” correspond to the initial volume of the nonwoven, the initial weight of the nonwoven, the initial weight of all fibers, and the total weight of air in the nonwoven, respectively.
ν f w e t = V f w e t V i = W f w e t · ρ   ρ f w w e t · W i = ρ ρ f w w e t · W f i + W w W i = ρ ρ f w w e t · W i W a W i + M R
Using Equation (9), the θtotal of the nonwoven mats at different RH levels was calculated using Equation (10), where “ρa” corresponds to the air density at a given temperature. It is important to note that the effect of “Wa” can be neglected when ρf is much greater than ρa. Furthermore, Equations (9) and (10) are valid only if the volume of the nonwoven mats is kept constant.
θ t o t a l = 1 ρ f w · ρ ρ a + ρ · M R · ( ρ f w ρ a ) ρ f w w e t · ( ρ f w ρ a )
To calculate the θmeso of the nonwoven mats, it is necessary to have information about “Vfwet”. The swelling of fibers caused by moisture absorption can be described by the following expression, which leads to Equation (11). In this equation, “Vfi” is the initial volume of the fiber, and “ΔVfi” is the change in volume of the fiber due to swelling.
ρ f w ρ f w w e t = W f i · V f i W w · V f i V f i · V f i + V f i = ρ f w · V f i M R · V f i V f i + V f i
V f w e t = V f i + V f i = V f i ρ f w · ( 1 + M R ) ρ f w w e t
The volume fraction of the hollow fibers in the nonwovens at different RH levels (“νapparentwet”) can be calculated using Equation (12), where “ρapparent” represents the apparent density of dried MW (274 kg/m3). Accordingly, the θmeso of the nonwovens was calculated using Equation (13).
ν a p p a r e n t w e t = V f w e t V i = V f i V i · ρ f w · 1 + M R ρ f w w e t = ρ f w · ρ ρ a · ( 1 + M R ) ρ f w w e t · ( ρ a p p a r e n t ρ a )
θ m e s o = 1 ρ f w ρ ρ a · ( 1 + M R ) ρ f w w e t · ( ρ A p p ρ a )

2.3.5. Experimental Evaluation of the Thermal Conductivity, λ, and Thermal Resistance, R-Value

The λ of the nonwoven mats with different levels of ρ was measured using a heat-flow meter (FOX 314, TA Instruments, New Castle, DE, USA) at mean temperatures of 5, 15, 25, 35, and 45 °C and using a thermal gradient of 20 °C between the heating plates, following the standard ASTM C518 [24]. This procedure was performed for the nonwoven mats at 0, 30, 60, and 90% RH. Additionally, Tukey’s multiple comparison test and n-ways ANOVA with a significance level of 0.01 were performed to evaluate possible differences between the least squares means (LSM) of the λ of the nonwovens with different levels of ρ and at various temperatures and RH levels.
Equation (14) was employed to determine the thermal resistance (R-value) at 25 °C (298.15 K) in English system units for the nonwoven mats with a thickness of 1 inch.
R v a l u e = 1   i n c h λ 25 ° C · 0.0254   m 1   i n c h · 5.678263337   h   f t 2   ° F B t u 1   m 2   K W

2.3.6. Experimental Evaluation of Specific Heat Capacity, Cp, and Thermal Diffusivity, α

The Cp of MW at 0, 30, 60, and 90% RH was measured using alternating differential scanning calorimetric (A-DSC) analysis in a DSC (Pyris 6000, Perkin-Elmer, Waltham, MA, USA), following the procedure from the standard ISO 11357-4. The steady-state isothermal heat flow of the samples and blank crucibles were measured using a stepwise thermal program, including isothermal steps of 5 min at 5, 10, 15, 20, 25, 30, 35, 40, and 45 °C and a heating ramp of 5 °C/min at the end of each isothermal step. Samples of 10 mg were used for this test. The isothermal heat flow of the crucibles was subtracted from the samples’ heat flow. Equation (15) was used to calculate the heat capacity of MW at different temperatures and RH levels (CpMW(T°,RH)), where “ΔH” and “β” are the steady-state heat flow and heating rate, respectively.
C p M W ( T ° , R H ) = H s a m p l e H c r u c i b l e W s a m p l e · β = H W s a m p l e · β
Equation (16) was used to calculate the thermal diffusivity of the nonwoven mats at different temperatures and RH levels (α(T°,RH)), where “Cpair(T°,RH)”, “ρa(T°,RH)”, and “λ(T°,RH)” represent the specific heat capacity of the air, the density of the air, and the thermal conductivity of the nonwoven mats at a given temperature and RH level, respectively [22].
α ( T ° , R H ) = λ T ° , R H % θ t o t a l · ρ a ( T ° , R H ) · C p a i r ( T ° , R H ) + ( 1 θ t o t a l ) · ρ f w w e t · C p M W ( T ° , R H )

3. Results and Discussion

3.1. Moisture Content and Moisture Regain

The fibers used for this study had an initial MC of 4.84% ± 0.37%, which is considerably lower than the average MC in wild MW of 53.8 ± 25.4% [4,5,25,26,27]. The low MC of these samples is a result of an industrial drying process conducted to optimize the separation of the floss from the seeds and placenta [28].
Figure 3 displays the experimental values for the overall MR of the fibers at 25 °C and different RH levels. At RH levels between 30% and 60%, MW exhibited a water regain capacity comparable to other seed fibers, such as cotton. However, at RH levels above 60%, MW presented a higher MR than cotton and other seed fibers, possibly due to its high porosity, large surface area, and high proportion of amorphous structures [4,5,10,13]. Nevertheless, these findings should be complemented with a similar test conducted across broader ranges of temperatures and RH levels to gain a better understanding of MW’s dynamic water adsorption behavior.
The parameters obtained from fitting the Hailwood–Horribin’s model to MW at 25 °C were 432.079 g/mol for the “Mw”, 0.875 for “K”, and 1.923 for “K1”. The red dotted line in Figure 3 illustrates the theoretical values of MR for MW calculated using Equation (4). The model showed a good fit to the experimental data across the tested RH levels. Therefore, it can be concluded that the assumptions made in this model applied to the water absorption behavior of MW [19,20,21,23].
Equation (5) was used to assess the theoretical formation of a water meniscus inside the fibers’ lumen. At 25 °C, the theoretical values of “r” were 0.9, 2.1, and 10.1 nm at 30, 60, and 90% RH levels, respectively. MW has an overall inner diameter of 14.23 ± 2.0 µm, meaning that the fiber’s inner diameter is too large to enable the formation of a water meniscus at a RH level below 90%. Indeed, previous studies demonstrated that the amount of capillary water in fibers becomes considerably high only at RH levels above 99% [20,22].

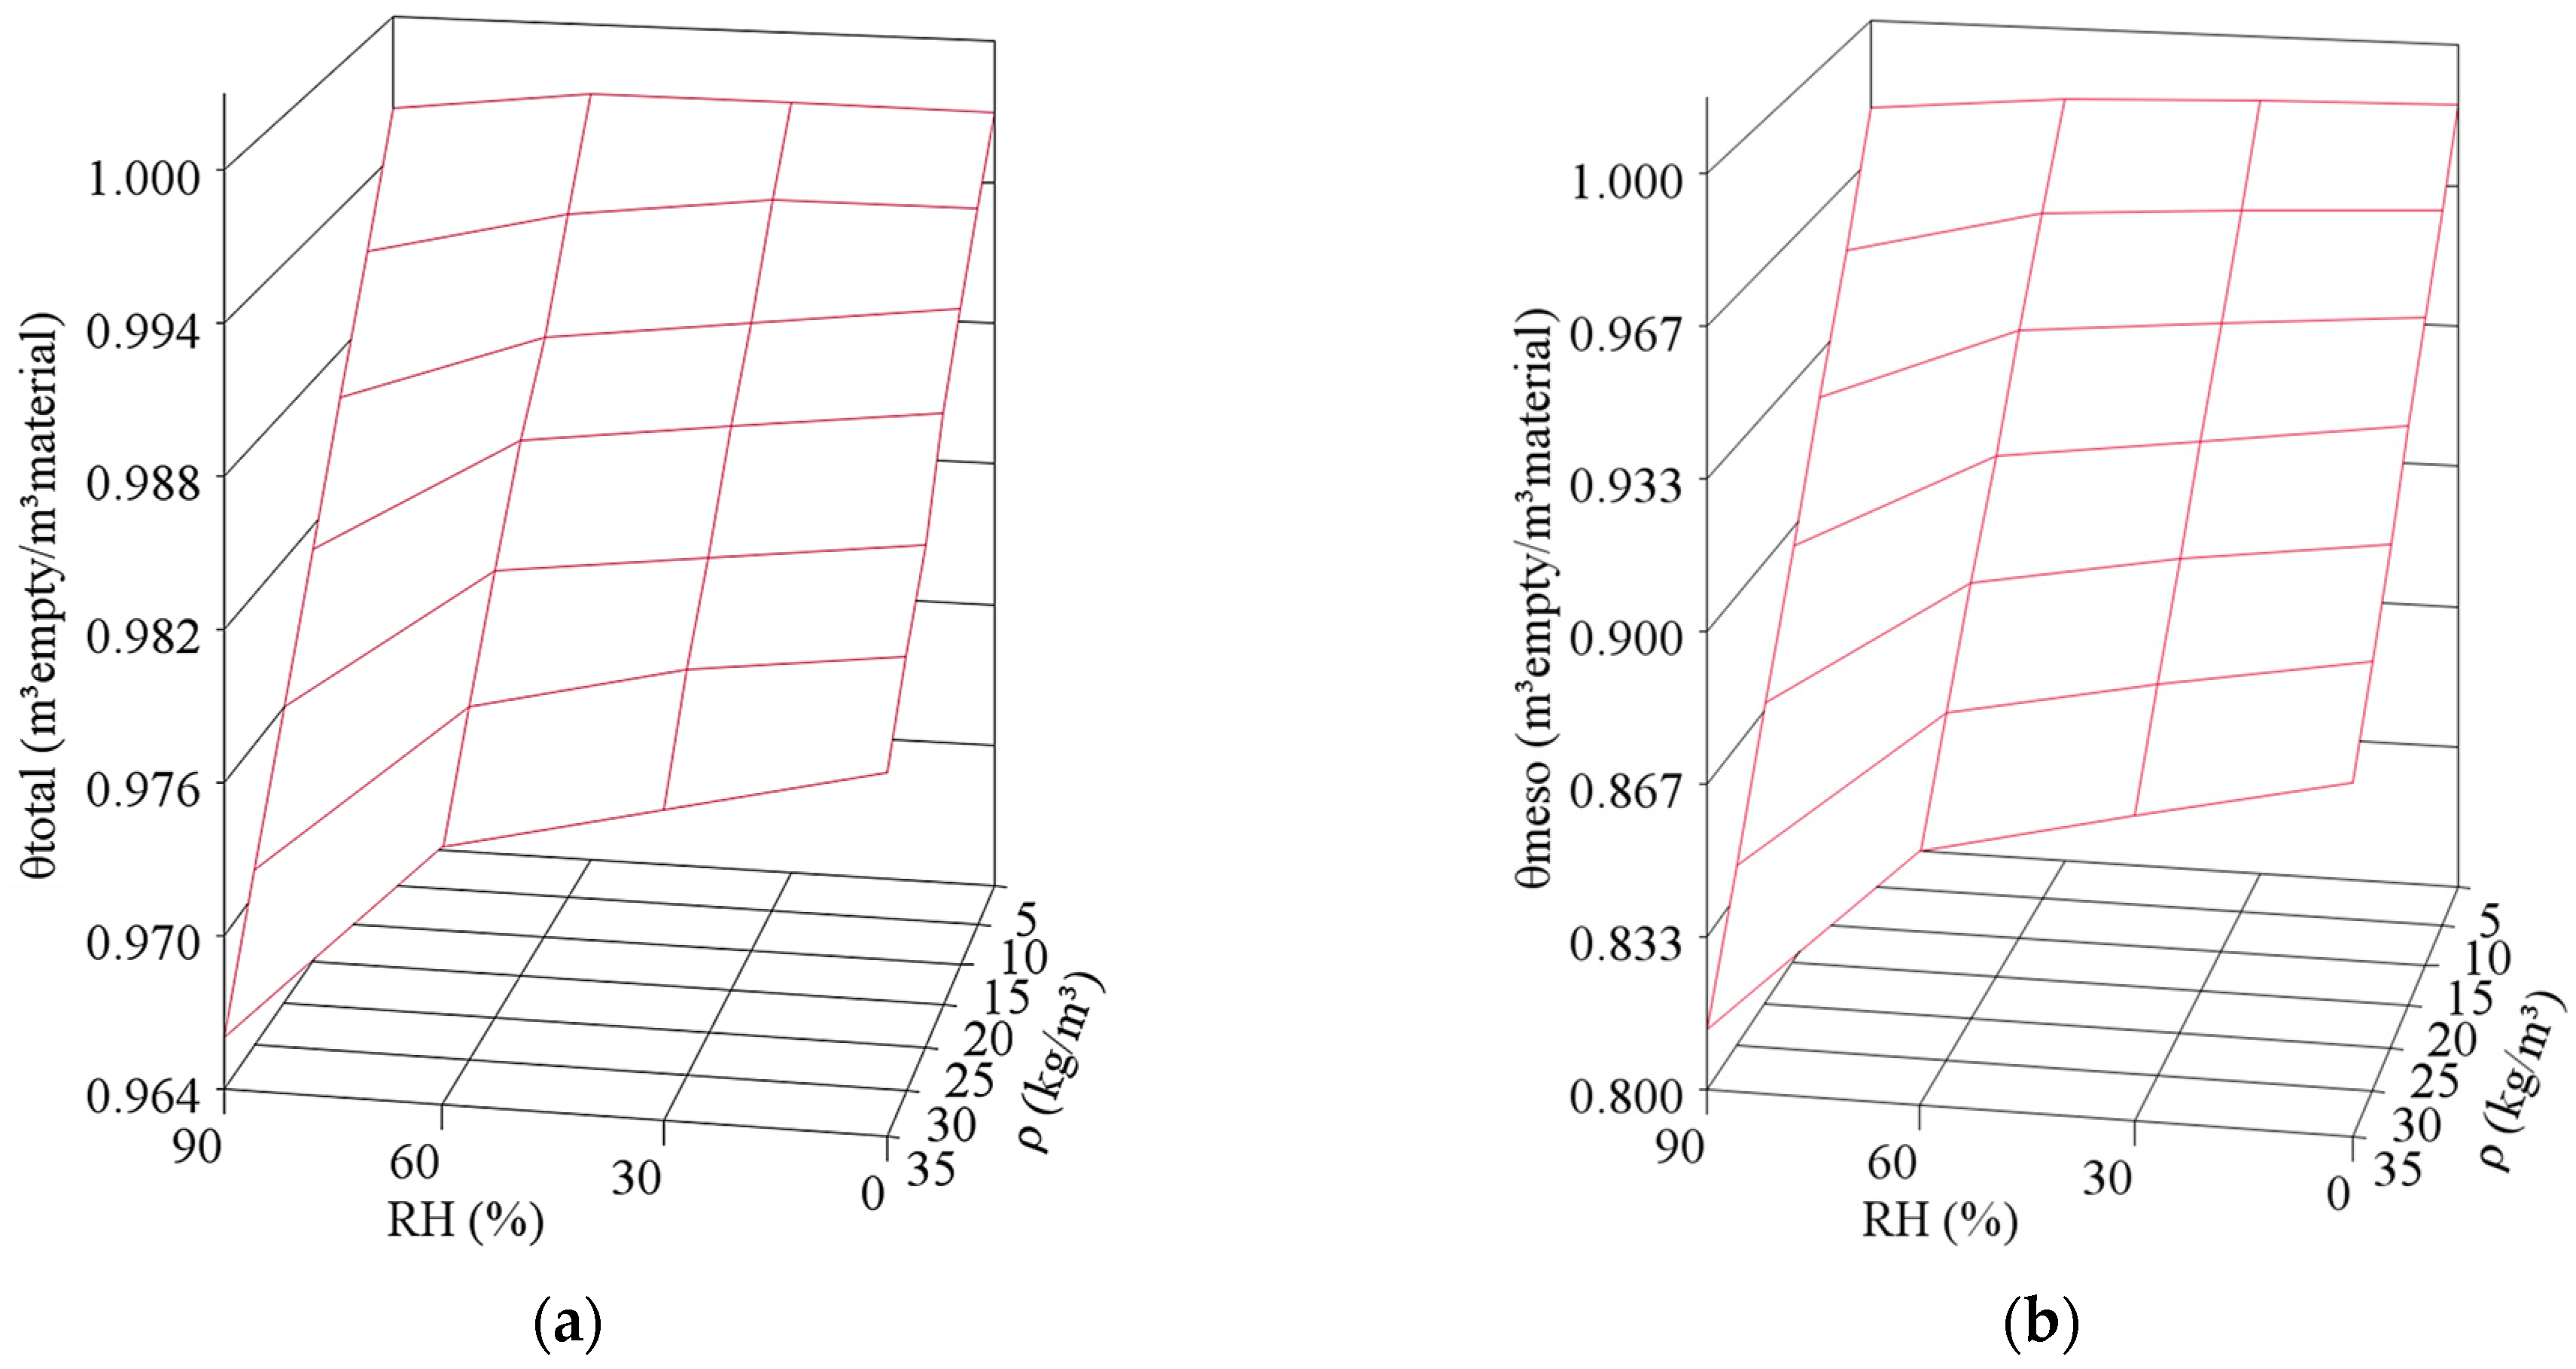
3.2. Mesoporosity and Total Porosity

Figure 4 shows the variations in θtotal and θmeso of the nonwoven mats due to changes in fiber content and RH. It is worth mentioning that temperature has a negligible effect on θtotal and θmeso. Increasing the fiber content resulted in a decrease in θmeso and θtotal at all levels of RH.
The effect of the RH on θmeso and θtotal is strongly dependent on the fiber content of the nonwovens. At a fiber content of 5 kg/m3, increasing the RH from 0 to 90% led to almost negligible changes of 0.11% and 0.70% in the θtotal and θmeso of the nonwoven, respectively. At 35 kg/m3, the same change in RH resulted in variations in the nonwovens’ θtotal and θmeso of 1.16% and 7.11%, respectively. Indeed, at higher ρ, the influence of RH on porosity becomes more pronounced, as more fibers swell due to water adsorption, resulting in a greater reduction in the empty volume within the sample [9,22,29].

3.3. Thermal Conductivity

Figure 5 displays the λ of nonwoven mats with varying fiber contents and at different temperatures (T) and RH levels. A positive linear correlation was observed between T and the λ of the nonwovens, matching the behaviors observed in air and amorphous/semicrystalline solids like cellulose fibers, which are the main two components of nonwovens [29,30,31,32,33,34]. Indeed, previous studies have shown that cellulose fibers exhibit a gradual linear increase in λ with temperature until they approach their degradation temperature. This subtle increase has been attributed to the inherent short length of the crystalline regions, which are interspersed with amorphous regions within cellulose elementary fibrils. This molecular arrangement constrains the phonon transfer within the fibrils [30,31].
Furthermore, at a constant fiber content, an increase in RH led to a general rise in λ due to several factors. First, fiber swelling led to a decrease in both θtotal and θmeso within the nonwovens, thereby reducing the volume of air between and within the fibers. Second, the presence of liquid and associated water contributed to an overall increase in the λ of the nonwoven’s constituents.
The extent of the increase in λ with RH varied based on the fiber content of the samples. At a constant temperature, increasing RH from 0 to 30% resulted in a substantial rise in the λ of nonwovens with ρ below 10 kg/m3. However, any subsequent increase in RH beyond 30% had a negligible impact on their λ.
Nonwovens with a ρ of 15 kg/m3 or greater exhibited a sigmoidal relationship between RH and their λ. For these samples, their λ augmented when the RH was increased from 0 to 30%. Subsequently, their λ remained approximately constant within RH levels between 30 and 60%. Eventually, their λ experienced another increase when RH was raised from 60 to 90%. These variations in λ closely resembled the behavior of MR with RH, as discussed earlier.
A similar behavior between λ and RH has been observed in nonwoven mats made of mineral or organic fibers, such as rock wool, jute, hemp, and sisal [33,35,36]. At low RH levels, the increase in λ of these nonwovens has been attributed to the onset of water condensation in the micropores of the fibers and the rise in moisture in the air within the microstructure. At RH levels below 70%, λ remains relatively constant as the micropores and fiber surface become increasingly saturated with water. Finally, at a higher RH level, water condenses at a faster rate, leading to the filling of the micropores, fiber swelling, and the formation of a water layer on the fiber surface. These effects result in an increased contact area between fibers and more effective heat transfer through conduction [16,29,33]. These phenomena become more pronounced as the number of fibers increases.
The influence of ρ on the λ of the nonwovens exhibited a complex behavior. At the tested T and RH levels, increasing ρ from 5 and 20 kg/m3 led to a reduction in the nonwovens’ λ. Further increasing ρ from 20 to 25 kg/m3 had a minimal influence in λ. However, a further increase in ρ above 25 kg/m3 resulted in a gradual increase in λ of the nonwovens. Hence, it is possible that an optimal threshold level of ρ exists, beyond which increasing or decreasing this value could compromise the insulation properties of the material.
The high λ observed in nonwovens with a moderate ρ can be attributed to their low tortuosity and a large volume of air, which is a good insulator but a poor heat sink. Even with a high porosity, nonwovens with low ρ lack enough fibers to effectively store heat and impede the unrestricted flow of air within their structure. The flow of air eventually becomes a driver for heat transfer via natural convection, leading to an increase in the rate of heat transfer across the nonwoven [25,29,37,38].
Conversely, nonwovens with a high ρ possess a closely interconnected and densely packed network of fibers, which enhances heat transfer through conductivity across the material. Additionally, a high fiber content reduces the air volume, or porosity, which would otherwise lower the thermal conductivity of the nonwoven by slowing the conduction of heat throughout the fibers [9,29,35,39,40,41,42].
Hence, the optimal threshold level of ρ represents the optimal equilibrium between the beneficial effects of increasing the fiber content to reduce heat convection induced by air movement, while avoiding a substantial increase in heat conduction within and among the fibers. While other thermal insulators like cellular polymers and nonwovens bats exhibit a similar relationship between λ and ρ, the precise threshold level of ρ at which λ plateaus and subsequently increases varies across different materials [2,9,29,35,36,38,43].
The lowest λ was obtained when ρ was between 20 and 25 kg/m3, which is consistent with the findings of a previous study when the λ of MW was evaluated at 25 °C and room RH [9]. The results showed that an increase in ρ from 5 to 20 kg/m3 led to a decrease in λ of 29, 31, 31, and 24% at RH levels of 0, 30, 60, and 90%, respectively. Similarly, when ρ was changed from 5 to 25 kg/m3, λ decreased by 30, 32, 29, and 25% at RH levels of 0, 30, 60, and 90%, respectively.
Table 1 presents the results of the statistical analysis for the λ of the nonwovens.
The statistical analysis demonstrated that the data followed a normal distribution. Additionally, there was no statistically significant difference among the LSM of λ for the nonwovens with a ρ equal to or greater than 15 kg/m3. Furthermore, λ was less affected by variations in RH when ρ was between 20 and 30 kg/m3. Accordingly, the balance of lightweight, thermal insulation and fiber consumption was achieved with a value of ρ between 20 and 25 kg/m3.

3.4. Thermal Resistance (R-Value)

Figure 6 shows the R-value of nonwovens with a thickness of 1 inch and different levels of ρ at various RH levels and 25 °C (298.15 K). Since thermal resistance is the reciprocal of λ, the analysis from the previous section applies to the R-value as well. Thus, the R-value decreased at higher RH levels and improved with the increase in ρ until reaching an optimal threshold level between 20 and 25 kg/m3.
Interestingly, a one-inch nonwoven mat with a ρ between 20 and 25 kg-MW/m3 has an R-value comparable to, or even superior to, popular insulators such as low-density expanded polystyrene foams, high-density extruded polystyrene foams, loose-fill cellulose, loose-fill fiberglass, stone wool, loose PET shreds, cotton fibers, and polypropylene (PP) nonwoven fabrics [29,44,45]. For instance, in a fixed volume, 1 kg of MW provides a similar thermal resistance as approximately 1.4 kg of loose-fill cellulose, 1.7 kg of expanding loose-fill fiberglass, 1.0 kg of PP-needled nonwoven fabrics, and 1.0 kg of 3M Thinsulate® SM 600L. These estimates indicate that MW has a better or comparable thermal resistance-to-weight ratio compared to these other materials.

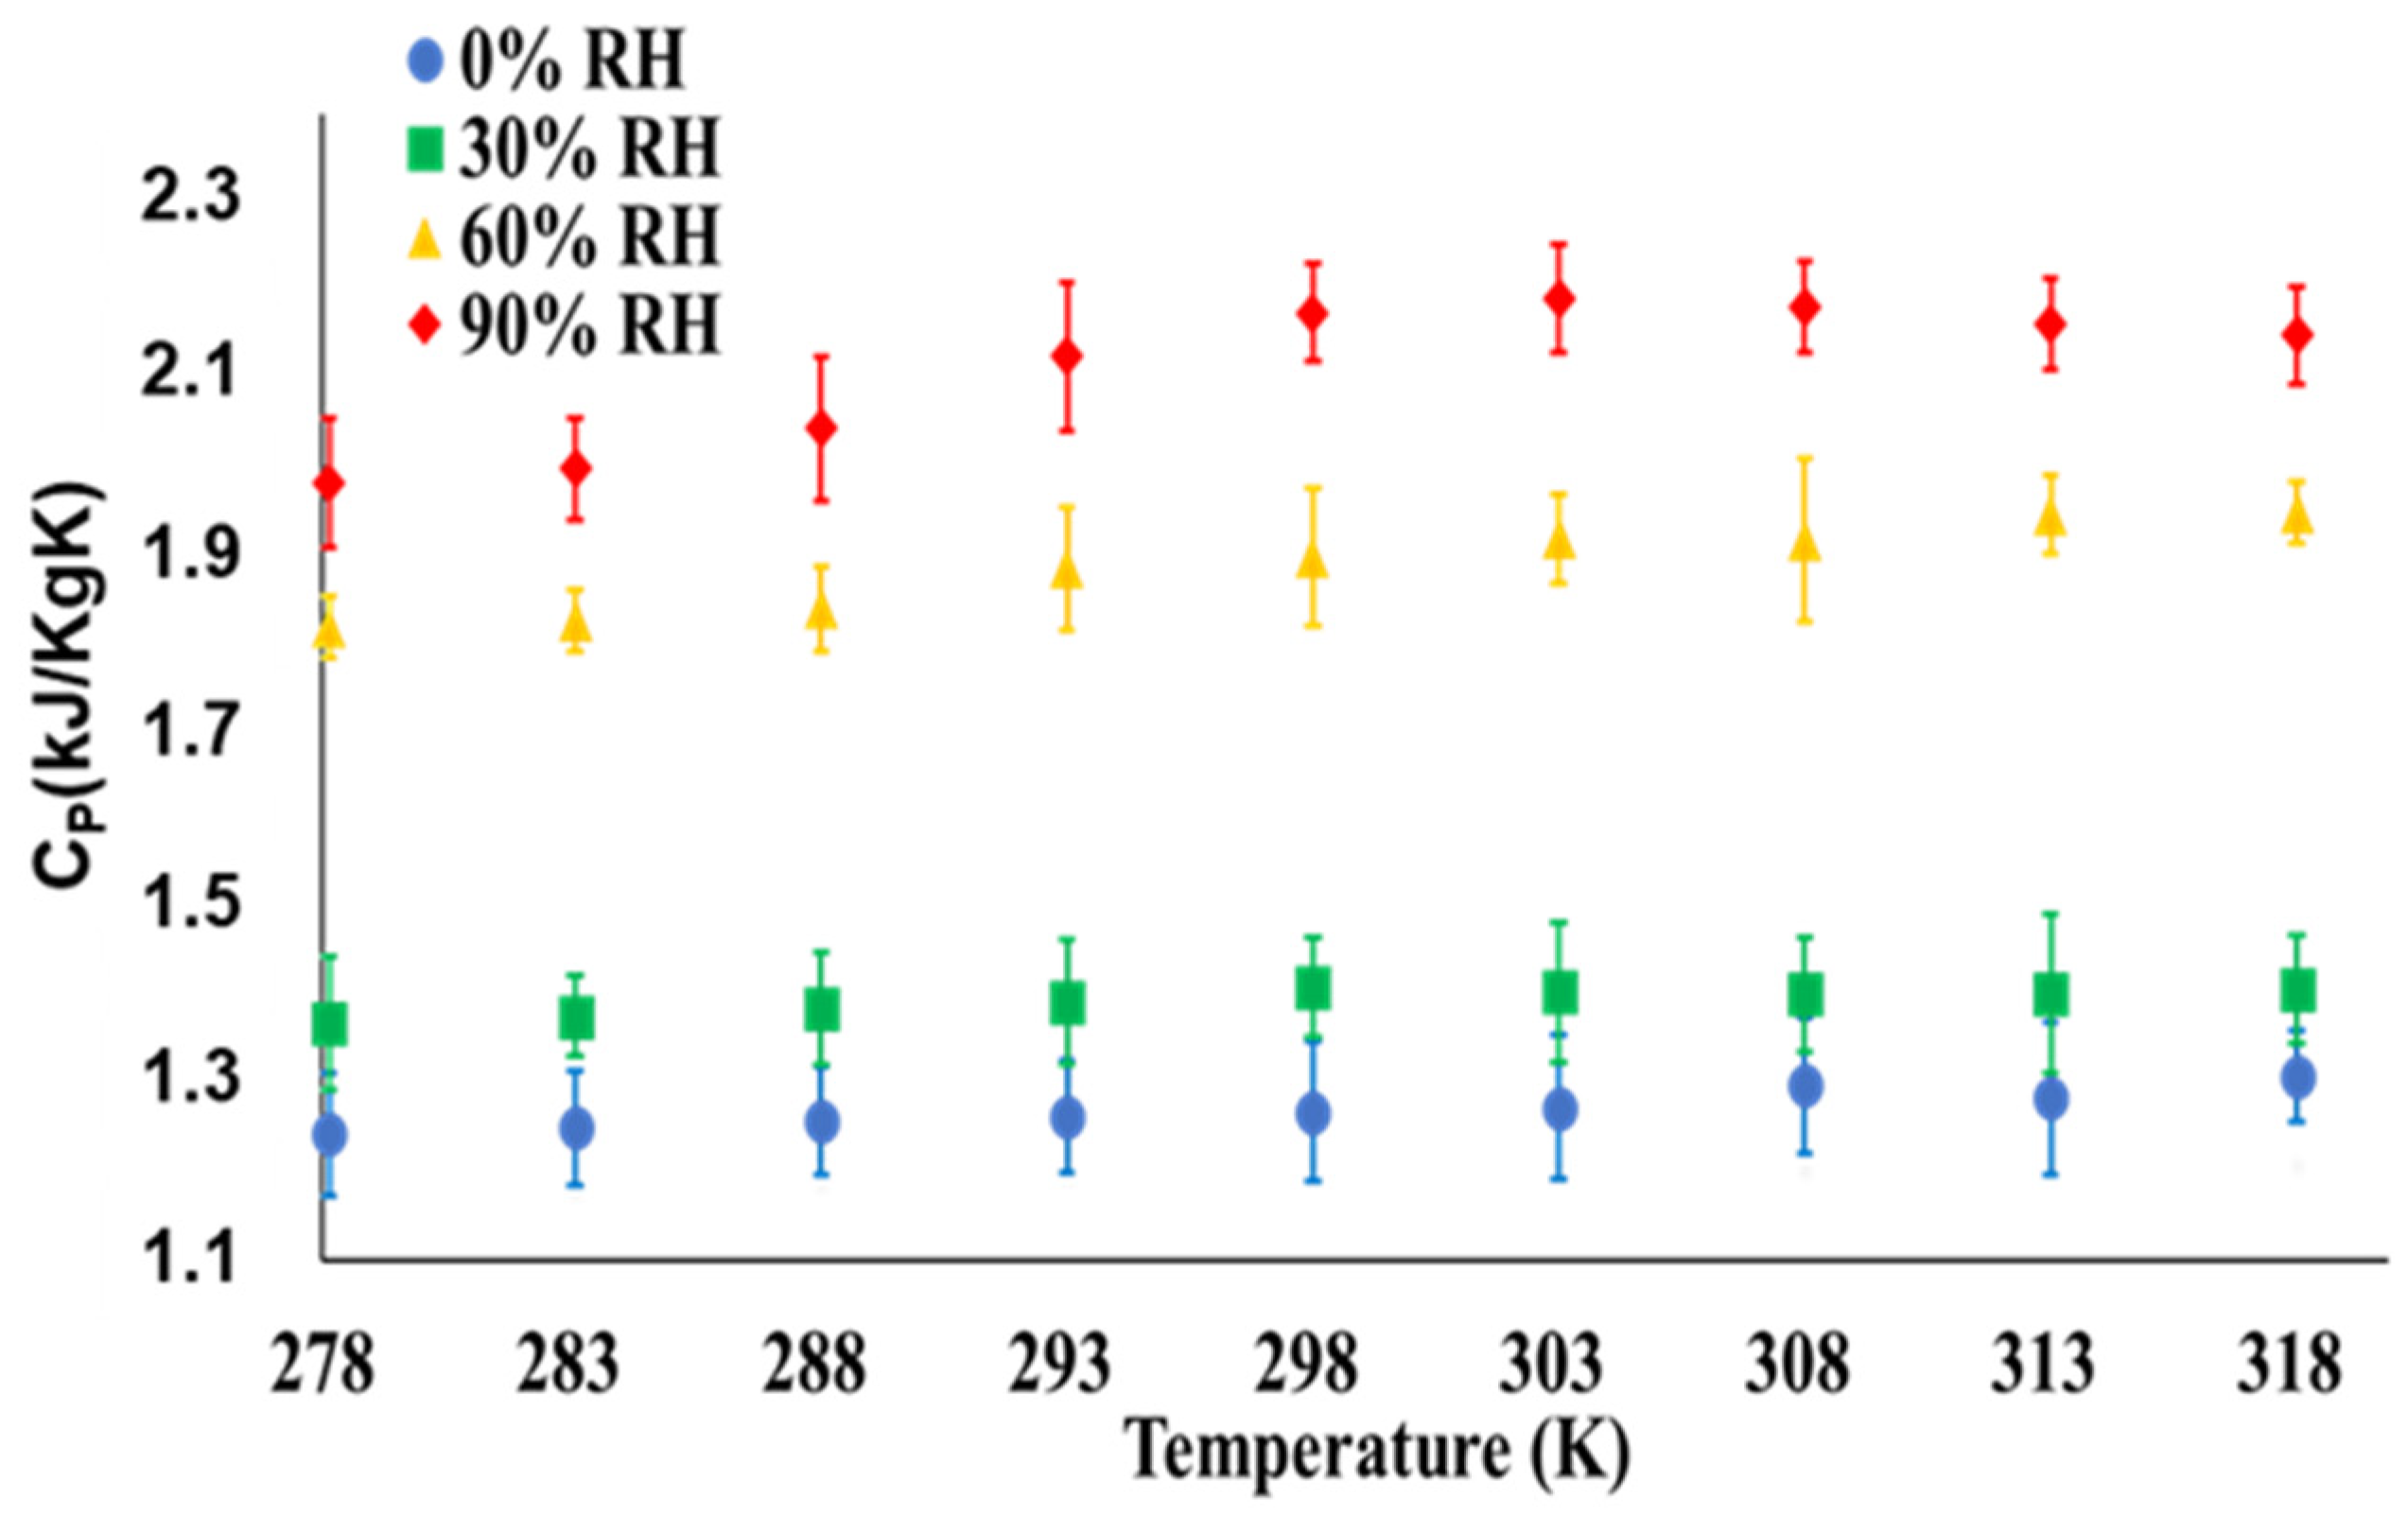
3.5. Specific Heat Capacity

Figure 7 presents the Cp of MW across different temperatures and RH levels. The Cp of dried MW showed a weak and linear increase with temperatures between 5 °C and 45 °C (278.15 K to 318.15 K). This temperature-dependent trend of Cp is consistent with the behavior observed in the main building blocks of lignocellulosic structures, such as hemicellulose, lignin, and crystalline and amorphous celluloses, which also exhibit a linear increase in Cp with temperature. Indeed, the Cp of MW falls in between the individual Cp values of these elements at different temperatures [46,47,48,49,50,51].
The Cp of MW increased along with rising RH levels within the range of temperatures examined in this study. This variation in Cp with RH resulted from moisture regain and exhibited a pattern similar to the behavior observed in other polymer-water systems, including polysaccharide-water and protein-water complexes. In these systems, the increase in Cp with MR has been linked to the incorporation of non-bonded liquid water, which has a greater Cp than the polymer. Moreover, it has been associated with an increase in free volume and a gain in large-amplitude conformational motions of the polymer due to the plasticizing effect of water [46,52,53,54].
The slight increase in Cp with MR between 0 and 30% RH can be described by using a rule of mixtures, suggesting that the vibrations of non-bonded water may be the primary factor contributing to the Cp increase. However, the increase in Cp with MR above 30% RH cannot be solely explained by a rule of mixtures. Therefore, these variations in Cp may be attributed a combination of several phenomena, such as the vibration of non-bonded water and changes in the molecular arrangement of MW in the presence of water. To fully understand the variations in MW’s Cp with water, these results need to be complemented with measurements of crystallinity and molecular composition.

3.6. Thermal Diffusivity

Figure 8 shows the α of the nonwovens with various levels of ρ and at different RH levels and temperatures.
The α of the nonwovens decreased as ρ increased, which can be attributed to both the enhancement in their heat storage capacity (the product between ρ*Cp) and the decrease in their λ. Indeed, at a constant temperature, there was a difference of over 10 orders of magnitude between the α of nonwovens with ρ values of 5 and 35 kg/m3, respectively. The rate of decrease in α started to level off when ρ was increased above 25 kg/m3, indicating that further increases in ρ beyond this point may not provide a substantial improvement to the insulation properties of the nonwovens.
The relationship between RH and α is more complex. Increasing RH might appear to lower the α of the nonwovens. However, such a decrease was due to a more substantial increase in the heat storage capacity of the nonwovens compared to the moderate increase in their λ caused by moisture adsorption. In other words, wet nonwoven mats tend to store heat rather than allow it to diffuse across their surface. However, a low α is desirable for thermal insulation only when the reduction in α arises from a decrease in λ rather than an increase in Cp. An increase in Cp indicates that the material would require more heat to reach thermal equilibrium with its surroundings, which essentially implies a greater energy demand from the warm sources of the surroundings [16,26].
The influence of temperature on α seemed to diminish as the ρ of the nonwovens increased. This behavior could be attributed to a decrease in the air volume at higher values of ρ, as well as comparable increases in λ and Cp with temperature. The thermal properties of air are highly sensitive to temperature changes compared to MW. Consequently, reducing the air volume within the nonwovens decreased the sensitivity of their α to temperature changes. Additionally, it appeared that the λ of the nonwovens and Cp of MW increased at a similar rate with temperature, potentially offsetting each other’s individual effects on α.

4. Conclusions

Milkweed floss (MW) demonstrated water absorption behavior comparable to other natural fibers, such as cotton, at relative humidity (RH) levels below 60%. However, it exhibited a greater moisture regain (MR) at higher RH levels.
Both the specific heat capacity (Cp) of MW and thermal conductivity (λ) of the nonwoven mats exhibited linear increases with temperature and irregular increases with rising RH levels. The temperature-related increases in λ and Cp may be attributed to a gain of internal energy by the fiber and of kinetic energy from the gas phase. Conversely, the variations in λ and Cp with RH resulted from a more complex combination of factors. The increase in λ with RH was influenced by phenomena such as the higher λ of humid air, the presence of adsorbed water within the fibers, and the reduction in air volume caused by fiber swelling. These effects were more pronounced at higher levels of fiber content (ρ). On the other hand, an in-depth analysis of the molecular interaction in the MW–water system may be necessary to fully understand the increase in MW’s Cp with rising RH levels.
The optimal values of thermal resistance (R-value) and fiber consumption were achieved with nonwoven mats having a ρ between 20 and 25 kg/m3. Beyond this range, increasing ρ led to higher fiber consumption without substantial improvements in the R-value. The range between 20 and 25 kg/m3 corresponds to the optimal ρ threshold for nonwoven mats made of MW aligned in a uniform direction. However, the breadth of this range may vary for nonwoven mats with a different type of fiber arrangement.
Increasing ρ resulted in a progressive decrease in the thermal diffusivity (α) of the nonwovens, primary due to an improvement in their heat storage capacity and a decrease in their λ. The influence of temperature on α diminishes at higher ρ, likely due to a reduction in the air volume within the fibers. Additionally, increasing RH appeared to decrease α; however, a decrease in α caused by moisture adsorption is not advantageous for thermal insulation purposes. Therefore, to maintain the thermal insulation capacity of the nonwovens, it is crucial to keep the fibers as dry as possible.
The results of this study highlighted several technical advantages of using MW as a thermal insulation material across different temperatures and RH levels. However, it may be worth exploring further aspects such as the effects of fire-protection agents, temperature, and RH on the long-term thermal insulation performance of MW.
Finally, it is worth mentioning that to establish MW as an economically feasible alternative for thermal insulation, it is crucial to promote its large-scale cultivation.

Author Contributions

S.S.-D. conceptualized the study, defined the methodology, collected and analyzed the data, and wrote the manuscript. M.R. and S.E. were involved in editing, reviewing the manuscript, and provided funding for the research study. All authors have read and agreed to the published version of the manuscript.

Funding

This research received no external funding.

Data Availability Statement

The dataset used during the current study is available from the corresponding author upon reasonable request. It is also included in this article.

Conflicts of Interest

The authors declare no conflicts of interest.

References

  1. Kamara, L.A.; Chisale, V.S.; Kgabi, P.; Onjefu, N.A.; Zulu, N.A. Thermal efficient isolating materials from agricultural residues to improve energy efficiency in buildings. Int. J. Civ. Eng. Technol. 2019, 10, 2067–2074. [Google Scholar]
  2. Stapulionienė, R.; Vaitkus, S.; Vėjelis, S.; Sankauskaitė, A. Investigation of thermal conductivity of natural fibers processed by different mechanical methods. Int. J. Precis. Eng. Manuf. 2016, 17, 1371–1381. [Google Scholar] [CrossRef]
  3. Kalayci, E.; Avinc, O.; Turkoglu, K.B. Importance of Asclepias Syriaca (Milkweed) fibers in sustainable fashion and textile industry and its potential end-uses. In Sustainable Approaches in Textiles and Fashion. Sustainable Textiles: Production, Processing, Manufacturing, and Chemistry; Muthu, S.S., Ed.; Springer: Berlin/Heidelberg, Germany, 2022; pp. 1–21. [Google Scholar]
  4. Karthik, T.; Murugan, R. Milkweed: A potential sustainable natural fibre crop. In Environmental Footprints and Eco-Design of Products; Springer: Berlin/Heidelberg, Germany, 2016; pp. 111–146. [Google Scholar]
  5. Hassanzadeh, S.; Hasani, H. A review on milkweed fiber properties as a high-potential raw material in textile applications. J. Ind. Text. 2017, 46, 1412–1436. [Google Scholar] [CrossRef]
  6. Berkman, B. Milkweed: A war strategic material and a potential industrial crop for sub-marginal lands in the United States. Econ. Bot. 1949, 3, 223–239. [Google Scholar] [CrossRef]
  7. Ovlaque, P. Valorisation de la Fibre D’asclépiade pour le Renforcement de Matrices Organiques. Ph.D. Thesis, Université de Sherbrooke, Sherbrooke, QC, Canada, 2019. [Google Scholar]
  8. Richard, C.; Cousin, P.; Foruzanmehr, M.; Elkoun, S.; Robert, M. Characterization of components of milkweed floss fiber. Sep. Sci. Technol. 2019, 54, 3091–3099. [Google Scholar] [CrossRef]
  9. Sanchez-Diaz, S.; Ouellet, C.; Elkoun, S.; Robert, M. Evaluating the properties of native and modified milkweed floss for applications as a reinforcing fiber. J. Nat. Fibers 2023, 20, 2174630. [Google Scholar] [CrossRef]
  10. Bakhtiari, M.; Hasani, H.; Zarrebini, M.; Hassanzadeh, S. Investigation of the thermal comfort properties of knitted fabric produced from Estabragh-cotton blended yarns. J. Text. Inst. 2015, 106, 47–56. [Google Scholar] [CrossRef]
  11. Peng, Y.; Cui, Y. Advanced Textiles for Personal Thermal Management and Energy. Joule 2020, 4, 724–742. [Google Scholar] [CrossRef]
  12. Ganesan, P.; Karthik, T. Development of acoustic nonwoven materials from kapok and milkweed fibres. J. Text. Inst. 2016, 107, 477–482. [Google Scholar] [CrossRef]
  13. Ganesan, P.; Karthik, T. Development of sustainable sound and thermal insulation products from unconventional natural fibres for automobile applications. In Sustainable Approaches in Textile and Fashion; Muthu, S.S., Ed.; Springer Nature: Cham, Switzerland, 2022; pp. 195–218. [Google Scholar]
  14. Crews, P.C.; Sievert, S.A.; Woeppel, L.T.; McCullough, E.A. Evaluation of milkweed floss as an insulative fill material. Text. Res. J. 1991, 61, 203–210. [Google Scholar] [CrossRef]
  15. Mills, N.J. Polymer Foams Handbook: Engineering and Biomechanics Applications and Design Guide; Butterworth-Heinemann: Oxford, UK, 2007. [Google Scholar]
  16. Schneider, A.M.; Hoschke, B.N.; Goldsmid, H.J. Heat transfer through moist fabrics. Text. Res. J. 1992, 62, 61–66. [Google Scholar] [CrossRef]
  17. ASTM Standard D2654; Standard Test Methods for Moisture in Textiles. ASTM International: West Conshohocken, PA, USA, 2022.
  18. ASTM Standard D1776/D1776M; Standard Practice for Conditioning and Testing Textiles. ASTM International: West Conshohocken, PA, USA, 2020.
  19. Hailwood, A.J.; Horrobin, S. Absorption of water by polymers: Analysis in terms of a simple model. J. Chem. Soc. Faraday Trans. 1946, 42, 84–92. [Google Scholar] [CrossRef]
  20. Simpson, W. Sorption theories Applied to Wood. Wood Fibers 1979, 12, 183–195. [Google Scholar]
  21. Hill, C.A.S.; Norton, A.; Newman, G. The water vapor sorption behavior of natural fibers. J. Appl. Polym. Sci. 2009, 112, 1524–1537. [Google Scholar] [CrossRef]
  22. Morton, W.E.; Hearle, J.W.S. Theories of moisture sorption. In Physical Properties of Textile Fibres; Woodhead Publishing Limited: Sawston, UK, 2008. [Google Scholar]
  23. Kwame, I.; Okoh, A.; Skaar, C. Moisture sorption Isotherms of the wood and inner bark of ten southern U.S. hardwoods. Wood Fibers 1976, 12, 98–111. [Google Scholar]
  24. ASTM Standard C518; Standard Test Method for Steady-State Thermal Transmission Properties by Means of the Heat Flow Meter Apparatus. ASTM International: West Conshohocken, PA, USA, 2021.
  25. Rohsenow, W.M.; Hartnett, J.P.; Cho, Y.I. Natural Convection. In Handbook of Heat Transfer, 3rd ed.; McGraw-Hill: New York, NY, USA, 1998; Chapter 4. [Google Scholar]
  26. Woeppel, L.; Crews, P.C. Determining the Moisture Characteristics of Milkweed Floss. In Proceedings of the Nebraska Academy of Sciences, One-Hundredth Annual Meeting, Lincoln, NE, USA, 20–21 April 1990; p. 11. [Google Scholar]
  27. Jones, D.; von Bargen, K.L. Some Physical properties of milkweed pods. Am. Soc. Agric. Eng. 1992, 35, 243–246. [Google Scholar] [CrossRef]
  28. von Bargen, K.; Jones, D.; Zeller, R.; Knudsen, P. Equipment for milkweed floss-fiber recovery. Ind. Crops Prod. II 1994, 2, 201–210. [Google Scholar] [CrossRef]
  29. Çengel, Y.A.; Ghajar, A.J. Heat and Mass Transfer. Fundamentals and Applications; McGraw-Hill: New York, NY, USA, 2015. [Google Scholar]
  30. Adachi, K.; Daicho, K.; Furuta, M.; Shiga, T.; Saito, T.; Kodama, T. Thermal conduction through individual cellulose nanofibers. Appl. Phys. Lett. 2021, 118, 053701. [Google Scholar] [CrossRef]
  31. Antlauf, M.; Boulanger, N.; Berglund, L.; Oksman, K.; Andersson, O. Thermal conductivity of cellulose fibers in different size scales and densities. Biomacromolecules 2021, 22, 3800–3809. [Google Scholar] [CrossRef]
  32. Zhang, T.; Luo, T. Role of Chain morphology and stiffness in thermal conductivity of amorphous polymers. J. Phys. Chem. B 2016, 120, 803–812. [Google Scholar] [CrossRef]
  33. Wang, Y.; Liu, K.; Liu, Y.; Wang, D.; Liu, J. The impact of temperature and relative humidity dependent thermal conductivity of insulation materials on heat transfer through the building envelope. J. Build. Eng. 2022, 46, 103700. [Google Scholar] [CrossRef]
  34. Khoukhi, M. The combined effect of heat and moisture transfer dependent thermal conductivity of polystyrene insulation material: Impact on building energy performance. Energy Build. 2018, 169, 228–235. [Google Scholar] [CrossRef]
  35. Anh, L.; Pásztory, Z. An overview of factors influencing thermal conductivity of building insulation materials. J. Build. Eng. 2021, 44, 102604. [Google Scholar]
  36. Korjenic, A.; Petránek, V.; Zach, J.; Hroudová, J. Development and performance evaluation of natural thermal-insulation materials composed of renewable resources. Energy Build. 2011, 43, 2518–2523. [Google Scholar] [CrossRef]
  37. Cheng, P.; Chang, I.-D. Buoyancy induced flow in a saturated porous media adjacent to impermeable horizontal surfaces. Int. J. Heat Mass Transf. 1976, 19, 1267–1272. [Google Scholar]
  38. Arambakam, R.; Tafreshi, H.; Pourdeyhimi, B. Modeling performance of multi-component fibrous insulations against conductive and radiative heat transfer. Int. J. Heat Mass Transf. 2014, 71, 341–348. [Google Scholar] [CrossRef]
  39. Sekino, N. Density dependence in the thermal conductivity of cellulose fiber mats and wood shavings mats: Investigation of the apparent thermal conductivity of coarse pores. J. Wood Sci. 2016, 62, 20–26. [Google Scholar] [CrossRef]
  40. Zhu, F.L. Investigating the effective thermal conductivity of moist fibrous fabric based on Parallel-Series model: A consideration of material’s swelling effect. Mater. Res. Express 2020, 7, 045308. [Google Scholar] [CrossRef]
  41. Wang, Y.; Ma, C.; Liu, Y.; Wang, D.; Liu, J. A model for the effective thermal conductivity of moist porous building materials based on fractal theory. Int. J. Heat Mass Transf. 2018, 125, 387–399. [Google Scholar] [CrossRef]
  42. Ghanbarian, B.; Daigle, H. Thermal conductivity in porous media: Percolation-based effective-medium approximation. Water Resour. Res. 2016, 52, 295–314. [Google Scholar] [CrossRef]
  43. Dias, T.; Delkumburewatte, G.B. The influence of moisture content on the thermal conductivity of a knitted structure. Meas. Sci. Technol. 2007, 18, 1304–1314. [Google Scholar] [CrossRef]
  44. Schiavoni, S.; Alessandro, F.D.; Bianchi, F.; Asdrubali, F. Insulation materials for the building sector: A review and comparative analysis. Renew. Sustain. Energy Rev. 2016, 62, 988–1011. [Google Scholar] [CrossRef]
  45. Karimi, F.; Soltani, P.; Zarrebini, M.; Hassanpour, A. Acoustic and thermal performance of polypropylene nonwoven fabrics for insulation in buildings. J. Build. Eng. 2022, 50, 104125. [Google Scholar] [CrossRef]
  46. Hatakeyama, T.; Hatakeyama, H. Thermal properties of cellulose and its derivates. In Thermal Properties of Green Polymers and Biocomposites; Springer: Berlin/Heidelberg, Germany, 2005; Chapter 3; Volume 4, pp. 39–130. [Google Scholar]
  47. Voitkevich, O.V.; Kabo, G.J.; Blokhin, A.V.; Paulechka, Y.U.; Shishonok, M.V. Thermodynamic properties of plant biomass components. Heat capacity, combustion energy, and gasification equilibria of lignin. J. Chem. Eng. 2012, 57, 1903–1909. [Google Scholar] [CrossRef]
  48. Blokhin, A.V.; Voitkevich, O.V.; Kabo, G.J.; Paulechka, Y.U.; Shishonok, M.V.; Kabo, A.G.; Simirsky, V.V. Thermodynamic properties of plant biomass components. Heat capacity, combustion energy, and gasification equilibria of cellulose. J. Chem. Eng. 2011, 56, 3523–3531. [Google Scholar] [CrossRef]
  49. Hatakeyama, T.; Nakamura, K.; Hatakeyama, H. Studies on heat capacity of cellulose and lignin by differential scanning calorimetry. Polymer 1982, 23, 1801–1804. [Google Scholar] [CrossRef]
  50. Fainberg, E.Z.; Mikhailov, N.V. Temperature dependence of the specific heat of cellulose fibers. Vysokomol. Soyed. 1967, 9, 920–926. [Google Scholar]
  51. Hatakeyama, T.; Hatakeyama, H. Lignin. In Thermal Properties of Green Polymers and Biocomposites; Springer: Berlin/Heidelberg, Germany, 2005; Chapter 5; Volume 4, pp. 131–169. [Google Scholar]
  52. Pyda, M. Conformational heat capacity of interacting systems of polymer and water. Macromolecules 2002, 35, 4009–4016. [Google Scholar] [CrossRef]
  53. Pyda, M. Conformational contribution to the heat capacity of the starch and water system. J. Polym. Sci. B Polym. Phys. 2001, 39, 3038–3054. [Google Scholar] [CrossRef]
  54. Hatakeyama, T.; Hatakeyama, H. Heat capacity and nuclear magnetic relaxation times of non-freezing water restrained by polysaccharides. J. Biomater. Sci. Polym. 2017, 28, 1215–1230. [Google Scholar] [CrossRef]
Figure 1. (a) Mature follicle of Asclepias Syriaca with its seeds and fibers. (b) Microstructure of milkweed floss at 2000× magnification.
Jcs 08 00016 g001
Figure 2. Nonwoven mats made of seed fibers of the common milkweed plant, Asclepias Syriaca.
Jcs 08 00016 g002
Figure 3. Experimental and theoretical values of moisture regain (MR) vs. relative humidity (RH) for milkweed floss (MW) at 25 °C.
Jcs 08 00016 g003
Figure 4. Variations in (a) total porosity (θtotal) and (b) mesoporosity (θmeso) due to changes in relative humidity (RH) and fiber content (ρ) of nonwoven mats made up of milkweed floss.
Jcs 08 00016 g004
Figure 5. Thermal conductivity (λ) vs. temperature (T) and fiber content (ρ) for nonwoven mats made of milkweed floss at (a) 0%, (b) 30%, (c) 60%, and (d) 90% relative humidity (RH).
Jcs 08 00016 g005
Figure 6. Thermal resistance (R-value) vs. fiber content (ρ) and relative humidity (RH) for nonwoven mats made of milkweed floss at a temperature (T) of 298.15 K.
Jcs 08 00016 g006
Figure 7. Specific heat capacity (Cp) vs. temperature for milkweed floss at 0, 30, 60, and 90% relative humidity (RH).
Jcs 08 00016 g007
Figure 8. Thermal diffusivity (α) vs. temperature (T) and fiber content (ρ) for nonwoven mats made up of milkweed floss at (a) 0%, (b) 30%, (c) 60%, and (d) 90% relative humidity (RH).
Jcs 08 00016 g008
Table 1. Results of the n-way ANOVA and Tukey’s multiple comparison tests for differences between the least squares means (LSM) of the thermal conductivity (λ in mW m−1 K−1) of nonwoven mats with different fiber contents (ρ in kg/m3) and at various temperatures and levels of relative humidity.
ρλ LSM99% Conf. Limitsρij 5101520253035
549.4547.95–50.955-<0.0001<0.0001<0.0001<0.0001<0.0001<0.0001
1039.2837.78–40.7910<0.0001-0.002<0.0001<0.0001<0.00010.0070
1536.0134.50–37.5115<0.00010.0017-0.895 0.821 0.936 0.999
2035.0333.53–36.5320<0.0001<0.00010.895 -1.000 1.000 0.686
2534.9033.40–36.4025<0.0001<0.00010.821 1.000 -0.999 0.577
3035.1433.64–36.6430<0.0001<0.00010.936 1.000 0.999 -0.764
3536.3334.83–37.8335<0.00010.00700.999 0.686 0.577 0.764 -
Null hypothesis H0: LSM(ρi) = LSM(ρj); No significant difference between groups when p-value > 0.01.
Disclaimer/Publisher’s Note: The statements, opinions and data contained in all publications are solely those of the individual author(s) and contributor(s) and not of MDPI and/or the editor(s). MDPI and/or the editor(s) disclaim responsibility for any injury to people or property resulting from any ideas, methods, instructions or products referred to in the content.

