Article

Parametric Optimization of Powder-Mixed EDM of AA2014/Si3N4/Mg/Cenosphere Hybrid Composites Using Fuzzy Logic: Analysis of Mechanical, Machining, Microstructural, and Morphological Characterizations

1
Annai College of Engineering and Technology, Kumbakonam 612503, Tamil Nadu, India
2
Ponjesly College of Engineering, Parvathipuram, Nagercoil 629003, Tamil Nadu, India
3
Saveetha School of Engineering, SIMATS, Chennai 602105, Tamil Nadu, India
4
Department of Mechanical Engineering, University Centre for Research and Development (UCRD), Chandigarh University, Mohali 140413, Punjab, India
5
School of Mechanical and Automotive Engineering, Qingdao University of Technology, Qingdao 266520, China
6
Department of Mechanical Engineering, Lebanese American University, Kraytem 1102-2801, Beirut, Lebanon
7
Department of Mechanical Engineering, Lloyd Institute of Engineering & Technology, Knowledge Park II, Greater Noida 201306, Uttar Pradesh, India
8
School of Mechanical Engineering, Lovely Professional University, Phagwara 144411, Punjab, India
9
Department of Mechanical Engineering, National University of Singapore, Singapore 119077, Singapore
*
Authors to whom correspondence should be addressed.
J. Compos. Sci. 2023, 7(9), 380; https://doi.org/10.3390/jcs7090380
Submission received: 15 August 2023 / Revised: 31 August 2023 / Accepted: 5 September 2023 / Published: 11 September 2023
(This article belongs to the Section Composites Modelling and Characterization)

Abstract

:
This research focuses on a comprehensive exploration of the experimental and mechanical aspects of the electrical discharge machining (EDM) process, specifically targeting the machining characteristics of AA2014/Si3N4/Mg/cenosphere hybrid composites. The aim is to optimize the process parameters for enhanced machining performance through a combination of testing, optimization, and modelling methodologies. The study examines the effects of key EDM variables—peak current, pulse on time, and pulse off time—on critical output responses: surface roughness (Ra), electrode wear rate (EWR), and material removal rate (MRR). Leveraging an L9 Taguchi orthogonal array experimental design, the impact of controllable factors on these responses is analysed. An integrated approach utilizing MATLAB’s logic toolbox and Mamdani’s technique is employed to model the EDM process, and a multiple-response performance index is calculated using fuzzy logic theory, enabling multiobjective optimizations. Furthermore, a mechanical behaviour evaluation of AA2014/Si3N4/Mg/cenosphere hybrid composites is performed through mechanical testing, with a comparison between experimental machining results and predicted values. Scanning electron microscopy (SEM) images reveal the presence of filler reinforcements within the base alloy, displaying an improved microstructure and uniform reinforcement dispersion. An X-ray diffraction (XRD) analysis confirms the major elemental constituents—aluminium, silicon, and magnesium—in the hybrid composites. A microstructural analysis of the hybrid metal matrix composites (MMCs) prepared for EDM showcases closely packed reinforcement structures, circular ash-coloured spots indicating silicon and nitrates, and a fine dispersion of cenosphere reinforcement particles. The study’s outcomes demonstrate a promising application potential for these hybrid composites in various fields.

1. Introduction

Electric discharge machining (EDM) is a nonconventional process used to machine high-strength and hard electrically conductive materials. EDM is an improved process that eliminates the limitations of the conventional machining techniques such as “Tool Wear and Downtime” and challenges with complex shapes and materials. Conventional machining suffers from rapid tool wear, decreasing tool life and causing frequent downtime for replacements and maintenance. Conventional techniques struggle to produce intricate shapes, and working with dissimilar materials poses difficulties due to varying properties, resulting in reduced efficiency and tool wear. The aluminium (Al) metal is the most versatile among all the materials used in industrial applications, with specific highlights of properties such as a light weight, high strength, low coefficient of thermal expansion (CTE), and good wear rate characteristics. The Al MMC (metal matrix composite) mixed with many reinforcing particles, namely, silicon carbide (SiC), boron carbide (B4C), aluminium oxide (Al2O3), etc., shows a better bonding in most cases [1]. The stress–strain behaviour of aluminium and aluminium–magnesium laminated composites was investigated to simulate a tensile test. The work examined the corrosion property and strength of the composites, and fatigue failure was also addressed [2]. An Al alloy having silicon oxide (SiO2) sand was investigated for its dry-sliding tribological behaviour using a three-pin-on-disc wear tester and an SAE steel counterface. The authors observed that due to the SiO2 in the aluminium, the coefficient of friction (COF) of the cast composite decreased. The applied pressure increased the wear rate of the composites, provided that the temperature near the counterface surface increases due to the low thermal conductivity of the reinforced particles [3]. A powder mixture of aluminium and magnesium has been best suited for lightweight metal matrix composites in recent years. The intermetallic formation in powder-based Al and Mg was investigated due to the effects of the combined reaction between the two base powders. The yield and compressive strength were examined [4]. An ultrasonic-assisted semisolid stirring method used to fabricate the Al 2024 nanocomposite reinforced with Al2O3 nanoparticles improved the mechanical properties due to natural ageing. The deformation study indicated the flow of liquid incorporated with different flows [5]. Using a thermoelectric cutting of Al-SiC composites, the effectiveness of the optimization of the parameters involved in a study was investigated. The responses such as MRR, HV, Ra and recast layer formation were explored. The findings revealed a reduction in microhardness and thickness of the recast layer, followed by a noteworthy impact on MRR and Ra values during machining [6]. Die-sinking EDM was used to machine the Al6061 alloy, to identify the predominant factor affecting the quality responses among the material removal rate, the electrode radius wear rate, and the surface roughness to address the futuristic research scope and to generate accurate predictive models. The outcomes were evaluated, and the authors compared the relation between the energy input and surface modification of the material investigated [7]. Aluminium hybrid composites synthesized using FSP were used to evaluate the sliding wear behaviour, which an operative interface bond formation among the constituents along with a grain refinement. The wear fragments of Al composites were reduced by the iron content in the boron nitride particle, which a further reduction in counterface wear [8]. A PCD 1600 grade insert was used to turn Al-SiC MMCs as per Taguchi’s design, and an ANOVA was employed to investigate the highly significant parameters which impact the worthy characteristics during machining [9]. The authors highlighted the properties of aluminium, considered to be today’s most important class of engineering materials. The reinforcement particle incorporated in the study were mica and SiC ceramic through a stir-casting route, and the authors investigated the wear loss during the machining of hybrid metal matrix composites [10]. The Al-SiC-WC composite was routed through a stir-casting process with various composition of reinforcements and used for the mechanical behaviour study with a uniform dispersion without clusters. The reinforcement particulates, viz., silicon carbide and tungsten carbide, improved properties such as the “compressive, tensile and wear resistance” properties of aluminium composites [11]. Al-Cu-Mg alloy-based composites reinforced with 5%SiC + Al2O3 have very rarely been researched in the field of MMCs; an attempt was taken to explore the mechanical properties of such hybrid composites. The research results emphasised that the composites containing silicon carbide possessed better properties than the composites containing Al2O3. However, the Al-Al2O3 composites possessed a better elongation [12]. An aluminium alloy (AA6082) containing manganese in a large proportion to control the grain structure and withstand even elevated temperatures was investigated to explore the mechanical behaviour of Al-WC composites, during the fracture of the composites; that study also reported the physical and mechanical properties [13]. The challenging hard-particle reinforcement was carried out in another study, and the authors reported the influence of the quality responses in three different MMC compositions. An increase in speed and feed caused an increase wear rate [14]. A reinforced die-cast magnesium alloy having particles size of 45 µm, a mass of 20%, and a stirring speed of 600 rev/min showed a significant impact on the mechanical behaviour of the “syntactic foam”, especially on porosity. The work extended and highlighted that the reduction in density of this material increased the mass fraction of “hollow glass microspheres” [15].
The investigation on various sliding velocities, loads, and sliding distances on the CoF and wear rate of AMMC and grey CI revealed a higher wear exhibited in the Al MMC in identical conditions and that the CoF reduced linearly with respect to an increase in the applied load [16]. The investigation was conducted on the fabrication and characterization of a “hollow glass microspheres”-reinforced Mg alloy. Results yielded a degradable composite with a low density and high compressive strength [17]. The machining performance of super alloys was discussed using optimization techniques and interpreted with the grey relational analysis data analysis method. The study analysed the Ra, MRR, and forces, and the best fit among the parameter combinations were discussed [18]. Aluminium-reinforced nanomaterials with incomplete dispersion indicated that without pretreatment on nanoceramics, they dispersed in the base alloy to form a “semi-solid shear stress” increasing the matrix strength. The “ball milling process” with aluminium powders was efficient to enhance “isolated nano-powders” during the process [19]. Research has been reported in which gadolinium-reinforced Mg-9Al alloy-based MMCs were formulated with the help of a casting technique with an aim to investigate the reinforcement, using the grain refinement through a microstructure analysis, and furthermore, the mechanical properties were found to be promising. The corrosion increased when the gadolinium content increased and was proved optimal at 2% in weight [20]. An ANN model was introduced for investigating the optimum parameters for a super alloy such as titanium-grade Ti-6Al-4V; the authors reported that the mathematical model derived from the ANN analysis provided a better performance during the machining of super alloys [21]. A titanium aluminide intermetallic compound was found to be an absolute combination of various properties and hence, with its unique mechanical properties, was adopted for a machining test; the PMEDM of γ-TiAl composed of various powders such as Al, SiC, Gr, chrome, and Fe was reported to explore surface characteristics such as surface roughness, material cutting rate, and the corrosion behaviour of the machined surface [22]. A squeeze-casting method was adopted for an Al matrix reinforced with SiCp; the authors reported that the SiCp caused a homogeneous distribution due to the extrusion process. The tensile strength improved due to the increase in the SiCp ratio, and the impact strength also decreased. The research highlighted the improvement in the mechanical behaviour of Al composites [23]. To investigate the properties and degradable characteristics of a magnesium alloy with Al and Zn contents in higher proportion with the addition of Si, a study revealed that the addition of silicon could refine the α-Mg alloy and modify Mg2Si particles [24]. Cast Mg-Zn-Gd-Zr alloys with the addition of Gd were investigated under the ground of the microstructure, mechanical behaviour, and biodegradable nature of the prepared materials. The consequences of the study were that an increment in Gd particulates increased the strength of the base alloy [25]. The aluminium (Al) metal is the most versatile among all the materials used in industrial applications, with specific properties such as a light weight, high strength, a low coefficient of thermal expansion (CTE), and good wear-rate characteristics.
Electrically conductive materials can be intricately shaped using EDM, a nontraditional machining technique [26,27,28]. EDM, at its core, takes benefit of the phenomenon of electrical discharges amongst a tool electrode (cathode) and a workpiece electrode (anode), both of which are submerged in a dielectric fluid [29,30,31]. High-frequency electrical energy pulses are employed amid the electrodes during this procedure, resulting in a succession of controlled sparks that erode the material from the workpiece [32,33]. This primary concept of EDM revolves around the higher voltage applied across the electrode gap, which causes a controlled breakdown of the dielectric strength. The material vaporizes, melts, and spalls as a result of the intense localized heat produced by the consequent plasma channel, taking the desirable shape [34,35,36].
The effectiveness and accuracy of the EDM process are influenced by a number of significant factors:
i.
Pulse Duration: The amount of energy transmitted to the workpiece depends on how long each electrical pulse lasts. The lesser the material removed, the finer the surface finish with short pulses [37,38,39].
ii.
Pulse voltage and current: The amount of energy delivered per pulse and the spark intensity are determined by the pulse current and voltage parameters. More significant values result in a faster removal of material [39,40,41].
iii.
Gap distance: The gap amid the tool and the workpiece electrodes has an impact on how effectively sparks are generated and materials are removed. More accurate machining is facilitated by smaller gaps [40,41,42].
iv.
Pulse Frequency: The frequency of the pulses has an impact on the overall rate of material removal. Low frequencies are preferable for performing fine finishes, while high frequencies are conducive to efficient machining [43,44,45].
Thus, the interaction of these variables controls the mechanisms for spark generation, heat distribution, and material removal. For instance, higher discharge energies are produced by shorter pulses at higher voltages, which accelerates the rate of material removal [46,47]. In contrast, longer pulses at lower voltages are used to produce fine details with minor thermal damage [48,49].
As far as discharge energy is concerned, the effectiveness of material removal, the quality of the surface, and electrode wear are all substantially influenced by discharge energy [42,43,44]. It can be characterized as the energy that is transmitted during each spark discharge. It can be mathematically defined as the product of the pulse voltage and pulse current [42,43,44].
Thus, the amount of material that is vaporized or eroded during each spark is directly influenced by the discharge energy, which in turn controls the rate of material removal [42,43,49]. Higher erosion and faster machining are caused by a higher discharge energy. Nevertheless, extremely higher discharge energies can lead to thermal damage, deteriorated surface finish, and excessive electrode wear [42,43,49].
Although WEDM originated to fulfil accurate detachment needs in plate-type workpieces, it has evolved to handle complex ruled surfaces with high quality and productivity demands. Researchers have extensively investigated equipment enhancement, electrode improvement, and process conditions for optimal outcomes. This involved aspects such as productivity, accuracy, surface quality, electrode wear, and material changes. Numerous scientific papers have contributed to understanding WEDM’s characteristics, phenomena, performance, and trends over the last two decades [26,27].
In [28], the electrical discharge machining (EDM) of ceramic composites was discussed. First, an introduction to the machining methods and the ceramic materials used was given. Then, a detailed study of the electrical discharge behaviour of three ceramic systems was given: ZrO2, Si3N4, and boride-based composites. It was shown that material properties such as secondary phase type, composition, and grain size had a substantial influence on the material removal mechanisms, surface roughness, material removal rate and flexural strength. Finally, the application of EDM on high-end ceramics was demonstrated by two case studies, namely a Si3N4-TiN turbine impeller and a B4C spray nozzle.
In the current study, the aluminium grade “AA2014” was chosen as a base metal with Si3N4 as a reinforcing agent in addition to cenosphere and Mg to fabricate a hybrid metal matrix through stir casting. The Al-Cu alloy was employed in the study due to its better machinability properties for the production of complex machined components. The properties of the hybrid MMCs were explored and a modern tool, “grey based fuzzy logic approach”, was used to explore the machining characteristics of the AA2014 hybrid composites.

2. Materials and Methods

2.1. Material

AA2014 (an aluminium–copper alloy) has been used extensively to manufacture various components in automotive and airline industries. Hence, this study considered AA2014 as the base material. The chemical ranges of this alloy are listed in Table 1.
Silicon nitride (Si3N4) is a dense material and extensively used to make turbine and engine components. Table 2 shows the chemical range of Si3N4. During fabrication, the weight percentage of sintered Si3N4 was varied from 2.5 to 7.5% with steps of 2.5.
Cenospheres are “hollow microscopic ball” of silica-aluminium ceramics. They have a high flowability, which causes a regular dispersion of filling elements over the surface as exhibited in the Figure 1a–c. Table 3 shows the chemical composition of cenospheres. The number of cenospheres was varied from 3 to 7 with steps of 2.
Table 4 illustrates the ingredients of the newly developed composites.

2.2. Methods

Various methods were investigated for the fulfilment of the study, namely, assessing the mechanical behaviour, which included tensile, compression, and hardness properties. Regarding the machining characteristics, responses such as “surface roughness, material removal rate and electrode wear rate” were also investigated, along with the optimization technique utilized to optimize and depict the feasibility of the current investigation. Apart from that, to understand the influence of particulates on the matrix, microstudies were also carried out on the fabricated specimens.
A tensile testing machine measures a material’s response to stretching forces [29,30]. It subjects a specimen to axial tension until failure, recording the stress–strain behaviour. Key components include a load cell, grips, and a displacement measurement system. Results help determine material properties such as yield strength, ultimate tensile strength, and elasticity [31,32].
A compression testing universal testing machine (UTM) assesses a material’s behaviour under compressive forces [33,34]. It applies an axial load to a specimen, evaluating its strength and deformation properties. Components include load cell, platens, and displacement measurement. This testing aids in understanding parameters such as the compressive strength and elastic modulus of materials.
A hardness testing equipment assesses a material’s resistance to indentation or scratching, indicating its strength and durability [35,36]. Common methods include Rockwell, Brinell, and Vickers tests. A standardized indenter is pressed into the material’s surface, and the indentation’s depth or size determines the hardness value, aiding the material selection and quality control.

3. Results and Discussion

3.1. Evaluations of Mechanical Behaviour of Representative Samples

3.1.1. Tensile Test

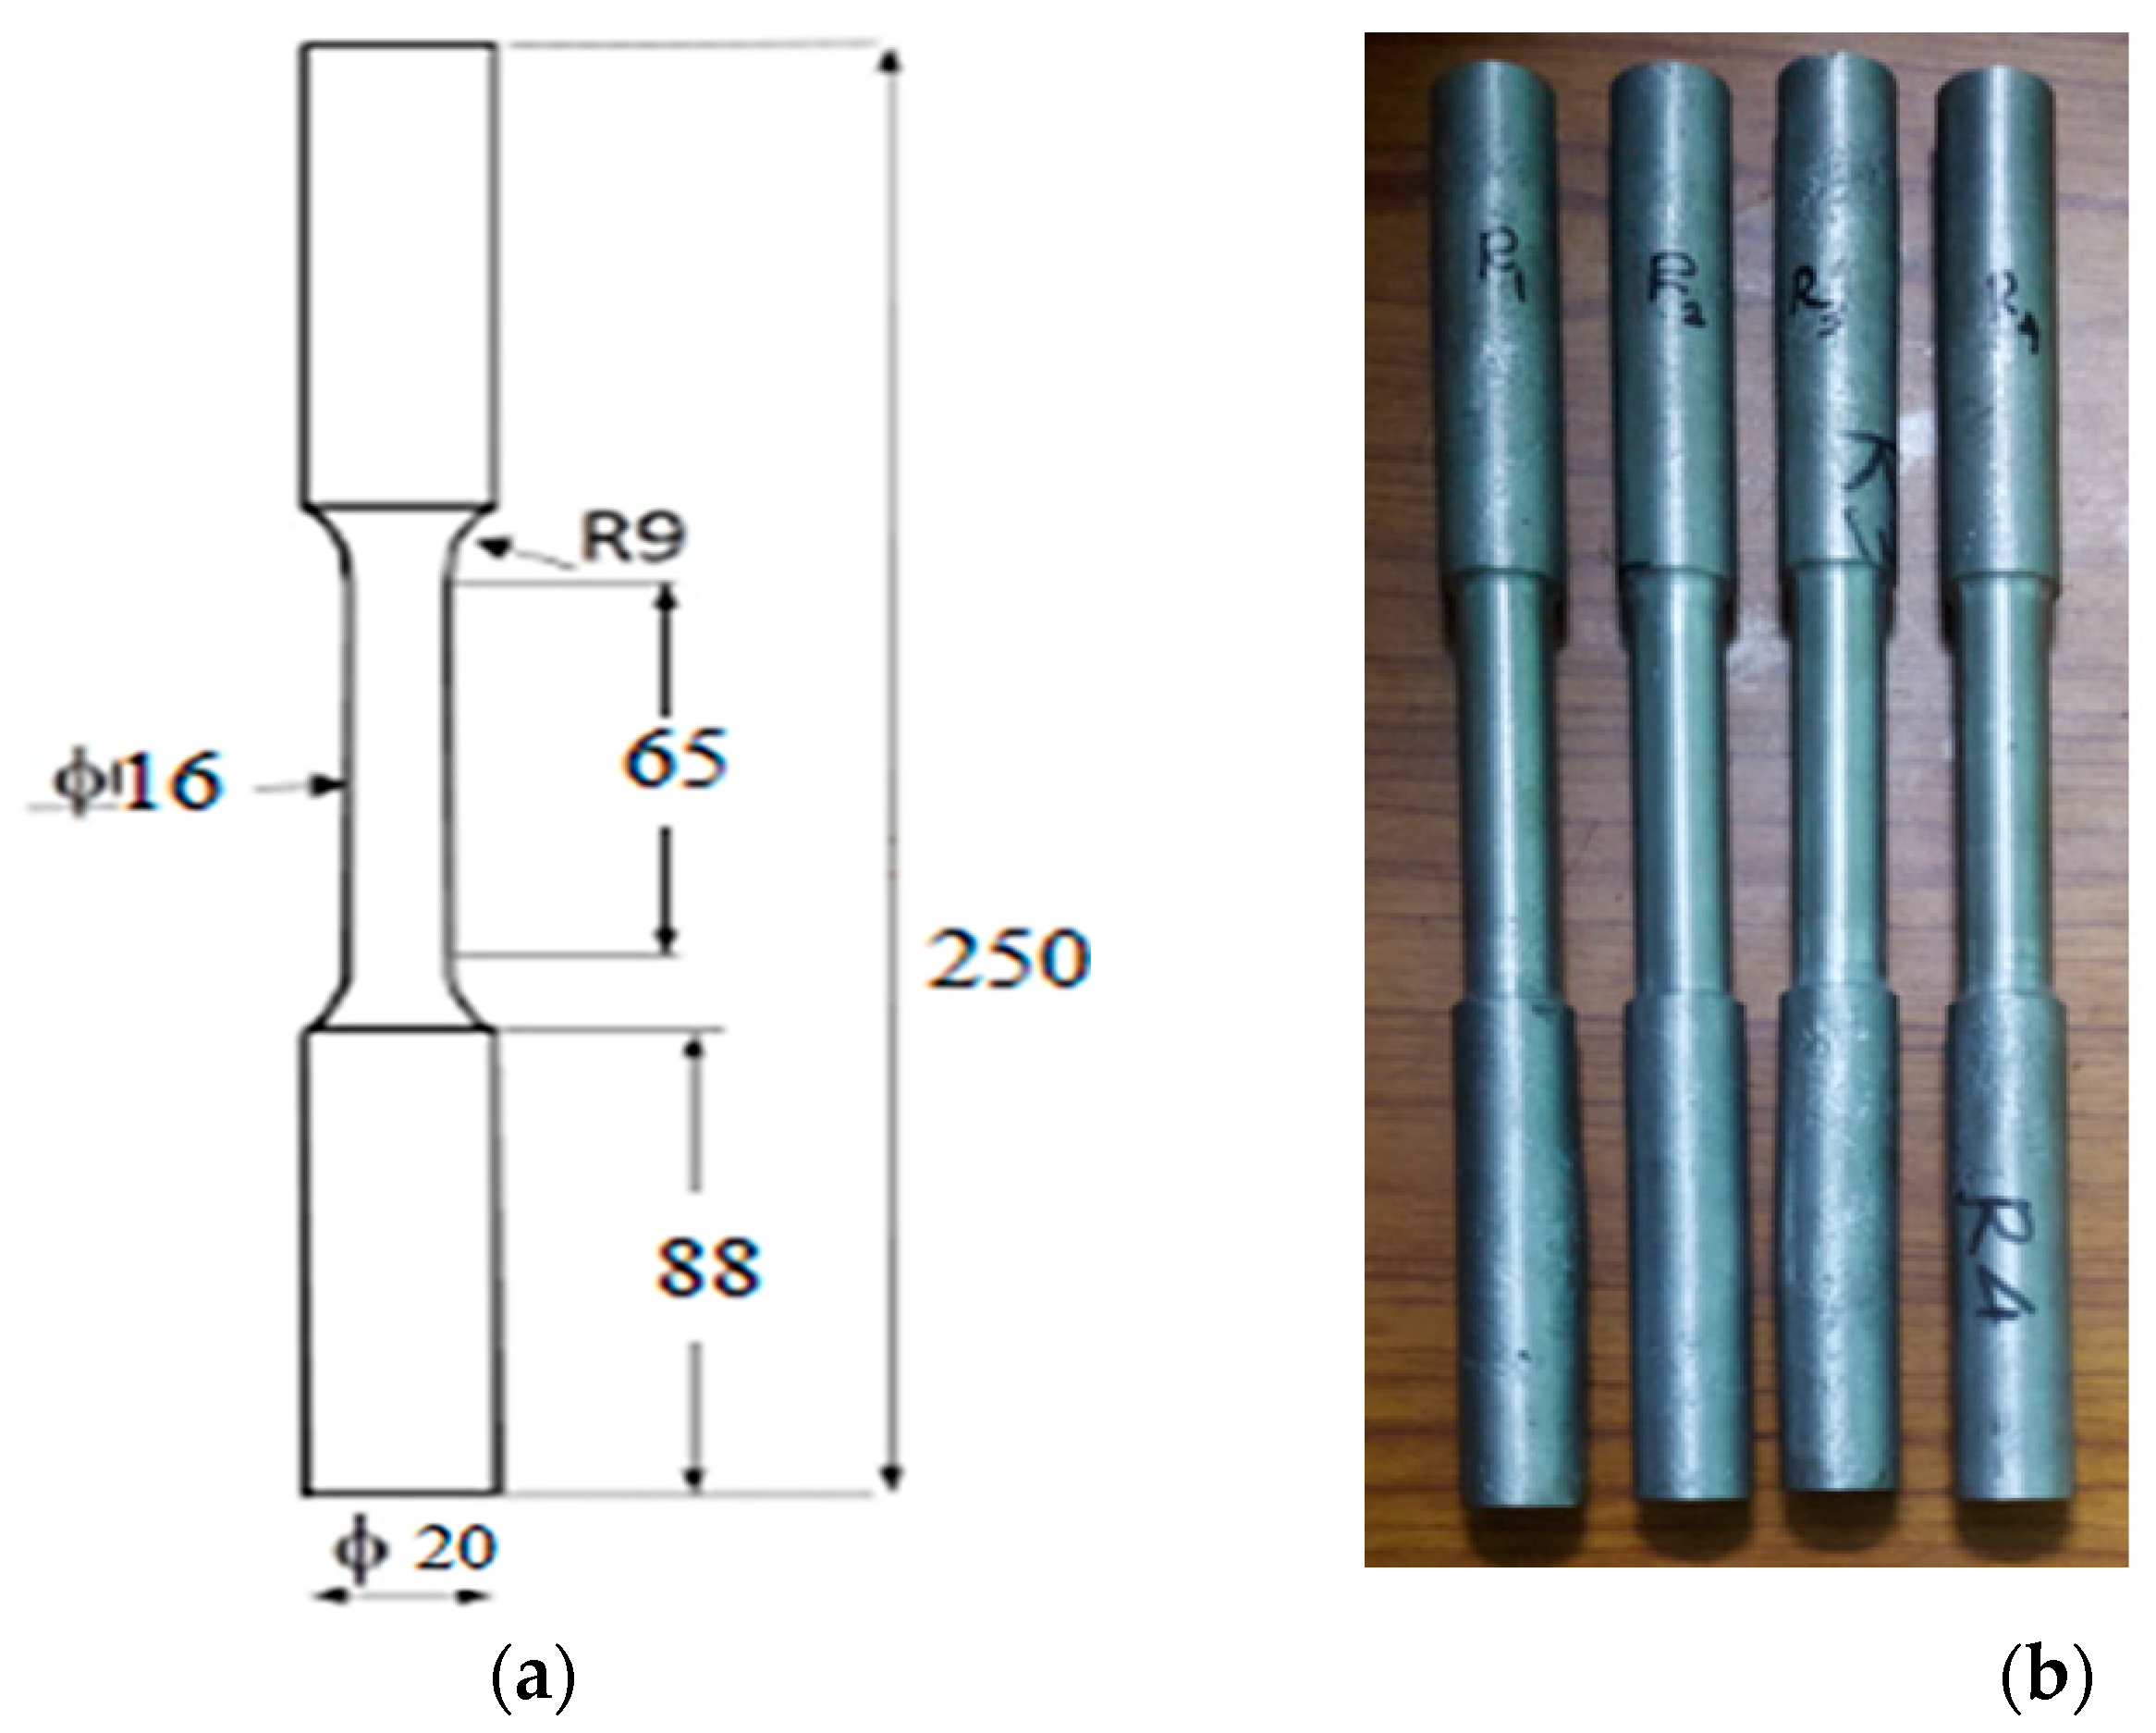
A metal matrix composite can be explained as a combination of at least two distinct materials having different properties. The combination of the materials is up to the macroscopic level and can be separated when required. The two constituents, namely, the metal matrix arrangement and reinforcement, determine the property of the material. Tests were performed on the representative samples of MMCs, and results were tabulated and analysed. The weight percentage of reinforcement are categorized in Table 5. Figure 2a,b represent the measurement and actual specimens for the tensile test.
Tensile tests were performed on representative samples by employing an extensometer-integrated UTM that recorded force and deformation. This machine was also used to conduct a compressive test on the composite samples (200 tons). A tensile test was conducted as per the ASTM E8 standard and “true stress-true strain curves” were drawn. Table 6 records the tensile values at various loading conditions and the corresponding tensile strength. The maximum elongation occurred at sample 3.

3.1.2. Compression Test

A UTM was used to conduct the compression test on the representative hybrid composite samples by employing the ASTM E09-09 standard. The test specimen, which was cylindrical in shape, was mounted on the base plate of the UTM. The specimen utilized had an equivalent distance across as the height of the specimen. The specimen gradually underwent a load distribution until it was compressed by 50% in height. The application of loads caused the displacement to reach specific increments; afterwards, the displacement decreased all of sudden until a certain height, after which it could not be compressed anymore. Figure 3a,b represent the measurement and actual specimen for the compression test. Table 7 reports the corresponding load and strength ratios for various samples. The maximum strength occurred for sample 4 with a value of 372.5 N/mm2.

3.1.3. Hardness Test

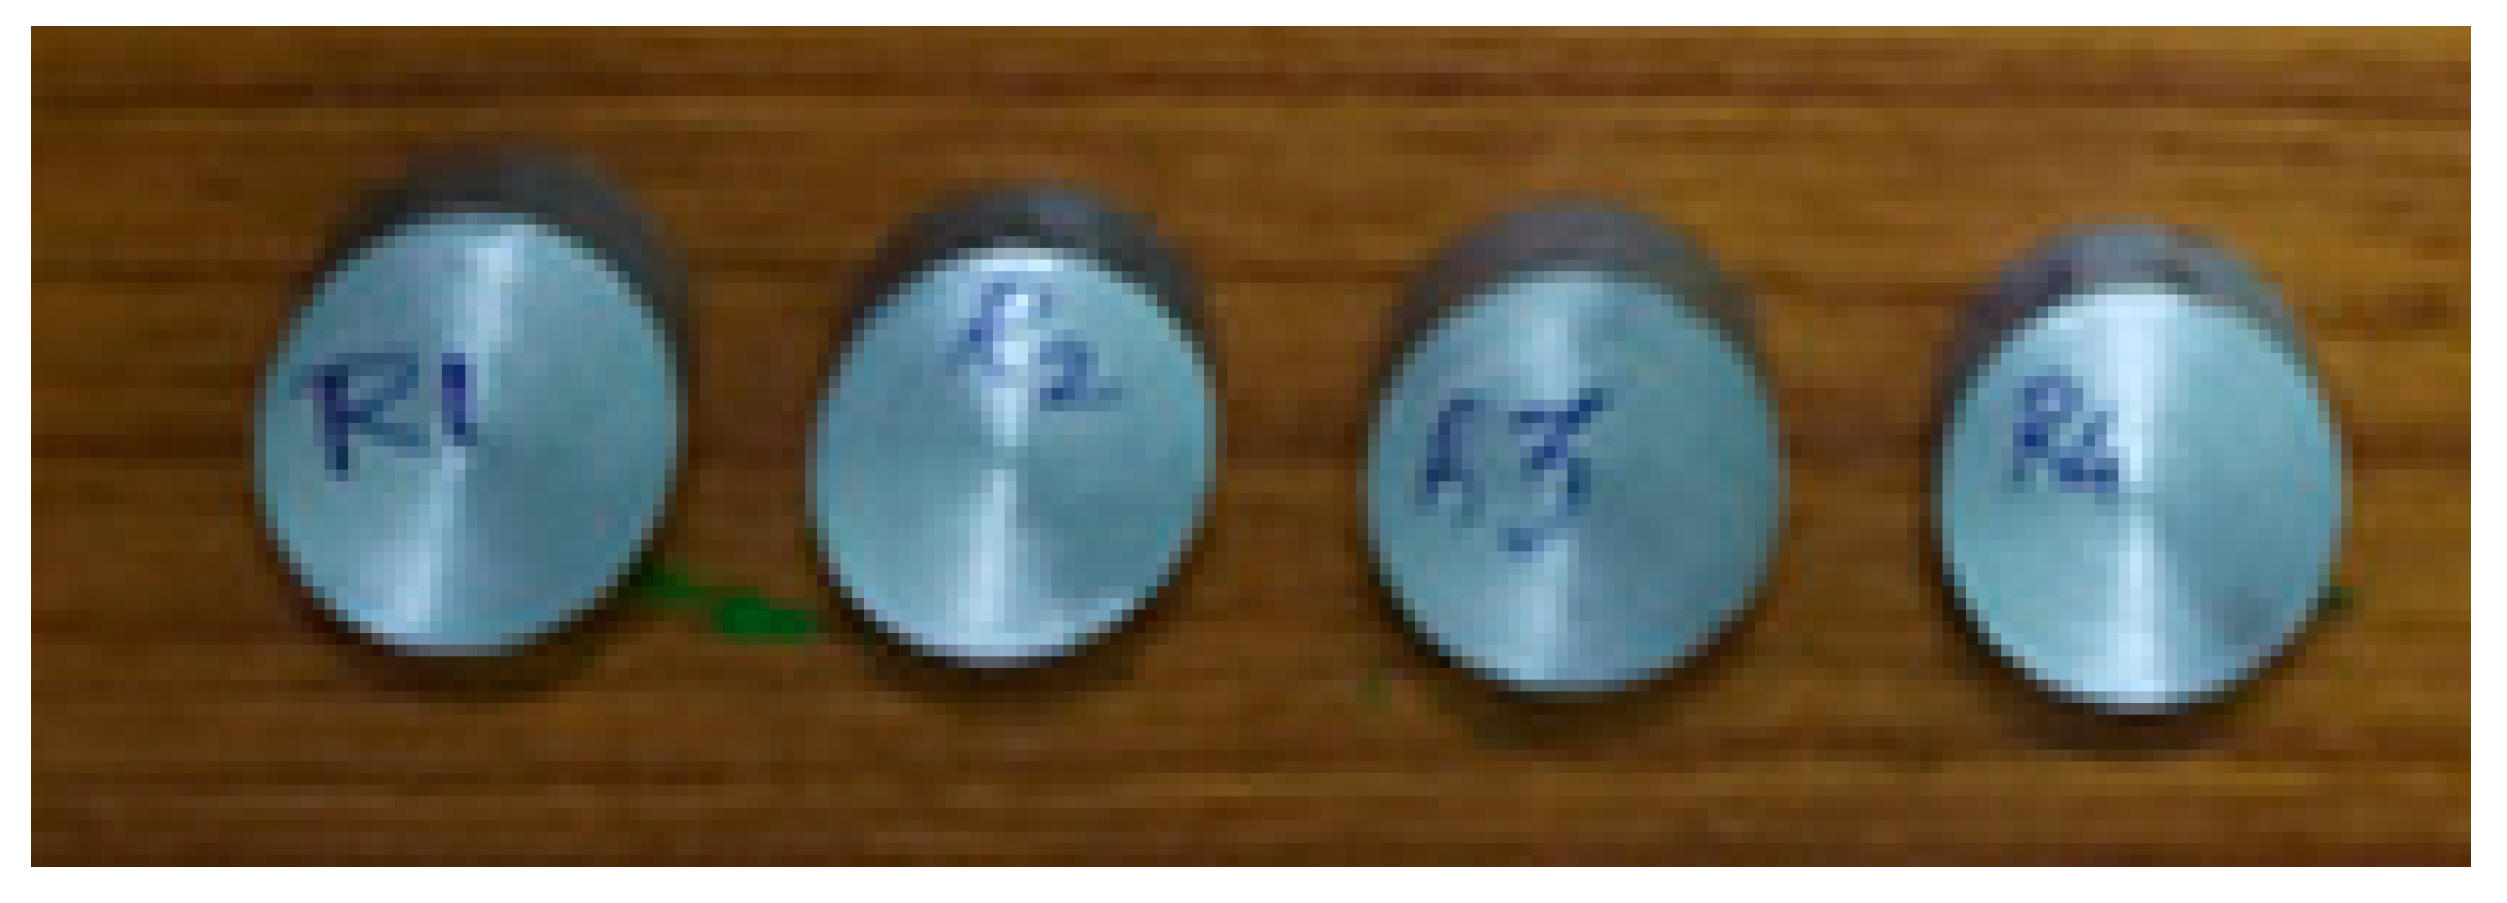
The hardness of a material signifies its resistance to scratch, penetration, or indentation. The hardness of the representative hybrid composite samples was measured in the form of the BHN (Brinell hardness number). For accuracy purposes, a minimum of three indentations were made on the sample at distances of 5 mm, and their average was taken for analysis. A Brinell hardness test was performed by employing the ASTM E8/E8M-011 standard to explore the impact of the reinforcement addition hardness of the base alloy. For this, a 250 N normal load was applied on a 5 mm diameter steel ball. The specimen for the hardness test is shown in Figure 4. Table 8 denotes the hardness values. From the test report, sample 3 showed the maximum hardness value of 48 HRB.

3.1.4. Microstructure Analysis of the Representative Hybrid Composite Samples

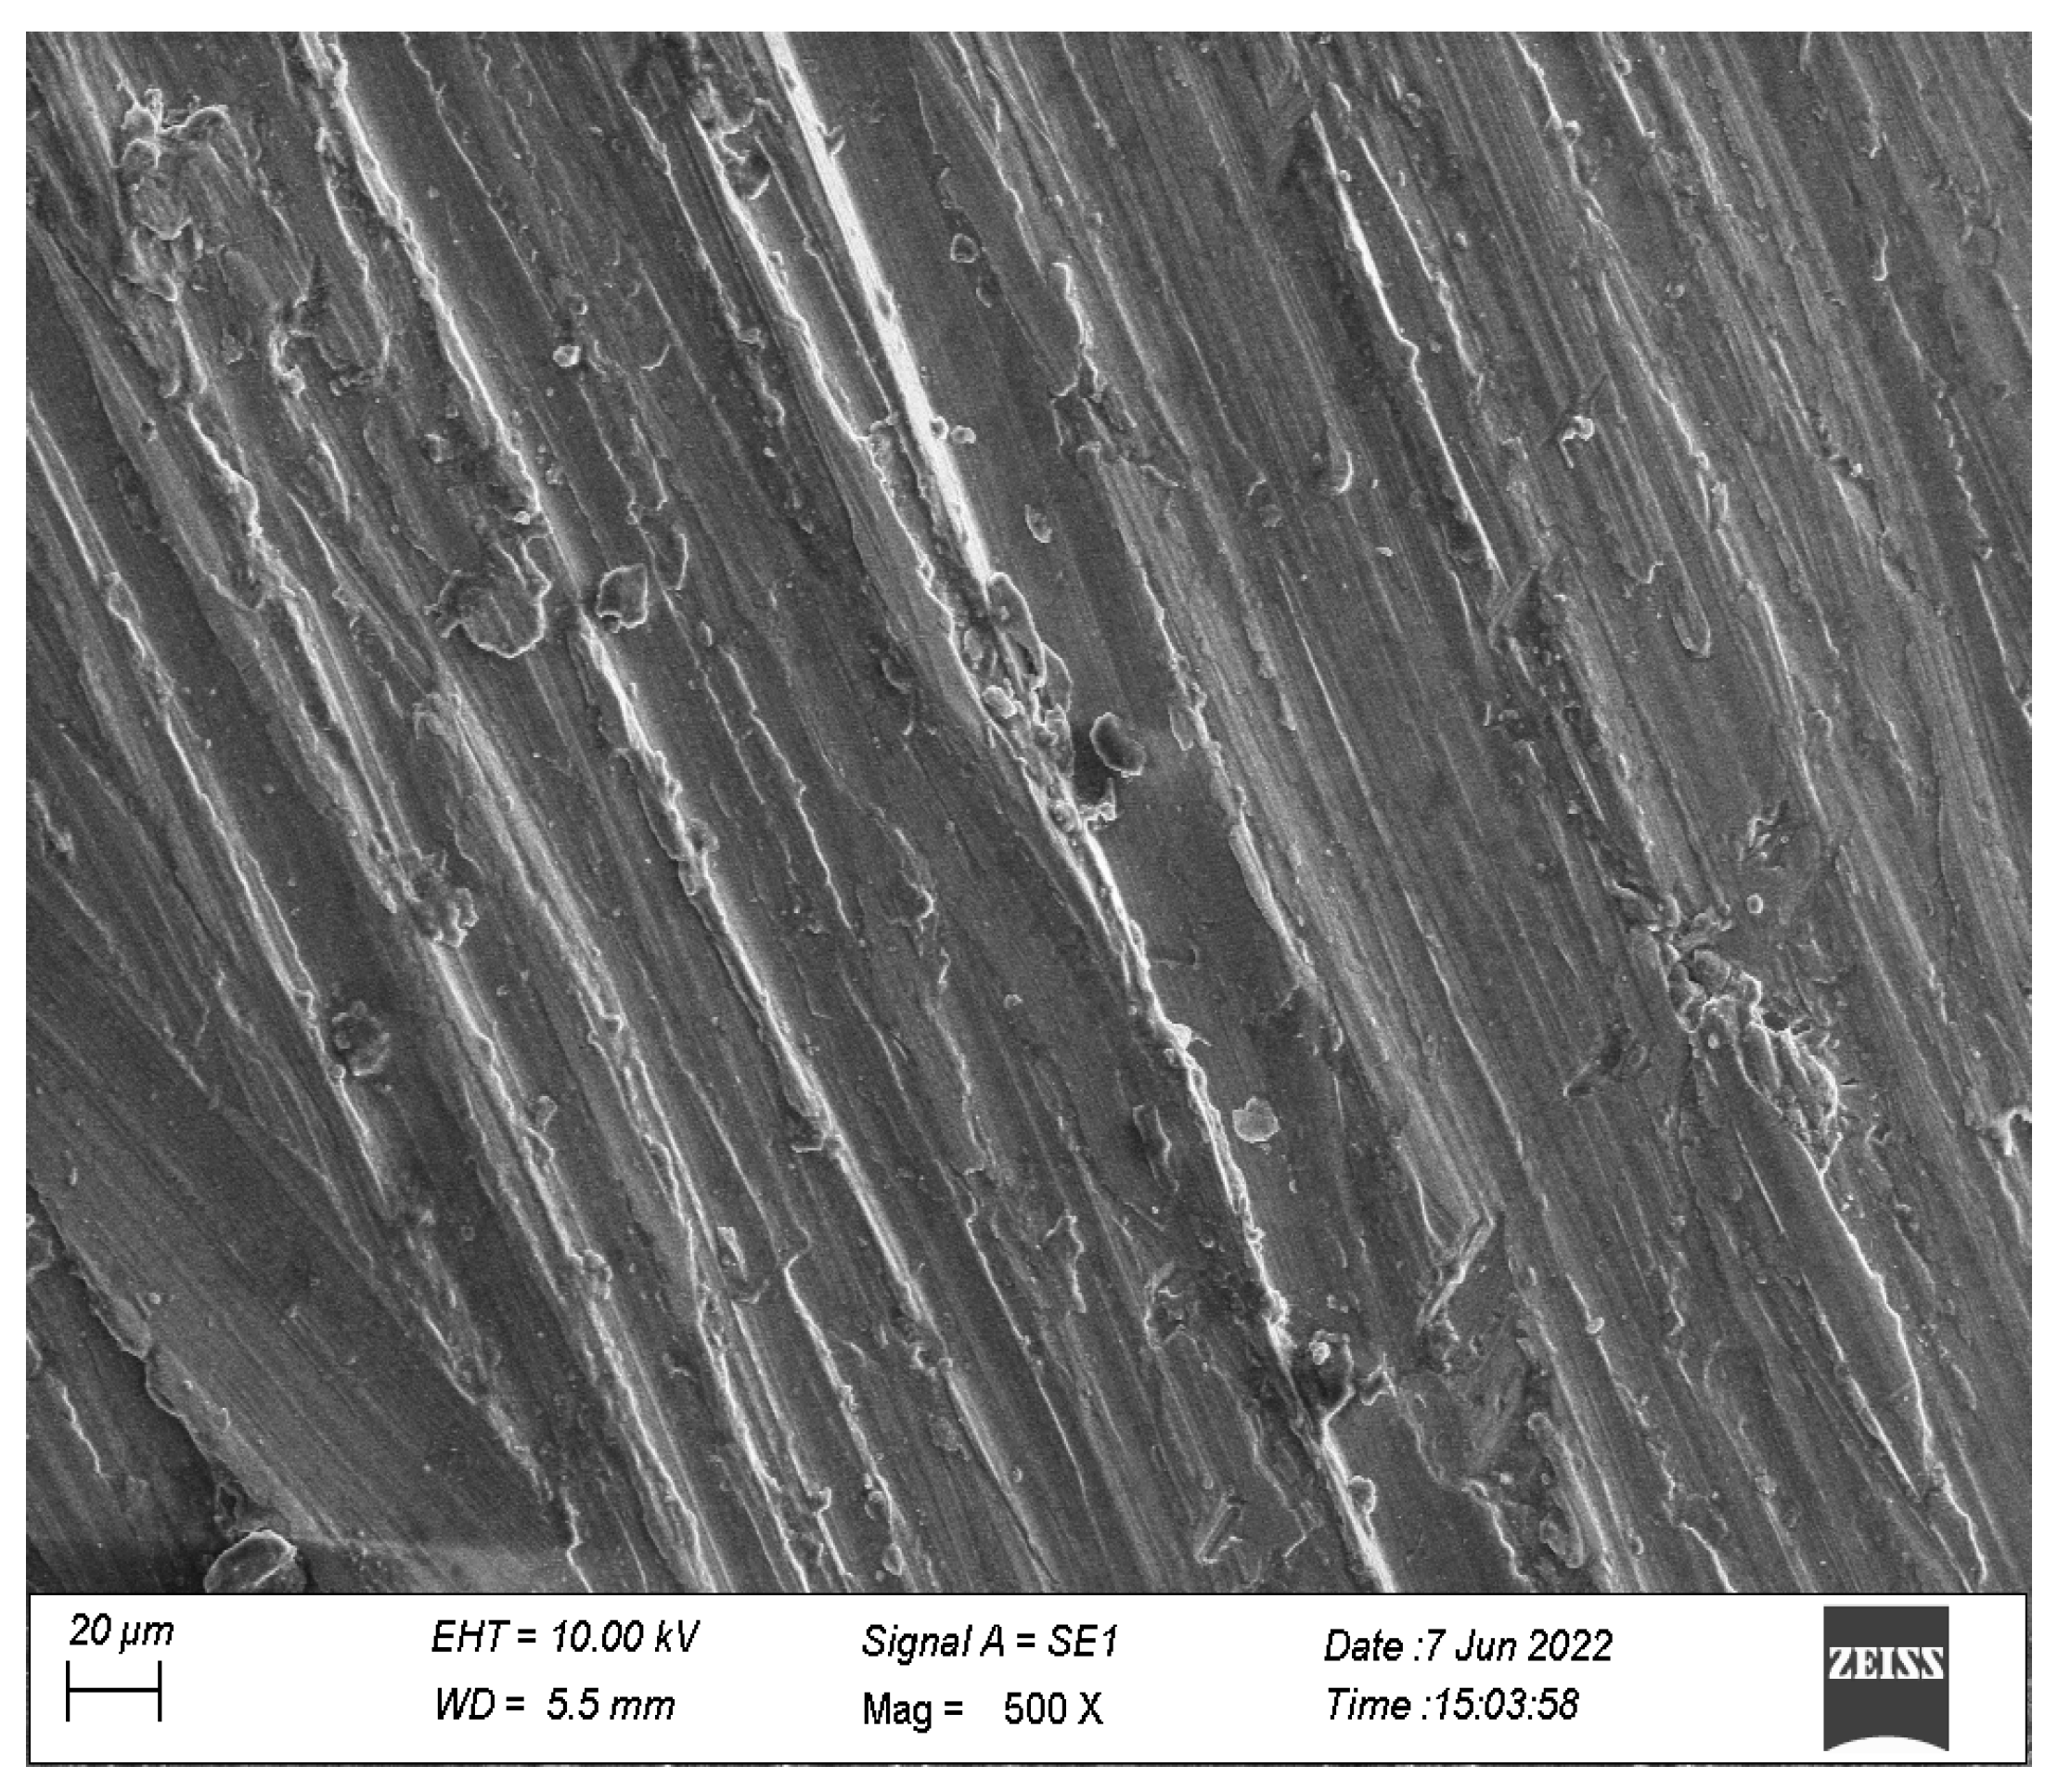
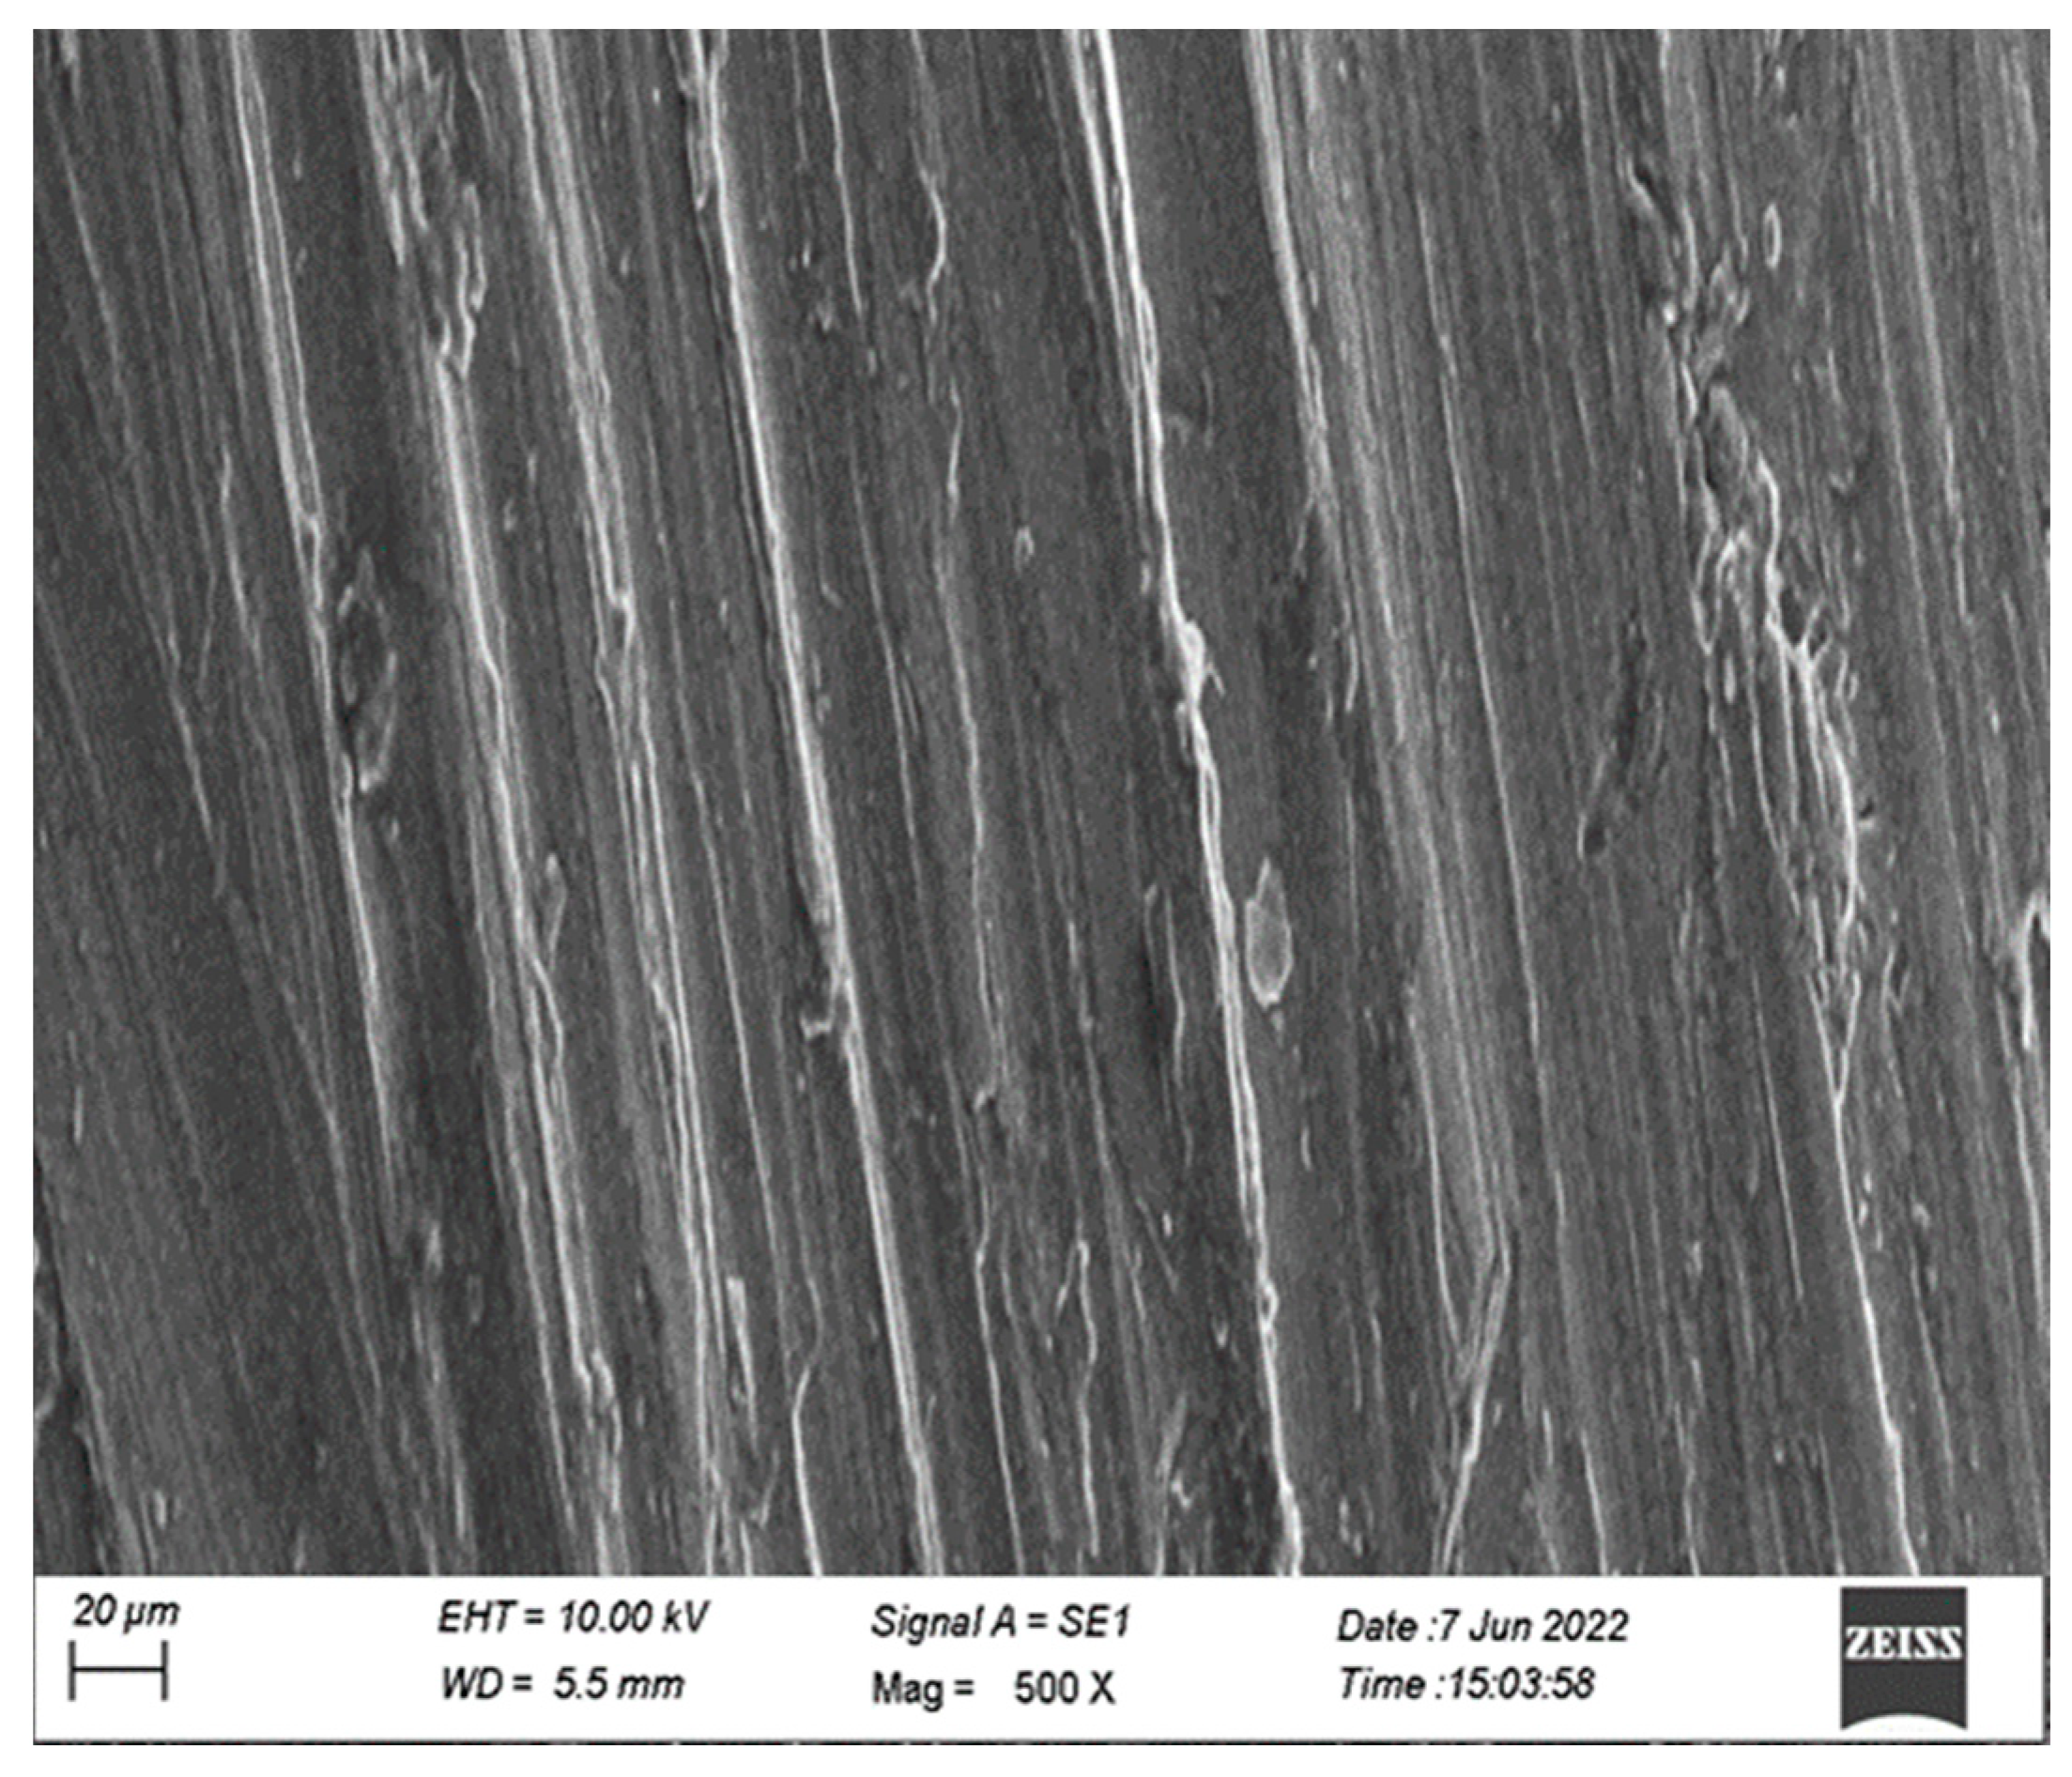
To investigate the structure of the material, a common method is a microstructural analysis, which presents a clear picture of the material undergoing testing at various stages. The scanning electron microscopy images of the representative Al-based hybrid composite samples are shown in Figure 5, Figure 6 and Figure 7. An aluminium-rich matrix was seen inside the structure, in which the particle distribution was homogenous without clustering [37,38]. The addition of silicon nitride was identified in the microstructure and followed a homogenous distribution. Figure 5 shows that a compact, packed, homogenous composite was uncovered in the SEM image. Figure 6 represents the pores formed around the silicon nitride due to the thermal coefficient with other particles, which can cause a weakening of the interface bonding formed around the silicon nitride to strengthen the main matrix. A hot-rolling process can reduce pores within the composites and increases the mechanical property.
Figure 7 highlights that the particle entities in the composite model also represented the porosity and seemed to be quite high for a high percentage of reinforcing agents’ ratios. The SEM image clearly indicated the occurrence of pores and a weaker bond in the maximum addition of 7.5 and 7% of each silicon nitride and cenosphere in the composite structure. Finally, very small size Mg particles were not seen in any of the microstructure images of SEM analysis.

3.2. Experimentation and Machining Studies on the Representative Hybrid Composite Samples

The machining of the newly developed composites was performed using a ram-type powder-mixed EDM. A sample size of 700 × 500 × 350 mm was chosen to perform the machining operation. A dielectric tank of 7 L capacity was selected, which was mounted on the machine itself. Figure 1 illustrates the EDM used in this study. Accurate measurements of the Al powder were taken for the powder mixing in the dielectric solution. Positive polarity in EDM offers several advantages. It reduces electrode wear and minimizes tooling costs due to improved electrode material removal [37,38,39]. Additionally, it enhances surface finish quality and lowers the chances of a workpiece cracking. This polarity choice can lead to more efficient and cost-effective machining processes [39].
Composites were developed through stir casting as per the prescribed ingredients ratios. The machining specifications are listed in Table 9. The concentration of Al powder in kerosene oil was varied from 0 to 2 g/L with steps of 1 g/L, and machining was performed as per L9 OA. The corresponding factors and levels for the experimentations are listed in Table 10.

3.2.1. Machining Study on the Representative Samples of Al-Based Hybrid Composites

The quality measures, namely, Ra, EWR, and MRR, were investigated for the prepared samples of AA2014 composites. The machining parameters involved in the current study were TON, TOFF, and gap current. The tests were conducted according to Taguchi’s L9 OA, and responses were recorded and are tabulated in Table 11. The S/N ratio values for Ra, EWR, and MRR were recorded from simulation software MINITAB16 on the basis of the “smaller the better” for Ra and EWR and the “higher the better” for MRR. An ANOVA was adopted to identify the most dominating factors to predict the appropriate quality measures’ indicators. Table 11 shows all the values of the responses. Similarly, Table 12 shows the corresponding S/N ratios of each response.

Effects of Input Parameters on Ra

The texture of a surface defines its roughness. On a real surface, a vertical deviation from its ideal form quantifies the roughness. A large deviation shows a rough surface, and a smaller deviation indicates the surface is smooth. Surface roughness is an essential property that impacts product quality since it greatly influences the performance of mechanical components. The graphical plot represents the influence of input factors over Ra. The inference from the graphical plot is that with a 20 µs TON, a 20 µs TOFF, and a 7 A gap current, the surface roughness values were found to be in the optimal conditions among the trials investigated. Figure 8 denotes the main effect plots for the surface roughness.

Effects of Input Variables on Electrode Wear

The wear behaviour was assessed from a tribological study during the machining of the composites. “Wear is the progressive loss of material from the operating surface as a result of relative motion. The heat produced during the dry machining process is critical in terms of tool life and work-piece surface quality”. The graphical plot represents the influence of input parameters over the electrode wear. The inference from the graphical plot is that with a 10 µs T ON, 40 µs T OFF and a 6 A gap current, the electrode wear values were found to be in the optimal conditions among the trials investigated. Figure 9 shows the main effect plots for electrode wear.

Effects of Input Variables on MRR

The material removal rate (MRR) describes the rate at which the quantity of material is removed from the work surface in a unit of time. It can be calculated utilising Equation (1), as follows:
M R R = I n i t i a l   w o r k   w e i g h t F i n a l   w o r k   w e i g h t T i m e   t a k e n × D e n s i t y
The inference from the graphical plot denotes that with a 30 µs TON, 40 µs TOFF, and an 8 A gap current, the MRR values were optimal. Figure 10 represents the main effect plots for the MRR.

Interaction Plot

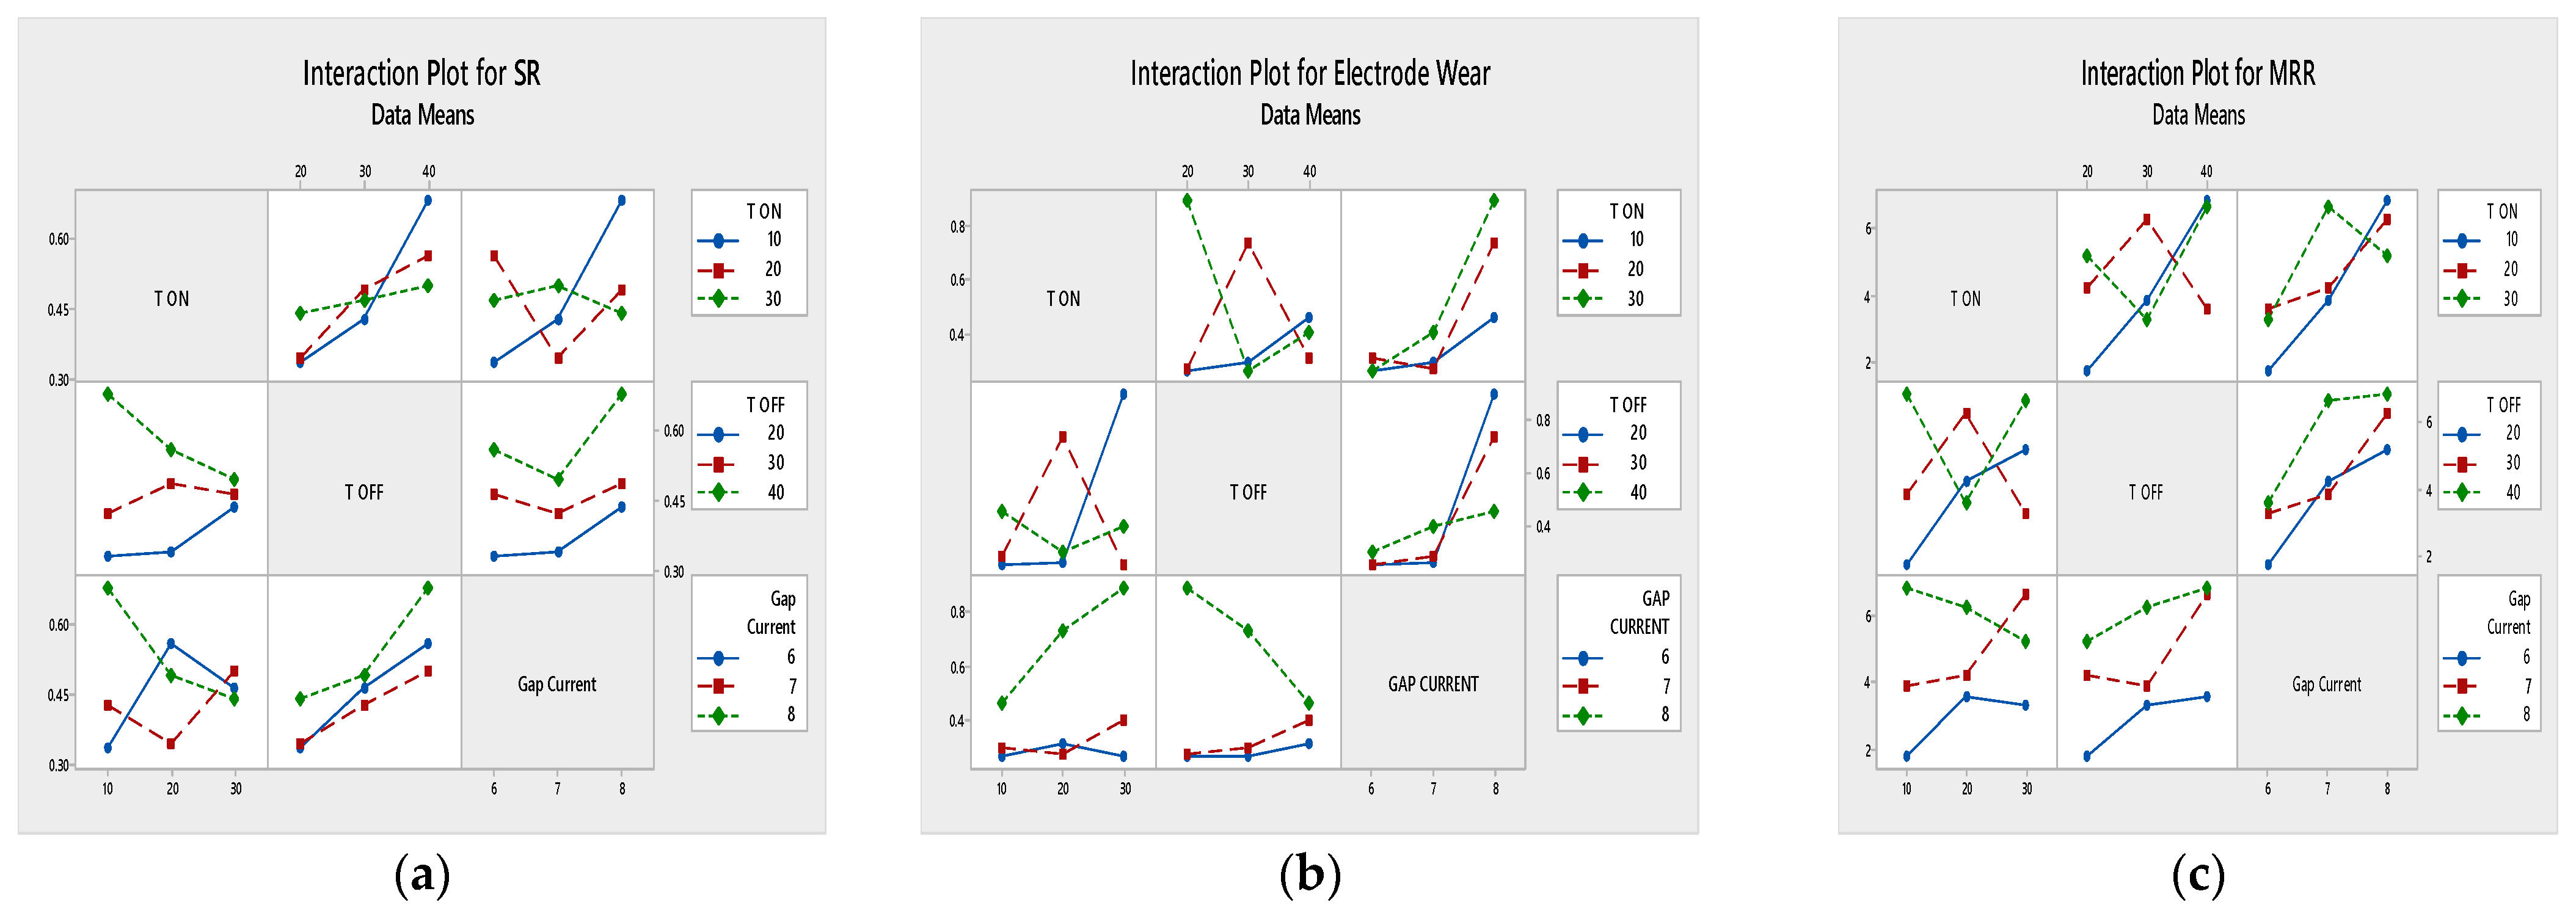
The relationship between one input parameter and a response relies on the value of the second input parameter. These plots describe the relation between the input parameters and responses. Figure 11 shows the interaction plots for various performance measures.

3.3. Grey Relational Analysis

A grey relational analysis (GRA) is applied for multiple objective optimization problems to find the optimum conditions for controllable variables.
For a larger-is-better scenario, the normalization is performed using Equation (2):
x i * k = x i k x i m i n k x i m a x k x i m i n k
If the criterion is of the-smaller-the-better type, the normalization is accomplished according to Equation (3):
x i * k = x i m a x k x i k x i m a x k x i m i n k
The grey relational coefficient (GRC) can be expressed as per Equation (4):
ζ i k = Δ m i n + ζ Δ m a x Δ i k + ζ Δ m a x
The grey relational grade (GRG) is calculated using Equation (5):
γ i = 1 m k = 1 n w × ζ i k
The GRG also shows the degree of impact that the comparability sequence could employ over the reference sequence. Table 13 indicates the grey relation analyses of the nine fair trials.

4. Fuzzy Interference System

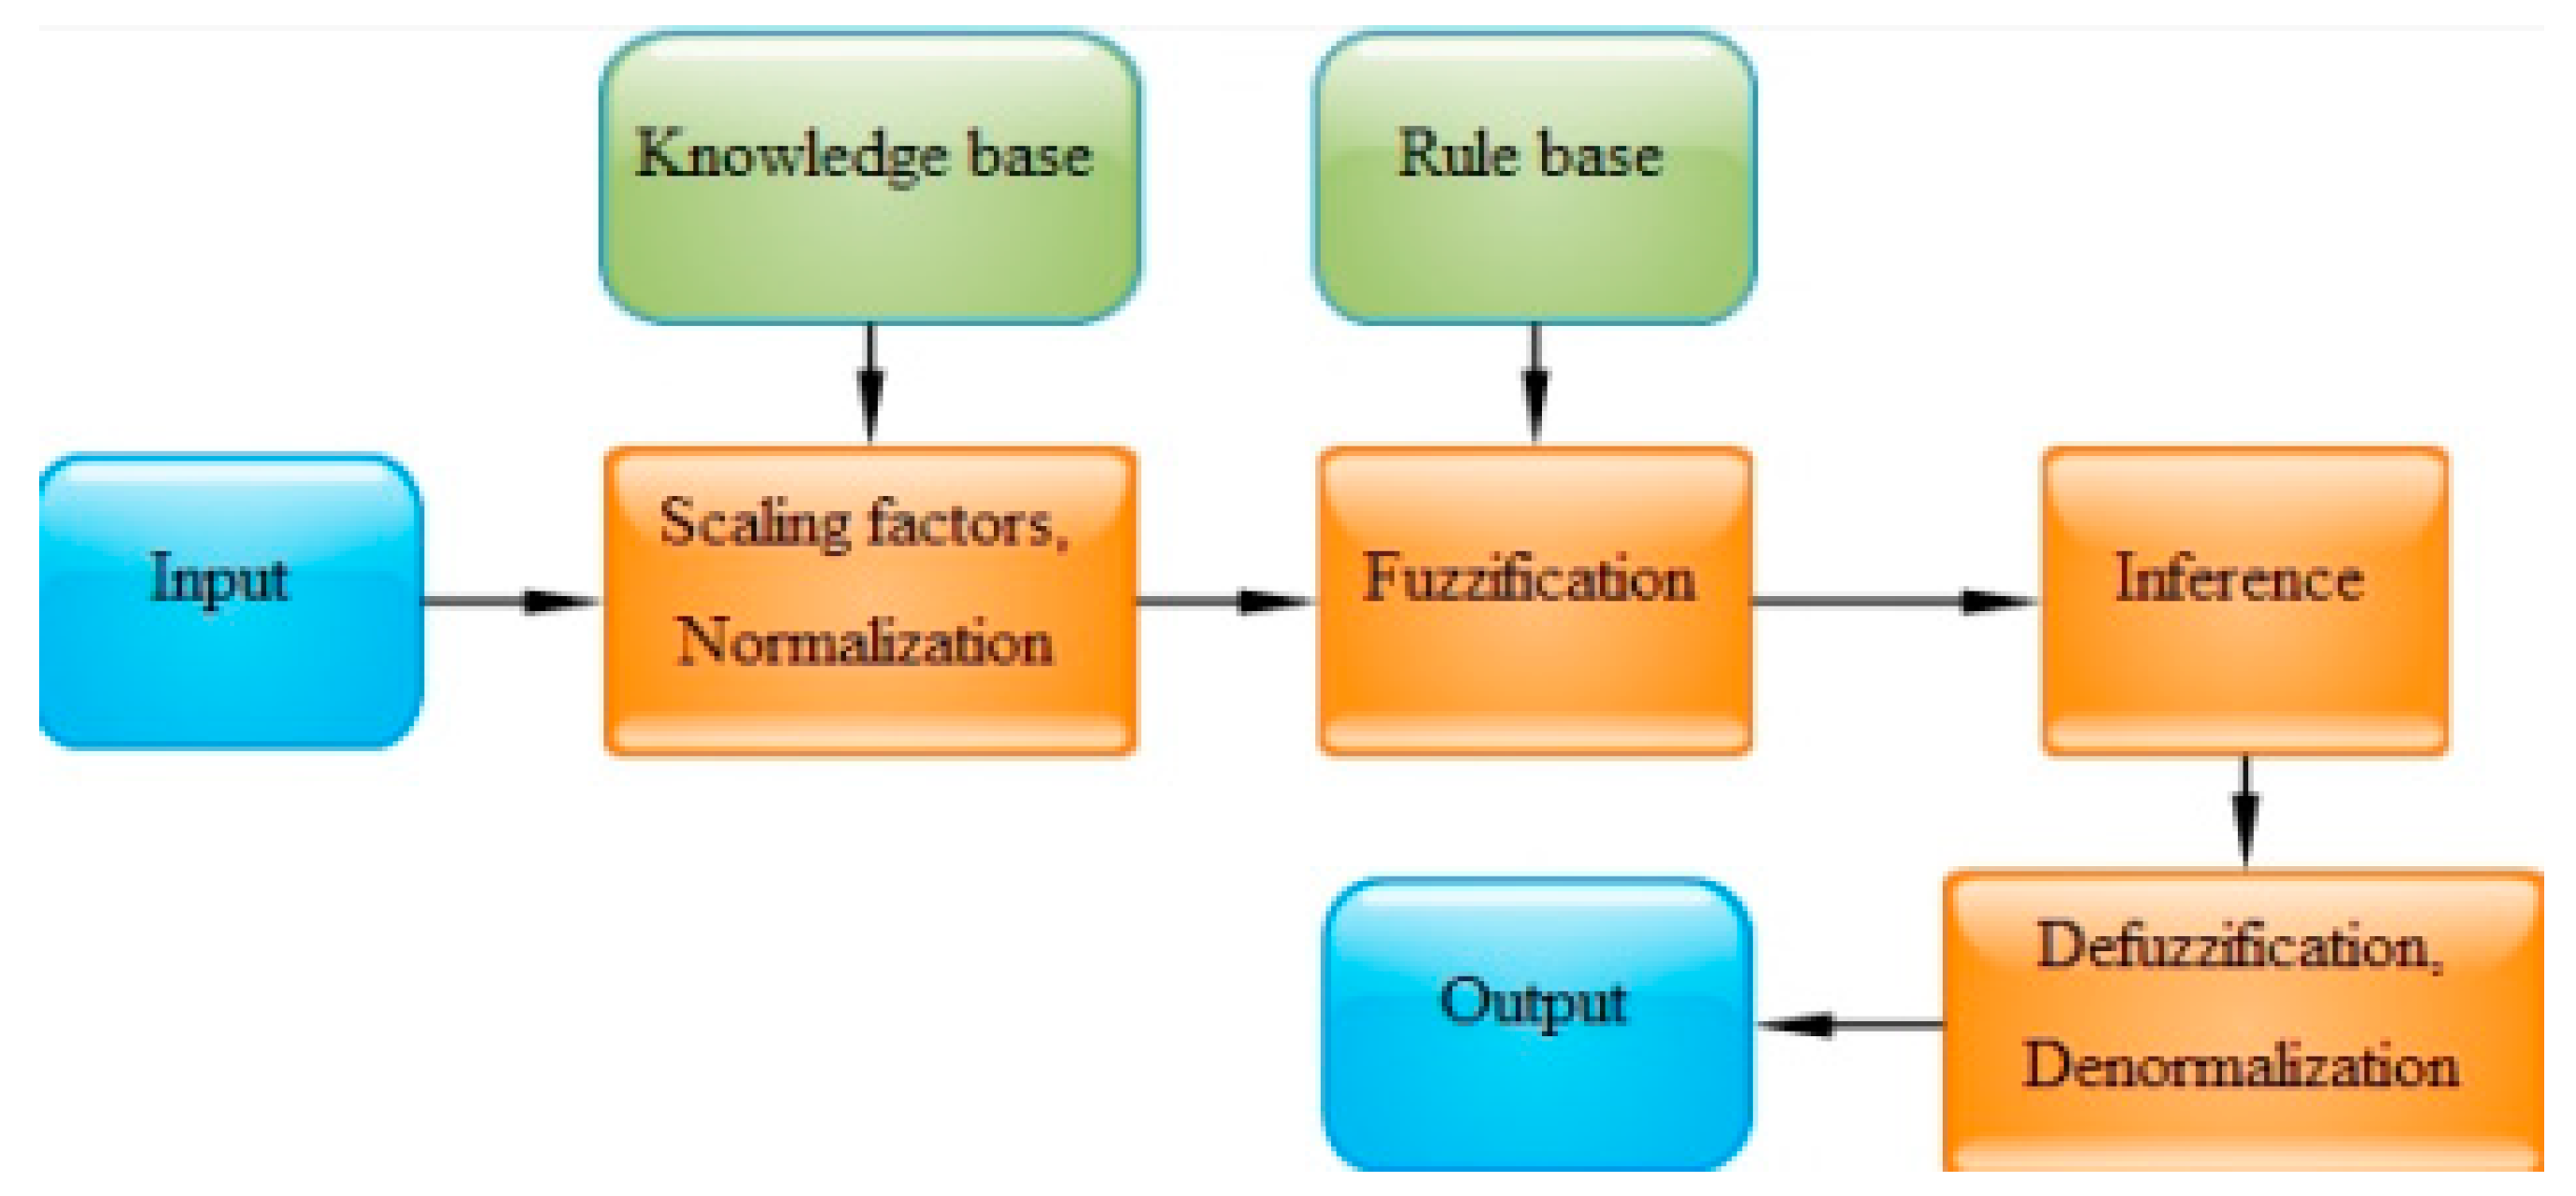
Fuzzy logic or fuzzy inference is a strategy of reasoning like a human; the logic behind the system is to make decisions with all the possibilities. The fuzzy system consists of a “fuzzification interface, rule base and database of decision making and finally a defuzzification interface”, which constitutes four different models closely associated with each other to monitor the performance. Membership functions characterize the fuzziness derived from a database constrained between zero and one, which reflects the degree of similarity and is used in fuzzy rules to perform decision-making. The fuzzy rule base works with if–then control rules with three inputs and one output. Figure 12 represents fuzzy inference systems.
“Fuzzy systems base their decisions on inputs and outputs in the form of linguistic variables. The database defines the membership function of the fuzzy sets, fuzzy rules, inference operation on the pre-defined rules is performed by the decision-making unit.” The fuzzification interface decides the transformation of the controllable variables into a degree of match with linguistic variables. The fine-tuned output delivered from the defuzzification interface is converted into fuzzy results. Triangular membership functions use three variable memberships, “low, medium and high”. Figure 13 shows fuzzy inferences for input and output variables.
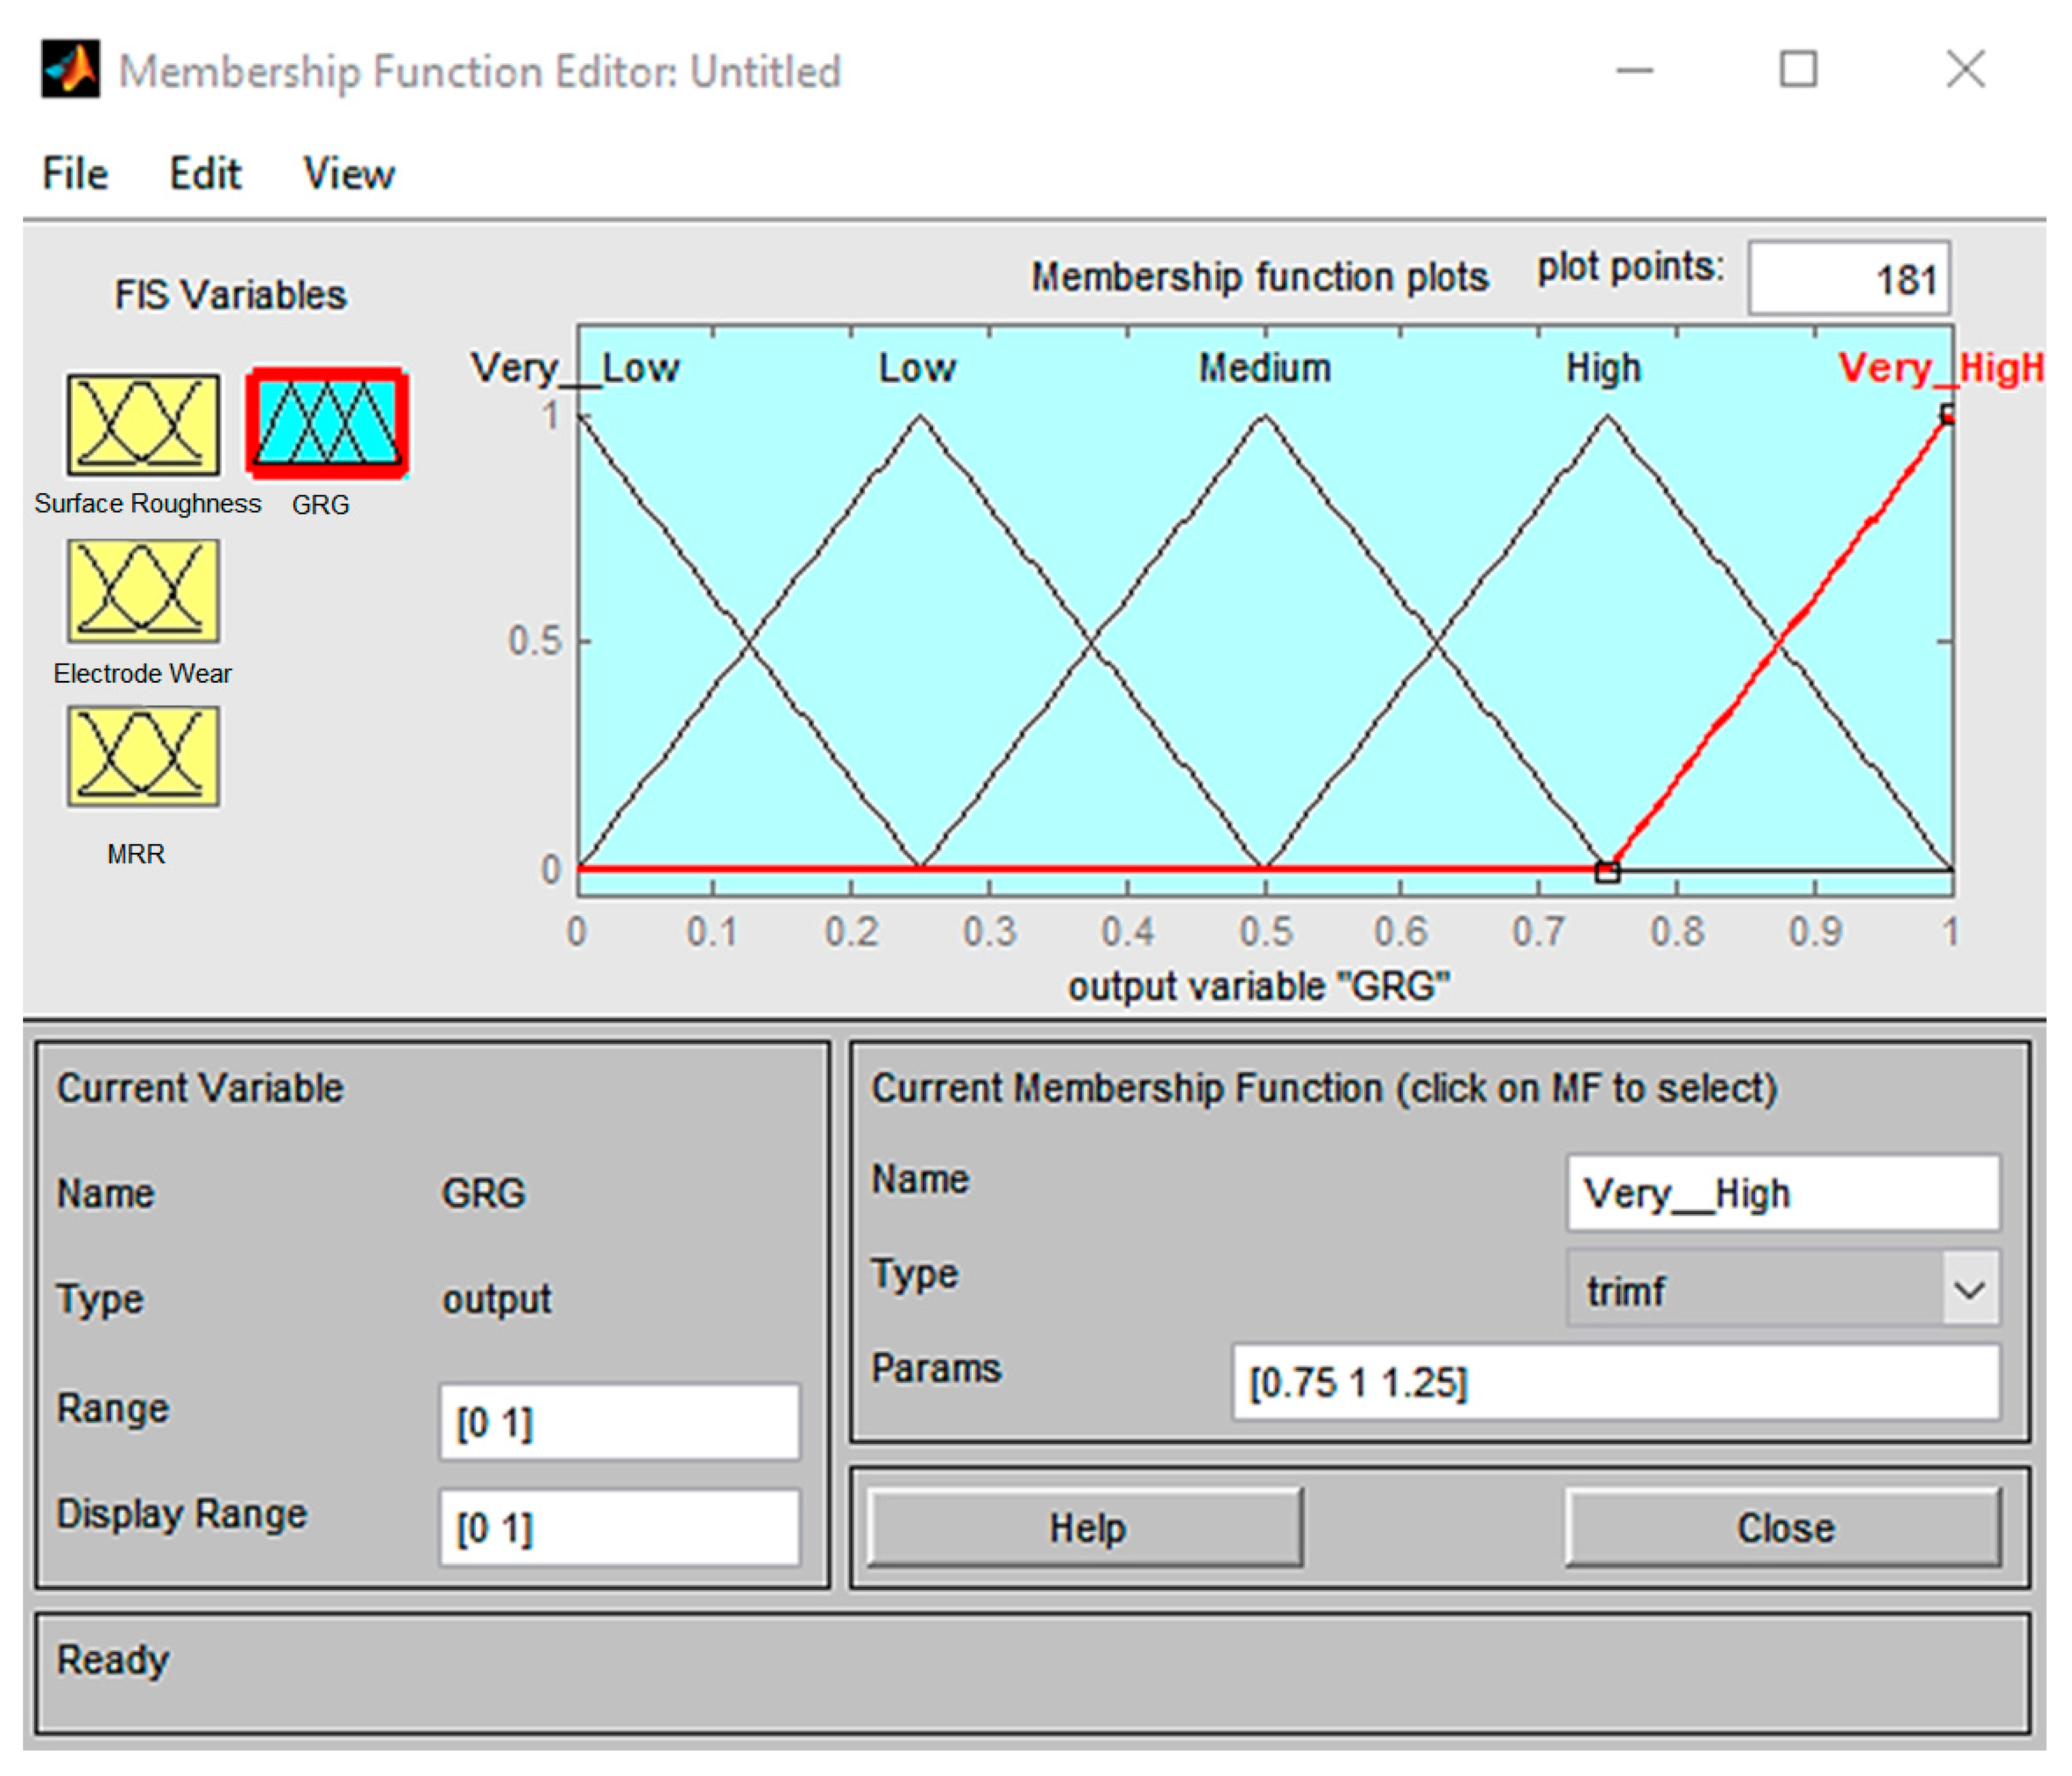
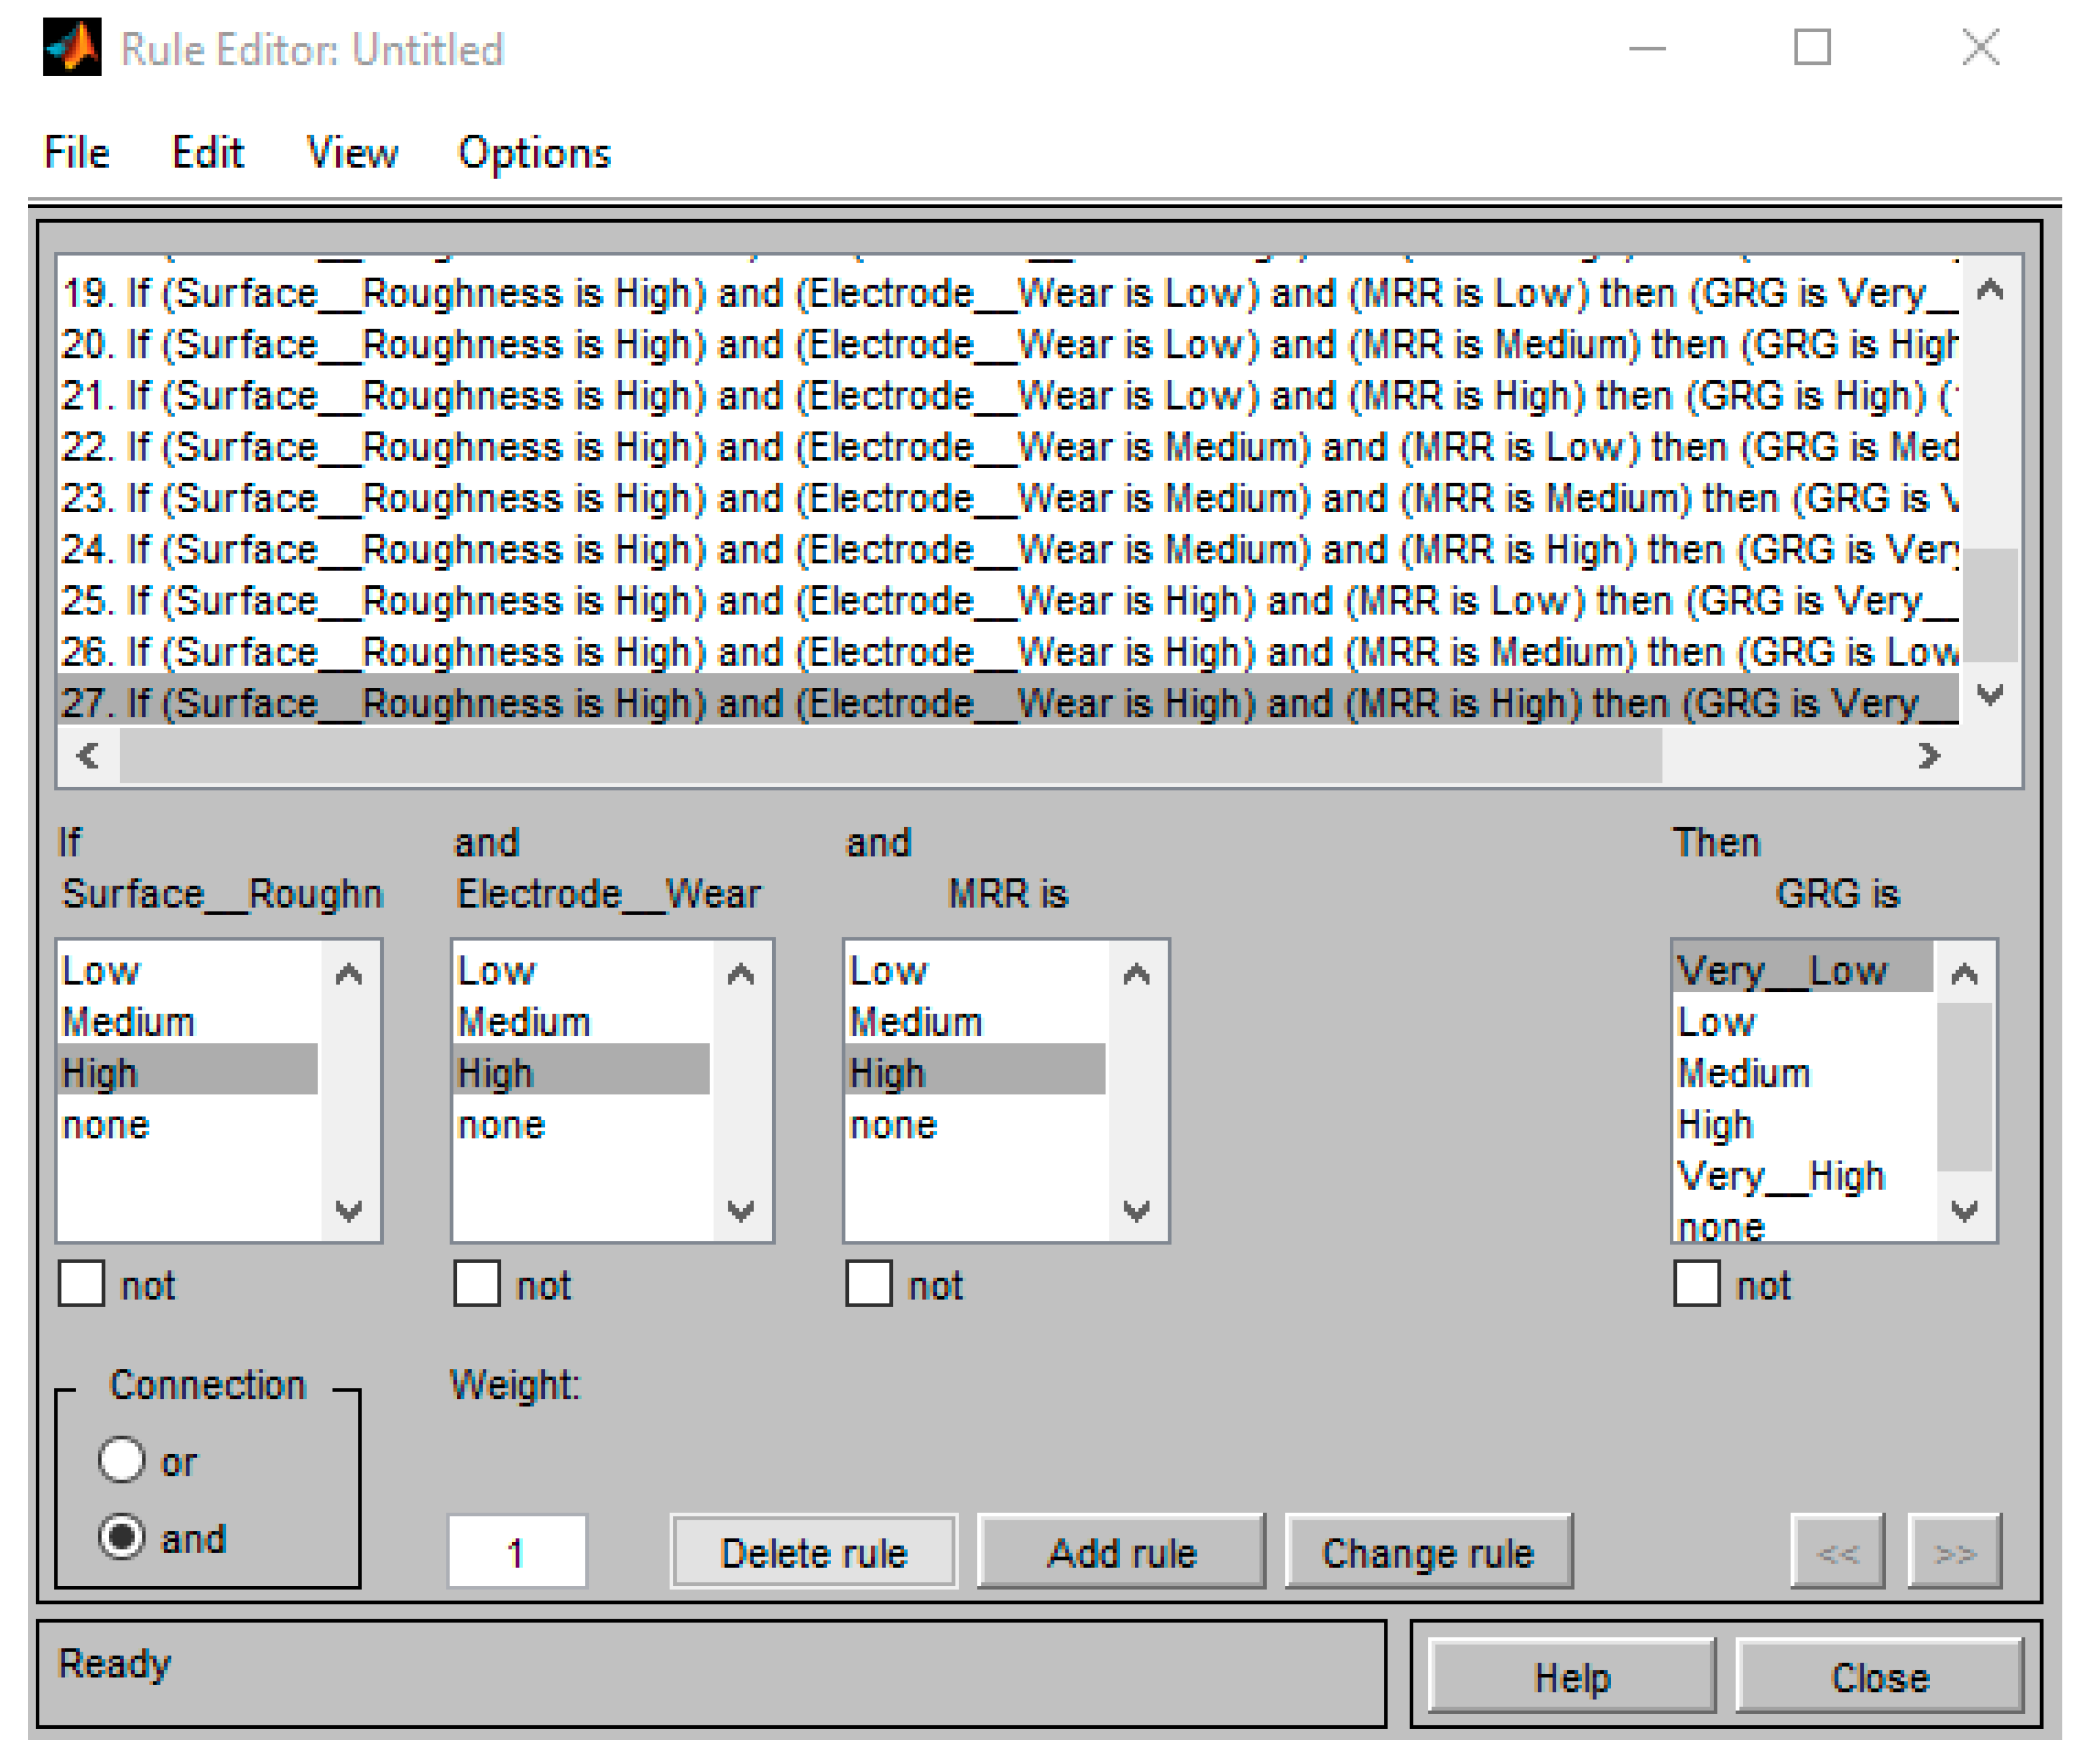
The fuzzification consists in the transformation of controllable variables data into membership function such as “large, medium, high”, etc., and its value varies from zero to one, which illustrates graphically the fuzziness in the fuzzy set. Figure 14 represents the triangular membership function. Figure 15 represents the rule editor of fuzzy systems.
The relationship among dependent and independent variables is driven by “IF-THEN” control rules, such as
  • “Rule 1: if ×1 is A1 and ×2 is B1 then y is C1 else”;
  • “Rule 2: if ×1 is A2 and ×2 is B2 then y is C2 else”;
  • “Rule 3: if ×1 is A3 and ×2 is B3 then y is C3 else”;
  • “Rule n: if ×1 is An and ×2 is Bn then y is Cn”.
where A, B, and C are fuzzy subsets which are defined by the corresponding membership functions.
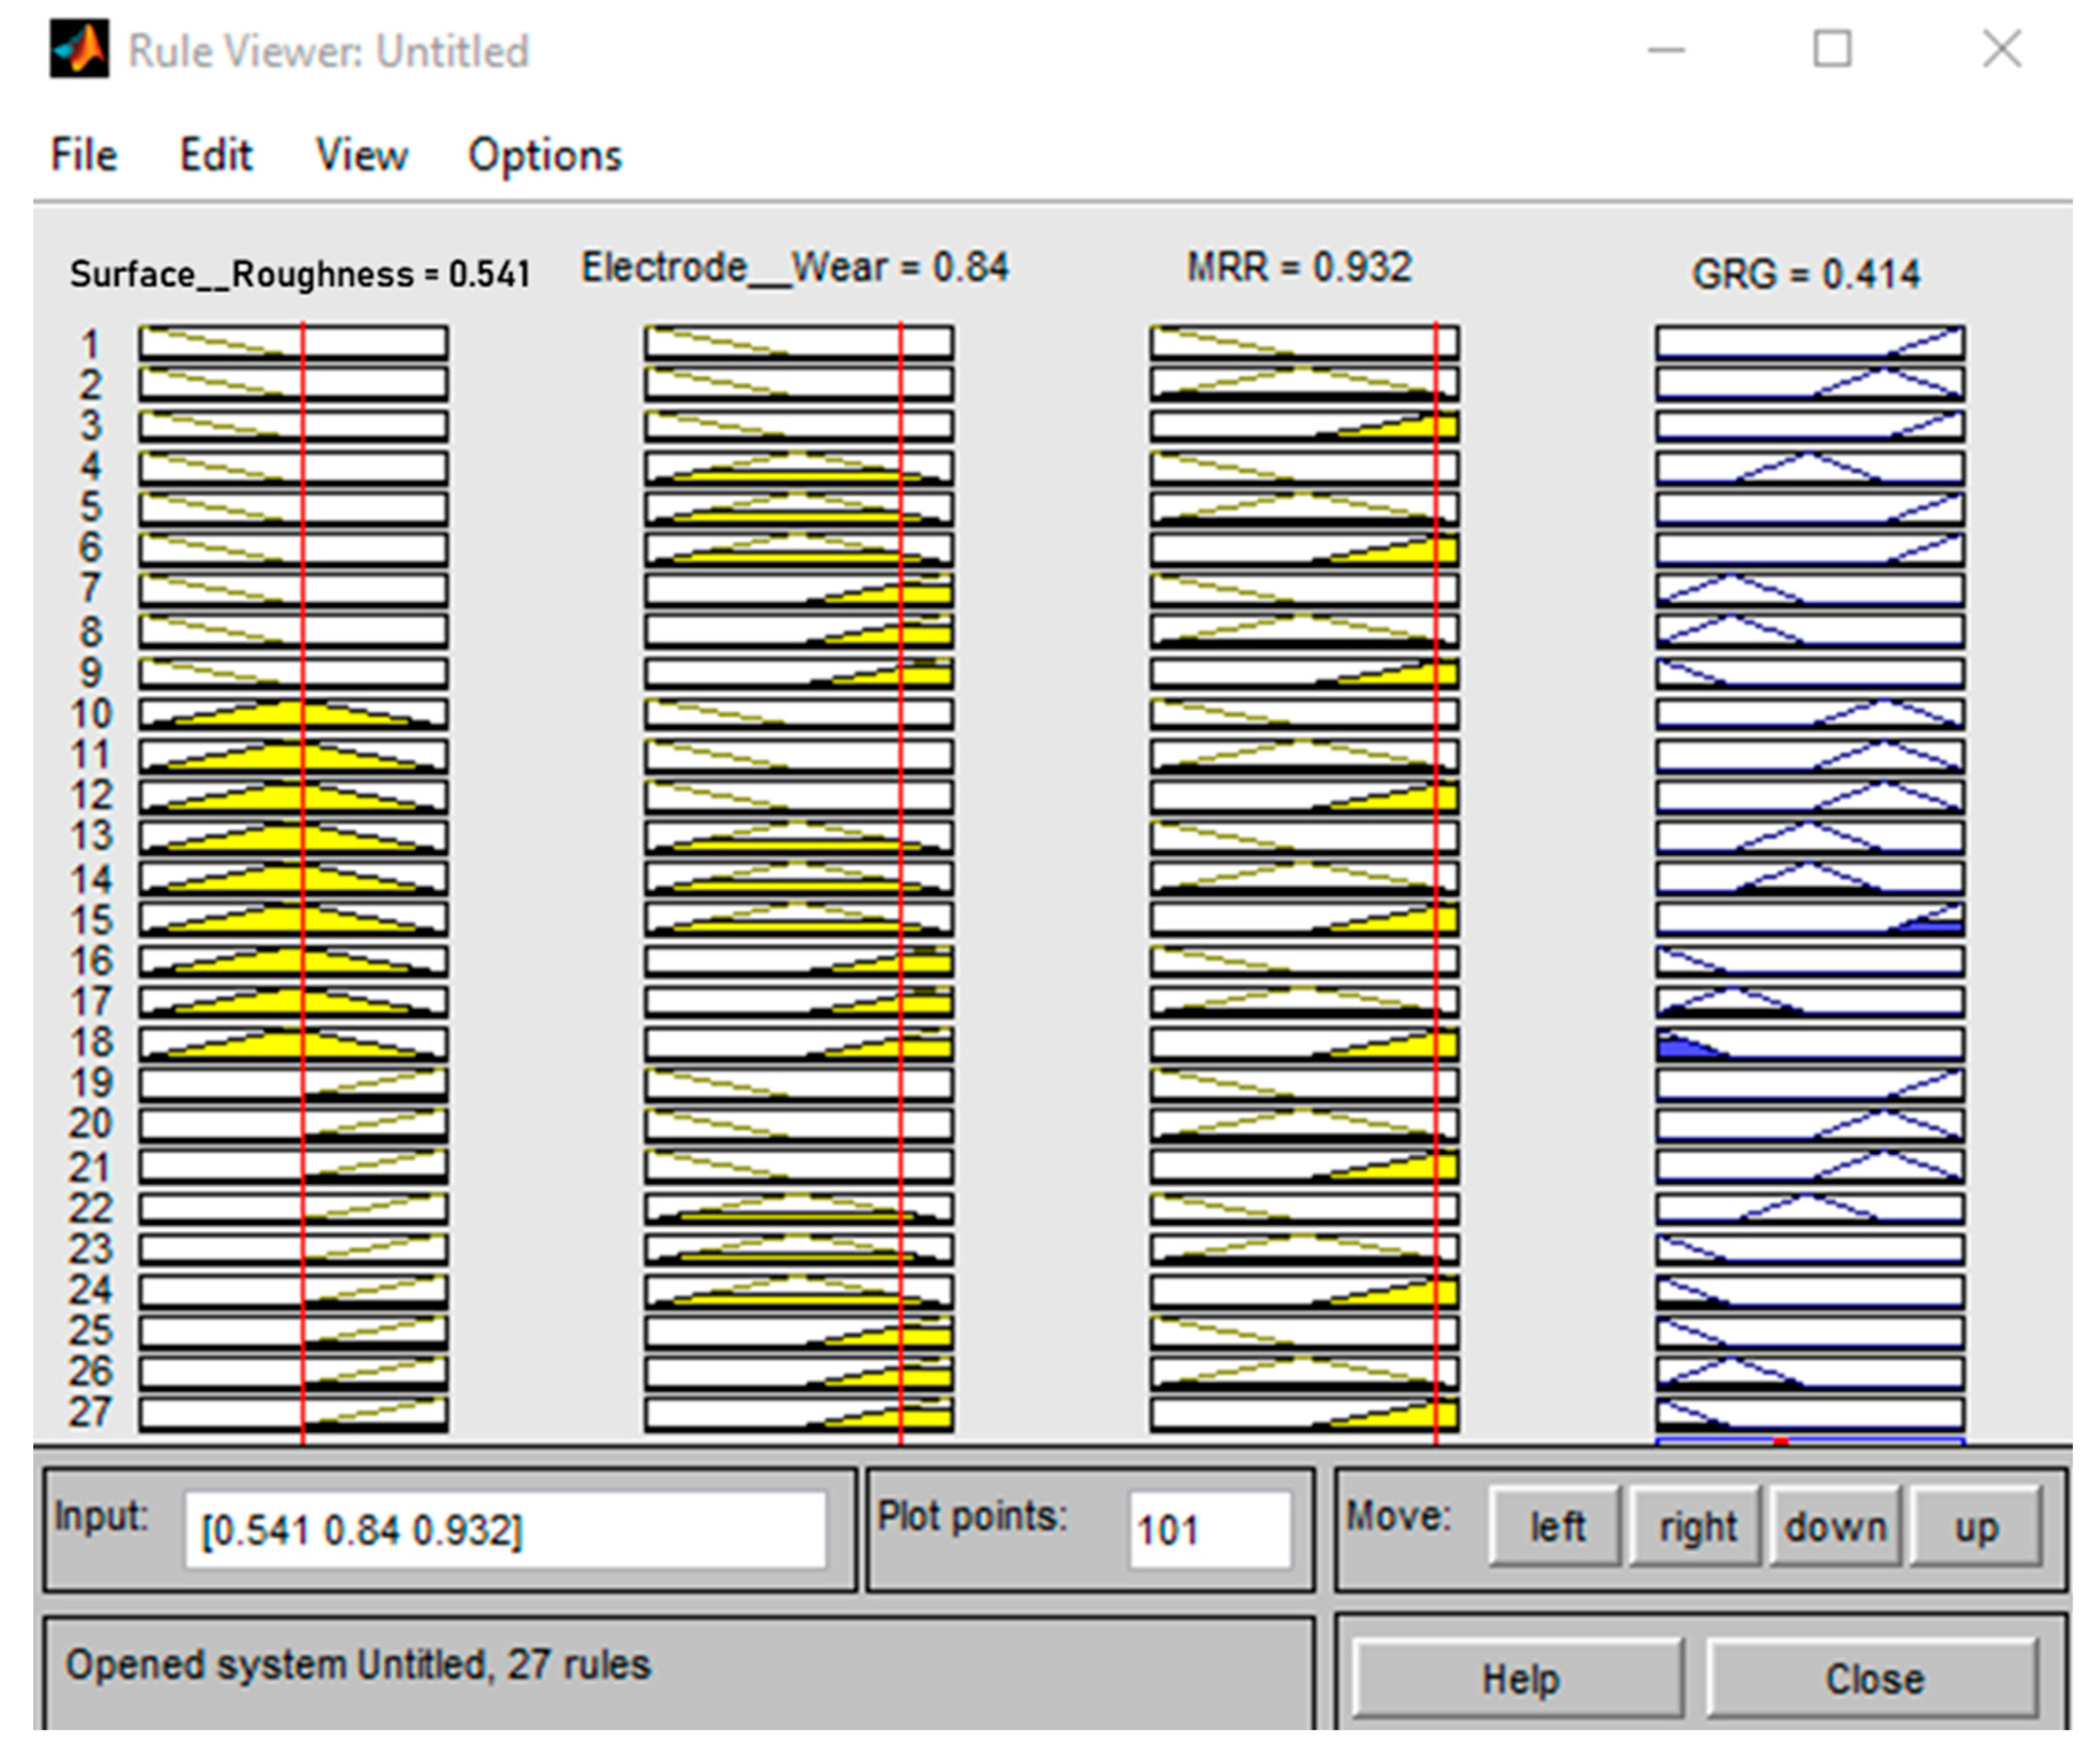
Figure 16 represents the rule viewer for a fuzzy system, and Table 14 and Table 15 represent the range of subsets for FRG and grey-fuzzy reasoning grade (GFRG), respectively.
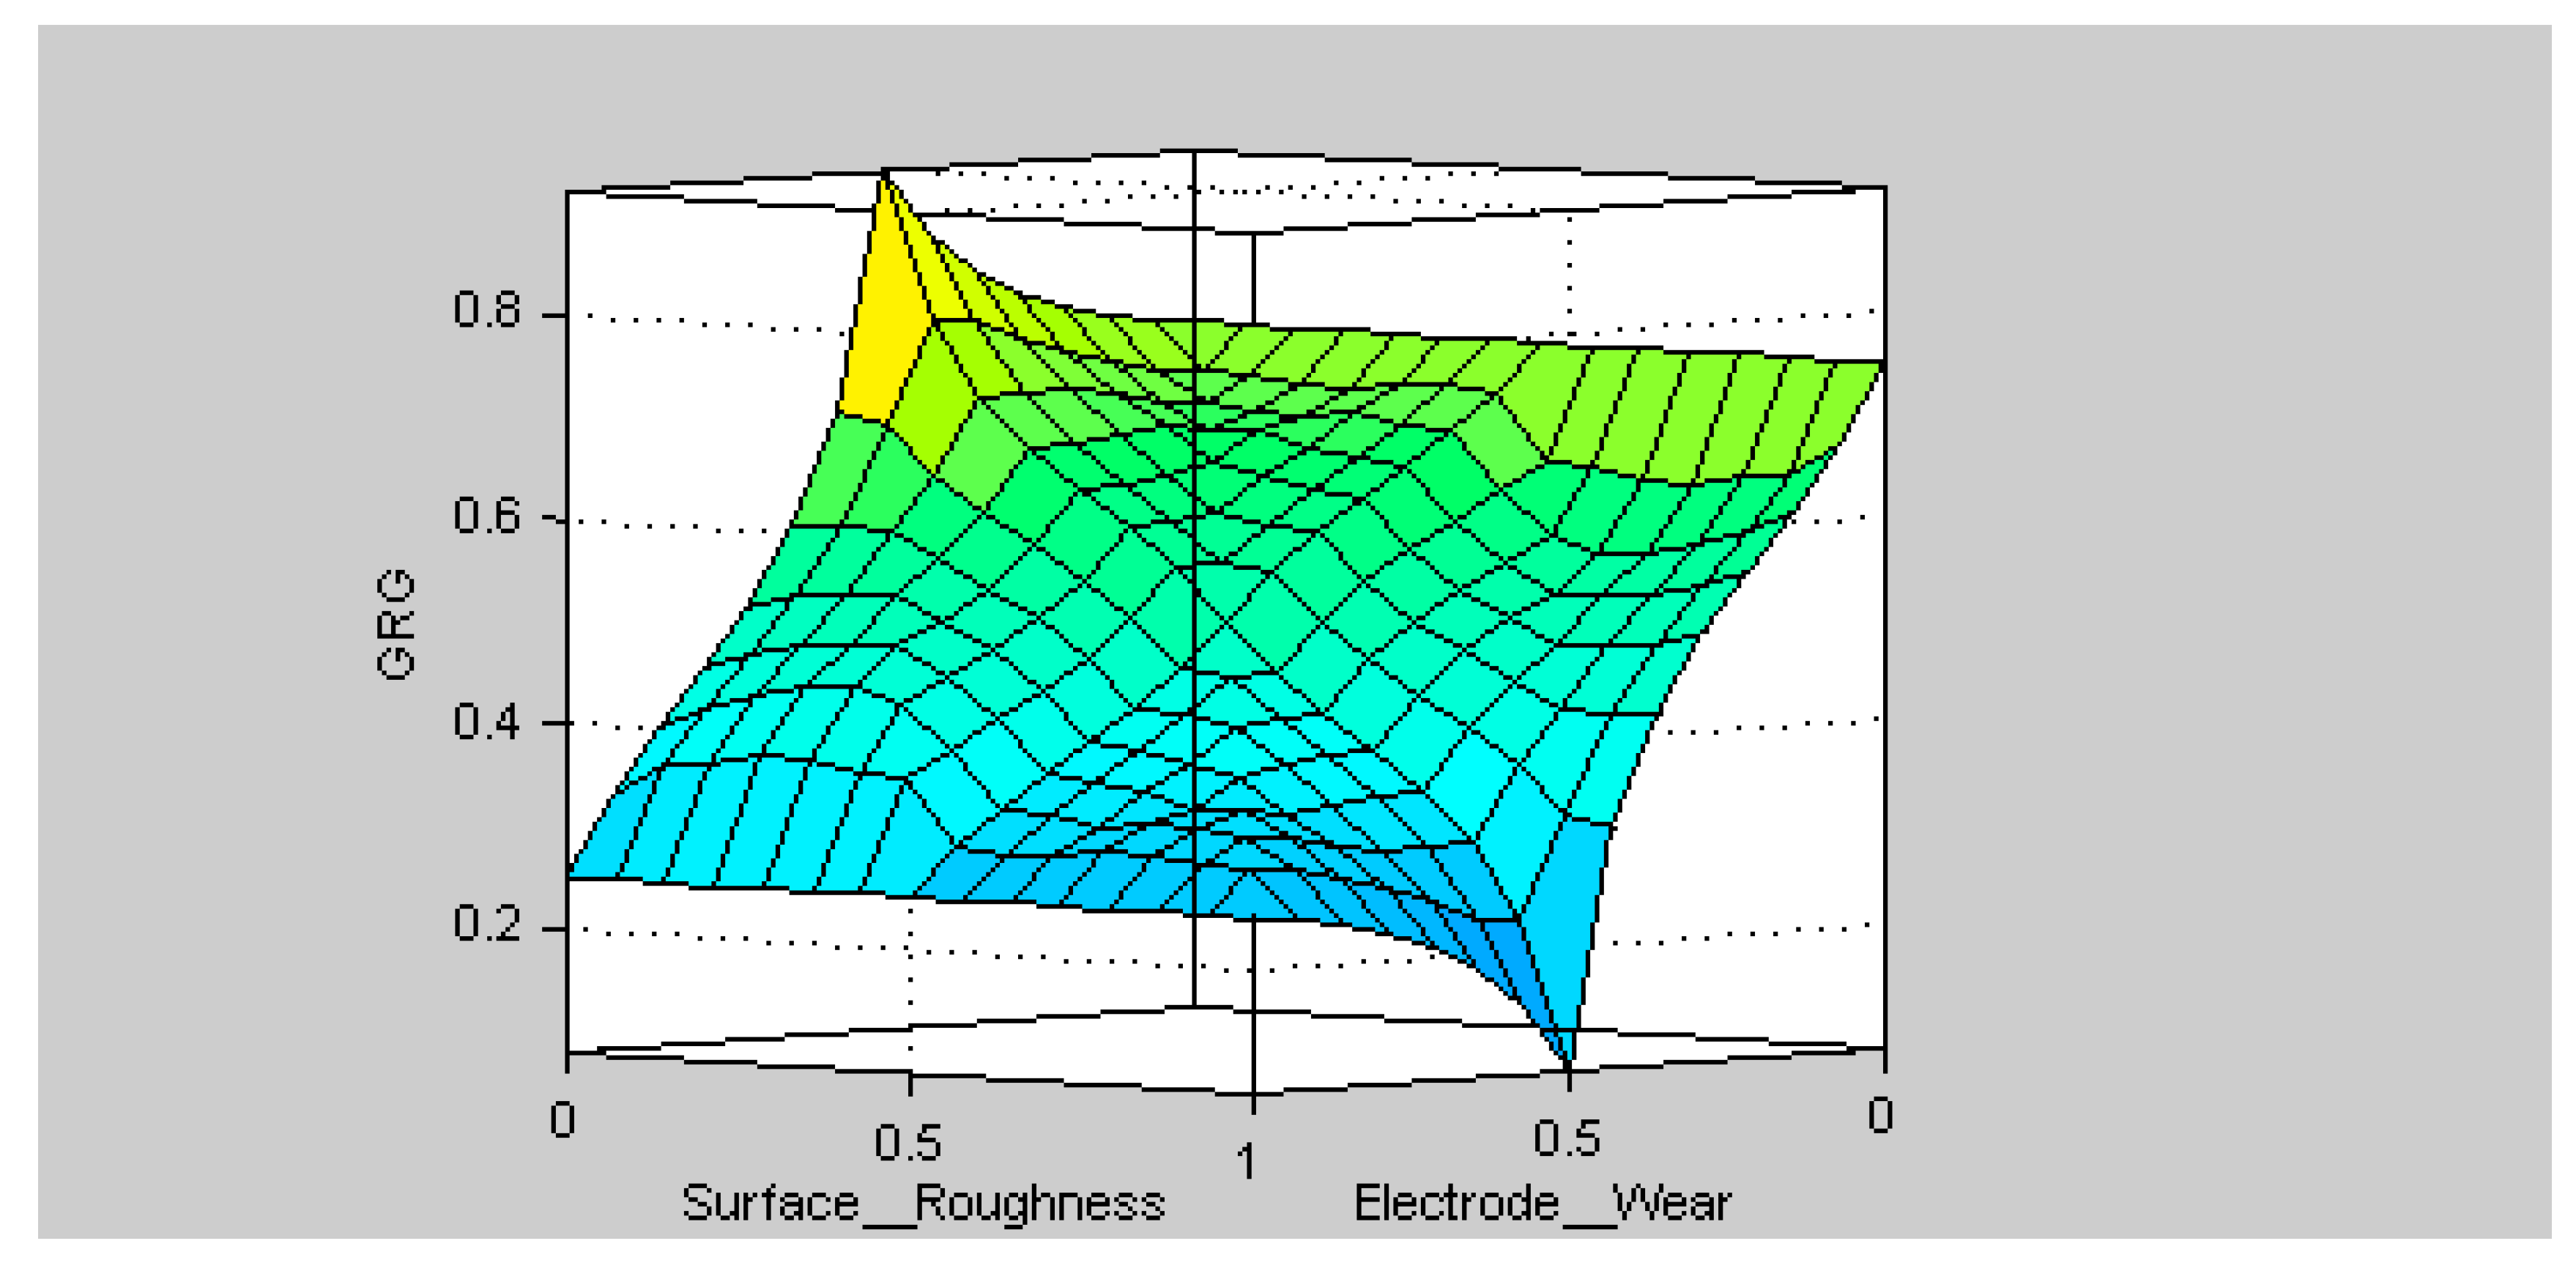
The impact of Ra, EWR, and MRR was based on the if–then rules framed for three membership functions of the input functions and five membership functions of the output functions, and a surface plot was drawn between the inputs and the responses as shown in Figure 17.
From Table 15, observations were made, and we inferred that the first trial run was the optimal condition among the nine trials. The highest value of GFRG was found to be 0.926 for the optimal input conditions with a 10 µs T ON, a 20 µs T OFF and a 6 A gap current, where the surface roughness was 0.333 µm, the electrode wear was 0.262 mm, and the MRR was 1.744 gms/min.
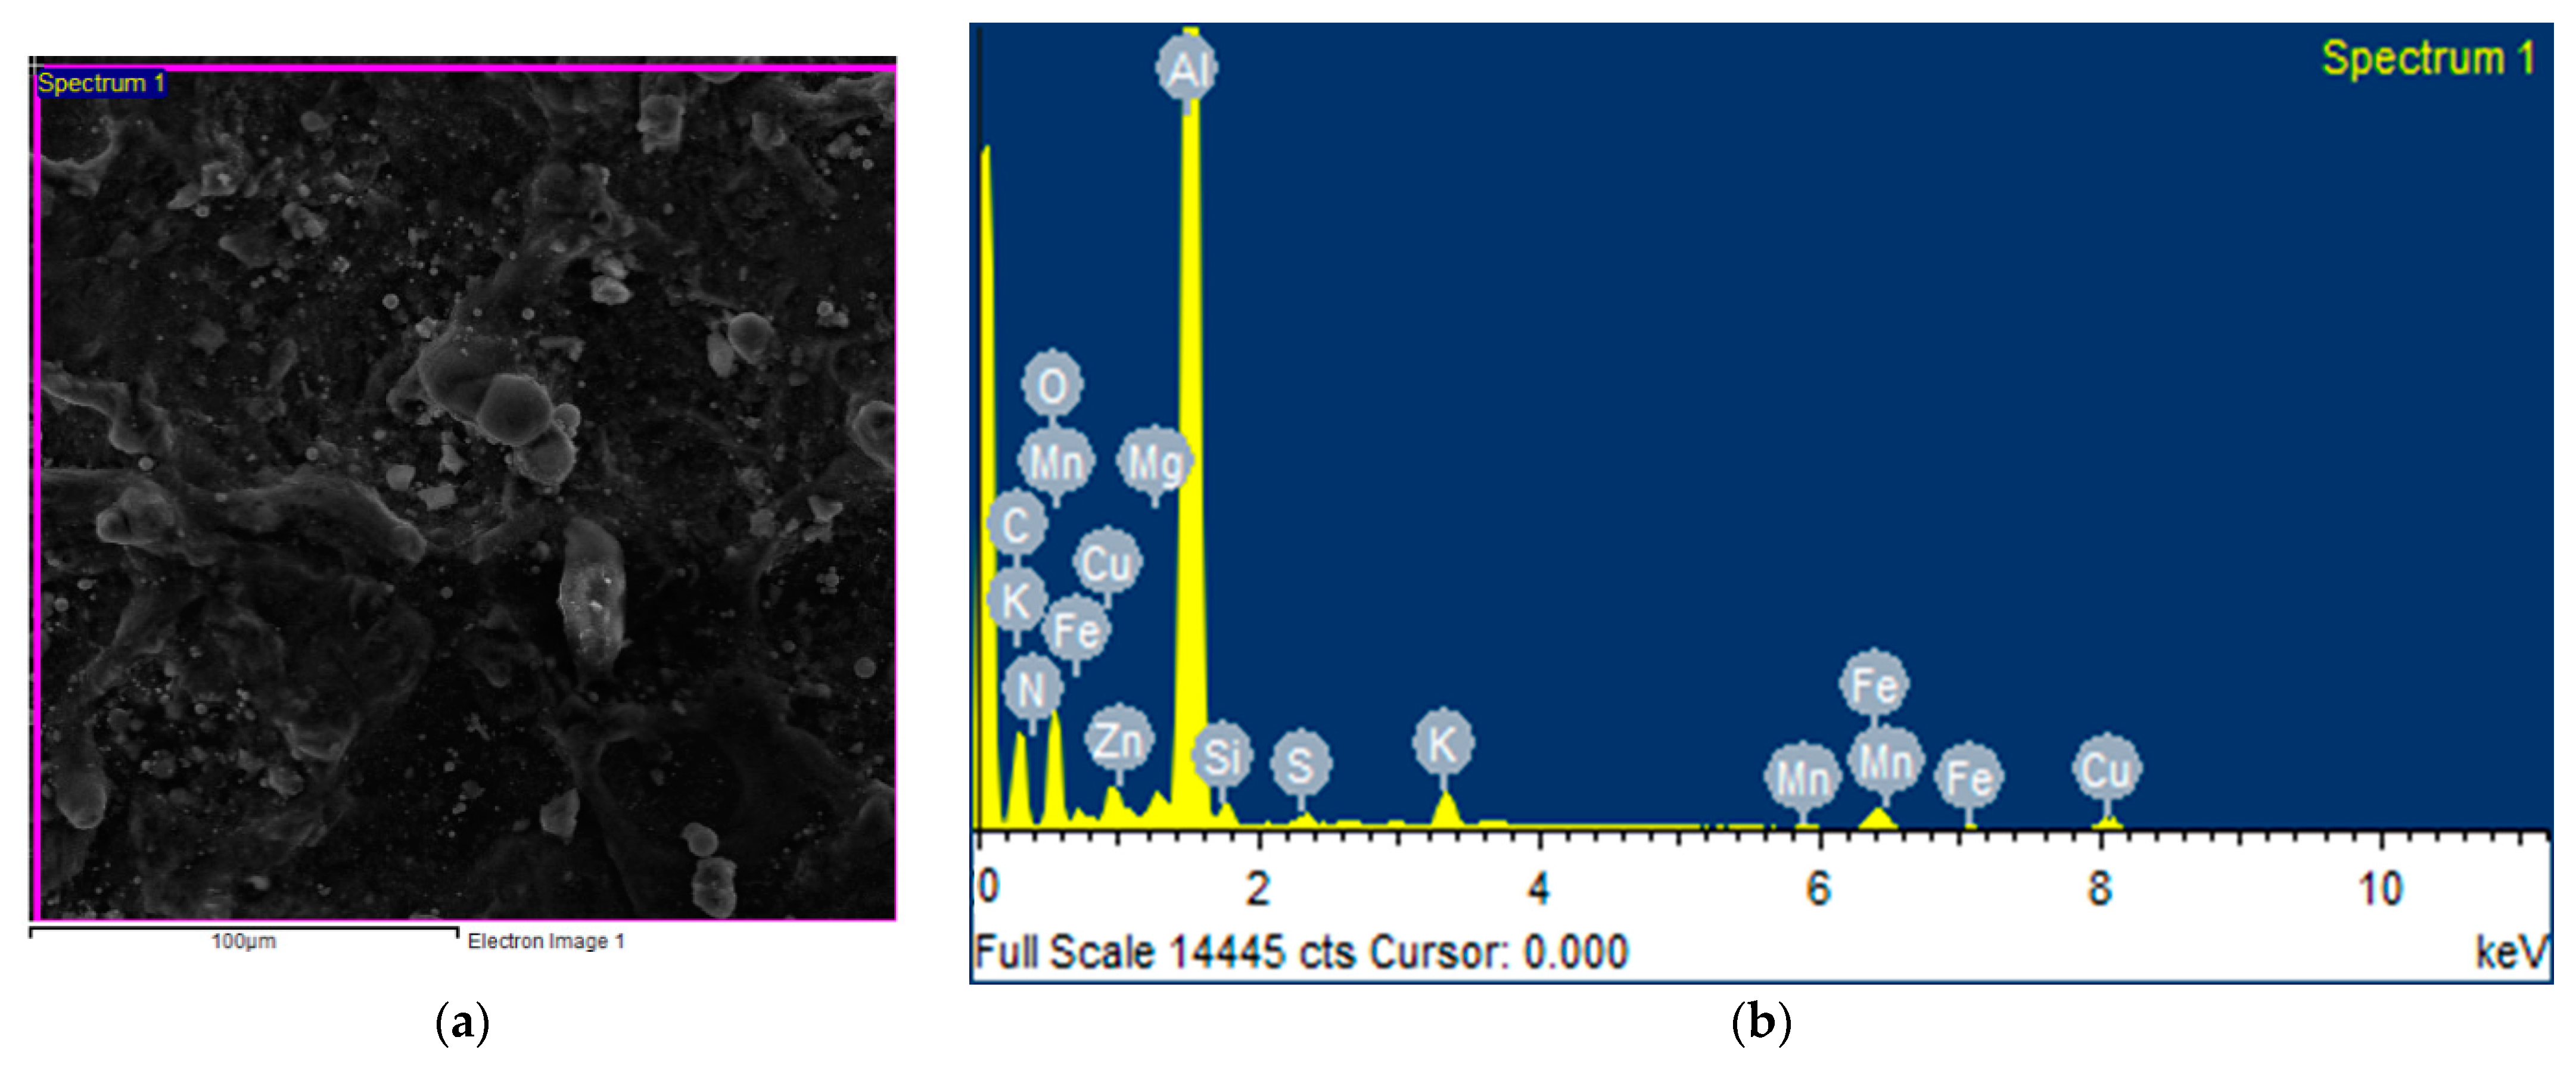
An SEM micrograph captured at 100 µm showed the grain boundaries indicating a more equal reinforcement distribution in the matrix with an improved microstructure, as shown in Figure 18. The images of the EDS analysis are shown in Figure 18. The aluminium peak, copper peak, silicon peak, carbon peak, iron peak, nitrogen peak, and manganese peak in the image confirmed the addition of the respective constituents in the A-2014 matrix melt. The highest aluminium peak in the spectrum means aluminium was the main constituent with the highest composition, and other gradients were also accordingly present [40,41,42].
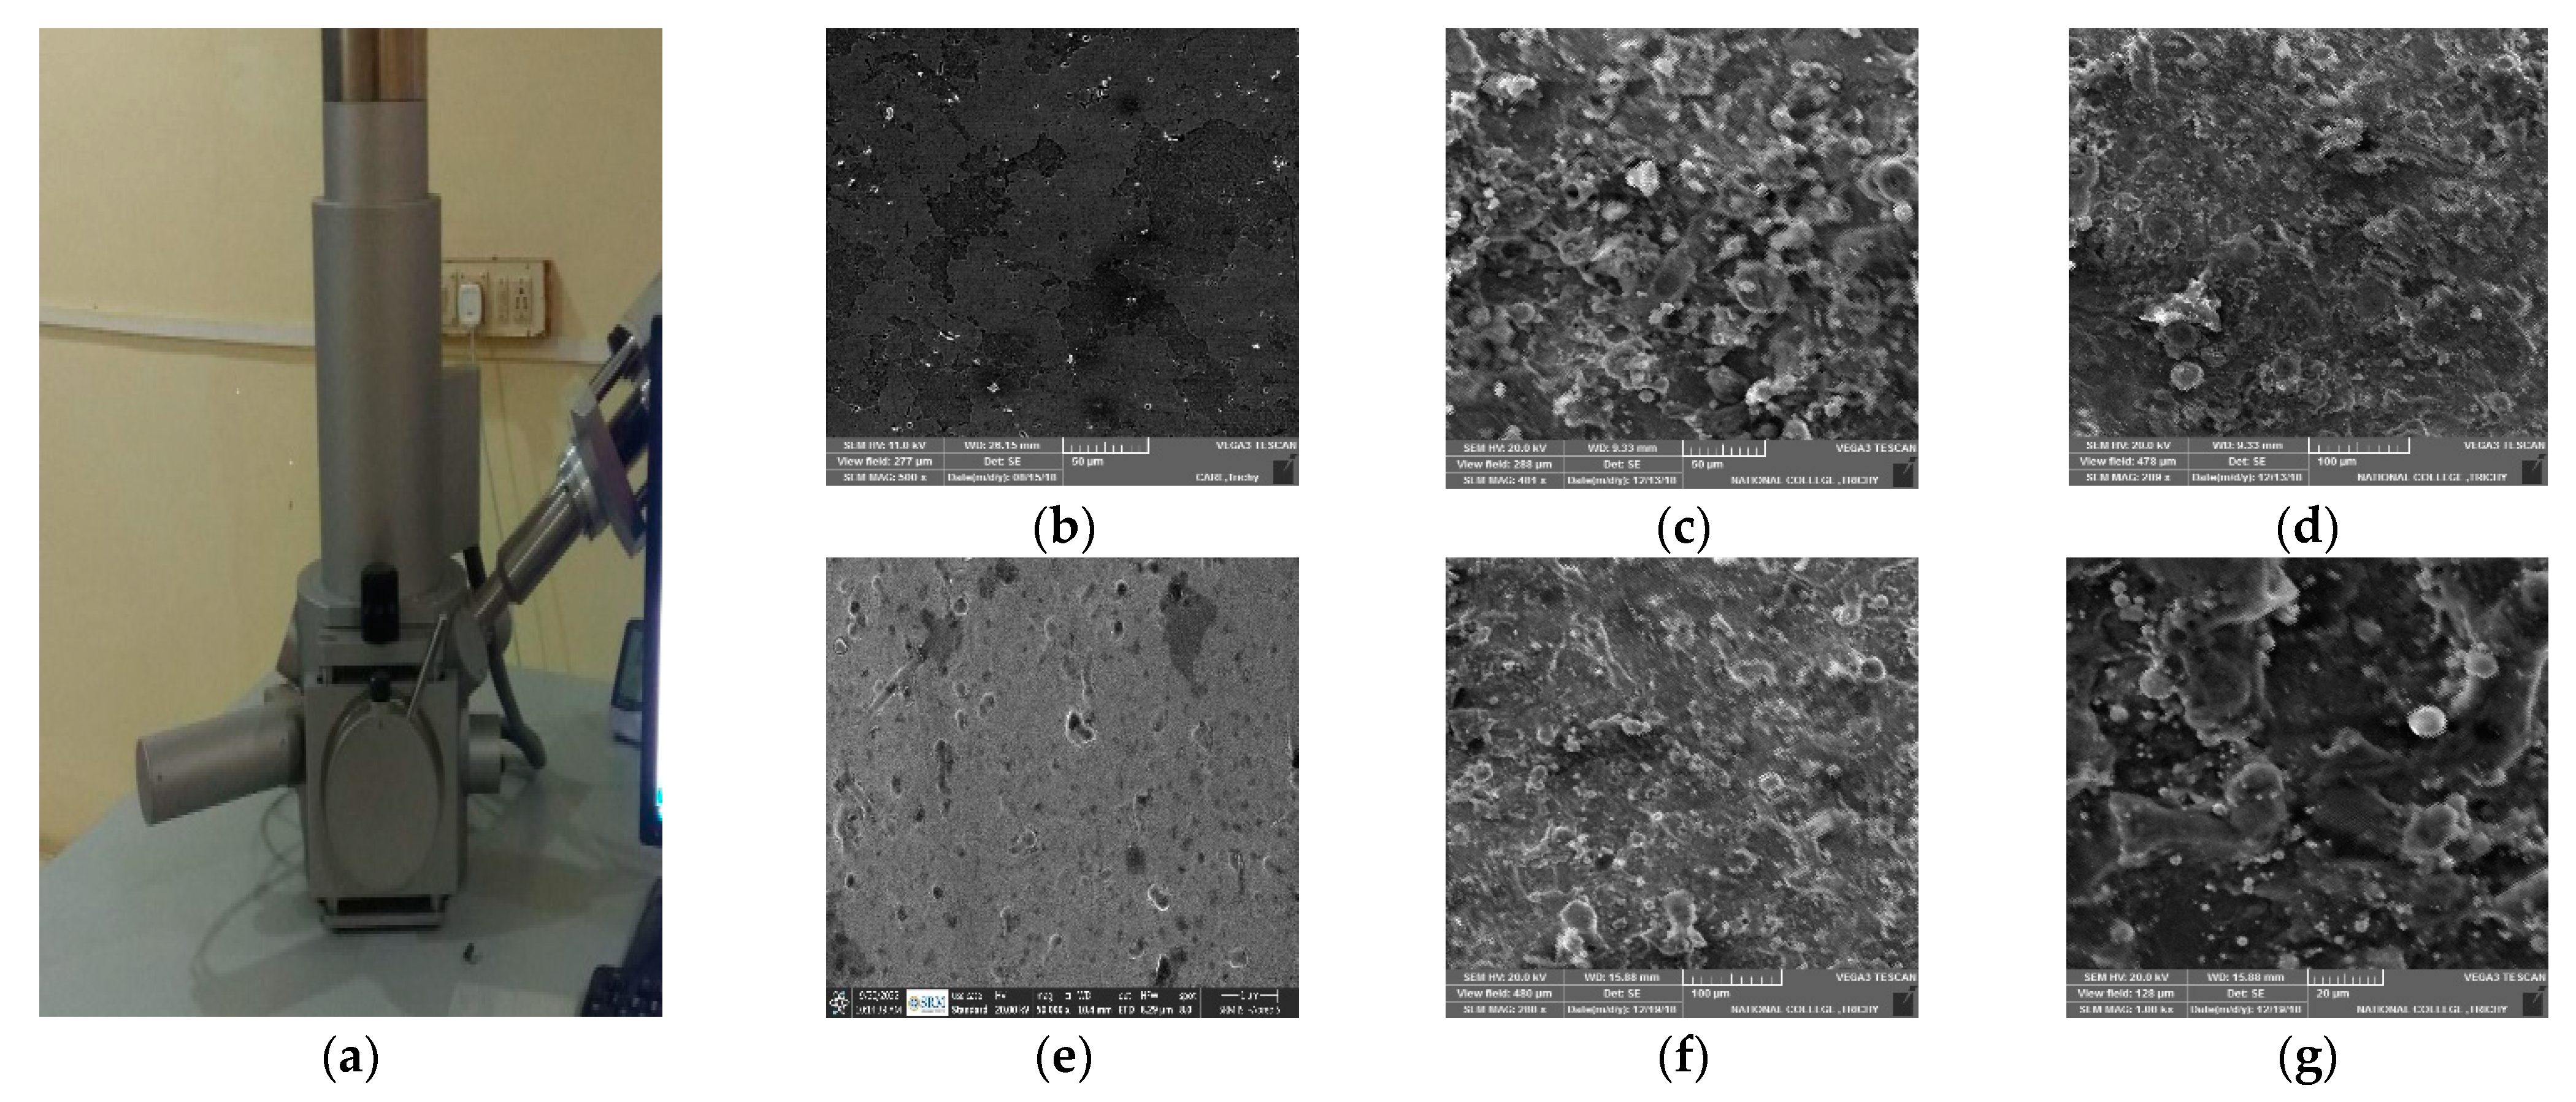
SEM images taken with an “EVOLS15, Carl Zeises at 9.0 kx and 15.0 kV” were used in the analysis of the fracture morphology with a higher magnification of tested samples of Al + Si3N4 + Mg + cenosphere hybrid reinforced MMCs, as illustrated in Figure 19a. The SEM images indicate the presence of filler-reinforcing material within the base alloy. Figure 19b–g depicts the grain boundaries, indicating a more equal reinforcement dispersion in the base alloy with an improved microstructure. The distributions of Si3N4 and Mg particles are clearly indicated with the white spots at various regions of the SEM shown in Figure 19c,f. Very fine black spots are also identified as cenospheres nearby the same spots on the figures. These particles were found with the AA2014-R1 to be consistently dispersed [43,44].
In this XRD analysis of the fabricated composites, aluminium was a major constituent within this composite, following by silicon and magnesium elements, which were also present in higher quantities for the low-level weight percentage of these composites, as exhibited in Figure 20. SEM images were used to explore the fracture morphology with increased magnification views of the tensile tested specimens of AA2014-100% and various reinforced composites, as illustrated in Figure 21.
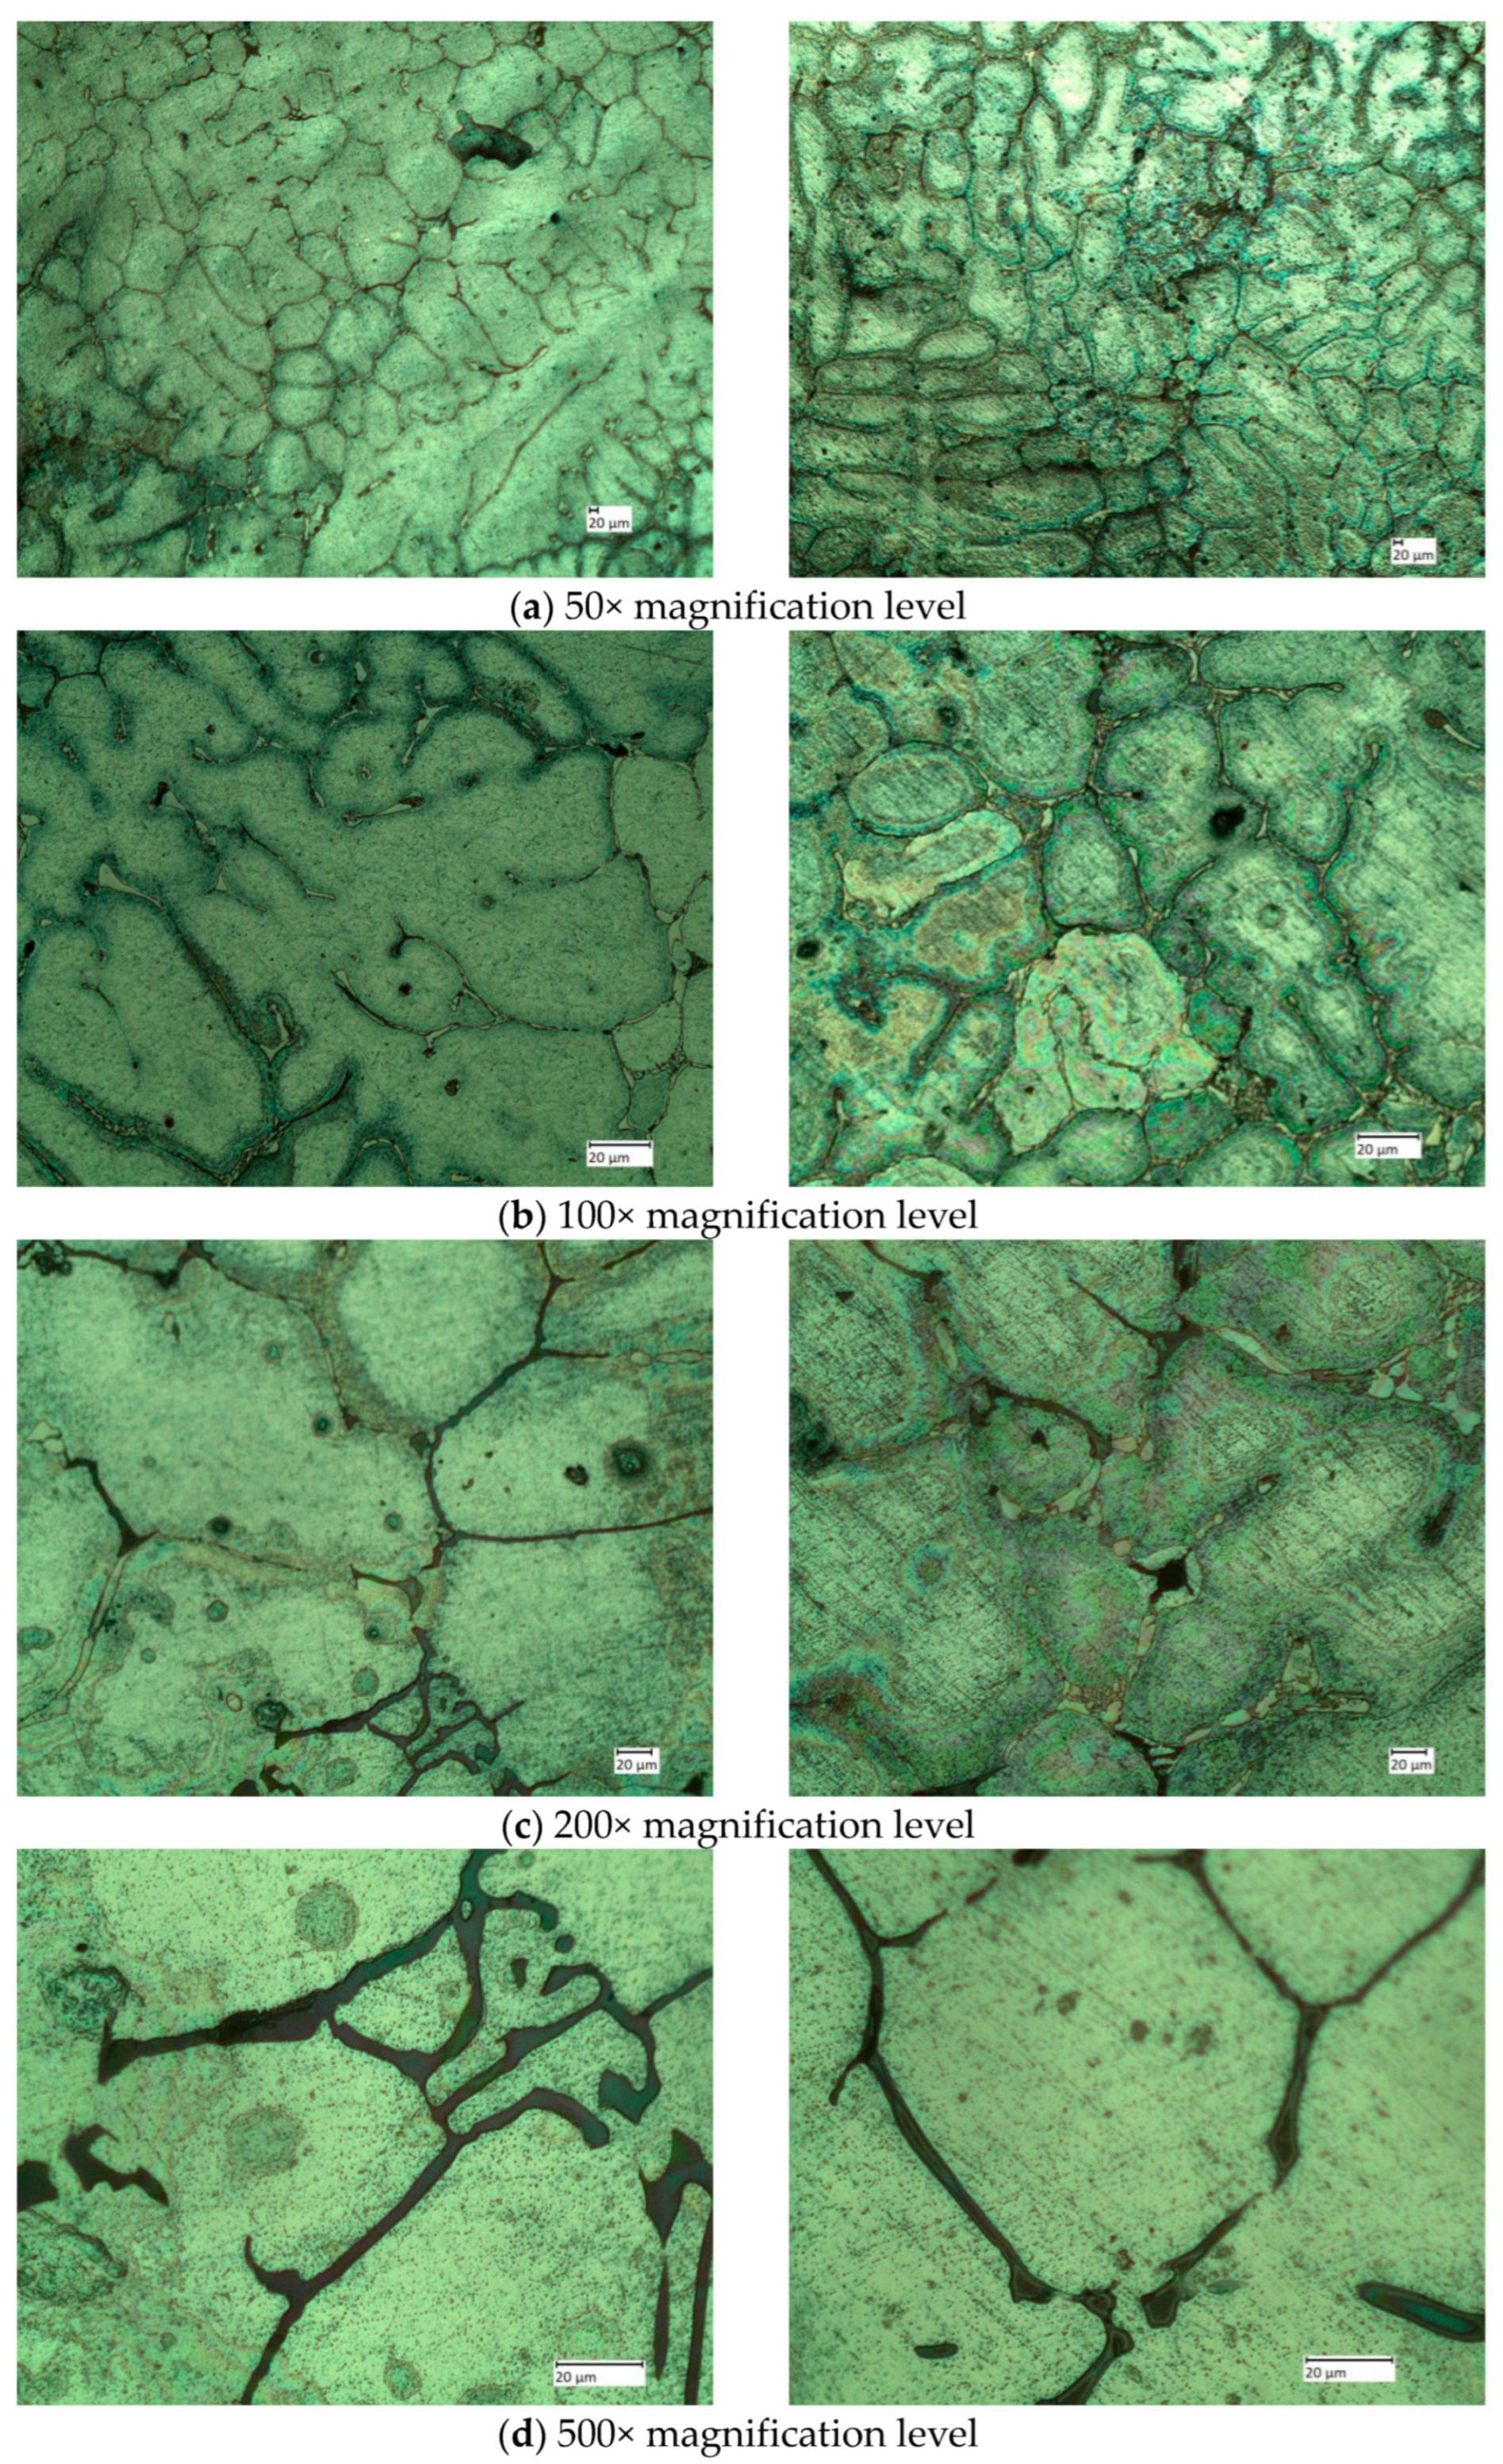
The hybrid MMCs prepared for this EDM process were involved in the SEM identification for finding their mechanical characteristics and microstructural details and the bonding of the specimens which had been prepared earlier. Figure 22a,b indicate that closely packed reinforcement structures for the 50× and 100× magnification levels were identified. The larger percentage of AA2014 with a warm-coloured region occupied the whole space of the composite structure boundaries. The circular ash-coloured spots indicated in Figure 22c,d represent the silicon and nitrates of the cast composites [45,46]. A very fine dispersion of cenosphere reinforcement particles were seen at the 500× magnification level of the microstructural characterization image.
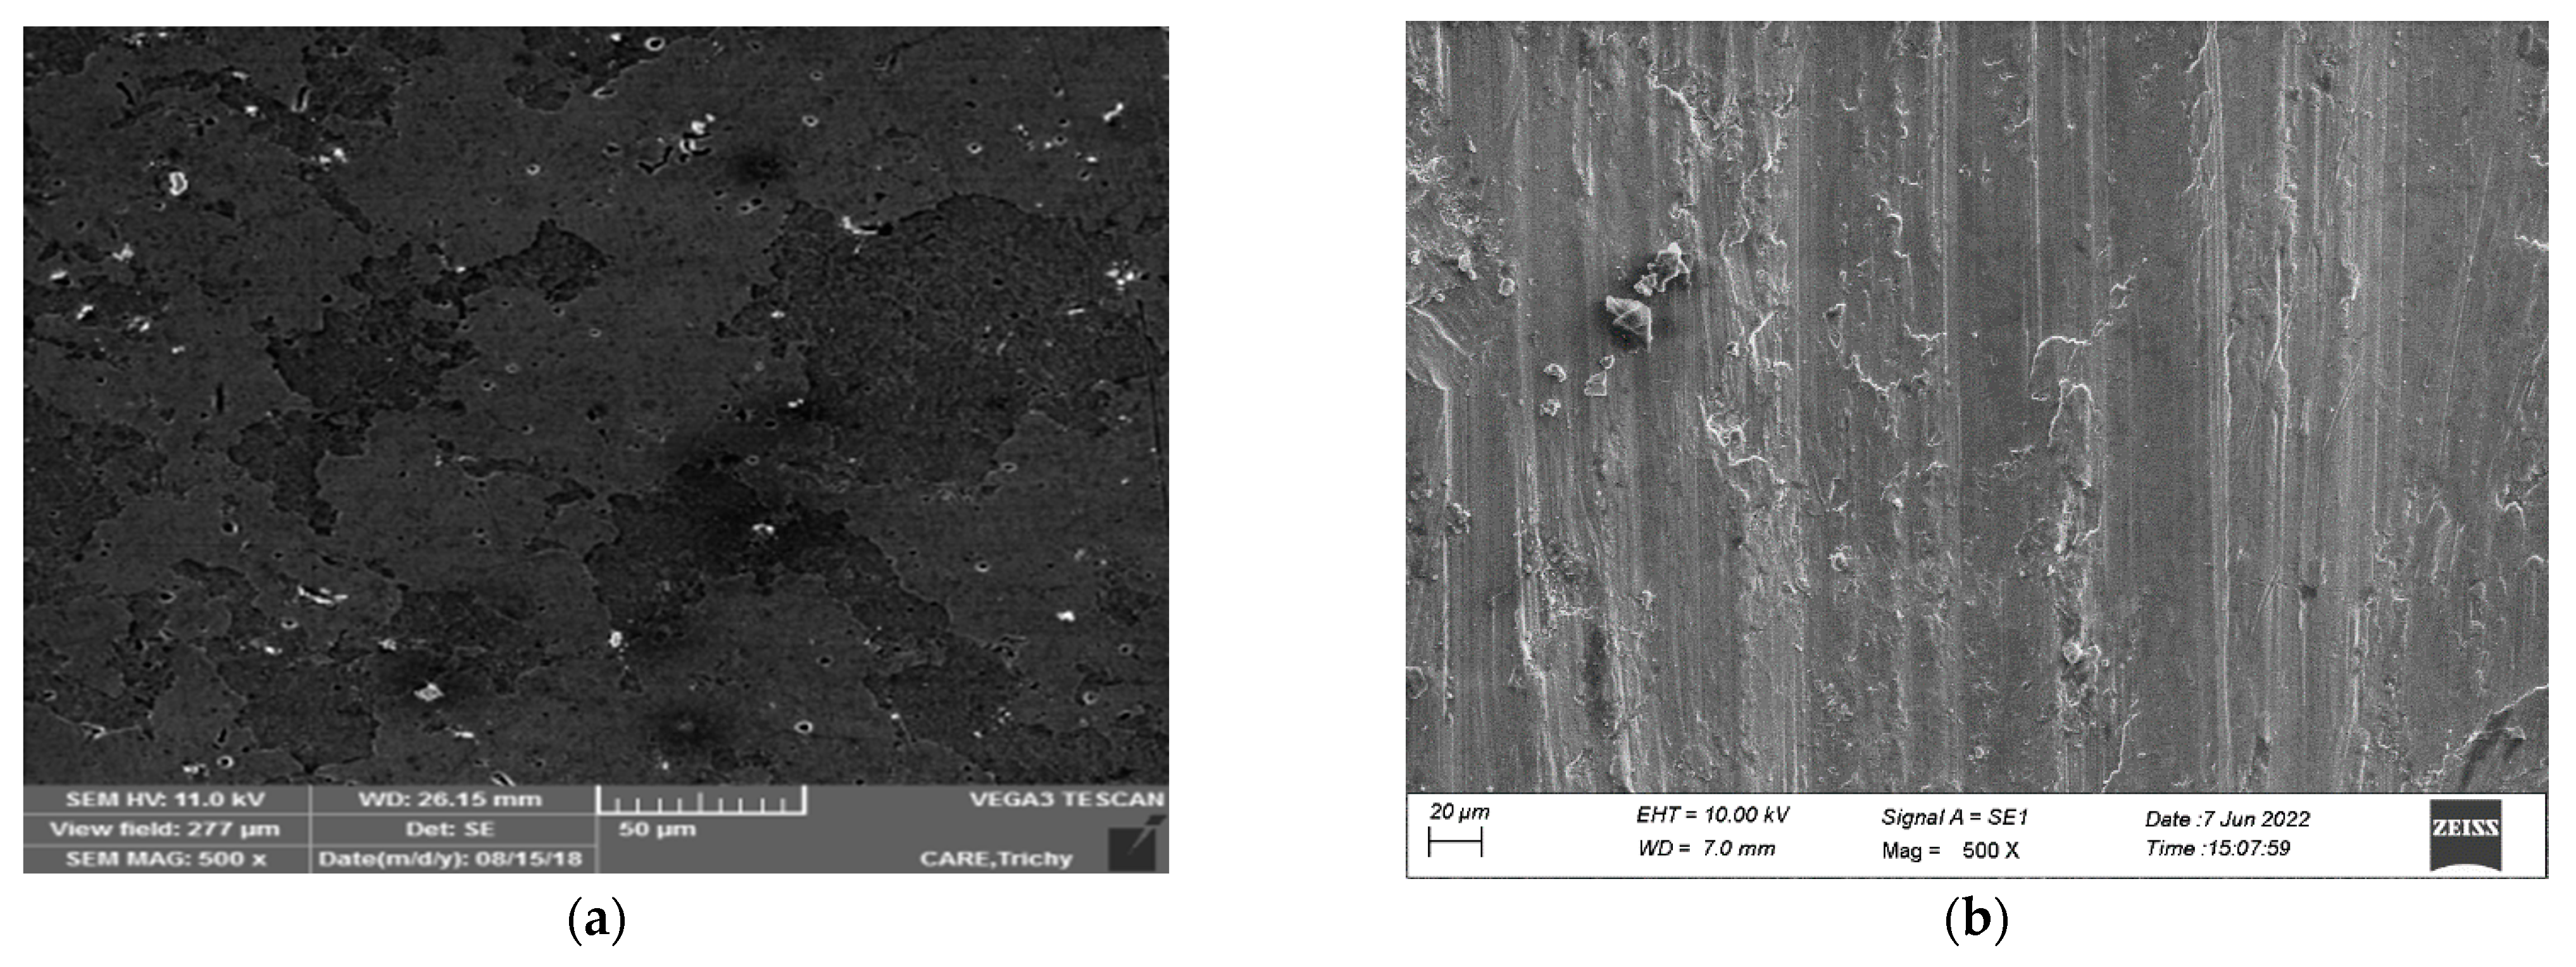
The pure alloy form of AA2014 can be seen in Figure 23a and it indicates that there were no more additives or reinforcements added to it. This was captured before casting; it can be mingled with the Si3N4-cenosphere reinforcements and formed as a hybrid MMC, as shown in Figure 23b [47,48]. Fine grains are recognized from Figure 23b after the casting and machining was done on the MMC specimen. It is exactly suitable for perfect machining outcomes and better roughness properties [48,49].

5. Novelty Statement of this Research

This research offers a comprehensive investigation into both experimental and mechanical facets of electrical discharge machining (EDM), targeting the machining characteristics of AA2014/Si3N4/Mg/cenosphere hybrid composites. The study optimized the process parameters via testing, modelling, and optimization techniques. Key EDM variables—peak current, pulse on time, and pulse off time—were explored for assessing their effects on critical outputs: surface roughness, electrode wear rate (EWR) and material removal rate (MRR). An integrated MATLAB–Mamdani approach modelled the EDM process, incorporating fuzzy logic for the multiobjective optimization. The mechanical behaviour evaluation of AA2014/Si3N4/Mg/cenosphere composites, along with SEM and XRD analyses, underscored promising application prospects. Notably, a grey-fuzzy analysis was introduced to assess machining parameters, enhancing precision.

6. Conclusions

An investigation was conducted on the mechanical behaviour and machining characteristics of AA2014-Si3N4-cenosphere composites prepared with various compositions by a stir-casting process. The prepared samples were investigated to check their mechanical behaviour and machining characteristics, and the following results were obtained:
i.
The uniform distribution of Si3N4, cenosphere, and Mg in the AA2014 was accomplished with a stir-casting process, which was employed for the developed AA2014 composites, and the impact of the machining parameters on the PMEDM characteristics was investigated using a grey-fuzzy approach.
ii.
The tensile strength of the fabricated AA 2014 composites was found to increase with increased reinforcements of Si3N4 and cenosphere, with the maximum elongation occurring at 1.11%, a maximum compression strength of 372.5 N/mm2, and a maximum hardness value of 48HRB.
iii.
The Taguchi analysis depicted the optimal conditions for the surface roughness at a 20 µs Ton, a 20 µs Toff, and a 7 A gap current, for the electrode wear, a 10 µs Ton, a 40 µs Toff, and a 6 A gap current, and finally, for material removal rate, a 30 µs Ton, a 40 µs Toff, and an 8 A gap current.
iv.
The Taguchi based grey analysis summarized the multiple responses into a single grey relational grade, which optimized the machining process. We evaluated the multiple responses using the grey-fuzzy approach with nine available trial readings and reported an improvement when reducing the fuzziness.
v.
SEM images revealed the existence of filler reinforcements within the metal matrix. The SEM micrographs demonstrated that the grain boundaries had a more uniform distribution of reinforcements, leading to an improved microstructure. The SEM images showed that the distribution of Si3N4 and Mg particles were clearly visible as white spots in various regions.
vi.
The XRD analysis of the fabricated composites showed that aluminium was the major component, followed by silicon and magnesium. The SEM analysis was performed on the hybrid metal matrix composites (MMCs) fabricated for this EDM process in order to evaluate the mechanical properties and microstructural details, including bonding. The SEM images showed that the reinforcement structures were tightly packed, and circular ash-coloured spots indicated the presence of silicon and nitrates in the composites. A microstructural analysis showed a fine dispersion of cenosphere reinforcement particles.

Author Contributions

Conceptualization, G.R., M.S., A.B.H.B. and S.S. (Shubham Sharma); methodology, G.R., M.S., A.B.H.B. and S.S. (Shubham Sharma); formal analysis, G.R., M.S., A.B.H.B. and S.S. (Shubham Sharma); investigation, G.R., M.S., A.B.H.B. and S.S. (Shubham Sharma); writing—original draft preparation, G.R., M.S., A.B.H.B. and S.S. (Shubham Sharma); writing—review and editing, S.S. (Shubham Sharma), S.P.D., R.K. and S.S. (Sunpreet Singh); supervision, A.B.H.B., S.S. (Shubham Sharma), S.P.D., R.K. and S.S. (Sunpreet Singh); project administration, S.S. (Shubham Sharma), S.P.D., R.K. and S.S. (Sunpreet Singh). All authors have read and agreed to the published version of the manuscript.

Funding

This research received no external funding.

Institutional Review Board Statement

Not applicable.

Informed Consent Statement

Not applicable.

Data Availability Statement

Not applicable.

Conflicts of Interest

The authors declare no competing interest.

References

  1. Straffelini, G.; Bonollo, F.; Molinari, A.; Tiziani, A. Influence of matrix hardness on the dry sliding behaviour of 20 vol.% Al2O3-particulate-reinforced 6061 Al metal matrix composite. Wear 1997, 211, 192–197. [Google Scholar] [CrossRef]
  2. Yang, G.; Fu, D.; Li, Q.; Liu, Z. A finite element analysis on mechanical behavior of Al/Al-Mg composites for the design of tank cars under actual measuring loads. Eng. Fail. Anal. 2019, 103, 294–307. [Google Scholar] [CrossRef]
  3. Rohatgi, P.K.; Schultz, B.F.; Daoud, A.; Zhang, W.W. Tribological performance of A206 aluminum alloy containing silica sand particles. Tribol. Int. 2010, 43, 455–466. [Google Scholar] [CrossRef]
  4. Shahid, R.N.; Scudino, S. Microstructure and Mechanical Behavior of Al-Mg Composites Synthesized by Reactive Sintering. Metals 2018, 8, 762. [Google Scholar] [CrossRef]
  5. Jiang, J.; Xiao, G.; Che, C.; Wang, Y. Microstructure, mechanical properties and wear behavior of the rheoformed 2024 aluminum matrix composite component reinforced by Al2O3 nanoparticles. Metals 2018, 8, 460. [Google Scholar] [CrossRef]
  6. Bains, P.S.; Sidhu, S.S.; Payal, H.S.; Kaur, S. Magnetic Field Influence on Surface Modifications in Powder Mixed EDM. Silicon 2019, 11, 415–423. [Google Scholar] [CrossRef]
  7. Bédard, F.; Jahazi, M.; Songmene, V. Die-sinking EDM of Al6061-T6: Interactions between process parameters, process performance, and surface characteristics. Int. J. Adv. Manuf. Technol. 2020, 107, 333–342. [Google Scholar] [CrossRef]
  8. Palanivel, R.; Dinaharan, I.; Laubscher, R.F.; Davim, J.P. Influence of boron nitride nanoparticles on microstructure and wear behavior of AA6082/TiB2 hybrid aluminum composites synthesized by friction stir processing. Mater. Des. 2016, 106, 195–204. [Google Scholar] [CrossRef]
  9. Ramanujam, R.; Muthukrishnan, N.; Raju, R. Optimization of cutting parameters for turning Al–SiC (10p) MMC using ANOVA and Grey relational analysis. Int. J. Precision Eng. Manuf. 2011, 12, 651–656. [Google Scholar] [CrossRef]
  10. Rajmohan, T.; Palanikumar, K.; Ranganathan, S. Evaluation of mechanical and wear properties of hybrid aluminium matrix composites. Trans. Nonferrous Met. Soc. China 2013, 23, 2509–2517. [Google Scholar] [CrossRef]
  11. Fenghong, C.; Chang, C.; Zhenyu, W.; Muthuramalingam, T.; Anbuchezhiyan, G. Effects of silicon carbide and tungsten carbide in aluminium metal matrix composites. Silicon 2019, 11, 2625–2632. [Google Scholar] [CrossRef]
  12. Yigezu, B.S.; Mahapatra, M.M.; Jha, P.K. Influence of reinforcement type on microstructure, hardness, and tensile properties of an aluminum alloy metal matrix composite. J. Miner. Mater. Charact. Eng. 2013, 1, 124–130. [Google Scholar] [CrossRef]
  13. Ravikumar, K.; Kiran, K.; Sreebalaji, V.S. Characterization of mechanical properties of aluminium/tungsten carbide composites. Measurement 2017, 102, 142–149. [Google Scholar] [CrossRef]
  14. Sankhla, A.M.; Patel, K.M.; Makhesana, M.A.; Saxena, K.K.; Gupta, N. Experimental Investigation of Tool Wear in Machining of SiC Based Al-MMC. Adv. Mater. Process. Technol. 2021, 8, 635–654. [Google Scholar] [CrossRef]
  15. Anbuchezhiyan, G.; Muthuramalingam, T.; Mohan, B. Effect of process parameters on mechanical properties of hollow glass microsphere reinforced magnesium alloy syntactic foams under vacuum die casting. Arch. Civ. Mech. Eng. 2018, 18, 1645–1650. [Google Scholar] [CrossRef]
  16. Natarajan, N.; Vijayarangan, S.; Rajendran, I. Wear behaviour of A356/25SiCp aluminium matrix composites sliding against automobile friction material. Wear 2006, 261, 812–822. [Google Scholar] [CrossRef]
  17. Liu, L.; Yu, S.; Niu, Y.; Liu, E. Preparation and properties of hollow glass microspheres reinforced Mg alloy degradable composites. J. Alloys Compd. 2020, 835, 155198. [Google Scholar] [CrossRef]
  18. Rajaparthiban, J.; Sait, A.N. Application of the grey based Taguchi method and Deform-3D for optimizing multiple responses in turning of Inconel 718. Mater. Test. 2018, 60, 907–912. [Google Scholar] [CrossRef]
  19. Behnamfard, S.; Mousavian, R.T.; Afkham, Y.; Khosroshahi, R.A.; Nekouee, K.A.; Brabazon, D. Dry Milling of Aluminum and Ceramic Nanoparticles for a Particulate-Injection Casting of Aluminum Matrix Nanocomposites. Silicon 2020, 12, 913–920. [Google Scholar] [CrossRef]
  20. Athul, K.R.; Srinivasan, A.; Pillai, U.T.S. Investigations on the microstructure, mechanical, corrosion and wear properties of Mg–9Al–xGd (0, 0.5, 1, and 2 wt%) alloys. J. Mater. Res. 2017, 32, 3732–3743. [Google Scholar] [CrossRef]
  21. Rajaparthiban, J.; Sait, A.N. Experimental investigation on Machining of Titanium Allo (Ti 6Al 4V) and Optimization of its Parameters using ANN. Mechanika 2018, 24, 449–455. [Google Scholar] [CrossRef]
  22. Jabbaripour, B.; Sadeghi, M.H.; Shabgard, M.R.; Faraji, H. Investigating surface roughness, material removal rate and corrosion resistance in PMEDM of γ-TiAl intermetallics. J. Manuf. Process. 2013, 15, 56–68. [Google Scholar] [CrossRef]
  23. Sahin, I.; Eker, A.A. Analysis of Microstructure and Mechanical Properties of Particle Reinforced AlSi7Mg2 Matrix Composite Materials. J. Mater. Eng. Perform. 2011, 20, 1090–1096. [Google Scholar] [CrossRef]
  24. Wang, M.; Xiao, D.H.; Liu, W.S. Effect of Si addition on microstructure and properties of magnesium alloys with high Al and Zn contents. Vaccum 2017, 141, 144–151. [Google Scholar] [CrossRef]
  25. Chen, J.; Tan, L.; Yu, X.; Yang, K. Effect of minor content of Gd on the mechanical and degradable properties of as-cast Mg-2Zn-xGd-0.5Zr alloys. J. Mater. Sci. Technol. 2019, 35, 503–511. [Google Scholar] [CrossRef]
  26. Slătineanu, L.; Dodun, O.; Coteaţă, M.; Nagîţ, G.; Băncescu, I.B.; Hriţuc, A. Wire Electrical Discharge Machining—A Review. Machines 2020, 8, 69. [Google Scholar] [CrossRef]
  27. Peta, K.; Mendak, M.; Bartkowiak, T. Discharge Energy as a Key Contributing Factor Determining Microgeometry of Aluminum Samples Created by Electrical Discharge Machining. Crystals 2021, 11, 1371. [Google Scholar] [CrossRef]
  28. Lauwers, B.; Vleugels, J.; Malek, O.; Brans, K.; Liu, K. E8-Electrical discharge machining of composites. In Woodhead Publishing Series in Composites Science and Engineering, Machining Technology for Composite Materials; Hocheng, H., Ed.; Woodhead Publishing: Cambridge, UK, 2012; pp. 202–241. ISBN 9780857090300. [Google Scholar] [CrossRef]
  29. Sharma, S.; Sudhakara, P.; Singh, J.; Singh, S.; Singh, G. Emerging progressive developments in the fibrous composites for acoustic applications. J. Manuf. Process. 2023, 102, 443–477. [Google Scholar] [CrossRef]
  30. Sharma, S.; Sudhakara, P.; Petru, M.; Singh, J.; Rajkumar, S. Effect of nano- additives on the novel leather fiber/recycled Poly (Ethylene-vinyl-acetate) polymer composites for multi-functional applications: Fabrication, characterizations, and multi-objective optimization using Central Composite Design. Nanotechnol. Rev. 2022, 11, 2366–2432. [Google Scholar] [CrossRef]
  31. Sharma, S.; Sudhakara, P.; Singh, J.; MR, S.; Siengchin, S. Fabrication of Novel Polymer Composites from Leather Waste Fibers and Recycled Poly(Ethylene-Vinyl-Acetate) for Value-Added Products. Sustainability 2023, 15, 4333. [Google Scholar] [CrossRef]
  32. Karthik, A.; Vijayan, V.; Ahmad, Z.; Rajkumar, S.; Sharma, S.; Sharma, K.P.; Singh, R.; Li, C.; Eldin, S.M. Study on the physicomechanical, fracture-deformation, interface-adhesion, and water-absorption properties of twill fabric cotton-bamboo/epoxy composites. J. Mater. Res. Technol. 2023, 24, 8429–8442. [Google Scholar] [CrossRef]
  33. Jha, K.; Tamrakar, P.; Kumar, R.; Sharma, S.; Singh, J.; Ilyas, R.A.; Rangappa, S.M.; Siengchin, S. Effect of hybridization on physio-mechanical behavior of Vetiver and Jute fibers reinforced epoxy composites for structural applications: Studies on fabrication, physicomechanical, water-absorption, and morphological properties. J. Ind. Text. 2022, 51, 2642S–2664S. [Google Scholar] [CrossRef]
  34. Yadav, V.; Singh, S.; Chaudhary, N.; Garg, M.P.; Sharma, S.; Kumar, A.; Li, C.; Eldin, E.M.T. Dry sliding wear characteristics of natural fibre reinforced poly-lactic acid composites for engineering applications: Fabrication, properties and characterizations. J. Mater. Res. Technol. 2023, 23, 1189–1203. [Google Scholar] [CrossRef]
  35. Muni, R.N.; Singh, J.; Kumar, V.; Sharma, S.; Sudhakara, P.; Aggarwal, V.; Rajkumar, S. Multiobjective Optimization of EDM Parameters for Rice Husk Ash/Cu/Mg-Reinforced Hybrid Al-0.7Fe-0.6Si-0.375Cr-0.25Zn Metal Matrix Nanocomposites for Engineering Applications: Fabrication and Morphological Analysis. J. Nanomater. 2022, 2022, 2188705. [Google Scholar] [CrossRef]
  36. Kumar, R.; Jha, K.; Sharma, S.; Kumar, V.; Li, C.; Eldin, E.M.T.; Rajkumar, S.; Królczyk, G. Effect of particle size and weight fraction of SiC on the mechanical, tribological, morphological, and structural properties of Al-5.6Zn-2.2Mg-1.3Cu composites using RSM: Fabrication, characterization, and modelling. Heliyon 2022, 8, e10602. [Google Scholar] [CrossRef] [PubMed]
  37. Dwivedi, S.P.; Pachauri, P.; Maurya, M.; Saxena, A.; Butola, R.; Sahu, R.; Sharma, S. Alumina catalyst waste utilization for aluminum-based composites using the friction stir process. Mater. Test. 2022, 64, 533–540. [Google Scholar] [CrossRef]
  38. Dwivedi, S.P.; Sharma, S.; Krishna, B.V.; Sonia, P.; Saxena, K.K.; Iqbal, A.; Djavanroodi, F. Effect of the addition of TiB2 with waste glass powder on microstructure, mechanical and physical behavior of PET-based polymer composite material. Mechanics of Advanced Materials and Structures 2023, 1–10. [Google Scholar] [CrossRef]
  39. Sharma, S.; Patyal, V.; Sudhakara, P.; Singh, J.; Petru, M.; Ilyas, R.A. Mechanical, morphological, and fracture-deformation behavior of MWCNTs-reinforced (Al–Cu–Mg–T351) alloy cast nanocomposites fabricated by optimized mechanical milling and powder metallurgy techniques. Nanotechnol. Rev. 2021, 11, 65–85. [Google Scholar] [CrossRef]
  40. Sharma, S.; Singh, J.; Gupta, M.K.; Mia, M.; Dwivedi, S.P.; Saxena, A.; Chattopadhyaya, S.; Singh, R.; Pimenov, D.Y.; Korkmaz, M.E. Investigation on mechanical, tribological and microstructural properties of Al–Mg–Si–T6/SiC/muscovite-hybrid metal-matrix composites for high strength applications. J. Mater. Res. Technol. 2021, 12, 1564–1581. [Google Scholar] [CrossRef]
  41. Dwivedi, S.P.; Agrawal, R.; Sharma, S. Effect of Friction Stir Process Parameters on Mechanical Properties of Chrome Containing Leather Waste Reinforced Aluminium Based Composite. Int. J. Precis. Eng. Manuf. Technol. 2021, 8, 935–943. [Google Scholar] [CrossRef]
  42. Kumar, J.; Singh, D.; Kalsi, N.S.; Sharma, S.; Pruncu, C.I.; Pimenov, D.Y.; Rao, K.V.; Kapłonek, W. Comparative study on the mechanical, tribological, morphological and structural properties of vortex casting processed, Al–SiC–Cr hybrid metal matrix composites for high strength wear-resistant applications: Fabrication and characterizations. J. Mater. Res. Technol. 2020, 9, 13607–13615. [Google Scholar] [CrossRef]
  43. Kumar, J.; Singh, D.; Kalsi, N.S.; Sharma, S.; Mia, M.; Singh, J.; Rahman, M.A.; Khan, A.M.; Rao, K.V. Investigation on the mechanical, tribological, morphological and machinability behavior of stir-casted Al/SiC/Mo reinforced MMCs. J. Mater. Res. Technol. 2021, 12, 930–946. [Google Scholar] [CrossRef]
  44. Kumar, J.; Sharma, S.; Singh, J.; Singh, S.; Singh, G. Optimization of Wire-EDM Process Parameters for Al-Mg-0.6Si-0.35Fe/15%RHA/5%Cu Hybrid Metal Matrix Composite Using TOPSIS: Processing and Characterizations. J. Manuf. Mater. Process. 2022, 6, 150. [Google Scholar] [CrossRef]
  45. Miniappan, P.K.; Marimuthu, S.; Kumar, S.D.; Sharma, S.; Kumar, A.; Salah, B.; Ullah, S.S. Exploring the mechanical, tribological, and morphological characteristics of areca fiber epoxy composites reinforced with various fillers for multifaceted applications. Front. Mater. 2023, 10, 1185215. [Google Scholar] [CrossRef]
  46. Dwivedi, S.P.; Sharma, S.; Sunil, B.; Gupta, N.; Saxena, K.K.; Eldin, S.M.; Shahab, S.; Alkhafaji, M.A.; Abdullaev, S.S. Heat treatment behavior of Cr in the form of collagen powder and Al2O3 reinforced aluminum-based composite material. J. Mater. Res. Technol. 2023, 25, 3847–3864. [Google Scholar] [CrossRef]
  47. Dwivedi, S.P.; Saxena, A.; Haider, I.; Sharma, S. Effect of zirconium diboride addition in zirconium dioxide reinforced aluminum-based composite fabricated by microwave sintering technique. Proc. Inst. Mech. Eng. Part E J. Process Mech. Eng. 2023, 0, 1–22. [Google Scholar] [CrossRef]
  48. Dwivedi, S.P.; Sharma, S. Recovery of Al2O3/Al powder from aluminum dross to utilize as reinforcement along with graphene in the synthesis of aluminum-based composite. Part. Sci. Technol. 2023, 1–13. [Google Scholar] [CrossRef]
  49. Garg, H.K.; Sharma, S.; Kumar, R.; Manna, A.; Li, C.; Mausam, K.; Eldin, E.M.T. Multi-objective parametric optimization on the EDM machining of hybrid SiCp/Grp/aluminum nanocomposites using Non-dominating Sorting Genetic Algorithm (NSGA-II): Fabrication and microstructural characterizations. Rev. Adv. Mater. Sci. 2022, 61, 931–953. [Google Scholar] [CrossRef]
Figure 1. (a) Raw Al2014 alloy materials (b) Stir-casting arrangement. (c) Prepared composite specimens by the stir-casting setup.
Jcs 07 00380 g001
Figure 2. (a) Measurement of the tensile specimen. (b) Actual tensile specimens.
Jcs 07 00380 g002
Figure 3. (a) Measurement of the compression specimen (b) Actual specimens.
Jcs 07 00380 g003
Figure 4. Actual specimens for Hardness test.
Jcs 07 00380 g004
Figure 5. Al 93.5% + Si3N4 2.5% + cenosphere 3% + Mg 1%.
Jcs 07 00380 g005
Figure 6. Al 89% + Si3N4 5% + cenosphere 5% + Mg 1%.
Jcs 07 00380 g006
Figure 7. Al 84.5% + Si3N4 7.5% + cenosphere 7% + Mg 1%.
Jcs 07 00380 g007
Figure 8. Main effect plots for surface roughness (μm).
Jcs 07 00380 g008
Figure 9. Main effect plots for electrode wear (gms/min).
Jcs 07 00380 g009
Figure 10. Main effect plots for MRR (gms/min).
Jcs 07 00380 g010
Figure 11. (ac) Detailed interaction plots for various responses.
Jcs 07 00380 g011
Figure 12. Fuzzy inference systems.
Jcs 07 00380 g012
Figure 13. Fuzzy inferences for input and output variables.
Jcs 07 00380 g013
Figure 14. Triangular membership function.
Jcs 07 00380 g014
Figure 15. Rule editor in fuzzy inference.
Jcs 07 00380 g015
Figure 16. Rule viewer for a fuzzy system.
Jcs 07 00380 g016
Figure 17. Surface plots for various inputs and GRG.
Jcs 07 00380 g017
Figure 18. (a). SEM of the AA2014-Si3N4 composites, and (b). EDAX elemental analysis of reinforcements in the AA2014-Si3N4-cenosphere hybrid composites.
Jcs 07 00380 g018
Figure 19. (a) Scanning electron microscope arrangement; (b,e) pure Al2014-R1 alloy SEM images of particle spreading of Si3N4 and cenosphere; (c) 450× magnification with 280 μm; (d,f) 290× magnification with 490 μm; (g) 1000× magnification with 100 μm.
Jcs 07 00380 g019
Figure 20. XRD analysis of the prepared composite.
Jcs 07 00380 g020
Figure 21. (a) Ratio 1. The SEM micrographs show the incorporation of filler reinforcements inside the metal matrix. (b) Ratio 2. Grain boundaries indicate a more even distribution of reinforcements in the matrix with an enhanced microstructure. (c) Ratio 3. Sample 3 shows the distributions of AA2014 that were analysed and the Si3 N4 particles found to be uniformly distributed.
Jcs 07 00380 g021
Figure 22. SEM microstructures of the best 2 composite samples of AA2014-Si3N4-cenosphere.
Jcs 07 00380 g022
Figure 23. SEM Micrographs of (a) pure AA2014 before performing mechanical and corrosion testing, (b) after performing mechanical and corrosion testing on machined surfaces of AA2014-Si3N4-cenosphere composite.
Jcs 07 00380 g023
Table 1. Chemical ranges of Al-Cu alloy.
ComponentAlCrCuFeMgMnSiTiZnOther
% wt.90.4Max 0.13.9Max 0.70.81.21.2Max 0.15Max 0.25Max 0.15
Table 2. Chemical ranges of Si3N4.
Purityα PhaseNOSiImpurities
99.9%90>38.51.50.20.1
Table 3. Chemical composition of the cenosphere.
ComponentsSiO2Al2O3FeOTitania
% of Wt.55–6525–351–50.5–1
Table 4. Ingredients of the newly developed composites.
SamplesAA2014 (%)Si3N4 (%)Cenosphere (%)Mg (%)
Sample 193.52.531
Sample 291.52.551
Sample 389.52.571
Sample 491531
Sample 589551
Sample 687571
Sample 788.57.531
Sample 886.57.551
Sample 984.57.571
Table 5. Weight percentage of reinforcement.
SamplesAl (2014) in gmsSi3N4 (%)CenosphereMg (%)
R1100000
R293.52.531
R389551
R484.57.571
Table 6. Test report of the tensile strength of representative hybrid composite samples.
IdentificationDia. (mm)Cross-Sectional
Area
(mm2)
Tensile
Load
(kN)
Tensile
Strength
(N/mm2)
Initial
Gauge
Length
(mm)
Final
Gauge
Length
(mm)
Percentage
Elongation
1.16201.0621.37106.3473.273.20.0
2.16201.0622.50111.9673.274.01.09
3.16201.0624.74123.1173.274.01.11
4.16201.0621.39106.4473.273.50.41
Table 7. Test report on the compression strength of representative hybrid composite samples.
IdentificationDia.
(mm)
Cross-Sectional
Area (mm2)
Compressive
Load (kN)
Compressive
Strength (N/mm2)
Sample 116201.0661.7306.9
Sample 216201.0670.2349.2
Sample 316201.0671.5355.6
Sample 416201.0674.9372.5
Table 8. Test reports of hardness for representative hybrid composite samples.
IdentificationHardness (HRB)
Specimen 134
Specimen 237
Specimen 348
Specimen 442
Table 9. Experimental parameter specifications of EDM machining.
S. No.FactorsSpecifications
1Work materialAA2014-Si3N4-cenosphere + Mg
2Electrode6 mm diameter copper (Cu)
3PolarityNormal (Positive)
4Cutting time10 min
5Dielectric fluidKerosene mixed with Al powder
6Al powder size27 microns
7Duty factor75%
8Pon65 μs
Table 10. Input factors and their levels.
LevelTON (µs)TOFF (µs)Gap Current (Amps)
110206
220307
330408
Table 11. Experimental results for various responses.
TON
(µs)
TOFF
(µs)
Gap Current (A)Surface Roughness (µm)Electrode Wear
(gms)
MRR
(gms/min)
102060.3330.2621.744
103070.4270.2933.899
104080.6850.4616.888
202070.3450.2754.243
203080.4920.7386.272
204060.5630.3113.583
302080.4420.8995.243
303060.4660.2663.311
304070.5010.4036.669
Table 12. Calculated S/N values for the surface roughness, electrode wear, and MRR.
Surface Roughness (µs)Electrode Wear (gms)MRR
(gms/min)
S/N Values of Surface RoughnessS/N Values of
Electrode Wear
S/N Values of
MRR
0.3330.2621.7449.55111.6344.831
0.4270.2933.8997.39110.66311.819
0.6850.4616.8883.2866.72616.762
0.3450.2754.2439.24411.21312.554
0.4920.7386.2726.1612.63915.948
0.5630.3113.5834.99010.14511.085
0.4420.8995.2437.0920.92514.392
0.4660.2663.3116.63211.50210.399
0.5010.4036.6696.0037.89416.481
Table 13. Grey relational analyses grades and rankings.
TrialsNormalized SequenceGRCGRGRank
Surface RoughnessElectrode WearMRRRaEWRMRR
10.0000.0000.0001.0001.0001.0001.0001
20.3450.0910.5860.5920.8460.4610.6334
31.0000.4581.0000.3330.5220.3330.3969
40.0490.0390.6470.9110.9270.4360.7582
50.5410.8400.9320.4800.3730.3490.4018
60.7280.1390.5240.4070.7820.4880.5595
70.3931.0000.8010.5600.3330.3840.4267
80.4660.0120.4670.5180.9760.5170.6703
90.5660.3490.9760.4690.5890.3390.4656
Table 14. Ranges of subsets for FRG.
Sl. NoRange of ValuesConditionMembership Function
1(−0.2500.25)Very low

Triangular function
2(00.250.50)Low
3(0.250.50.75)Medium
4(0.50.751)High
5(0.7511.25)Very high
Table 15. Comparison of GRG and GFRG.
Sl. No.GRGGFRGOrder
11.0000.9261
20.6330.6784
30.3960.4229
40.7580.7822
50.4010.4598
60.5590.5155
70.4260.4827
80.6700.6923
90.4650.5026
Disclaimer/Publisher’s Note: The statements, opinions and data contained in all publications are solely those of the individual author(s) and contributor(s) and not of MDPI and/or the editor(s). MDPI and/or the editor(s) disclaim responsibility for any injury to people or property resulting from any ideas, methods, instructions or products referred to in the content.