Article

Carbonization of Zr-Loaded Thiourea-Functionalized Styrene-Divinylbenzene Copolymers: An Easy Way to Synthesize Nano-ZrO2@C and Nano-(ZrC, ZrO2)@C Composites

1
Institute of Materials and Environmental Chemistry, Research Centre for Natural Sciences, Hungarian Academy of Sciences, Magyar Tudósok krt. 2, H-1117 Budapest, Hungary
2
Department of Physical Chemistry and Materials Science, Budapest University of Technology and Economics, Műegyetem rakpart 3, H-1111 Budapest, Hungary
3
Department of Organic Chemistry and Technology, Budapest University of Technology and Economics, Műegyetem rakpart 3, H-1111 Budapest, Hungary
4
Deuton-X Ltd., Selmeci u. 89, H-2030 Érd, Hungary
*
Author to whom correspondence should be addressed.
J. Compos. Sci. 2023, 7(8), 306; https://doi.org/10.3390/jcs7080306
Submission received: 28 June 2023 / Revised: 20 July 2023 / Accepted: 24 July 2023 / Published: 26 July 2023
(This article belongs to the Section Carbon Composites)

Abstract

:
Thermal processing of Zr-loaded ion-exchangers is a facile route to synthetize (ZrO2, ZrC)@C composites. In the present paper, furnace and RF-thermal plasma processing of ZrOCl2 loaded thiourea-functionalized styrene-divinylbenzene copolymer was investigated and led to composites containing ZrO2 and ZrC. Different ZrO2@C composites were formed between 1000 and 1400 °C in 2 h, whereas the composite containing ZrC was created at 1400 °C in 8 h. The ratio of ZrO2/ZrC, the prevailing ZrO2 modifications, and the crystallite sizes strongly depend on the synthesis conditions. The ZrC-containing composites formed only at 1400 °C in 8 h and by the plasma treatment of the ZrO2@C sample prepared in the furnace, resulting in 8 and 16% ZrC content, with 44 and 41 nm ZrC crystallite sizes, respectively. The ZrO2-containing composites (tetragonal, monoclinic, and cubic modifications with 65–88 nm ZrO2 crystallite sizes and 15–43 m2/g BET surface areas) formed in a tube furnace between 1000 and 1400 °C in 2 h. All ZrO2@C composites had both amorphous carbon and graphite, and their ratio is temperature dependent. The carbonaceous compounds were characterized by Raman spectroscopy with analysis of the G and D band intensities. XPS studies showed the surface oxidation of ZrC.

Graphical Abstract

1. Introduction

Radiolytically stable amorphous carbon and graphite composites containing ZrC and ZrO2 have enormous strategic importance in the nuclear industry owing to their advantages such as high mechanical strength, a high adsorption capacity towards fission products, and a large neutron absorption cross-section [1,2,3,4]. A recently developed method to synthesize carbon composites containing metal oxides is based on the carbonization of ion exchangers with various functional groups (sulfonate, iminodiacetate) [5,6]. Some metals like titanium or zirconium form carbides at higher temperatures or during plasma treatment [7,8,9]. ZrC@C or (ZrC, ZrO2)@C composites were prepared from Zr-loaded sulfonate-, iminodiacetate-, or dimethylamine-functionalized ion-exchanger resins loaded with cationic, complexed, or anionic Zr-species, respectively. The functional groups strongly influence carbide formation despite the loss of the functional groups below 500 °C owing to differences in the reactivity of the intermediates that formed from the various functionalized polymers [5,6,10,11]. The sulfonate-, iminodiacetate-, and dimethylamine-functionalized ion exchangers have S and O, N and O, and only N heteroatom-containing functional groups bound to zirconium. Therefore, in the present paper, we tested an ion exchanger with an S, N-type active group—thiourea linked through a methylene group to the styrene-divinylbenzene skeleton—as a precursor of carbon composites containing ZrO2 and (ZrO2, ZrC). We studied the formation of (nano-ZrC, nano-ZrO2)@C composites in a high-temperature tube furnace from Zr-loaded thiourea-functionalized resin. The distribution of zirconium in the functional groups is homogeneous at the atomic level which promises to enhance the uniformity of the distribution of ZrO2 and ZrC in the carbon matrix. The properties and composition of nano-(ZrCx, ZrO2)@C composites prepared in a tube furnace at 1400 °C for 8 h and the samples made by post-RF plasma treatment in a He atmosphere were characterized in detail.

2. Materials and Methods

The thiourea-functionalized resin (Resinex CH-80-L) and other chemicals (HCl, zirconyl chloride, and other analytical reagents) were supplied by Deuton-X Ltd., Érd, Hungary.

2.1. Experimental

2.1.1. Preparation of Zr-Loaded Samples

The thiourea-functionalized styrene-divinylbenzene copolymer containing 2% divinylbenzene (DVB) was soaked in 3 M aq. HCl for 24 h, then the swelled beads were transferred into a long (20 cm) glass column. The Zr loading process was performed with a zirconyl chloride solution containing 0.5 wt.% Zr in 3 M HCl [5]. The Zr-loaded sample was dried at 90 and 110 °C in air for 3 and 2 h, respectively. The dry beads were left to cool in a sealed desiccator containing freshly prepared calcium oxide.

2.1.2. Elemental Analysis

The CHNS analysis of the Zr-loaded sample was performed using a Carlo Erba 1106 (Cormaredo, Italy) instrument. The sample was dried in a vacuum oven at 140 °C for 19 h, and the dry sample was stored in a glass vial filled with nitrogen and tightly capped. Zr content was measured with the ICP-OES method [12].

2.1.3. Carbonization Experiments

The Zr-loaded sample was ground in a planetary ball mill (225 rpm, 30 min), reducing the particle size below 63 µm. In each experiment, 1.5 g of the sample was placed into a quartz boat. Pyrolysis (carbonization) was performed in a tubular furnace supplied with an alumina tube under an argon atmosphere at 1000, 1200, and 1400 °C for 2 h and 1400 °C for 8 h. The heating rate was 15 °C min−1 and the volume flow rate of the argon gas (1.5 L·min−1) was kept constant during the experiments. The sample labeling contains the carbonization temperature and time, e.g., T(°C)/t(h), mean the treatment temperature in °C and the treatment time in hours. The label P means plasma post-treatment and specifies the atmosphere (Ar-He).

2.1.4. RF Thermal Plasma Processing

Because of the 20.3 wt.% of residual water content in the Zr-loaded resins (Table S1) and the shortness of residence time of the resin beads in the plasma plume, direct carbonization cannot produce carbonized samples. Therefore, the sample carbonized preliminarily at 1000 °C for 2 h, which contained only ZrO2 and elemental carbon, was subjected to in-flight RF thermal plasma treatment in a helium or hydrogen atmosphere. The experimental setup [13,14,15] consisted of a reactor chamber, which was supplied with an RF inductively coupled plasma torch mounted on the top (type PL-35, TEKNA Ltd., Sherbrooke, QC, Canada), an RF generator (LEPEL, Waukesha, WI, USA, with a maximum power of 30 kW at 4–5 MHz), a cyclone, a filter unit, and a vacuum pump [5]. Each sample was delivered into the plasma as described in Martiz et al. [5] with the use of a Praxair feeder (He as a carrier gas, with a flow rate of 5 L·min−1) at a feeding rate of 3 g·min−1. The location of the feeding probe was coaxial in the middle of the induction coil, and the plasma gas and the sheath gas were an 11:6 and a 35:5 L·min−1 mixture of Ar and He, respectively. The main operating conditions (70 kPa and 25 kW of power) for each test were adapted from [15].

2.1.5. Specific Surface Area Measurements

The surface area of the carbonized samples was determined with the Brunauer-Emmett-Teller (BET) equation based on nitrogen adsorption data (collected at −196 °C, Autosorb 1C, Quantachrome, Boynton Beach, FL, USA). The samples were evacuated before measurements at 100 °C for 24 h.

2.1.6. Transmission Electron Microscopy

Transmission Electron Microscopy (TEM) was carried out with a 200 keV (Talos Thermo Scientific, Waltham, MA, USA) electron microscope. The carbonized grains were crushed in EtOH and deposited onto the surface of Cu grids covered by Lacey carbon [5]. Selected-area electron diffraction patterns (SAED) were obtained. The current in TEM mode was ~600 pA and the SAED patterns were acquired using a camera length of 520 mm [13].

2.1.7. Thermal Studies

Thermogravimetric analysis, differential scanning calorimetry, and mass spectrometric evolved gas analysis were performed simultaneously with the use of the SETARAM Labsys Evo (Lyon, France) and the Pfeiffer Vacuum OmniStar (Asslar, Germany) instruments under a He atmosphere (heating rate 20 °C/min, 25–1000 °C). The details of the thermal analysis were given in [5,6].

2.1.8. Powder X-ray Diffraction

The powder XRD patterns were acquired with the use of Bragg-Brentano parafocusing goniometer (Philips, Amsterdam, The Netherland) Cu weighted Kα radiation 1.5406/1.5444 Å) in the 2θ range of 4–70° (step size 0.02°, 1 s interval time). Despite the known unit cell dimensions of the ZrC and ZrO2 phases, the composition of phases must be considered an estimate rather than accurate owing to the amorphous carbon content and problems in determining the background. Therefore, a correction with the use of the amorphous carbon/graphite ratio was used (from the Raman data) in our estimations. The ratio of crystalline phases was estimated with XRD as given in [5,6]. The size of ZrO2 and ZrC crystallites were determined by the Scherrer method.

2.1.9. Vibrational Spectroscopy

The IR and far-IR spectra were collected from 16 scans and acquired with a resolution of 4 cm−1 on a Bruker Alpha FT-IR (Bruker, Ettingen, Germany) and a Biorad-Digilab FTS-30 instrument (Biorad, Budapest, Hungary), respectively, in Attenuated Total Reflectance (ATR) mode [16,17,18]. The Raman spectra were recorded with the use of a Horiba Jobin–Yvon LabRAM micro-spectrometer (Horiba France SAS, Longjumeau, France, external Nd-YAG laser, 532 nm, 40 mW) focusing the laser beam on an objective (20X, numerical aperture = 0.4) with the use of D0.3 or D0.6 optical filters to reduce the intensity of the laser beam (20 mW and 10 mW, respectively) to avoid degradation. A grating monochromator (1800 mm−1 for light dispersion) and 1000 µm of the confocal hole were attached. The wavenumber scanning resolution was 3 cm−1, and the accumulation time was 90–120 s per point for the spectral range (3400–200 cm−1).

2.1.10. X-ray Photoelectron Spectroscopy

The XPS (X-ray photoelectron) spectra were recorded with a Kratos XSAM 800 instrument (Manchester, UK) in fixed analyzer transmission mode. Pass energy of 40 eV, Mg Kα1,2 (1253.6 eV) excitation, and <1 × 10⁻⁷ Pa chamber pressure were applied. Survey spectra were recorded in the 100–1300 eV kinetic energy range. The linearity of the BE scale was checked using silver. The graphitic carbon line located at 284.5 eV was used for the BE calibration of the spectra [19]. The high-resolution spectra of the main photoelectron lines of Zr, O, and C were recorded with 0.1 eV steps and a dwell time of 1 s. The quantitative analysis after removing the Shirley background was performed with the XPS MultiQuant program using experimentally determined cross-section data and asymmetry parameters [20,21].

3. Results

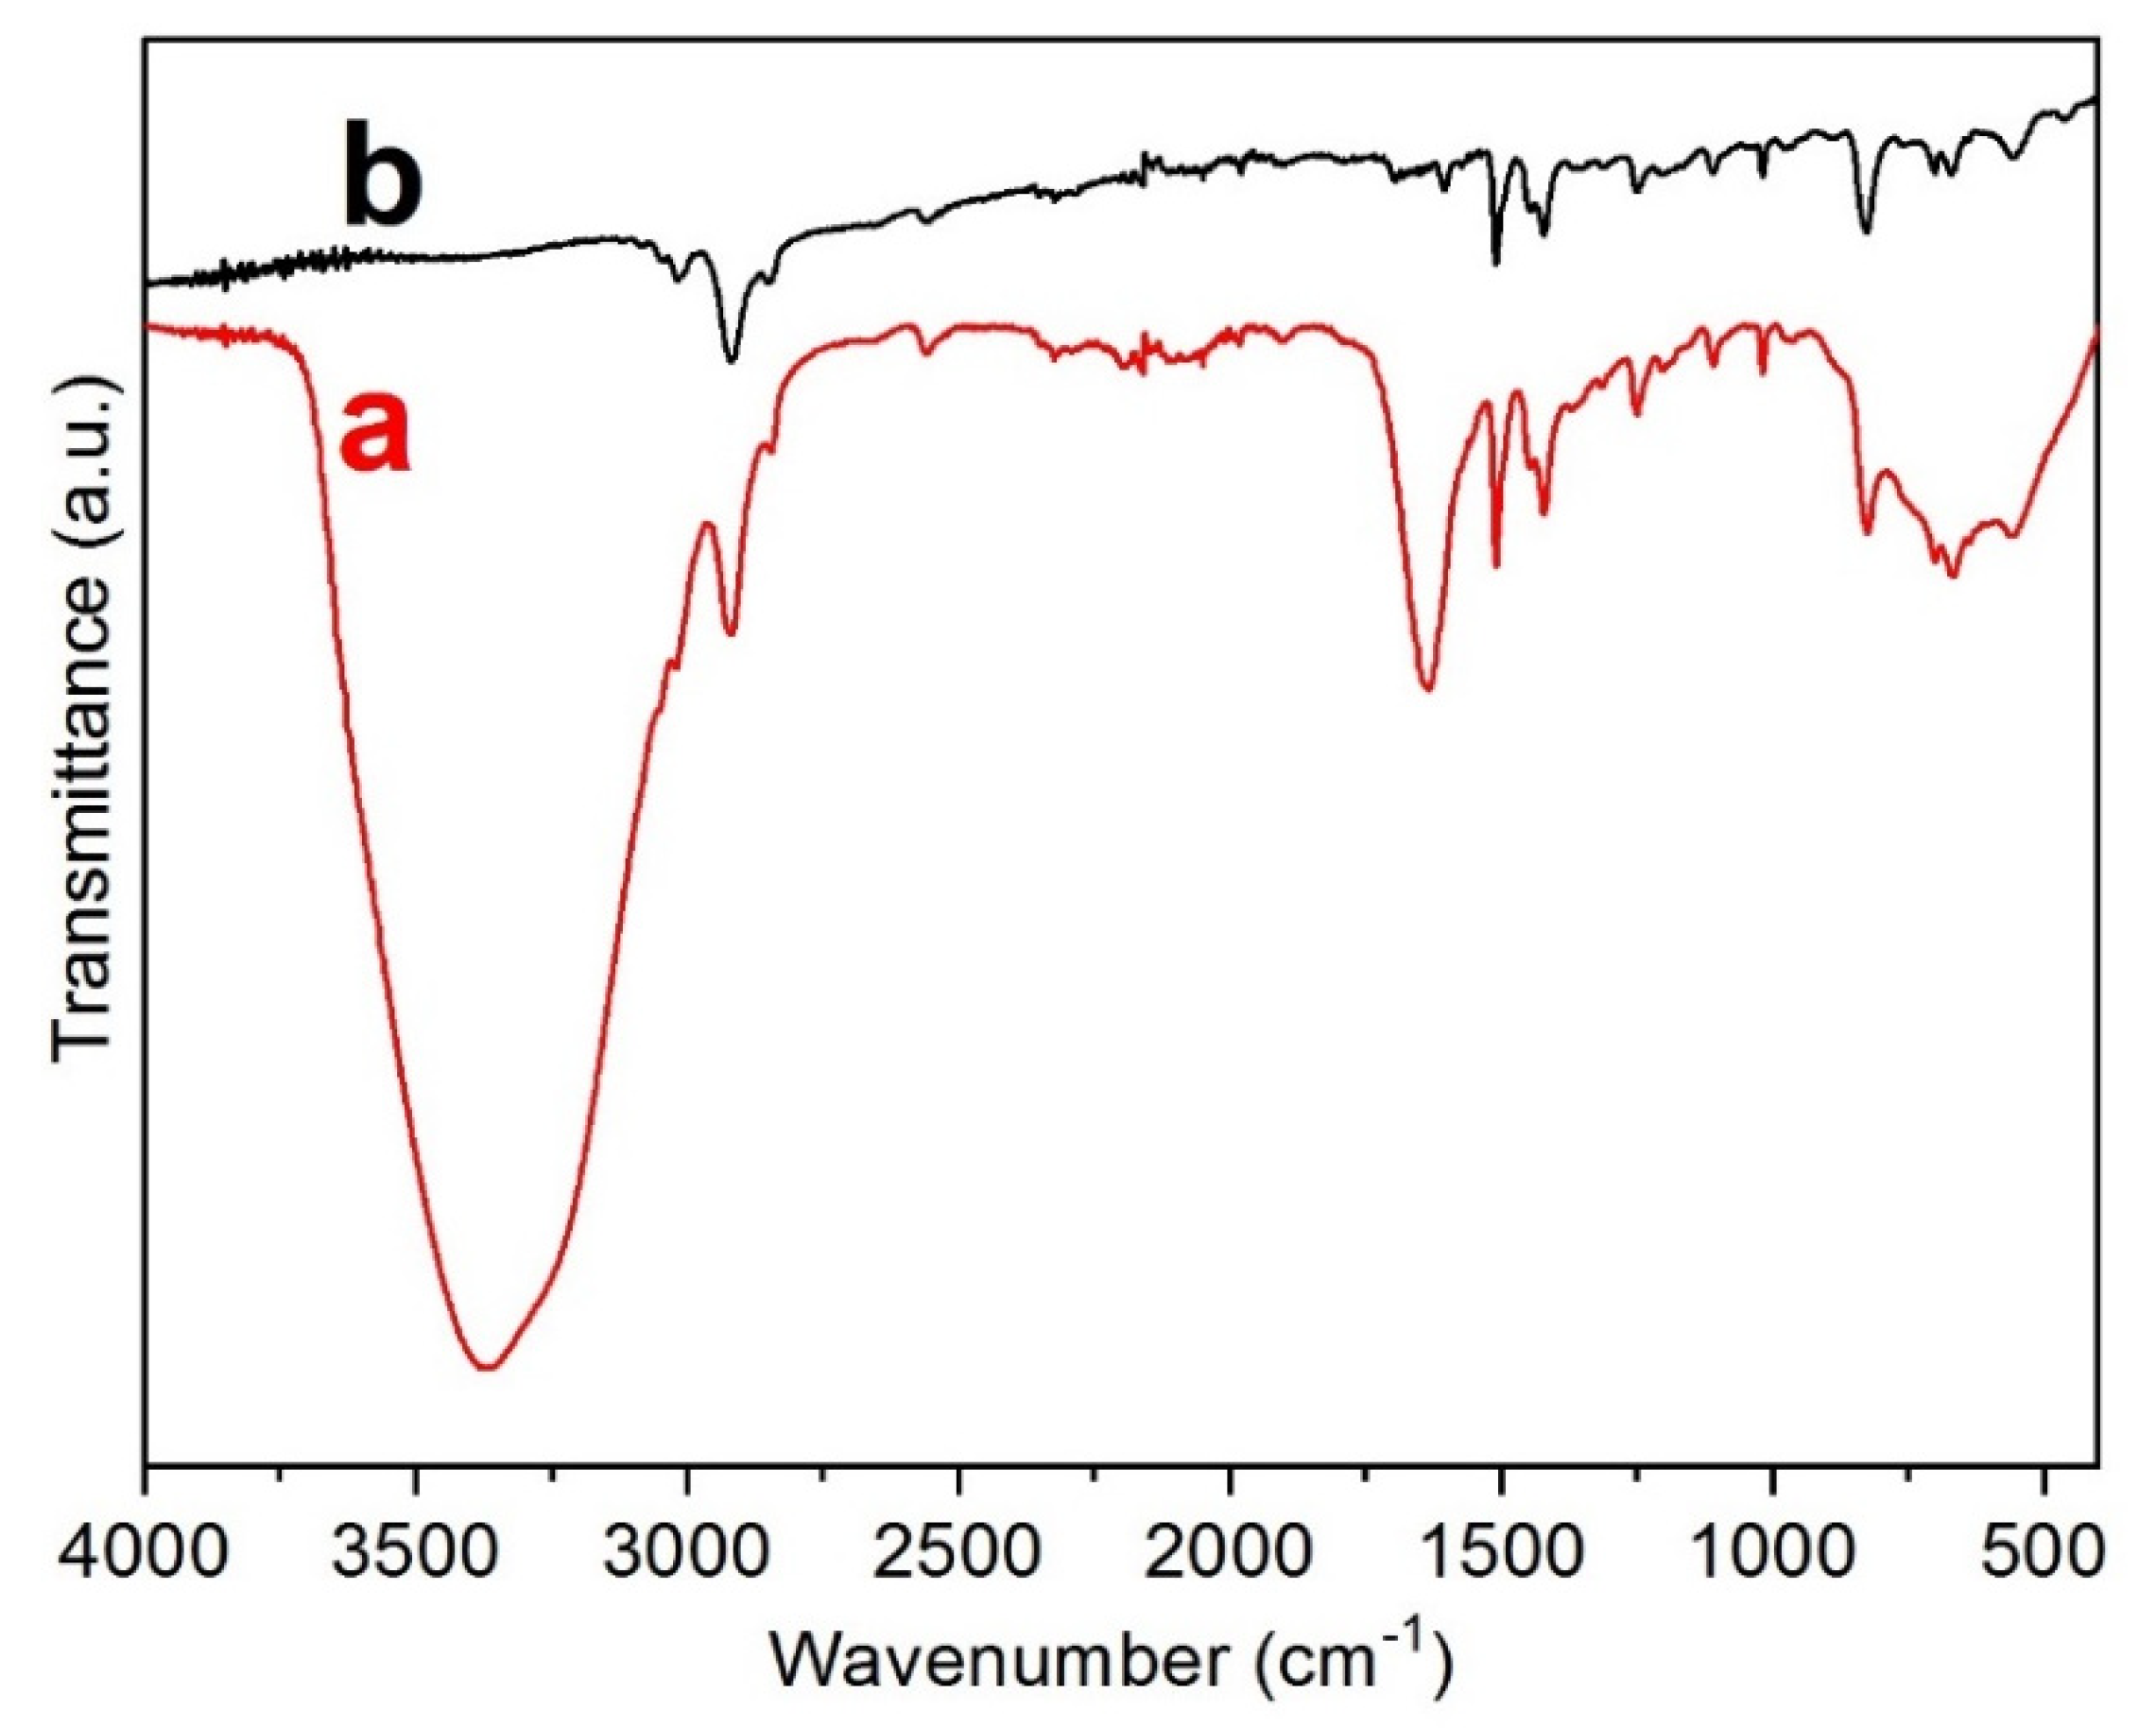
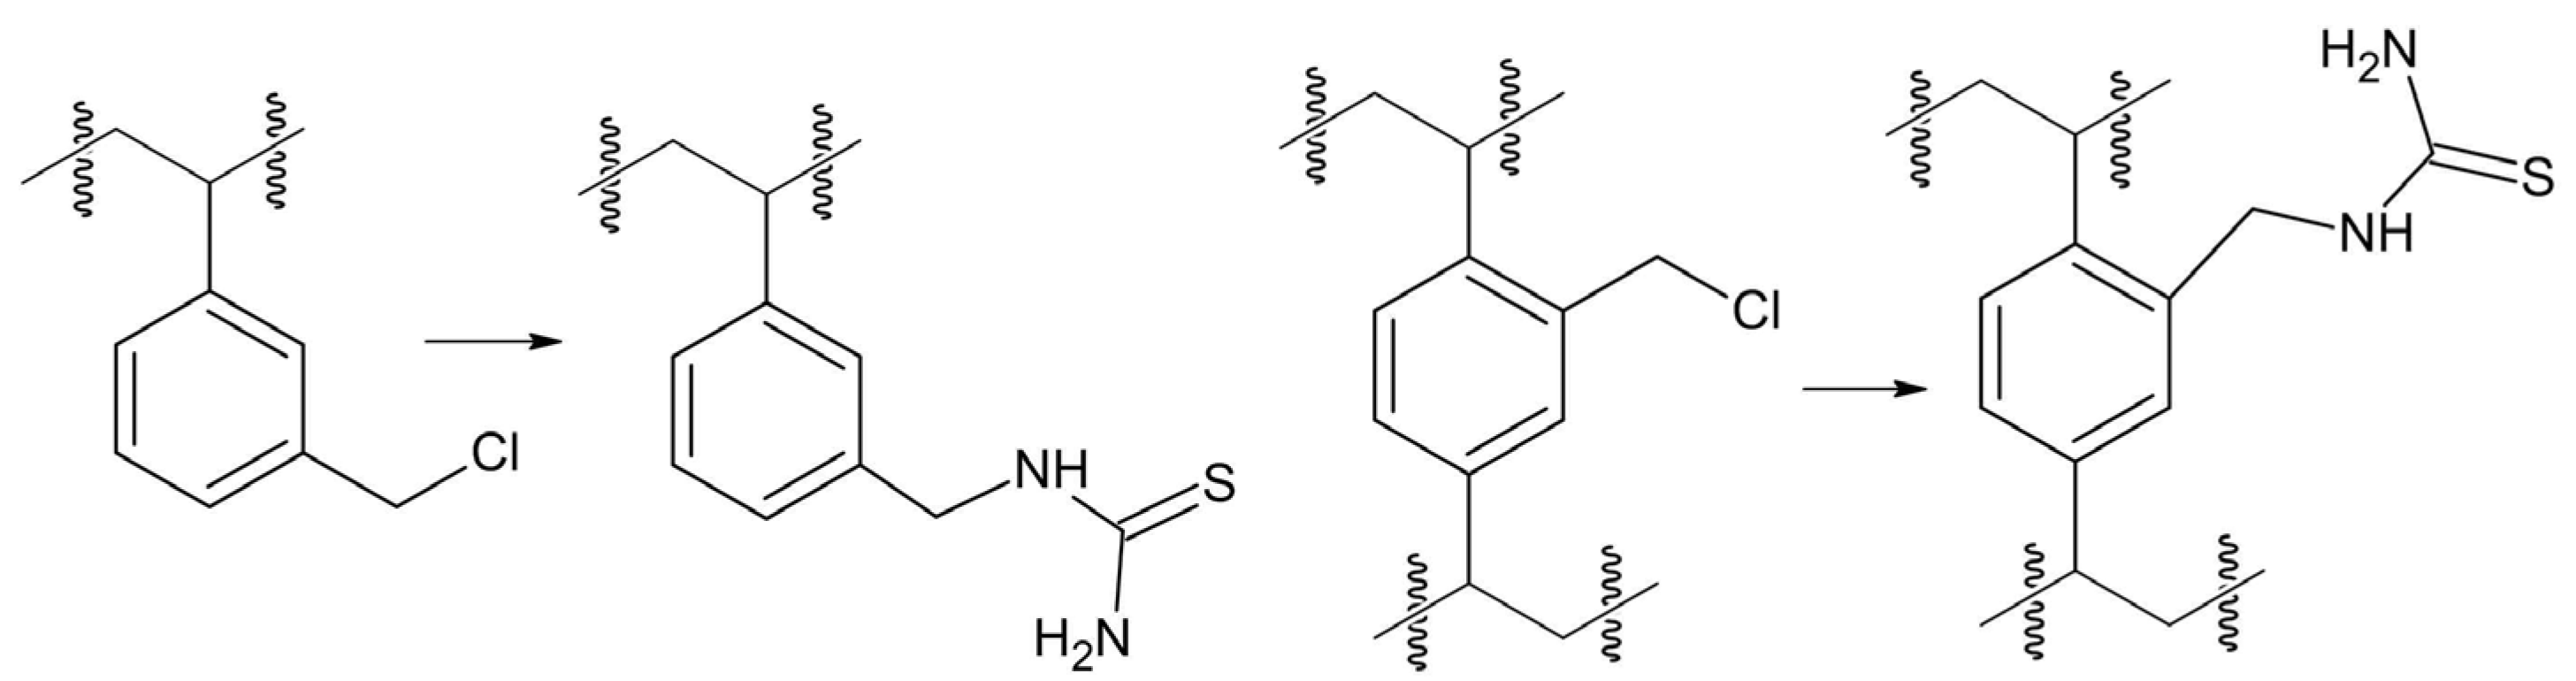
3.1. Preparation and Properties of the Zr-Loaded Thiourea-Functionalized Resin

The styrene-divinylbenzene skeleton is chloromethylated only in meta-position with chloromethyl methyl ether. Thus, the consecutive coupling with thiourea results in only the meta-substituted thiourea-functionalized resin. The divinylbenzene is present only in 2%. Therefore, the functionalization of DVB units has marginal importance in the properties of the ion-exchange resin (Scheme 1).
The zirconium(IV) ion hydrolyzes and polymerizes in aqueous solutions even at low pH values and the zirconyl ion (ZrO2+) is the only form of zirconium(IV) species in aqueous solutions at pH > 0. Zirconium (IV) ions form only in >12 M HCl solutions and at a very low zirconium concentration (0.0001 M) [22]. Although the zirconyl chloride octahydrate is a tetramer ([Zr4(OH)8(H2O)16]Cl8) in the solid state, the zirconyl ion is the dominant chemical form in its aqueous solutions. Therefore, we used a 0.055 M zirconyl chloride solution in 3 M HCl in the Zr-loading of the thiourea-functionalized resin because the other available zirconium salts, zirconium sulfate (H2[ZrO(SO4)2) and nitrate (ZrO(NO3)2) contain the zirconium in anionic or neutral species in their solution, respectively [22,23,24].
The CHNS and Zr content of the Zr-loaded sample showed (ESI Table S1) that the amount of thiourea groups is ~0.4/ring; thus, not all the rings are functionalized. The S and Zr content shows that only 17% of the functional groups are loaded with zirconyl ions. The swelling water content is ~20%. No chloride ion was detected in the sample; thus, the deprotonated thiourea group is the anion. The weak N-donor properties of thiourea suggest sulfur ligation [25]. The IR spectra of the unloaded and Zr-loaded samples were very similar because only a part of the thiourea groups was in complex form. The scissoring deformation mode of the swelling water gives intense broadband at 1634 cm−1 with a shoulder belonging to the NH2 deformation band at 1604 cm−1 (Figure 1) [26]. In contrast, the scissoring water deformation and OH stretching bands disappear in the IR spectrum of the dried Zr-loaded sample (Figure 1). It shows the lack of coordinated water in the Zr coordination environment.
The intense band at ~3300 cm−1 belongs to the stretching (symmetric and asymmetric) of water molecules which is strongly overlapped with NH2 stretching modes. The band at 1000–870 cm−1 is characteristic of the zirconyl ion (or other products with a condensed Zr-O bond containing framework) [24,27,28,29] but it coincides with different vibrational modes of the skeleton fingerprint region. The assignment of the skeletal (C-C and C-H) modes of functionalized styrene-divinylbenzene copolymers is given in [5]. Yuchi et al. stated that Zr-saturated resins with various functional groups contain R-Zr(OH)2 species but the IR spectrum of the dry resin does not contain OH bands at all, so these functional groups transform into Zr=O or condensed Zr-O bond species during drying [29,30]. The peak observed at 1420 cm−1 in the spectra of free thiourea-functionalized and Zr-loaded resins may be attributed to the stretching vibrations of C=S groups, while the peak with a maximum at 1110 cm−1 can be attributed to the rocking mode of the NH2 group [26].

3.2. Thermal Studies of the Zr-Loaded Thiourea-Functionalized STY-DVB Resin

The carbonization of the Zr-loaded thiourea-functionalized STY-DVB resin under inert conditions (ESI Figure S1) was a long decomposition process which consists of parts belonging to the degradation of the thiourea-functional group (~200–250 °C) together with the partial degradation of the polymer skeleton, followed by the multi-step depolymerization of the polymer skeleton (350–500 °C, Figure 2). The functional group loss process proceeds with the formation of various fragments (m/z = 26, 27, 44, 58, 59, 60, and 75 corresponding to CN+, HCN+ (HNC+), CS+ (CO2+, N2O+) CNS+, HSCN+ pr HNCS+, H2NCS+ or H2NCSH+, respectively) from the CH2HNCSNH2+ parent ion (Figure 2a, ESI Figure S2), together with hydrocarbon fragments from the degradation of the aromatic ring (m/z = 64 (Figure 2b)) which shows that the functional groups are eliminated with a partial decomposition of the polymer skeleton between 250 and 500 °C (the m/z = 64 signal belongs to the C5H4+ fragment ion from aromatic ring fragmentation) [31].
The expected decomposition product at m/z = 44 is the CS+ fragment, but CO2+ and N2O+ can also signal at m/z = 44. To distinguish these species, we followed the evolution of the m/z = 28 (CO+, N2+) and m/z = 32(S+) fragments because the m/z = 28 (CO+ or N2+) fragments may be formed only from CO2+ or N2O+, respectively, whereas m/z = 32 (S+) fragment only from CS parent ions. The shape of the CO+/N2+ curve (m/z = 28) does not entirely coincide with the shape of the CO2+/N2O+/CS+ curve; thus, the m/z = 44 peak consists of at least two ion signals, one of which generates an m/z = 28 fragment ion and at least one other which does not cause an m/z = 28 fragment ion (Figure 3). Evaluation of the m/z = 32 curve did not give valuable information owing to the high reactivity of sulfur vapor and possible O2 traces. The evolution of water was followed by monitoring the peaks at m/z = 18 (H2O+) and m/z = 17 (OH+). The m/z = 16 (O+ and NH2+) peak intensities were compared with the peak intensities of m/z = 15 (NH+, CH3+) and m/z = 14 (N+ and CH2+) fragment ions, which showed that the m/z = 15 and 14 intensity ratio is changed with increase the temperature. This may be attributed to the CH3 ion formation with H abstraction during the high-temperature polymer skeleton degradation. Accordingly, the m/z = 15 and 14 peaks contain more N and NH fragments around 350 °C, whereas the contribution of CH3 and CH2 fragments at 450–500 5C is higher than at ~350 °C, respectively (Figure 3).
The decomposition process may be described in the following steps:
(A)
The decomposition of the Zr-loaded thiourea groups with partial depolymerization/degradation of the rings attached to the Zr-loaded thiourea functions.
(B)
The degradation of unfunctionalized thiourea groups with partial depolymerization and degradation of the rings attached to the unloaded thiourea groups.
(C)
Complete depolymerization/degradation of the residual polymer matrix at ~500 °C [5,6]. The other minor effects are the decomposition of residual materials including the N and S containing carbonaceous materials formed in the previous decomposition steps.
Polymer degradation proceeded with the formation of Ph-CHCH+ (m/z = 103), PhCH+ (m/z = 91), C6Hx+ (x = 3, 4, 5, m/z = 63, 64, 65), and DVB fragments (m/z = 130, 129, 128) (ESI Figure 3). The low DVB content does not help the formation of large amounts of solid carbonaceous products [32] but metal loading generally increases the formation of solid products [14,33,34]. The amount of solid residue was >30%, with ~2.8% Zr content and ~20% water content. Thus, the solid carbonaceous products have ~9–10 C/Zr atomic ratio values. S and N might also be incorporated into the carbonaceous residue in the same amount.
The decomposition process is completed at around 800 °C. Therefore, the lowest carbonization temperature was selected to be 1000 °C.

3.3. The Preparation and Properties of ZrO2@C Composites

The carbonization reactions were investigated first at 1000, 1200, and 1400 °C for 2 h in a tube furnace. To assess the impact of reaction time, the holding time was prolonged up to 8 h at 1400 °C. ZrC formed only at 1400 °C in 8 h, whereas ZrO2 was created at all three studied temperatures. Tetragonal and monoclinic ZrO2 were detected at 1000 °C, embedded in graphite and amorphous carbon. Treatment temperature and reaction time significantly affected the ratio of tetragonal and monoclinic ZrO2 [35] which had values of 0.375, 0.38, 0.83, and 1.2 for tests conducted at 1000, 1200, and 1400 °C for two hours and at 1400 °C for eight hours, respectively. Cubic ZrO2 was formed only at 1400 °C carbonization temperature, and its amount also increased with increasing treatment time. Amorphous carbon content decreases from ~48% (1000 °C for 2 h) to 22% (1400 °C for 2 h) and increasing the reaction time to 8 h at 1400 °C causes a further decrease (~10%) (Table 1).
The change in the BET surface areas shows the opposite tendency—they increase from 15 m2/g (1000 °C for 2 h) to 43 m2/g (1400 °C for 2 h) and 125 m2/g (1400 °C for 8 h) (Table 2).
The increase in the specific surface area may be attributed to the formation of ZrC (1400 °C/8 h and 1000 °C/2 h-P-Ar-He samples) from the ZrO2 and carbon reaction and due to the breaking of the carbon network and formation of new surfaces.

3.4. The Preparation and Properties of Composites Containing Zirconium Carbide

Cubic ZrC (a = 4.6690 Å, Fm3m) appeared with a crystallite size of ~44 nm at 1400 °C in 8 h. The RF plasma treatment of the sample prepared at 1000 °C in 2 h (30% graphite, 48% amorphous carbon, 6% and 16% tetragonal and monoclinic ZrO2, respectively) promoted the formation of ZrC (16%) which was the highest among all test conditions. The composite’s average crystallite size and BET surface area were 41 nm and 278 m2/g, respectively. The amorphous carbon content completely disappeared with RF plasma treatment in He [5] and all three ZrO2 modifications were present (tetragonal, monoclinic, and cubic, in 27%, 11%, and 11%, and with an average crystallite size of 65, 69, and 53 nm, respectively).
The TEM study on the samples containing ZrC prepared at 1400 °C for 8 h and by RF plasma treatment can be seen in Figure 4 and Figure 5. These samples exhibited similarities in their composition; e.g., they had both monoclinic and tetragonal ZrO2 phases but there was no evidence of the ZrC cubic phase.

3.5. Raman Studies on ZrO2@C and (ZrC, ZrO2)@C Composites

Raman spectroscopy gives information about the number of carbonaceous phases, such as amorphous carbon, graphite, or distorted graphite structures, and the graphitization process [36,37,38,39]. The highly ordered monocrystalline graphite with an ideal graphite lattice gives two first-order Raman shifts. These are the harmonic transverse optical mode neighboring the zone boundary K point, G (E2g), and the degraded optical mode at the Brillouin zone, G1 (2D), at ~1580 and ~2687 cm−1, respectively [16,40]. The disordered graphitic lattice possesses the band D1 (D) (A1g, phonon of the longitudinal in-plane optical branch) and D2 (D′) (E2g, in-plane acoustic branch neighboring the K point), owing to the graphene layer surfaces and edges, at around 1350 and 1620 cm-1, respectively [5,41,42]. The amorphous carbon D3 band (D″) is located at 1500 cm−1, whereas the D4 (D*) band at 1200 cm−1 consists of mixed modes including a graphite lattice disordered mode (A1g) and ionic impurity or polyene modes [36,39]. The Raman spectra of carbonaceous materials include weak combination (D + D″) and harmonic overtone (2D′) modes as well [42,43,44]. The Raman spectra of the ZrC-containing composites prepared from Zr-loaded thiourea-supported STY-DVB resin between 1000 and 1400 °C are given in Table 3 and ESI Figure S3.
The intensity ratio of the peaks belonging to amorphous/graphitic components (D″/(D+G)) drops steadily as the reaction temperature increases suggesting increasing graphitization. The same result was also observed in the Raman spectrum of the plasma-treated sample. Owing to the creation of more crystalline phases, the D and G bands become sharp. The intensities of the D* bands decrease drastically above 1200 °C illustrating the decomposition of the organic polyenes. The D bands’ stability on changing the temperature and carbonization time demonstrates low-level degradation of the graphene layers. The I2D/IG ratio, proportional to the thickness of the monolayer carbon sheets, varies only a little and randomly with increasing reaction temperature and time. It shows that Zr atoms were not substantially absorbed into the carbon network [45]. Graphite formation may also be attributed to the catalytic effect of ZrC and the increasing temperature above 1400 °C [46].
In the case of the furnace-treated samples, the increased reaction time and temperature resulted in soft improvements in the graphitization process. The amorphous carbon/graphite ratio decreases with increasing temperature. The Raman spectrum of the plasma-treated sample illustrates the complete disappearance of the D* bands and the thermal decomposition of polyenes and their transformation into the superficial graphene layers.
XPS studies of the carbonized samples were performed to explore carbon states on the surfaces. The carbon 1s spectra were fitted using asymmetric peak shape AS(70, 0.7) [47] (Figure 6). Asymmetric peak shapes are often used for conducting materials like graphite in photoelectron spectroscopy. Asymmetry parameters refer to the Gaussian-Lorentzian ratio and the tailing factor. The spectra also contain π-π* shake-up satellites which confirm the aromatic nature of the carbon phases. The carbon 1s XPS spectra in the case of the plasma-treated samples can be well fitted only by adding oxidized carbon peaks to the spectra. We used epoxy carbon lines at 286.6 eV and carbonyl lines at 287.6 eV BE for all investigated samples [48]. The presence of oxidized carbon species is also supported by the oxygen detected by XPS. The percentage of oxidized carbon on the surface of the plasma-treated samples is significantly higher than in the case of the heat-treated samples. Surface elemental analysis results are shown in Table 3.
Zr-compounds were not detected at the surface layer which suggests that an outer carbon-containing layer was formed from the evaporated volatile hydrocarbon degradation products during the pyrolysis process (ESI Figure S4). On the basis of IMFP calculations, the outer carbon layer has a minimal 6 nm thickness.

3.6. Comparison of the ZrC Containing Composites Prepared from Various Functionalized Styrene-Divinylbenzene-Based Cation Exchangers

The ZrC-containing composites have high importance in the nuclear industry. The properties of the carbon-based composites containing ZrC and ZrO2, prepared from various cation exchangers, are summarized in Table 4.
As shown in Table 4, the ZrC content and crystallite size strongly depend on the functional groups of the precursor ion exchanger and the carbonization conditions. Thus, the method (tube furnace and plasma treatment carbonization) can result in different compositions with various ZrO2/ZrC ratios (ESI Figure S5). Different ratios of each ZrO2 modification were found and had various crystallite sizes. The functional groups of the anion exchangers were similarly crucial in the distribution of ZrC and ZrO2 including the modifications of ZrO2 [49].

4. Conclusions

Various composites with different ZrO2 and ZrC content with varying ratios of each ZrO2 modification were prepared from a ZrOCl2-loaded thiourea-functionalized styrene-divinylbenzene copolymer by carbonization in a tube furnace at 1400 °C as well as by in-flight thermal plasma treatment of the ZrO2@C sample made at 1000 °C in 2 h. The crystallite sizes of the ZrO2 modifications and ZrC strongly depend on the synthesis conditions. The functional groups of the cation exchangers are an essential factor in preparing the (ZrO2, ZrX)@composites. The ZrC-containing composites were formed from the thiourea-functionalized and ZrOCl2-loaded samples at 1400 °C in 8 h and with in-flight plasma treatment in He with 8 and 16% ZrC, and 44 and 41 nm ZrC crystallite sizes, respectively. The BET surface area of the composite containing ZrC was 115 and 278 m2/g for the samples prepared in a tube furnace and by plasma processing, respectively. Carbide formation was time-dependent with no detected ZrC at 1400 °C in 2 h. Lower temperatures (1000–1200 °C) and a short reaction time (2 h) resulted in only ZrO2 modifications (tetragonal, monoclinic, and cubic) in various ratios and crystallite sizes (65–88 nm) and BET surface areas (15–43 m2/g).

Supplementary Materials

The following supporting information can be downloaded at: https://www.mdpi.com/article/10.3390/jcs7080306/s1. ESI Table S1 Chemical analysis of Zr-loaded thiourea-functionalized styrene-divinylbenzene copolymer (average of five measurements); ESI Table S2 Raman peak positions (in cm−1) and intensities for (ZrO2)@C and (ZrO2,ZrC)@C composite samples; ESI Figure S1 TG-DSC of the of the Zr-loaded thiourea-functionalized styrene-divinylbenzene copolymer under N2 atmosphere; ESI Figure S2 TG-MS of the Zr-loaded thiourea-functionalized styrene-divinylbenzene copolymer: Ph-CHCH+ (m/z = 103), PhCH+ (m/z = 91), C6Hx+ (x = 3, 4, 5, m/z = 63, 64, 65) (a), and DVB fragments (m/z = 130,129,128) (b); ESI Figure S3 Raman spectra of the carbonized Zr-loaded thiourea-functionalized styrene-divinylbenzene copolymer at different temperatures and processes. 1000 °C for 2 h (a), 1200 °C for 2 h (b), 1400 °C for 2 h (c), 1400 °C for 8 h (d), plasma treated in He atmosphere (e); ESI Figure S4 Zr 3d XPS spectra of the samples prepared at 1400 °C for 2 and 8 h heat treatment; ESI Figure S5 XRD pattern of the samples produced by calcination of the Zr-loaded thiourea-functionalized styrene-divinylbenzene copolymer.

Author Contributions

Conceptualization, L.K.; investigation, A.M. (Alejandro Martiz), Z.K., L.B., L.T., A.F., A.M.(Alfréd Menyhárd); writing—original draft preparation, L.K., A.M.(Alejandro Martiz); writing—review and editing, Z.K. and L.K.; visualization, A.M.(Alejandro Martiz); supervision, Z.K. and L.K. All authors have read and agreed to the published version of the manuscript.

Funding

This research received no external funding.

Conflicts of Interest

The authors declare no conflict of interest.

References

  1. Liu, G.; Cheng, L.; Li, K.; Chen, Z.; Xiong, X.; Luan, X. Damage behavior of atomic oxygen on zirconium carbide coating modified carbon/carbon composite. Ceram. Int. 2020, 3, 3324–3331. [Google Scholar] [CrossRef]
  2. Pierson, H.O. Handbook of Refractory Carbides and Nitrides: Properties, Characteristics, Processing and Applications, 1st ed.; Noyes Publication: Bergen, NJ, USA, 1997. [Google Scholar]
  3. Scales, N.; Chen, J.; Aughterson, R.D.; Karatchevtseva, I.; Stopic, A.; Lumpkin, G.R.; Luca, V. Porous ZrC-carbon microspheres as potential Insoluble target matrices for production of 188W/188Re. J. Radioanal. Nucl. Chem. 2018, 318, 835–847. [Google Scholar] [CrossRef]
  4. Scales, N.; Chen, J.; Hanley, T.L.; Riley, D.P.; Lumpkin, G.R.; Luca, V. Hierarchically porous carbon–zirconium carbide spheres as potentially reusable transmutation targets. Microporous Mesoporous Mater. 2015, 212, 100–109. [Google Scholar] [CrossRef]
  5. Martiz, A.; Károly, Z.; Trif, L.; Mohai, M.; Bereczki, L.; Németh, P.; Zsombor, M.; Menyhárd, A.; Pawar, R.P.; Kótai, L. Plasma-assisted preparation of nano-(ZrC.; ZrO2)@carbon composites from Zr-loaded sulfonated styrene–Divinylbenzene copolymers. J. Therm. Anal. Calorim. 2022, 147, 9353–9365. [Google Scholar] [CrossRef]
  6. Martiz, A.; Károly, Z.; Domján, A.; Mohai, M.; Bereczki, L.; Trif, L.; Farkas, A.; László, K.; Menyhárd, A.; Kótai, L. Nano-ZrO2@C.; nano-(ZrC.; ZrO2)@C and nano-ZrC@C composites prepared by plasma-assisted carbonization of Zr-loaded iminodiacetate-functionalized styrene-divinylbenzene copolymers. Inorganics 2022, 10, 77. [Google Scholar] [CrossRef]
  7. Bai, L.; Yuan, F.; Fang, Z.; Wang, Q.; Ouyang, Y.; Jin, H.; He, J.; Liu, W.; Wang, Y. RF thermal plasma synthesis of ultrafine ZrB2-ZrC composite powders. Nanomaterials 2020, 10, 2497. [Google Scholar] [CrossRef]
  8. Peters, A.B.; Wang, C.; Zhang, D.; Hernandez, A.; Nagle, D.C.; Mueller, T.; Spicer, J.B. Reactive laser synthesis of ultra-high-temperature ceramics HfC, ZrC, TiC, HfN, ZrN and TiN for additive manufacturing. Ceram. Int. 2023, 49, 11204–11229. [Google Scholar] [CrossRef]
  9. Martiz, A.; Károly, Z.; Bódis, E.; Fazekas, P.; Mohai, M.; Bertóti, I.; Keszler, A.M. In-flight synthesis of nanosized ZrC particles from various precursors in RF thermal plasma. Per. Polytech. Chem. Eng. 2021, 65, 331–342. [Google Scholar] [CrossRef]
  10. Saray, M.T.; Yurkiv, V.; Shahbazian-Yassar, R. In Situ Thermolysis of a Ni Salt on Amorphous Carbon and Graphene Oxide Substrates. Adv. Funct. Mater. 2023, 33, 2213747. [Google Scholar] [CrossRef]
  11. Yan, W.; Xiao, F.; Li, X.; He, W.; Yao, Y.; Wan, D.; Liu, X.; Liu, Y.; Feng, F.; Zhang, Q.; et al. Nickel and oxygen-containing functional groups co-decorated graphene-like shells as catalytic sites with excellent selective hydrogenation activity and robust stability. Chem. Eng. J. 2023, 452, 139361. [Google Scholar] [CrossRef]
  12. Masoud, A.; Gholamhassan, A.; Mohammad, K.A. An on-line matrix separation and preconcentration procedure for ICP OES determination of Cd, Co, Cu, Mn and Pb traces in Zr and Zr–Nb alloys using a cation-exchange resin microcolumn. J. Anal. Atom. Spectrom. 2021, 36, 1074–1083. [Google Scholar]
  13. Li, F.; Huang, X.; Zhang, G.J. Scalable foaming assisted synthesis of ZrC nanopowder by carbothermal reduction. Ceram. Int. 2015, 41, 3335–3338. [Google Scholar] [CrossRef]
  14. Fazekas, P.; Czégény, Z.; Mink, J.; Bódis, E.; Klébert, S.; Németh, C.; Keszler, A.M.; Károly, Z.; Szépvölgyi, J. Decomposition of poly(vinyl chloride) in inductively coupled radiofrequency thermal plasma. Chem. Eng. J. 2016, 302, 163–171. [Google Scholar] [CrossRef] [Green Version]
  15. Szépvölgyi, J.; Mohai, I.; Karoly, Z.; Gál, L. Synthesis of nanosized ceramic powders in a radiofrequency thermal plasma reactor. J. Eur. Ceram. 2018, 28, 895–899. [Google Scholar] [CrossRef]
  16. Komarov, V.S.; Yatsevskaya, M.I.; Sycheva, O.A. Properties of activated carbon produced from spent ion-exchange resins. Dokl. Akad. Nauk. BSSR 1985, 29, 1010–1023. [Google Scholar]
  17. Silva, G.W.C.; Kercher, A.A.; Hunn, J.D.; Martin, R.C.; Jellison, G.E.; Meyer, H.M. Characterization of zirconium carbides using electron microscopy, optical anisotropy, Auger depth profiles, X-ray diffraction and electron density calculated by charge flipping method. J. Solid State Chem. 2012, 194, 91–99. [Google Scholar] [CrossRef]
  18. Gusev, A.I. Structural stability boundaries for nonstoichiometric compounds. Phys. Status Solidi A 1989, 111, 443–450. [Google Scholar] [CrossRef]
  19. Morgan, D.J. Comments on the XPS Analysis of Carbon Materials. J. Carbon Res. 2021, 7, 51. [Google Scholar] [CrossRef]
  20. Mohai, M. XPS MultiQuant: Multimodel XPS quantification software. Surf. Interface Anal. 2004, 36, 828–832. [Google Scholar] [CrossRef]
  21. Mohai, M.; Bertóti, I. Calculation of overlayer thickness on curved curfaces based on XPS intensities. Surf. Interface Anal. 2004, 36, 805–808. [Google Scholar] [CrossRef]
  22. Wang, C.; Cheng, R.; Liao, L.; Duan, X. High-performance thin-film electronics based on inorganic nanostructures and composites. Nano Today 2013, 8, 514–530. [Google Scholar] [CrossRef]
  23. Basumatary, S. Transesterification with heterogeneous catalyst in production of biodiesel: A review. J. Chem. Pharm. 2013, 5, 1–7. [Google Scholar]
  24. Fedorov, P.P.; Yarotskaya, E.G. Zirconium dioxide. Review. Condens. Matter Interphases 2021, 23, 169–187. [Google Scholar] [CrossRef] [PubMed]
  25. Loubalová, I.; Kopel, P. Coordination Compounds of Cu, Zn, and Ni with Dicarboxylic Acids and N Donor Ligands, and Their Biological Activity: A Review. Molecules 2023, 28, 1445. [Google Scholar] [CrossRef] [PubMed]
  26. Swaminathan, K.; Irving, H.M.N.H. Infra-red absorption spectra of complexes of thiourea. J. Inorg. Nucl. Chem. 1964, 26, 1291–1294. [Google Scholar] [CrossRef]
  27. Dunlap, C.J.; Mcneff, C.V.; Stoll, D.; Carr, P.W. Zirconia stationary phases for extreme separations. Anal. Chem. 2001, 73, 599A–607A. [Google Scholar] [CrossRef] [PubMed] [Green Version]
  28. Camps, M.; Chatzopoulos, M.; Camps, J.M.; Montheards, J.P. Chloromethylation of Polystyrenes and Styrene Copolymers. Applications. JMS-Rev. Macromol. Chem. Phys. 1987, 27, 505–557. [Google Scholar] [CrossRef]
  29. Yuchi, A.; Yoshida, N. Adsorption of tetravalent metal ions chelating resins containing iminodiacetic acid groups. Bull. Chem. Soc. Jpn. 2000, 73, 1841–1842. [Google Scholar] [CrossRef]
  30. Auer, B.M.; Skinner, J.L. IR and Raman spectra of liquid water: Theory and interpretation. J. Chem. Phys. 2008, 128, 224511. [Google Scholar] [CrossRef]
  31. Kotai, L.; Fodor, J.; Jakab, E.; Sajo, I.; Szabo, P.; Lónyi, F.; Valyon, J.; Gács, I.; Argay, G.; Banerji, K.K. A thermally induced low-temperature intramolecular redox reaction of bis(pyridine)silver(I) permanganateand its hemipyridinesolvate. Transit. Metal Chem. 2006, 31, 30–34. [Google Scholar] [CrossRef]
  32. Lee, G.; Park, S.I.; Shin, H.Y.; Joh, H.I.; Kim, S.S.; Lee, S. Simultaneous reactions of sulfonation and condensation for high-yield conversion of polystyrene into carbonaceous material. J. Ind. Eng. Chem. 2023, 122, 426–436. [Google Scholar] [CrossRef]
  33. Cheng, W.; Campolongo, M.J.; Tan, S.J.; Luo, D. Freestanding ultrathin nano-membranes via self-assembly. Nano Today 2009, 4, 482–493. [Google Scholar] [CrossRef]
  34. Kocsis, T.; May, Z.; Czégény, Z.; Sreedhar, B.; Pawar, R.P.; Kótai, L. Perspectives of magnetic and nanosized metal-containing amorphous carbon composite chemosorbents and catalysts. Nano Stud. 2016, 14, 7–35. [Google Scholar]
  35. Wen, Y.; Zhou, C.; Yu, L.; Zhang, Q.; He, W.; Liu, Q. Preparation of nanometer zirconia by hydrothermal method: Influence of temperature and mechanism. Solid State Sci. 2023, 142, 107237. [Google Scholar] [CrossRef]
  36. Fitzgerald, J.J.; Weiss, R.A. Cation-Anion and Cation-Cation Interactions in Sulfonated Polystyrene Ionomers Spectroscopic Studies of the Effects of Solvents. ACS Symp. Ser. 1986, 302, 35–53. [Google Scholar]
  37. El-NahhalI, I.M.; Zaggout, F.R.; Nassar, M.A.; El-Ashgar, N.M.; Maquet, J.; Babonneau, F.; Chehimi, M.M. Characterization and Applications of Immobilized Iminodiacetic Acid-Modified Silica. J. Sol-Gel Sci. Technol. 2003, 28, 255–265. [Google Scholar] [CrossRef]
  38. Jiang, J.; Renshaw, J.C.; Sarsfield, M.J.; Livens, F.R.; Collison, D.; Charnock, J.M.; Eccles, H. Solution Chemistry of Uranyl Ion with Iminodiacetate and Oxydiacetate: A Combined NMR/EXAFS and Potentiometry/Calorimetry Study. Inorg. Chem. 2003, 42, 1233–1240. [Google Scholar] [CrossRef]
  39. Busca, G.; Lorenzelli, V. Infrared spectroscopic identification of species arising from reactive adsorption of carbon oxides on metal oxide surfaces. Mater. Chem. 1982, 7, 89–126. [Google Scholar] [CrossRef]
  40. Choi, J.G. The Effect of Surface Properties of Carbon Nanomaterials on the Molecular Adsorption of Organophosphate. Bachelor’s Thesis, School of UNIST, Ulsan, Republic of Korea, 2019. [Google Scholar]
  41. Martiz, A.; Farkas, A.; Karoly, Z.; Franguelli, F.P.; Samaniego, S.K.; Menyhard, A.; Kotai, L. Raman studies on carbon-containing phases in nanosized-ZrO2/C and nanosized-(ZrC.; ZrO2)/C composites. Nano Stud. 2022, 10, 21–22. [Google Scholar] [CrossRef]
  42. Lokshin, E.P.; Tareeva, O.A. Sorption of Zirconium from Nitrate and Sulfate Solutions. Theor. Found. Chem. Eng. 2019, 53, 688–692. [Google Scholar] [CrossRef]
  43. Clearfield, A. Structural aspects of zirconium chemistry. Rev. Pure Appl. Chem. 1964, 14, 91–108. [Google Scholar]
  44. Fathy, M.; Moghn, T.A.; Awadallah, A.E.; El-Bellihi, A.H. Nano Composites of Polystyrene Divinyl Benzene Resin Based on Oxidized Multi-Walled Carbon Nanotubes. Int. J. Modern Org. Chem. 2013, 2, 67–80. [Google Scholar]
  45. Shishlov, N.M.; Khurasan, S.L. Effect of ion interactions on the IR spectrum of benzenesulfonate ion. Restoration of sulfonate ion symmetry in sodium benzenesulfonate dimer. J. Mol. Struct. 2016, 1123, 360–366. [Google Scholar] [CrossRef]
  46. De, R.; Lee, H.; Das, B. Exploring the interactions in binary mixtures of polyelectrolytes: Influence of mixture composition.; concentration.; and temperature on counter-ion condensation. J. Mol. Liq. 2018, 251, 94–99. [Google Scholar] [CrossRef]
  47. Fronczak, M.; Keszler, A.M.; Mohai, M.; Jezsó, B.; Farkas, A.; Károly, Z. Facile and continuous synthesis of graphene nanoflakes in RF thermal plasma. Carbon 2022, 193, 51–67. [Google Scholar] [CrossRef]
  48. Bertóti, I.; Mohai, M.; László, K. Surface modification of graphene and graphite by nitrogen plasma: Determination of chemical state alterations and assignments by quantitative X-ray photoelectron. Carbon 2015, 84, 185–196. [Google Scholar] [CrossRef] [Green Version]
  49. Scales, N. Syntheses, Structures and Radionuclide Extraction Properties of Porous ZrC-and Zr2SC-Carbon Composite Sphere Materials. PhD. Thesis, University of Wollongong, Wollongong, Australia, 2018. Available online: https://ro.uow.edu.au/theses1/343 (accessed on 11 October 2008).
Scheme 1. The formation of the thiourea-functionalized crosslinked styrene-divinylbenzene copolymers.
Jcs 07 00306 sch001
Figure 1. IR spectra of the raw (a) and Zr-loaded thiourea-supported styrene-divinylbenzene (b) copolymers in the 4000−400 cm−1 ranges.
Jcs 07 00306 g001
Figure 2. TG-MS plots of Zr-loaded thiourea-supported styrene-divinylbenzene copolymer carbonization. Fragments of functional group (a), hydrocarbon fragments from the decomposition of aromatic rings (b). The left and right scales belong to the TG and MS curves, respectively.
Jcs 07 00306 g002
Figure 3. TG-MS plots of Zr-loaded thiourea-supported styrene-divinylbenzene copolymer carbonization. Evolution of water (m/z = 18 (OH2+) and 17 (OH+)) and m/z = 15 (NH+, CH3+) and m/z = 14 (N+ and CH2+) fragment ions (a). m/z = 44 parent ions and their fragments (b).
Jcs 07 00306 g003
Figure 4. TEM images of the (ZrC, ZrO2)@C composites prepared at 1400 °C in 8 h from the Zr-loaded thiourea-functionalized styrene-divinylbenzene copolymer.
Jcs 07 00306 g004
Figure 5. TEM images of the (ZrC, ZrO2)@C composites prepared by plasma treatment of ZrO2@C composite prepared at 1000 °C in 2 h from the Zr−loaded thiourea−functionalized styrene−divinylbenzene copolymer (Miller indices 111 and 101 are shown for monoclinic and tetragonal ZrO2, respectively).
Jcs 07 00306 g005
Figure 6. C1s XPS spectra of the carbonized Zr-loaded thiourea-functionalized styrene-divinylbenzene copolymer samples (a) 1400 °C for 2 h; (b) 1400 °C for 8 h; (c) Plasma treated in H2 atmosphere; (d) Plasma-treated in He atmosphere.
Jcs 07 00306 g006
Table 1. Composition and properties of (ZrC, ZrO2)@C composites prepared from the Zr-loaded thiourea-functionalized styrene-divinylbenzene copolymer.
SampleCarbon Content [wt%]ZrO2 Content and Size * [wt%, nm]ZrC Content and Size * [wt%, nm]
GraphiteAmorphous CarbonTetraMonoCubic
1000 °C/2 h30~486 (85)16 (80)
1200 °C/2 h26~3411 (88)29 (74)
1400 °C/2 h38~2215 (76)18 (71)7 (61)
1400 °C/8 h32~1018 (71)15 (66)15 (52)8 (44)
1000 °C/2 h-P-Ar-He>35--27 (65)11 (69)11 (53)16 (41)
* The size of crystallites was determined by the Scherrer method.
Table 2. BET Surface Area of all the calcination products obtained in the furnace and RF-Plasma reactor.
SampleBET-Specific Surface Area (m2/g)
1000 °C/2 h15
1200 °C/2 h27
1400 °C/2 h43
1400 °C/8 h115
1000 °C/2 h-P-Ar-He278
Table 3. Elemental surface composition of the samples (atomic %).
SampleCgraphiteC-O-CC=OO
H2 plasma85.53.34.86.3
He Plasma88.04.32.75.1
1400 °C/2 h94.51.01.33.2
1400 °C/8 h95.01.51.52.0
Table 4. Carbon-based composites containing ZrC and ZrO2 prepared by the carbonization of various functionalized styrene-divinylbenzene polymer-based cation exchangers.
Functional GroupConditionsZrO2 Content and Crystallite SizeZrC Content and Crystallite SizeRef.
-SO3H, ZrOCl2 loaded1400 °C, 8 h, 2% DVB7%tetragonal and 11% monoclinic, each size was 32 nmNo ZrC formation[5]
1400 °C, 8 h, 8% DVB<5%tetragonal and <5% monoclinic, 20 and 27 nm, respectivelyNo ZrC formation[5]
RF Plasma, He16% tetragonal, 13% monoclinic, <5% cubic, 20, 27 and 27 nm, respectively11% ZrC, 23 nm
>55% graphite content
[5]
RF Plasma, H217% tetragonal, 10% monoclinic, <5% cubic, 18, 27, and 22 nm, respectively13% ZrC, 21 nm
>55% graphite content
[5]
-CH2-NHC(S)NH21400 °C, 8 h, 2% DVB18% tetragonal, 15% monoclinic, 15% cubic, 71, 66, and 52 nm, respectively8% ZrC content, 44 nm (32 and 10% graphite and amorphous C content, respectively)*
RF plasma, Ar-He27% tetragonal, 15% monoclinic, 11% cubic, 65, 69, and 53 nm, respectively16% ZrC content, 41 nm (only graphite is present as carbonaceous phase)*
-CH2-N(CH2COOH)2, ZrOCl2 loaded1200 °C, 2 h15% tetragonal, 11 nm75% ZrC, 10 nm
(no graphite and 10% amorphous C content)
[6]
-CH2-N(CH2COOH)2, ZrOCl2 loaded1400 °C, 8 h5% tetragonal/monoclinic=1.92, 26 nm85% ZrC, 14 nm
(no graphite and 10% amorphous C content)
[6]
-CH2-N(CH2COOH)2, Zr-sulphate loaded1400 °C, 8 h5% monoclinic/cubic=1.05, 31 nm50% ZrC, 56 nm
(no graphite and 45% amorphous C content)
[6]
-CH2-N(CH2COOH)2, Zr-nitrate loaded1400 °C, 8 hNo ZrO295% ZrC, 18 nm
(5% amorphous C content)
[6]
-CH2-N(CH2COOH)2, Zr-nitrate loadedRF plasma, HeNo ZrO295% ZrC, 62 nm
(5% graphite)
[6]
-CH2-N(CH2COOH)2, Zr-nitrate–loadedRF plasma, H2No ZrO290% ZrC, 35 nm
(10% graphite)
[6]
* The given results refer to the current study.
Disclaimer/Publisher’s Note: The statements, opinions and data contained in all publications are solely those of the individual author(s) and contributor(s) and not of MDPI and/or the editor(s). MDPI and/or the editor(s) disclaim responsibility for any injury to people or property resulting from any ideas, methods, instructions or products referred to in the content.

