
Effect of Biobased SiO2 on the Morphological, Thermal, Mechanical, Rheological, and Permeability Properties of PLLA/PEG/SiO2 Biocomposites


Abstract
1. Introduction
2. Materials and Methods
2.1. Materials
2.1.1. SiO Preparation
2.1.2. Composites Preparation
2.2. Methods
2.2.1. Morphology
2.2.2. Differential Scanning Calorimetry
2.2.3. Equilibrium Melting Temperature Determination
2.2.4. Isothermal Crystallization
2.2.5. Thermogravimetric Analysis
2.2.6. Melt Rheology
2.2.7. Tensile Test
2.2.8. X-ray Diffraction Analysis
2.2.9. Gas Permeation Measurements
3. Results
3.1. Morphology
3.2. Differential Scanning Calorimetry
3.2.1. Non-Isothermal Crystallization
3.2.2. Isothermal Crystallization
Equilibrium Melting Temperature Determination
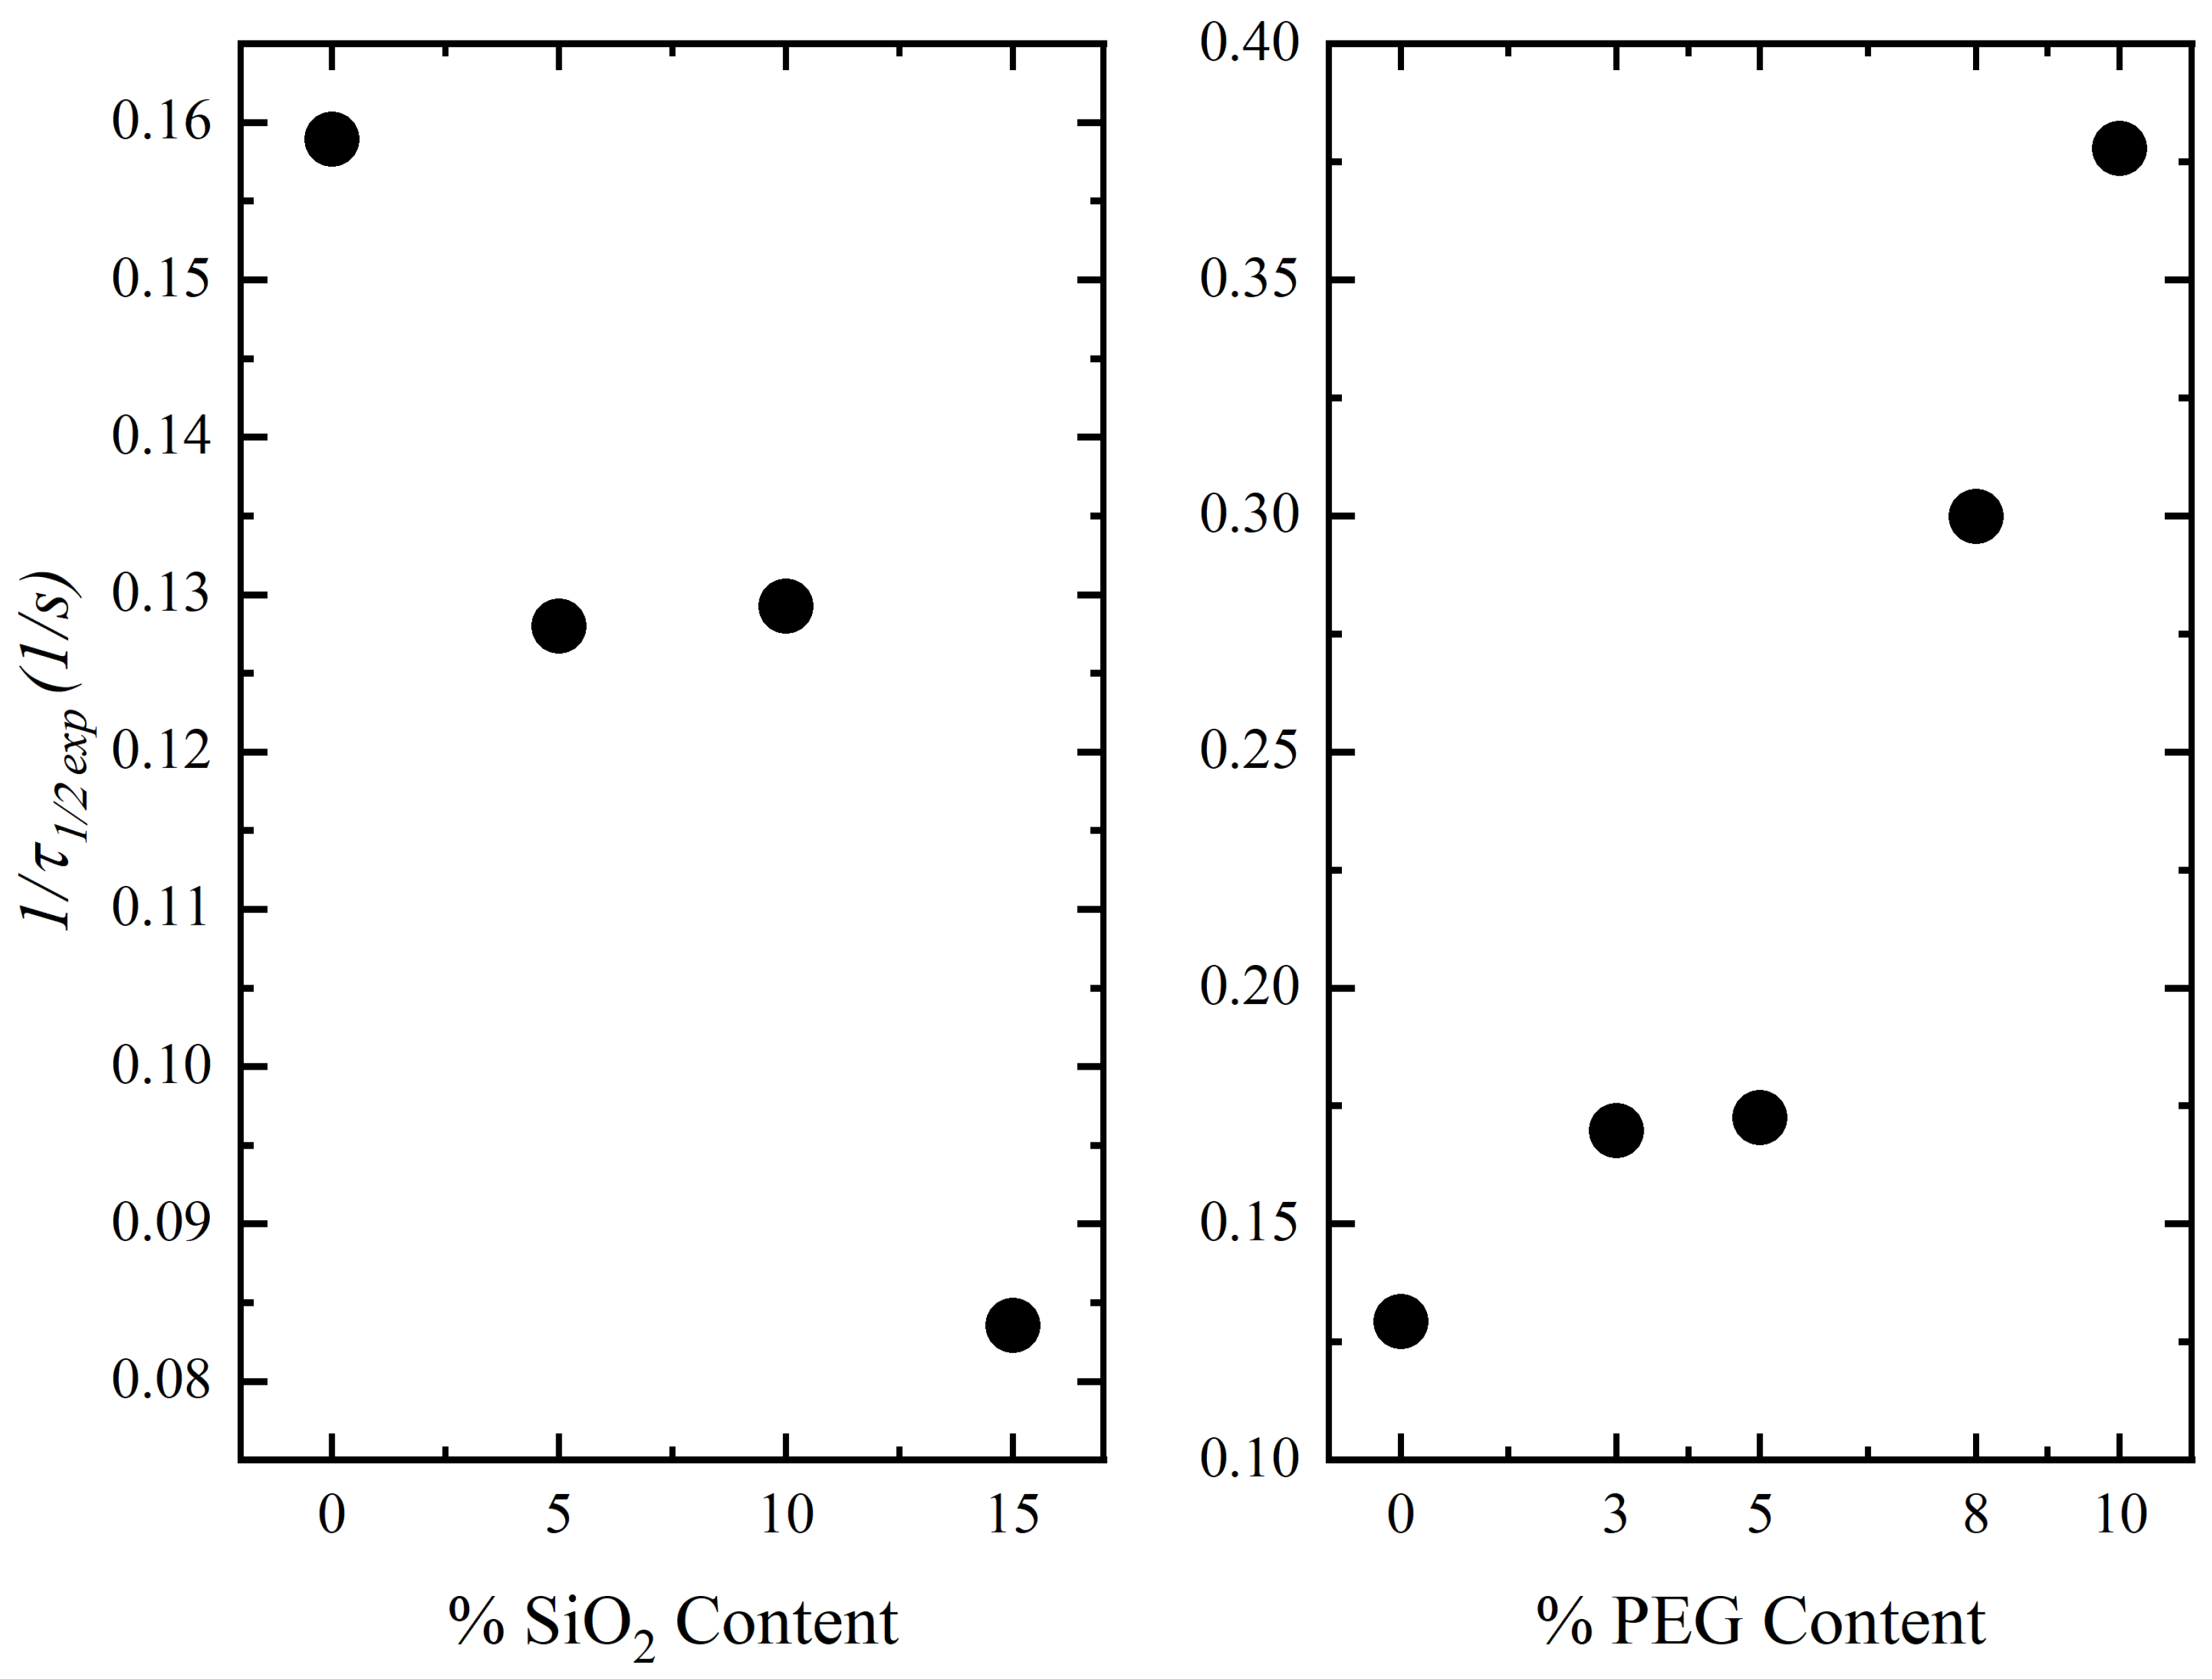
Isothermal Crystallization Kinetics
3.3. Thermal Stability
3.4. Melt Rheology
3.5. Tensile Properties
3.6. X-ray Diffraction Analysis
3.7. Gas Permeation Measurements
4. Final Remarks and Future Works
- With several new applications in various disciplines, including the aerospace, energy, and chemical industries, packaging is anticipated to be available shortly. However, the dispersion of silica particles in the PLLA matrix should be improved.
- Barrier properties are extremely important in food packaging. Future work should investigate the permeability to water vapor, oxygen, and carbon dioxide to obtain good candidates for bio-packaging.
- Plasticizers are used to improve the mechanical properties of PLLA and obtain similar properties to those of synthetic polymers. The improvement and development of new components to obtain these properties will be a promising area of research.
- Reduction in production costs for PLLA will be a trend that will continue to be studied in future work since the production of this biopolymer will increase and routes developed to reduce production costs.
5. Conclusions
- Morphological analyses showed no agglomeration and good interaction between the particles and the polymeric matrix. Due to the high miscibility between both polymers and the high amount of hydroxyl groups present in SiO, adding PEG to the composite increased the SiO distribution, leading to more homogeneous samples and smoother surfaces after breakup.
- Non-isothermal analysis showed that incorporating SiO at higher concentrations (10–15 wt.%) increased T and T hindering PLLA crystallization as confirmed by XRD analysis. In contrast, the addition of PEG to the PLLA/SiO (90/10) composite showed lower T and T, mainly due to the plasticizing effect of PEG increasing chain mobility.
- The Avrami and Lauritzen–Hoffman parameters confirmed that silica particles make the crystallization of PLLA more difficult due to an impeding effect, especially at higher concentrations, whereas for composites with PEG, lower energy is required for the chain folding process.
- The thermal stability of the composites with SiO increased because of the presence of highly stable particles (SiO) up to 23%.
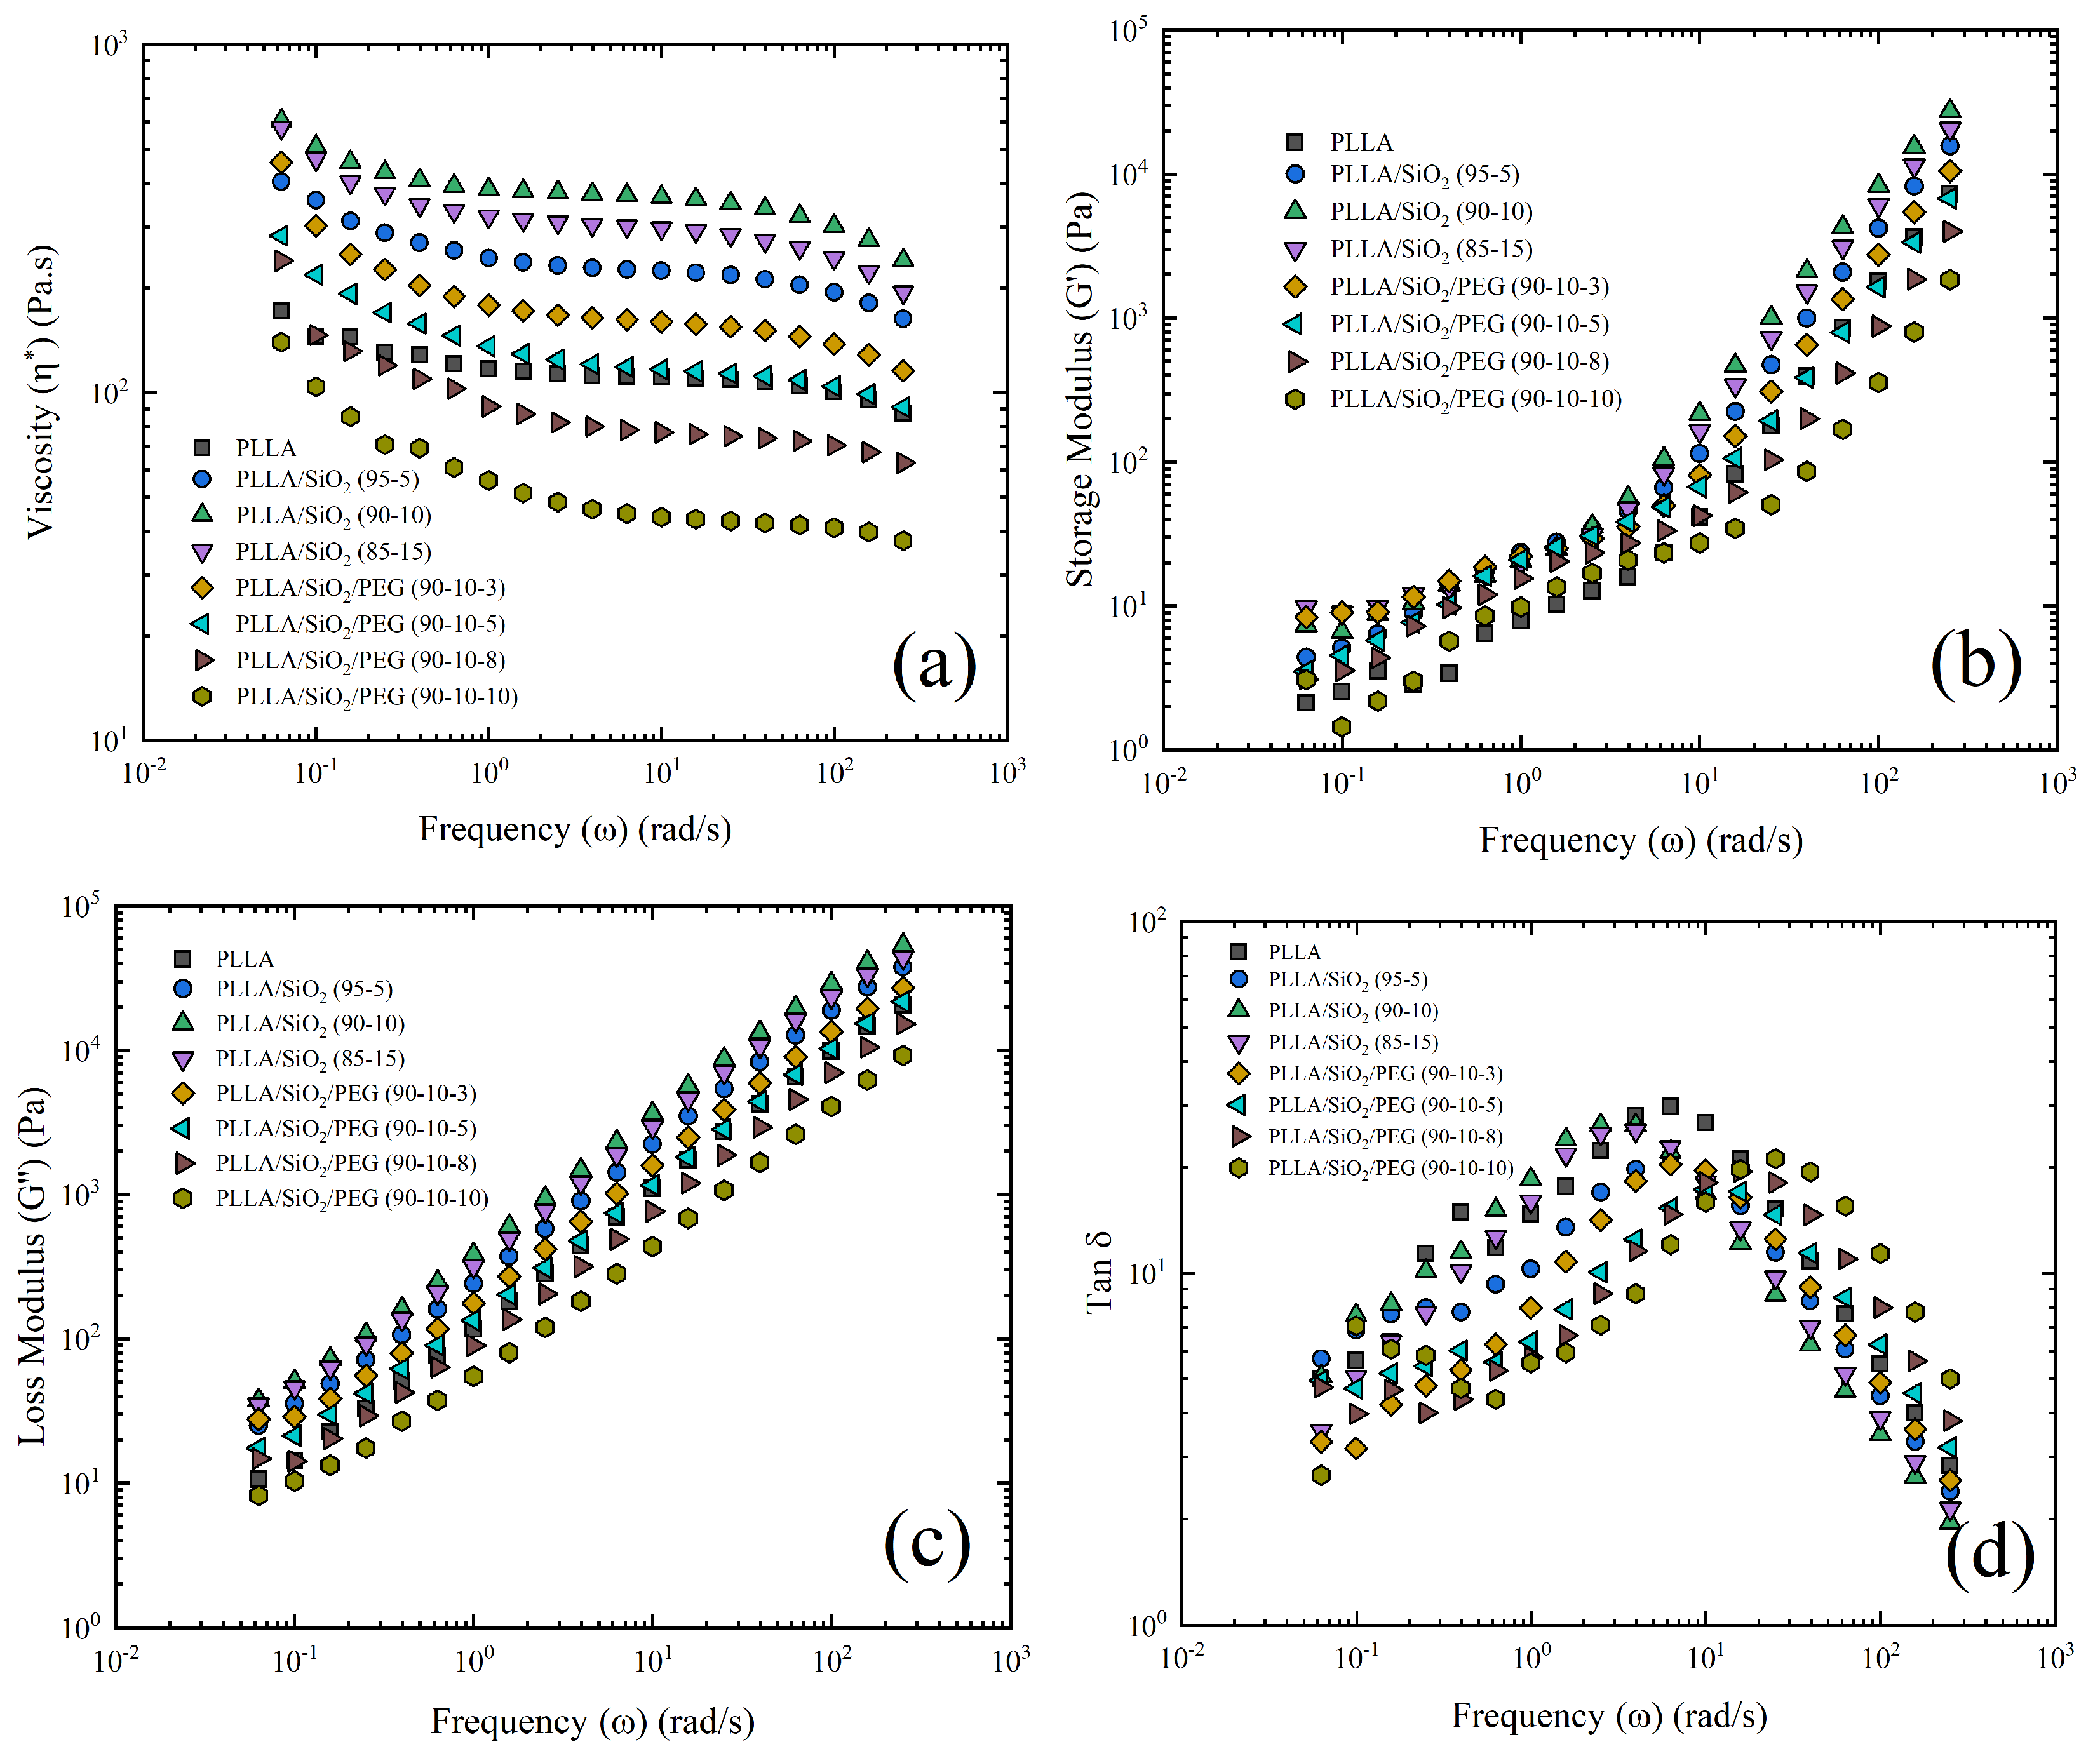
- SiO addition also increased the viscosity due to the disruption of the flow lines and more restrictions on the polymer chains’ mobility. However, for PEG, the values of (, G, and G) decreased improving fluidity.
- Incorporating 10 wt.% of SiO to PLLA, the tensile modulus increase (26%), while slightly decreasing (2.4%) the tensile strength. Nevertheless, composite with higher PEG content (10 wt.%) exhibited the optimum elongation at break (26%) contributing to a final balance between rigidity and deformation.
- According to gas permeation measurements, PLLA with 5 and 10 wt.% SiO exhibits an improvement in the PLLA’s barrier properties for O and CO, while increasing the permeability for H and CH. Due to the saturation of SiO and Si-O bonds on the surface of the polymeric matrix combined with increased crystallinity. However, the permeability for all gases decreased up to 62% for O with increasing PEG content since better SiO particle distribution was obtained (fewer defects), reducing the free volume and generating more resistance for the molecules to permeate (lower mass transfer) through the composites.
Supplementary Materials
Author Contributions
Funding
Data Availability Statement
Acknowledgments
Conflicts of Interest
References
- Madhavan Nampoothiri, K.; Nair, N.R.; John, R.P. An overview of the recent developments in polylactide (PLA) research. Bioresour. Technol. 2010, 101, 8493–8501. [Google Scholar] [CrossRef] [PubMed]
- Lunt, J. Large-scale production, properties and commercial applications of poly lactic acid polymers. Polym. Degrad. Stab. 1998, 59, 145–152. [Google Scholar] [CrossRef]
- Auras, R.; Harte, B.; Selke, S. An overview of polylactides as packaging materials. Macromol. Biosci. 2004, 4, 835–864. [Google Scholar] [CrossRef]
- He, Y.; Fan, Z.; Hu, Y.; Wu, T.; Wei, J.; Li, S. DSC analysis of isothermal melt-crystallization, glass transition and melting behavior of poly(l-lactide) with different molecular weights. Eur. Polym. J. 2007, 43, 4431–4439. [Google Scholar] [CrossRef]
- Drumright, R.E.; Gruber, P.R.; Henton, D.E. Polylactic acid technology. Adv. Mater. 2000, 12, 1841–1846. [Google Scholar] [CrossRef]
- Garlotta, D. A literature review of poly(lactic acid). J. Polym. Environ. 2001, 9, 63–84. [Google Scholar] [CrossRef]
- Stefaniak, K.; Masek, A. Green copolymers based on poly(Lactic acid)—Short review. Materials 2021, 14, 5254. [Google Scholar] [CrossRef] [PubMed]
- Lai, W.C.; Liau, W.B.; Lin, T.T. The effect of end groups of PEG on the crystallization behaviors of binary crystalline polymer blends PEG/PLLA. Polymer 2004, 45, 3073–3080. [Google Scholar] [CrossRef]
- Wypych, G. PLA poly(lactic acid). In Handbook of Polymers; Elsevier: Amsterdam, The Netherlands, 2012; pp. 436–440. [Google Scholar] [CrossRef]
- Farah, S.; Anderson, D.G.; Langer, R. Physical and mechanical properties of PLA, and their functions in widespread applications—A comprehensive review. Adv. Drug. Dev. Rev. 2016, 107, 367–392. [Google Scholar] [CrossRef]
- Buwalda, S.J.; Dijkstra, P.J.; Feijen, J. Poly(ethylene glycol)-poly(L-lactide) star block copolymer hydrogels crosslinked by metal-ligand coordination. J. Polym. Sci. Part A Polym. Chem. 2012, 50, 1783–1791. [Google Scholar] [CrossRef]
- Hasanuddin, N.I.; Mokhtar, W.N.A.W.; Othaman, R.; Anuar, F.H. Poly(lactic acid)-poly(ethylene glycol)/Magnesium Silicate Membrane for Methylene Blue Removal: Adsorption Behavior, Mechanism, Ionic Strength and Reusability Studies. Membranes 2022, 12, 198. [Google Scholar] [CrossRef] [PubMed]
- Long, H.; Wu, Z.; Dong, Q.; Shen, Y.; Zhou, W.; Luo, Y.; Zhang, C.; Dong, X. Effect of polyethylene glycol on mechanical properties of bamboo fiber-reinforced polylactic acid composites. J. Appl. Polym. Sci. 2019, 136, 3–10. [Google Scholar] [CrossRef]
- Prapruddivongs, C.; Apichartsitporn, M.; Wongpreedee, T. Effect of Commercial SiO2 and SiO2 from rice husk ash loading on biodegradation of Poly (lactic acid) and crosslinked Poly (lactic acid). IOP Conf. Ser. Mater. Sci. Eng. 2017, 244, 012007. [Google Scholar] [CrossRef]
- Athanasoulia, I.G.; Tarantili, P.A. Preparation and characterization of polyethylene glycol/poly(L-lactic acid) blends. Pure Appl. Chem. 2017, 89, 141–152. [Google Scholar] [CrossRef]
- Zubir, N.H.M.; Sam, S.T.; Zulkepli, N.N.; Omar, M.F. The effect of rice straw particulate loading and polyethylene glycol as plasticizer on the properties of polylactic acid/polyhydroxybutyrate-valerate blends. Polym. Bull. 2018, 75, 61–76. [Google Scholar] [CrossRef]
- Rahman, M.A.; De Santis, D.; Spagnoli, G.; Ramorino, G.; Penco, M.; Phuong, V.T.; Lazzeri, A. Biocomposites based on lignin and plasticized poly(L -lactic acid). J. Appl. Polym. Sci. 2013, 129, 202–214. [Google Scholar] [CrossRef]
- Zhang, Y.; Li, T.; Jin, Y.; Bao, L.; Feng, L.; Lai, C.; Wei, K. Thermo-regulated thermoplastic sugarcane bagasse-based biocomposite via solvent-free extrusion for energy-saving smart home. Chem. Eng. J. 2023, 458, 141437. [Google Scholar] [CrossRef]
- Li, T.; Zhang, Y.; Jin, Y.; Bao, L.; Dong, L.; Zheng, Y.; Xia, J.; Jiang, L.; Kang, Y.; Wang, J. Thermoplastic and biodegradable sugarcane lignin-based biocomposites prepared via a wholly solvent-free method. J. Clean. Prod. 2023, 386, 135834. [Google Scholar] [CrossRef]
- Mahmoud, M.; Zaghloul, Y.; Yousry, M.; Zaghloul, M.; Mahmoud, M.; Zaghloul, Y. Experimental and modeling analysis of mechanical-electrical behaviors of polypropylene composites fi lled with graphite and MWCNT fi llers. Polym. Test. 2017, 63, 467–474. [Google Scholar] [CrossRef]
- Mahmoud, M.; Zaghloul, Y.; Mohamed, Y.S. Fatigue and tensile behaviors of fiber-reinforced thermosetting composites embedded with nanoparticles. J. Compos. Mater. 2019, 53, 709–718. [Google Scholar] [CrossRef]
- Yousry, M.; Zaghloul, M.; Mahmoud, M.; Zaghloul, Y.; Mahmoud, M.; Zaghloul, Y. Physical analysis and statistical investigation of tensile and fatigue behaviors of glass fi ber-reinforced polyester via novel fi bers arrangement. J. Compos. Mater. 2023, 57, 147–166. [Google Scholar] [CrossRef]
- Mahmoud, M.; Zaghloul, Y.; Mahmoud, M.; Zaghloul, Y. Influence of flame retardant magnesium hydroxide on the mechanical properties of high density polyethylene composites. J. Reinf. Plast. Compos. 2017, 36, 1802–1816. [Google Scholar] [CrossRef]
- Mahmoud, M.; Mahmoud, Y. Mechanical properties of linear low-density polyethylene fi re-retarded with melamine polyphosphate. J. Appl. Polym. Sci. 2018, 46770, 1–12. [Google Scholar] [CrossRef]
- Yousry, M.; Zaghloul, M.; Mahmoud, M.; Zaghloul, Y.; Mahmoud, M.; Zaghloul, Y. Developments in polyester composite materials—An in-depth review on natural fibres and nano fillers. Compos. Struct. 2021, 278, 114698. [Google Scholar] [CrossRef]
- Fuseini, M.; Mahmoud, M.; Zaghloul, Y. Investigation of Electrophoretic Deposition of PANI Nano fibers as a Manufacturing Technology for corrosion protection. Prog. Org. Coatings 2022, 171, 107015. [Google Scholar] [CrossRef]
- Masnar, A.; Coorey, R. Application of sago pith waste and nanosilica from rice husk ash as hybrid bio-nanofiller composite for food plastic packaging. Bio. Food. Plast. Pack. 2017, 6, 618–631. [Google Scholar] [CrossRef]
- Vedernikov, A.; Safonov, A.; Tucci, F.; Carlone, P.; Akhatov, I. Analysis of spring-in deformation in L-shaped profiles pultruded at different pulling speeds: Mathematical simulation and experimental results. In Proceedings of the ESAFORM: 24th International Conference on Material Forming, Liège, Belgium, 14–16 April 2021. [Google Scholar] [CrossRef]
- Tucci, F.; Vedernikov, A. Design criteria for Pultruded Structural Elements. J. Compos. Mater. 2021, 3, 51–68. [Google Scholar] [CrossRef]
- Minchenkov, K.; Vedernikov, A.; Kuzminova, Y.; Gusev, S.; Sulimov, A.; Gulyaev, A.; Kreslavskaya, A.; Prosyanoy, I.; Xian, G.; Akhatov, I.; et al. Effects of the quality of pre-consolidated materials on the mechanical properties and morphology of Thermoplastic pultruded flat laminates. Compos. Commun. 2022, 35, 101281. [Google Scholar] [CrossRef]
- Zhou, P.; Li, C.; Bai, Y.; Dong, S.; Xian, G.; Vedernikov, A.; Akhatov, I.; Safonov, A.; Yue, Q. Durability study on the interlaminar shear behavior of glass-fibre reinforced polypropylene (GFRPP) bars for marine applications. Constr. Build. Mater. 2022, 349, 128694. [Google Scholar] [CrossRef]
- Madenci, E.; Özkılıç, Y.O.; Aksoylu, C.; Safonov, A. The effects of eccentric web openings on the compressive performance of pultruded GFRP boxes wrapped with GFRP and CFRP sheets. Polymers 2022, 14, 4567. [Google Scholar] [CrossRef]
- Ozkilic, Y.O.; Gemi, L.; Madenci, E.; Aksoylu, C.; Kalkan, I. Effect of the GFRP wrapping on the shear and bending Behavior of RC beams with GFRP encasement. Steel. Compos. Struct. 2022, 45, 193–204. [Google Scholar] [CrossRef]
- Desai, N.P.; Hubbell, J.A. Solution technique to incorporate polyethylene oxide and other water-soluble polymers into surfaces of polymeric biomaterials. Biomaterials 1991, 12, 144–153. [Google Scholar] [CrossRef] [PubMed]
- Jacobsen, S.; Fritz, H. Plasticizing polylactide—the effect of different plasticizers on the mechanical properties. Polym. Eng. Sci. 1999, 39, 1303–1310. [Google Scholar] [CrossRef]
- Sheth, M.; Kumar, R.A.; Dave, V. Biodegradable Polymer Blends of poly(lactic acid) and poly(ethylene glycol) PL. J. Appl. Polym. Sci. 2008, 66, 1495–1505. [Google Scholar] [CrossRef]
- Battegazzore, D.; Noori, A.; Frache, A. Natural wastes as particle filler for poly(lactic acid)-based composites. J. Compos. Mater. 2019, 53, 783–797. [Google Scholar] [CrossRef]
- Lohar, D.V.; Nikalje, A.M.; Damle, P.G. Development and testing of hybrid green polymer composite ( HGPC ) filaments of PLA reinforced with waste bio fillers. Mater. Today Proc. 2022, 62, 818–824. [Google Scholar] [CrossRef]
- Pavon, C.; Aldas, M.; Motoc, D.L.; Ferrandiz, S.; Juan, L. Behavior of 3D-Printed PLA Reinforced with CaCO3 Fillers from Natural Resources. Polymers 2022, 14, 2646. [Google Scholar] [CrossRef]
- Imam, M.A.; Jeelani, S.; Rangari, V.K. Thermal decomposition and mechanical characterization of poly (lactic acid) and potato starch blend reinforced with biowaste SiO2. J. Compos. Mater. 2019, 53, 2315–2334. [Google Scholar] [CrossRef]
- Kane, S.; Ryan, C. Biochar from food waste as a sustainable replacement for carbon black in upcycled or compostable composites. JCOMC 2022, 8, 100274. [Google Scholar] [CrossRef]
- Chougan, M.; Ghaffar, S.H.; Al-Kheetan, M.J.; Gecevicius, M. Wheat straw pre-treatments using eco-friendly strategies for enhancing the tensile properties of bio-based polylactic acid composites. Ind. Crop. Prod. 2020, 155, 112836. [Google Scholar] [CrossRef]
- Yiga, V.A.; Pagel, S.; Lubwama, M.; Epple, S.; Olupot, P.W.; Bonten, C. Development of fiber-reinforced polypropylene with NaOH pretreated rice and coffee husks as fillers: Mechanical and thermal properties. J. Thermoplast. Compos. Mater. 2020, 33, 1269–1291. [Google Scholar] [CrossRef]
- Yalçin, N.; Sevinç, V. Studies on silica obtained from rice husk. Ceram. Int. 2001, 27, 219–224. [Google Scholar] [CrossRef]
- Hernández-Olivares, F.; Elizabeth Medina-Alvarado, R.; Burneo-Valdivieso, X.E.; Rodrigo Zúñiga-Suárez, A. Short sugarcane bagasse fibers cementitious composites for building construction. Constr. Build. Mater. 2020, 247, 8–10. [Google Scholar] [CrossRef]
- Ahmed, W.; Siraj, S.; Al-Marzouqi, A.H. 3d printing pla waste to produce ceramic based particulate reinforced composite using abundant silica-sand: Mechanical properties characterization. Polymers 2020, 12, 2579. [Google Scholar] [CrossRef] [PubMed]
- Aydin, B.; Geyikçi, F. Effect of Silica Obtained From Rice Husk on the Structural and Thermal Properties of Polylactic Acid/Polyethylene Glycol Films. Mugla J. Sci. Technol. 2019, 5, 91–96. [Google Scholar] [CrossRef]
- Battegazzore, D.; Bocchini, S.; Alongi, J.; Frache, A. Rice husk as bio-source of silica: Preparation and characterization of PLA-silica bio-composites. RSC Adv. 2014, 4, 54703–54712. [Google Scholar] [CrossRef]
- Díez-Rodríguez, T.M.; Blázquez-Blázquez, E.; Martínez, J.C.; Pérez, E.; Cerrada, M.L. Composites of a PLA with SBA-15 mesoporous silica: Polymorphism and properties after isothermal cold crystallization. Polymer 2022, 241, 124515. [Google Scholar] [CrossRef]
- Opaprakasit, P.; Boonpa, S.; Jaikaew, N.; Petchsuk, A.; Tangboriboonrat, P. Preparation of surface-modified silica particles from rice husk ash and its composites with degradable polylactic acid. Macromol. Symp. 2015, 354, 48–54. [Google Scholar] [CrossRef]
- Soltani, N.; Bahrami, A.; Pech-Canul, M.I.; González, L.A. Review on the physicochemical treatments of rice husk for production of advanced materials. Chem. Eng. J. 2015, 264, 899–935. [Google Scholar] [CrossRef]
- Yiga, V. A.; Lubwama, M.; Olupot, P.W. Thermal stability of unmodified and alkali modified rice husks for flame retardant fiber reinforced PLA composites. J. Therm. Anal. Calorim. 2022, 147, 11049–11075. [Google Scholar] [CrossRef]
- Le Guen, M.J.; Hill, S.; Smith, D.; Theobald, B.; Gaugler, E.; Barakat, A.; Mayer-Laigle, C. Influence of Rice Husk and Wood Biomass Properties on the Manufacture of Filaments for Fused Deposition Modeling. Front. Chem. 2019, 7, 15–20. [Google Scholar] [CrossRef] [PubMed]
- Tipachan, C.; Gupta, R.K.; Agarwal, S.; Kajorncheappunngam, S. Flame retardant properties and thermal stability of polylactic acid filled with layered double hydroxide and rice husk ash silica. J. Polym. Environ. 2020, 28, 948–961. [Google Scholar] [CrossRef]
- Saeidlou, S.; Huneault, M.A.; Li, H.; Park, C.B. Poly(lactic acid) crystallization. Prog. Polym. Sci. 2012, 37, 1657–1677. [Google Scholar] [CrossRef]
- NatureWorks. Ingeo Biopolymer 4043D Technical Data Sheet; Technical Report 4; NatureWorks: Minnetonka, MN, USA, 2015. [Google Scholar]
- Barkhad, M.S.; Abu-jdayil, B.; Mourad, A.H.I.; Iqbal, M.Z. Thermal Insulation and Mechanical Properties of Polylactic Acid (PLA) at Different Processing Conditions. Polymers 2020, 12, 2091. [Google Scholar] [CrossRef]
- Yu, W.; Wang, X.; Ferraris, E.; Zhang, J. Melt crystallization of PLA/Talc in fused fi lament fabrication. Mater. Des. 2019, 182, 108013. [Google Scholar] [CrossRef]
- Yussuf, A.A.; Massoumi, I.; Hassan, A. Comparison of polylactic Acid/Kenaf and polylactic Acid/Rise husk composites: The influence of the natural fibers on the mechanical, thermal and biodegradability properties. J. Polym. Environ. 2010, 18, 422–429. [Google Scholar] [CrossRef]
- Jia, S.; Yu, D.; Zhu, Y.; Wang, Z.; Chen, L.; Fu, L. Morphology, Crystallization and Thermal Behaviors of PLA-Based Composites: Wonderful Effects of Hybrid GO/PEG via Dynamic Impregnating. Polymers 2017, 9, 528. [Google Scholar] [CrossRef]
- Lorenzo, A.T.; Arnal, M.L.; Albuerne, J.; Müller, A.J. DSC isothermal polymer crystallization kinetics measurements and the use of the Avrami equation to fit the data: Guidelines to avoid common problems. Polym. Test. 2007, 26, 222–231. [Google Scholar] [CrossRef]
- Chen, X.; Rodrigue, D.; Kaliaguine, S. Diamino-organosilicone APTMDS: A new cross-linking agent for polyimides membranes. Sep. Purif. Technol. 2012, 86, 221–233. [Google Scholar] [CrossRef]
- Müller, A.J.; Ávila, M.; Saenz, G.; Salazar, J. Crystallization of PLA-based Materials. In Poly(Lactic Acid) Science and Technology: Processing; Royal Society of Chemistry: London, UK, 2014; pp. 66–100. [Google Scholar]
- Mohapatra, A.K.; Mohanty, S.; Nayak, S.K. Properties and characterization of biodegradable poly(lactic acid) (pla)/poly(ethylene glycol) (PEG) and PLA/Peg/Organoclay. J. Thermoplast. Comp. Mater. 2014, 29, 443–463. [Google Scholar] [CrossRef]
- Li, Y.; Li, X.; Xiang, F.; Huang, T.; Wang, Y.; Wu, J.; Zhou, Z. Crystallization, rheological, and mechanical properties of PLLA/PEG blend with multiwalled carbon nanotubes. Polym. Adv. Technol. 2011, 22, 1959–1970. [Google Scholar] [CrossRef]
- Nagarajan, V.; Mohanty, A.K.; Misra, M. Crystallization behavior and morphology of polylactic acid (PLA) with aromatic sulfonate derivative. J. Appl. Polym. Sci. 2016, 133, 1–11. [Google Scholar] [CrossRef]
- Michell, R.M.; Müller, A.J.; Spasova, M.; Dubois, P.; Burattini, S.; Greenland, B.W.; Hamley, I.W.; Hermida-Merino, D.; Cheval, N.; Fahmi, A. Crystallization and stereocomplexation behavior of poly(D- and L-lactide)-b-poly(N,N-dimethylamino-2-ethyl methacrylate) block copolymers. J. Polym. Sci. Part B Polym. Phys. 2011, 49, 1397–1409. [Google Scholar] [CrossRef]
- Tarani, E.; Pušnik Črešnar, K.; Zemljič, L.F.; Chrissafis, K.; Papageorgiou, G.Z.; Lambropoulou, D.; Zamboulis, A.; Bikiaris, D.N.; Terzopoulou, Z. Cold crystallization kinetics and thermal degradation of pla composites with metal oxide nanofillers. Appl. Sci. 2021, 11, 3004. [Google Scholar] [CrossRef]
- Yasuniwa, M.; Tsubakihara, S.; Sugimoto, Y.; Nakafuku, C. Thermal analysis of the double-melting behavior of poly(L-lactic acid). J. Polym. Sci. Part B Polym. Phys. 2004, 42, 25–32. [Google Scholar] [CrossRef]
- Tábi, T.; Sajó, I.E.; Szabó, F.; Luyt, A.S.; Kovács, J.G. Crystalline structure of annealed polylactic acid and its relation to processing. Express Polym. Lett. 2010, 4, 659–668. [Google Scholar] [CrossRef]
- Park, B.S.; Song, J.C.; Park, D.H.; Yoon, K.B. PLA/chain-extended PEG blends with improved ductility. J. Appl. Polym. Sci. 2011, 123, 2360–2367. [Google Scholar] [CrossRef]
- Saravana, S.; Bheemaneni, G.; Kandaswamy, R. Effect of polyethylene glycol on mechanical, thermal, and morphological properties of talc reinforced polylactic acid composites. Mater. Today. Proc. 2018, 5, 1591–1598. [Google Scholar] [CrossRef]
- Li, D.; Jiang, Y.; Lv, S.; Liu, X.; Gu, J.; Chen, Q.; Zhang, Y. Preparation of plasticized poly (lactic acid) and its influence on the properties of composite materials. PLoS ONE 2018, 13, e0193520. [Google Scholar] [CrossRef]
- Iannace, S.N. Isothermal Crystallization and Chain Mobility of Poly(L-lactide). J. Appl. Polym. Sci. 1996, 64, 911–919. [Google Scholar] [CrossRef]
- Pyda, M.; Bopp, R.C.; Wunderlich, B. Heat capacity of poly(lactic acid). J. Chem. Thermodyn. 2004, 36, 731–742. [Google Scholar] [CrossRef]
- Vasanthakumari, R.; Pennings, A.J. Crystallization kinetics of poly(l-lactic acid). Polymer 1983, 24, 175–178. [Google Scholar] [CrossRef]
- Marand, H.; Xu, J.; Srinivas, S. Determination of the equilibrium melting temperature of polymer crystals: Linear and nonlinear Hoffman-Weeks extrapolations. Macromolecules 1998, 31, 8219–8229. [Google Scholar] [CrossRef]
- Karimi, S.; Ghasemi, I.; Abbassi-Sourki, F. A study on the crystallization kinetics of PLLA in the presence of Graphene Oxide and PEG-grafted-Graphene Oxide: Effects on the nucleation and chain mobility. Compos. Part B Eng. 2019, 158, 302–310. [Google Scholar] [CrossRef]
- Avrami, M. Granulation, phase change, and microstructure kinetics of phase change. III. J. Chem. Phys. 1941, 9, 177–184. [Google Scholar] [CrossRef]
- Zhou, W.Y.; Duan, B.; Wang, M.; Cheung, W.L. Isothermal and Non-isothermal Crystallization Kinetics of Poly(L-Lactide)/Carbonated Hydroxyapatite Nanocomposite Microspheres. In Advances in Diverse Industrial Applications of Nanocomposites; Reddy, B., Ed.; IntechOpen: Rijeka, Croatia, 2011; Chapter 11; pp. 231–260. [Google Scholar] [CrossRef]
- Song, R.; Xue, R.; He, L.H.; Liu, Y.; Xiao, Q.L. the Structure and Properties of Chitosan / Polyethylene. Polym. Sci. 2008, 26, 621–630. [Google Scholar]
- Di Lorenzo, M.L. Determination of spherulite growth rates of poly(L-lactic acid) using combined isothermal and non-isothermal procedures. Polymer 2001, 42, 9441–9446. [Google Scholar] [CrossRef]
- Hoffman, J.D. Regime III crystallization in melt-crystallized polymers: The variable cluster model of chain folding. Polymer 1983, 24, 3–26. [Google Scholar] [CrossRef]
- Wu, D.; Wu, L.; Wu, L.; Xu, B.; Zhang, Y.; Zhang, M. Nonisothermal Cold Crystallization Behavior and Kinetics of Polylactide/Clay Nanocomposites. J. Polym. Sci. Part B. Polym. Phys. 2007, 45, 1100–1113. [Google Scholar] [CrossRef]
- Miyata, T.; Masuko, T. Crystallization Behavior of Poly(L-Lactide); Elsevier: Amsterdam, The Netherlands, 1997; pp. 745–748. [Google Scholar]
- Song, Y.; Wang, D.; Jiang, N.; Gan, Z. Role of PEG Segment in Stereocomplex Crystallization for PLLA/PDLA-b-PEG-b-PDLA Blends. ACS Sustain. Chem. Eng. 2015, 3, 1492–1500. [Google Scholar] [CrossRef]
- Nazari, T.; Garmabi, H. Thermo-rheological and interfacial properties of polylactic acid/polyethylene glycol blends toward the melt electrospinning ability. J. Appl. Polym. Sci. 2016, 133, 1–11. [Google Scholar] [CrossRef]
- Mandelkern, L. Crystallization of Polymers; Cambridge University Press: Cambridge, UK, 2004; pp. 217–281. [Google Scholar]
- Zhang, J.; Wang, S.; Zhao, D.; Zhang, Y.; Pang, W.; Zhang, B.; Li, Q. Improved processability and performance of biomedical devices with poly(lactic acid)/poly(ethylene glycol) blends. J. Appl. Polym. Sci. 2017, 134, 45194. [Google Scholar] [CrossRef]
- Chrysafi, I.; Ainali, N.M.; Bikiaris, D.N. Thermal degradation mechanism and decomposition kinetic studies of poly(lactic acid) and its copolymers with poly(hexylene succinate). Polymers 2021, 13, 1365. [Google Scholar] [CrossRef] [PubMed]
- Zou, H.; Yi, C.; Wang, L.; Liu, H.; Xu, W. Thermal degradation of poly(lactic acid) measured by thermogravimetry coupled to Fourier transform infrared spectroscopy. J. Thermal. Anal. Calor. 2009, 97, 929–935. [Google Scholar] [CrossRef]
- Henrique, P.; Cardoso, M.; Ferreira, M.; Oliveira, L.D.; De, M.; Mara, R. 3D Printed Parts of Polylactic Acid Reinforced with Carbon Black and Alumina Nanofillers for Tribological Applications. Macromol. Symp. 2020, 394, 2000155. [Google Scholar] [CrossRef]
- Salleh, F.M.; Hassan, A.; Yahya, R.; Azzahari, A.D. Effects of extrusion temperature on the rheological, dynamic mechanical and tensile properties of kenaf fiber/HDPE composites. Compos. Part B 2014, 58, 259–266. [Google Scholar] [CrossRef]
- Liu, Y.; Shao, J.; Sun, J.; Bian, X.; Feng, L.; Xiang, S.; Sun, B.; Chen, Z.; Li, G.; Chen, X. Improved mechanical and thermal properties of PLLA by solvent blending with PDLA-b-PEG-b-PDLA. Polym. Degrad. Stab. 2014, 101, 10–17. [Google Scholar] [CrossRef]
- Zhao, P.; Liu, Z.; Wang, X.; Pan, Y.T.; Kuehnert, I.; Gehde, M.; Wang, D.Y.; Leuteritz, A. Renewable vanillin based flame retardant for poly(lactic acid): A way to enhance flame retardancy and toughness simultaneously. RSC Adv. 2018, 8, 42189–42199. [Google Scholar] [CrossRef]
- Zhang, Q.; Mochalin, V.N.; Neitzel, I.; Hazeli, K.; Niu, J.; Kontsos, A.; Zhou, J.G.; Lelkes, P.I.; Gogotsi, Y. Mechanical properties and biomineralization of multifunctional nanodiamond-PLLA composites for bone tissue engineering. Biomaterials 2012, 33, 5067–5075. [Google Scholar] [CrossRef]
- Alberton, J.; Martelli, S.M.; Fakhouri, F.M.; Soldi, V. Mechanical and moisture barrier properties of titanium dioxide nanoparticles and halloysite nanotubes reinforced polylactic acid (PLA). IOP Conf. Ser. Mater. Sci. Eng. 2014, 64, 012010. [Google Scholar] [CrossRef]
- Hong, Z.; Zhang, P.; He, C.; Qiu, X.; Liu, A.; Chen, L.; Chen, X.; Jing, X. Nano-composite of poly(L-lactide) and surface grafted hydroxyapatite: Mechanical properties and biocompatibility. Biomaterials 2005, 26, 6296–6304. [Google Scholar] [CrossRef] [PubMed]
- García, M.G.; Marchese, J.; Ochoa, N.A. Effect of the Particle Size and Particle Agglomeration on Composite Membrane Performance. J. Appl. Polym. Sci. 2010, 118, 2417–2424. [Google Scholar] [CrossRef]
- Ashraf, M.A.; Peng, W.; Zare, Y.; Rhee, K.Y. Effects of Size and Aggregation/Agglomeration of Nanoparticles on the Interfacial/Interphase Properties and Tensile Strength of Polymer Nanocomposites. Nanoscale Res. Lett. 2018, 13, 214. [Google Scholar] [CrossRef]
- Yang, H.Y.; Wang, Z.; Chen, L.Y.; Shu, S.L.; Qiu, F. Interface formation and bonding control in high-volume-fraction (TiC + TiB2)/ Al composites and their roles in enhancing properties. Compos. Part B 2021, 209, 108605. [Google Scholar] [CrossRef]
- Das, K.; Ray, S.S.; Chapple, S.; Wesley-smith, J. Mechanical, Thermal, and Fire Properties of Biodegradable Polylactide/Boehmite Alumina Composites. Ind. Eng. Chem. Res. 2013, 52, 6083–6091. [Google Scholar] [CrossRef]
- Dong, T.; Song, S.; Liang, M.; Wang, Y.; Qi, X.; Zhang, Y.; Yun, X.; Jin, Y. Gas Permeability and Permselectivity of Poly(L-Lactic Acid)/SiOx Film and Its Application in Equilibrium-Modified Atmosphere Packaging for Chilled Meat. J. Food Sci. 2017, 82, 97–107. [Google Scholar] [CrossRef] [PubMed]
- Lee, J.S.; Kim, J.W. Effect of cooling rate on mechanical properties of carbon fibre fabric and polypropylene composites. Mater. Res. Express 2017, 4, 095304. [Google Scholar] [CrossRef]
- Lee, W.I.; Talbott, M.F.; Springer, G.S.; Berglund, L.A. Effects of Cooling Rate on the Crystallinity and Mechanical Properties of Thermoplastic Composites. J. Reinf. Plast. Compos. 1987, 6, 2–12. [Google Scholar] [CrossRef]
- Jia, Z.; Zhang, K.; Tan, J.; Han, C.; Dong, L.; Yang, Y. Crystallization Behavior and Mechanical Properties of Crosslinked Plasticized Poly(L-lactic acid). Appl. Polym. Sci. 2008, 111, 1531–1539. [Google Scholar] [CrossRef]
- Huang, S.; Li, H.; Jiang, S.; Chen, X.; An, L. Crystal structure and morphology influenced by shear effect of poly(l-lactide) and its melting behavior revealed by WAXD, DSC and in situ POM. Polymer 2011, 52, 3478–3487. [Google Scholar] [CrossRef]
- Yampolskii, Y. Polymeric gas separation membranes. Macromolecules 2012, 45, 3298–3311. [Google Scholar] [CrossRef]
- Kathuria, A.; Al-Ghamdi, S.; Abiad, M.G.; Auras, R. The influence of Cu3(BTC)2 metal organic framework on the permeability and perm-selectivity of PLLA-MOF mixed matrix membranes. J. Appl. Polym. Sci. 2015, 132, 1–10. [Google Scholar] [CrossRef]
- Lizundia, E.; Vilas, J.L.; Sangroniz, A.; Etxeberria, A. Light and gas barrier properties of PLLA/metallic nanoparticles composite films. Eur. Polym. J. 2017, 91, 10–20. [Google Scholar] [CrossRef]
- Sangeetha, V.H.; Deka, H.; Varghese, T.O.; Nayak, S.K. State of the Art and Future Prospectives of Poly (Lactic Acid) Based Blends and Composites; Wiley Online Library: Hoboken, NJ, USA, 2016; pp. 1–21. [Google Scholar] [CrossRef]
- Rajeshkumar, G.; Arvindh Seshadri, S.; Devnani, G.; Sanjay, M.; Siengchin, S.; Prakash Maran, J.; Al-Dhabi, N.A.; Karuppiah, P.; Mariadhas, V.A.; Sivarajasekar, N.; et al. Environment friendly, renewable and sustainable poly lactic acid (PLA) based natural fiber reinforced composites—A comprehensive review. J. Clean. Prod. 2021, 310, 127483. [Google Scholar] [CrossRef]
- Kaseem, M.; Rehman, Z.U.; Hossain, S.; Singh, A.K.; Dikici, B. A Review on Synthesis, Properties, and Applications of Polylactic Acid/Silica Composites. Polymers 2021, 13, 3036. [Google Scholar] [CrossRef] [PubMed]


| Property | Value | ASTM Method |
|---|---|---|
| Relative viscosity | 4.0 | D5225 |
| Peak melt temperature | 145–160 °C | D3418 |
| Glass transition temperature | 55–60 °C | D3418 |
| Tensile yield strength | 8700 (60) psi (MPa) | D882 |
| Tensile strength at break | 7700 (53) psi (MPa) | D882 |
| Tensile modulus | 524,000 (3.6) psi (MPa) | D882 |
| Tensile elongation | 6% | D882 |
| Property | Value |
|---|---|
| Density | 1.2 g/cm at 20 °C |
| Peak melt temperature | 145–160 °C |
| Melting range | 59–64 °C |
| Hydroxyl value | 16–23 |
| Average molecular mass | 5000–7000 g/mol |
| Property | Value |
|---|---|
| Average particle size | 10–40 µm |
| Content of carbon (C) | 21.25% of mass |
| Content of oxygen (O) | 45.41% of mass |
| Content of silicon (Si) | 33.34% of mass |
| Samples | PLLA (wt.%) | SiO (wt.%) | PEG (wt.%) |
|---|---|---|---|
| PLLA | 100 | - | - |
| PLLA/SiO (95/5) | 95 | 5 | - |
| PLLA/SiO (90/10) | 90 | 10 | - |
| PLLA/SiO (85/15) | 85 | 15 | - |
| PLLA/SiO/PEG (90/10/3) | 90 | 10 | 3 |
| PLLA/SiO/PEG (90/10/5) | 90 | 10 | 5 |
| PLLA/SiO/PEG (90/10/8) | 90 | 10 | 8 |
| PLLA/SiO/PEG (90/10/10) | 90 | 10 | 10 |
| Sample | T (°C) | H (J/g) | T (°C) | T (°C) | H (J/g) | X (%) |
|---|---|---|---|---|---|---|
| PLLA | 118.0 | −23.8 | 59.9 | 150.1/155.1 | 26.9 | 3.4 |
| PLLA/SiO (95/5) | 118.7 | −25.2 | 59.9 | 150.2/155.0 | 27.2 | 2.3 |
| PLLA/SiO (90/10) | 116.1 | −22.5 | 59.9 | 149.5/155.1 | 26.4 | 4.6 |
| PLLA/SiO (85/15) | 125.2 | −17.6 | 61.8 | 153.8 | 21.3 | 4.7 |
| PLLA/SiO/PEG (90/10/3) | 115.0 | −23.3 | 58.8 | 149.1/155.2 | 25.2 | 2.3 |
| PLLA/SiO/PEG (90/10/5) | 109.5 | −24.6 | 56.3 | 147.6/155.5 | 27.6 | 3.8 |
| PLLA/SiO/PEG (90/10/8) | 101.8 | −23.2 | 51.2 | 144.3/153.8 | 28.2 | 6.4 |
| PLLA/SiO/PEG (90/10/10) | 99.8 | −23.3 | 49.6 | 143.8/153.7 | 28.2 | 6.5 |
| Samples | T (°C) | (-) |
|---|---|---|
| PLLA | 180 | 2.4 |
| PLLA/SiO (95/5) | 180 | 2.4 |
| PLLA/SiO (90/10) | 175 | 2.6 |
| PLLA/SiO (85/15) | 184 | 2.4 |
| PLLA/SiO/PEG (90/10/3) | 169 | 3.2 |
| PLLA/SiO/PEG (90/10/5) | 198 | 1.9 |
| PLLA/SiO/PEG (90/10/8) | 199 | 1.9 |
| PLLA/SiO/PEG (90/10/10) | 215 | 1.7 |
| Sample | K 10 | 10 (J/m) | q (kJ/mol) | Regime |
|---|---|---|---|---|
| PLLA | 9.67 | 96.9 | 36.0 | III |
| PLLA/SiO (95/5) | 8.36 | 83.8 | 31.1 | III |
| PLLA/SiO (90/10) | 5.75 | 57.7 | 21.4 | III |
| PLLA/SiO (85/15) | 8.03 | 80.5 | 29.9 | III |
| PLLA/SiO/PEG (90/10/3) | 5.18 | 51.9 | 19.2 | III |
| PLLA/SiO/PEG (90/10/5) | 6.17 | 61.9 | 23.0 | III |
| PLLA/SiO/PEG (90/10/8) | 4.54 | 45.5 | 16.9 | III |
| PLLA/SiO/PEG (90/10/10) | 5.18 | 51.9 | 19.2 | III |
| Sample | T (°C) | T (°C) | T (°C) | Total Loss (%) |
|---|---|---|---|---|
| PLLA | 9.67 | 96.9 | 36.0 | 98.8 |
| PLLA/SiO (95/5) | 8.36 | 83.8 | 31.1 | 94.7 |
| PLLA/SiO (90/10) | 5.75 | 57.7 | 21.4 | 91.7 |
| PLLA/SiO (85/15) | 8.03 | 80.5 | 29.9 | 91.2 |
| PLLA/SiO/PEG (90/10/3) | 5.18 | 51.9 | 19.2 | 90.8 |
| PLLA/SiO/PEG (90/10/5) | 6.17 | 61.9 | 23.0 | 91.1 |
| PLLA/SiO/PEG (90/10/8) | 4.54 | 45.5 | 16.9 | 90.3 |
| PLLA/SiO/PEG (90/10/10) | 5.18 | 51.9 | 19.2 | 89.3 |
| Sample | E (kJ/mol) | n | Ln(A) | R |
|---|---|---|---|---|
| PLLA | 201.6 | 1.3 | 39.18 | 0.992 |
| PLLA/SiO (95/5) | 212.2 | 1.7 | 41.02 | 0.993 |
| PLLA/SiO (90/10) | 247.9 | 1.1 | 47.83 | 0.995 |
| PLLA/SiO (85/15) | 218.7 | 1.3 | 42.35 | 0.990 |
| PLLA/SiO/PEG (90/10/3) | 241.4 | 1.2 | 46.56 | 0.992 |
| PLLA/SiO/PEG (90/10/5) | 227.8 | 1.2 | 44.07 | 0.994 |
| PLLA/SiO/PEG (90/10/8) | 214.7 | 1.0 | 41.76 | 0.993 |
| PLLA/SiO/PEG (90/10/10) | 156.4 | 0.9 | 30.68 | 0.994 |
| Sample | XRD (Xc%) | DSC (Xc%) |
|---|---|---|
| PLLA | 33.5 | 3.4 |
| PLLA/SiO (95/5) | 30.9 | 2.3 |
| PLLA/SiO (90/10) | 30.9 | 4.6 |
| PLLA/SiO (85/15) | 29.4 | 4.7 |
| PLLA/SiO/PEG (90/10/3) | 30.9 | 2.3 |
| PLLA/SiO/PEG (90/10/5) | 31.0 | 3.8 |
| PLLA/SiO/PEG (90/10/8) | 33.6 | 6.4 |
| PLLA/SiO/PEG (90/10/10) | 30.6 | 6.5 |
| Permeability (cm cm cm s cmHg) | Selectivity (-) | |||||||
|---|---|---|---|---|---|---|---|---|
| Sample | O | CO | H | CH | H/O | CH/CO | H/CO | H/CH |
| PLLA | 9.36 | 7.49 | 5.56 | 6.53 | 1.68 | 1.15 | 1.35 | 1.17 |
| PLLA/SiO (95/5) | 7.30 | 6.98 | 9.04 | 9.07 | 1.24 | 1.30 | 1.30 | 1.00 |
| PLLA/SiO (90/10) | 6.34 | 6.73 | 10.1 | 8.17 | 1.59 | 1.21 | 1.50 | 1.24 |
| PLLA/SiO (85/15) | 6.46 | 4.98 | 7.26 | 5.61 | 1.12 | 1.13 | 1.46 | 1.29 |
| PLLA/SiO/PEG (90/10/3) | 4.45 | 4.69 | 5.84 | 5.60 | 1.31 | 1.19 | 1.25 | 1.04 |
| PLLA/SiO/PEG (90/10/5) | 4.41 | 4.60 | 6.02 | 4.01 | 1.37 | 1.15 | 1.31 | 1.50 |
| PLLA/SiO/PEG (90/10/8) | 4.80 | 4.98 | 6.10 | 6.11 | 1.27 | 1.23 | 1.22 | 1.00 |
| PLLA/SiO/PEG (90/10/10) | 3.56 | 3.76 | 4.02 | 5.48 | 1.13 | 1.46 | 1.07 | 1.36 |
Disclaimer/Publisher’s Note: The statements, opinions and data contained in all publications are solely those of the individual author(s) and contributor(s) and not of MDPI and/or the editor(s). MDPI and/or the editor(s) disclaim responsibility for any injury to people or property resulting from any ideas, methods, instructions or products referred to in the content. |
© 2023 by the authors. Licensee MDPI, Basel, Switzerland. This article is an open access article distributed under the terms and conditions of the Creative Commons Attribution (CC BY) license (https://creativecommons.org/licenses/by/4.0/).
Share and Cite
Morales, J.; Michell, R.M.; Sommer-Márquez, A.; Rodrigue, D. Effect of Biobased SiO2 on the Morphological, Thermal, Mechanical, Rheological, and Permeability Properties of PLLA/PEG/SiO2 Biocomposites. J. Compos. Sci. 2023, 7, 150. https://doi.org/10.3390/jcs7040150
Morales J, Michell RM, Sommer-Márquez A, Rodrigue D. Effect of Biobased SiO2 on the Morphological, Thermal, Mechanical, Rheological, and Permeability Properties of PLLA/PEG/SiO2 Biocomposites. Journal of Composites Science. 2023; 7(4):150. https://doi.org/10.3390/jcs7040150
Chicago/Turabian StyleMorales, Johanna, Rose Mary Michell, Alicia Sommer-Márquez, and Denis Rodrigue. 2023. "Effect of Biobased SiO2 on the Morphological, Thermal, Mechanical, Rheological, and Permeability Properties of PLLA/PEG/SiO2 Biocomposites" Journal of Composites Science 7, no. 4: 150. https://doi.org/10.3390/jcs7040150
APA StyleMorales, J., Michell, R. M., Sommer-Márquez, A., & Rodrigue, D. (2023). Effect of Biobased SiO2 on the Morphological, Thermal, Mechanical, Rheological, and Permeability Properties of PLLA/PEG/SiO2 Biocomposites. Journal of Composites Science, 7(4), 150. https://doi.org/10.3390/jcs7040150