Article

Electrochemical Oxidation of Phenol Released from Spent Coordination Polymer Impregnated with Ionic Liquid

by
Nicoleta Plesu
1,*,
Bianca Maranescu
1,2,
Milica Tara-Lunga Mihali
1 and
Aurelia Visa
1,*
1
“Coriolan Dragulescu” Institute of Chemistry, Romanian Academy, 24 Mihai Viteazu Bv., 300223 Timisoara, Romania
2
Faculty of Chemistry, Biology, Geography, West University of Timisoara, 16 Pestalozzi Street, 300115 Timisoara, Romania
*
Authors to whom correspondence should be addressed.
J. Compos. Sci. 2023, 7(12), 510; https://doi.org/10.3390/jcs7120510
Submission received: 25 October 2023 / Revised: 15 November 2023 / Accepted: 5 December 2023 / Published: 7 December 2023
(This article belongs to the Section Metal Composites)

Abstract

:
Coordination polymer (CP)-type adsorbents impregnated with ionic liquids that are used to remove phenol from wastewater must be regenerated. A simple washing of the adsorbent releases about 70% from the spent adsorbent. In order to increase and study the phenol release, an electrochemical method was used. For this purpose, an electrochemical commercial graphite electrode was used as the working electrode, and the electrolyte support was a 3% NaCl solution. During the electrochemical investigation, the spent CP was immersed in a saline solution. The PH content in the electrolyte affected the direct electrooxidation (EO); the formation of BQ appeared to be accelerated by a lower concentration and a slower release of PH. After 90 min, an efficiency of PH electrooxidation (EOPH) of 36.22% from Cu-PA and EOPH of 42.14% from Cu-PA-IL, respectively, was achieved. These results were significantly higher than the EOPH of the solution resulting from washing the wasted adsorbent with a saline solution (22.58%). This work highlights the potential for the simultaneous electrooxidation of desorbed PH and the recovery of spent adsorbent in this situation. The number of cycles in which the adsorbent can be used without losing its absorbance ability is three.

1. Introduction

The effectiveness and cost-effectiveness of employing adsorbents to remove dangerous organic compounds from water have significantly been improved during the past few decades. The recovery of dangerous organic compounds from the desorbing agents and the recycling of spent adsorbents, however, has received little attention. From pollutants, phenol is very toxic, yet it is widely used in industries [1]. Suitable adsorbents for dangerous organic compounds from water are coordination polymers (CPs), which are a class of compounds consisting of metal ions or clusters coordinated to organic ligands to form one-, two-, or three-dimensional structures. A method for cleanup that shows promise is the electrochemical oxidation (EO) of potentially dangerous organic compounds. Phenols (PHs) that are present in industrial effluents are hazardous and have issues with bioaccumulation even at low concentrations. Chemical companies and the food industry produce effluents that contain phenolic chemicals. Electrochemical processes used to treat pollutants from wastewater have many advantages, such as versatility, high energy efficiency, and safety. The EO of pollutants (for example, phenol) is commonly performed directly or indirectly as a result of the electrogeneration of some active species on the surface of the anode, such as “active oxygen”, i.e., the hydroxyl radical •OH or hypochlorite [2,3]. Depending on the conditions, this radical can be oxidized either by producing polymers or quinones. While the creation of quinones is preferred for low phenol concentrations and basic media, polymerization is preferred for high phenol concentrations and basic media [4].
Electrochemical oxidation technology has become a promising method for removing toxic substances and treating wastewater with organic content due to its simplicity and ease of control. In the electrochemical oxidation process, pollutants can be mineralized by hydroxyl radicals that form on the anode surface or can be oxidized directly on the anode surface. The main disadvantages of this electrochemical process are the blocking of the electrode surface, its short lifetime, its low efficiency, and the high cost of the anodes [5]. Thus, a wide variety of materials have been tested, e.g., graphite, platinum, and mixed-metal oxide (MMO anodes, such as titanium, with several types of metal oxides (RuO2, IrO2 or PtO2) and boron-doped diamond (BDD)), which have been described in the literature [6,7,8,9,10]. Among all materials, PbO2 and BDD, which have a high oxygen overpotential [11], have become very attractive electrodes. There are also some limitations, as the expensiveness of the BDD anode restricts its extensive usability. Therefore, PbO2 electrodes have become favored due to their low cost, high electrical conductivity, good overpotential, and chemical inertness [12,13].
The practical application of EO is restricted by the deposition of intermediates on the electrodes, which reduces the reaction yield. For instance, the electrooxidation of organic compounds on a BDD electrode provides improved yields [14].
In particular, in addition to the organic pollutants themselves, anions (e.g., Cl, SO42−) in the wastewater are another factor that affects the electrode and can increase or decrease its corrosion. In the advanced EO process, oxidation is principally mediated by active intermediates such as hydroxyl radicals (OH) and active chlorine (e.g., Cl, Cl2, HClO). This has been reported for most electrolyte-supported electrode systems tested for phenol electrooxidation [14,15,16,17].
The mechanism of EO is also influenced by anode potential and current density. The concentration of •OH radicals rise with increasing pH. Nevertheless, high pH values promote the formation of free radicals that will react with phenols [18].
EO efficiency and by-product generation rates strongly depend on electrode properties. Electrodes can be classified as active and inactive electrodes [19]. The behavior of electrodes can be judged from the analysis of cyclic voltammetry (CV). If the recorded oxidation current is high, the reaction is fast. In a CV analysis of active electrodes, the sharp increase in current usually occurs at 1.5 V vs. reversible hydrogen electrode (RHE). These water oxidation onset potentials are a little higher than theoretical (1.23 V vs. RHE). Active electrodes have low overpotentials for oxygen evolution. The generation of oxidants requires high anodic potential. Unfortunately, at such high anodic potential, chloride ions, which are ubiquitous in natural water systems, will be readily oxidized to free chlorine (HClO/OCl; pKa 7.5) and then further oxidized to perchlorate (ClO4−). Perchlorate is an endocrine disruptor posing an adverse impact on the thyroid gland function [20]. Many types of adsorbent materials have been used in the literature for the removal of various organic pollutants [21,22,23].
Adsorbents such as CP impregnated with ionic liquid (IL) are used for PH removal from wastewater. As an IL, a quaternary ammonium salt known as Aliquat 336 (Starks’ catalyst) was utilized. It is mostly composed of C8 (octyl) chains with a mixing of C10 (decyl) chains. On the solid support surface, the ionic liquids were used in small quantities, but their notable and practical physicochemical properties—such as great thermal stability, negligible vapor pressure, and high polarities—as well as their cost-effectiveness were enhanced when applied. Furthermore, by modifying their surface, ILs could mix with various functional materials to produce better characteristics, expanding their range of applications across numerous chemical domains. The presence of the IL on the solid adsorbent Cu-PA improved the adsorption capacity of the PH from the wastewater. The presence of IL increased the adsorption capacity of Cu-PA-IL by establishing hydrogen bonds between the hydroxyl group of phenol and Cl− (the anionic moiety of the ionic liquid) and also by facilitating a hydrophobic interaction between the tri-n-octyl methyl ammonium cation of IL and phenol [24]. However, the spent adsorbent must be recovered. By simple washing of the adsorbent, the phenol release is less than 70%. In order to increase and study the phenol release, an electrochemical method was used. For this purpose, non-expensive commercial graphite electrodes were used as working electrodes and NaCl 3% solution was used as electrolyte support. During the electrochemical investigation, the spent CP is immersed in a saline solution. The duration and value of the potential were chosen to avoid the formation of free chlorine [25]. Electrochemical impedance spectroscopy was used to evaluate the phenol released from the spent adsorbent during the EO. The results indicated that the release of PH from the spent Cu-PA-IL adsorbent is slower during electrooxidation at 1.5 V, and the release mode avoids early fouling of the anode and increases the release yield and oxidation degree of phenol. To the best of our knowledge, in the literature, EO in the presence of spent adsorbent has not been described. This study aims to investigate if EO of PH is possible as well as if EO affects integrity and which factors affect the process.

2. Experimental

2.1. Reagents

All chemicals were analytical grade and used without further purification. All reagents provided by Sigma-Aldrich were used without further purification except the bi-distilled water.

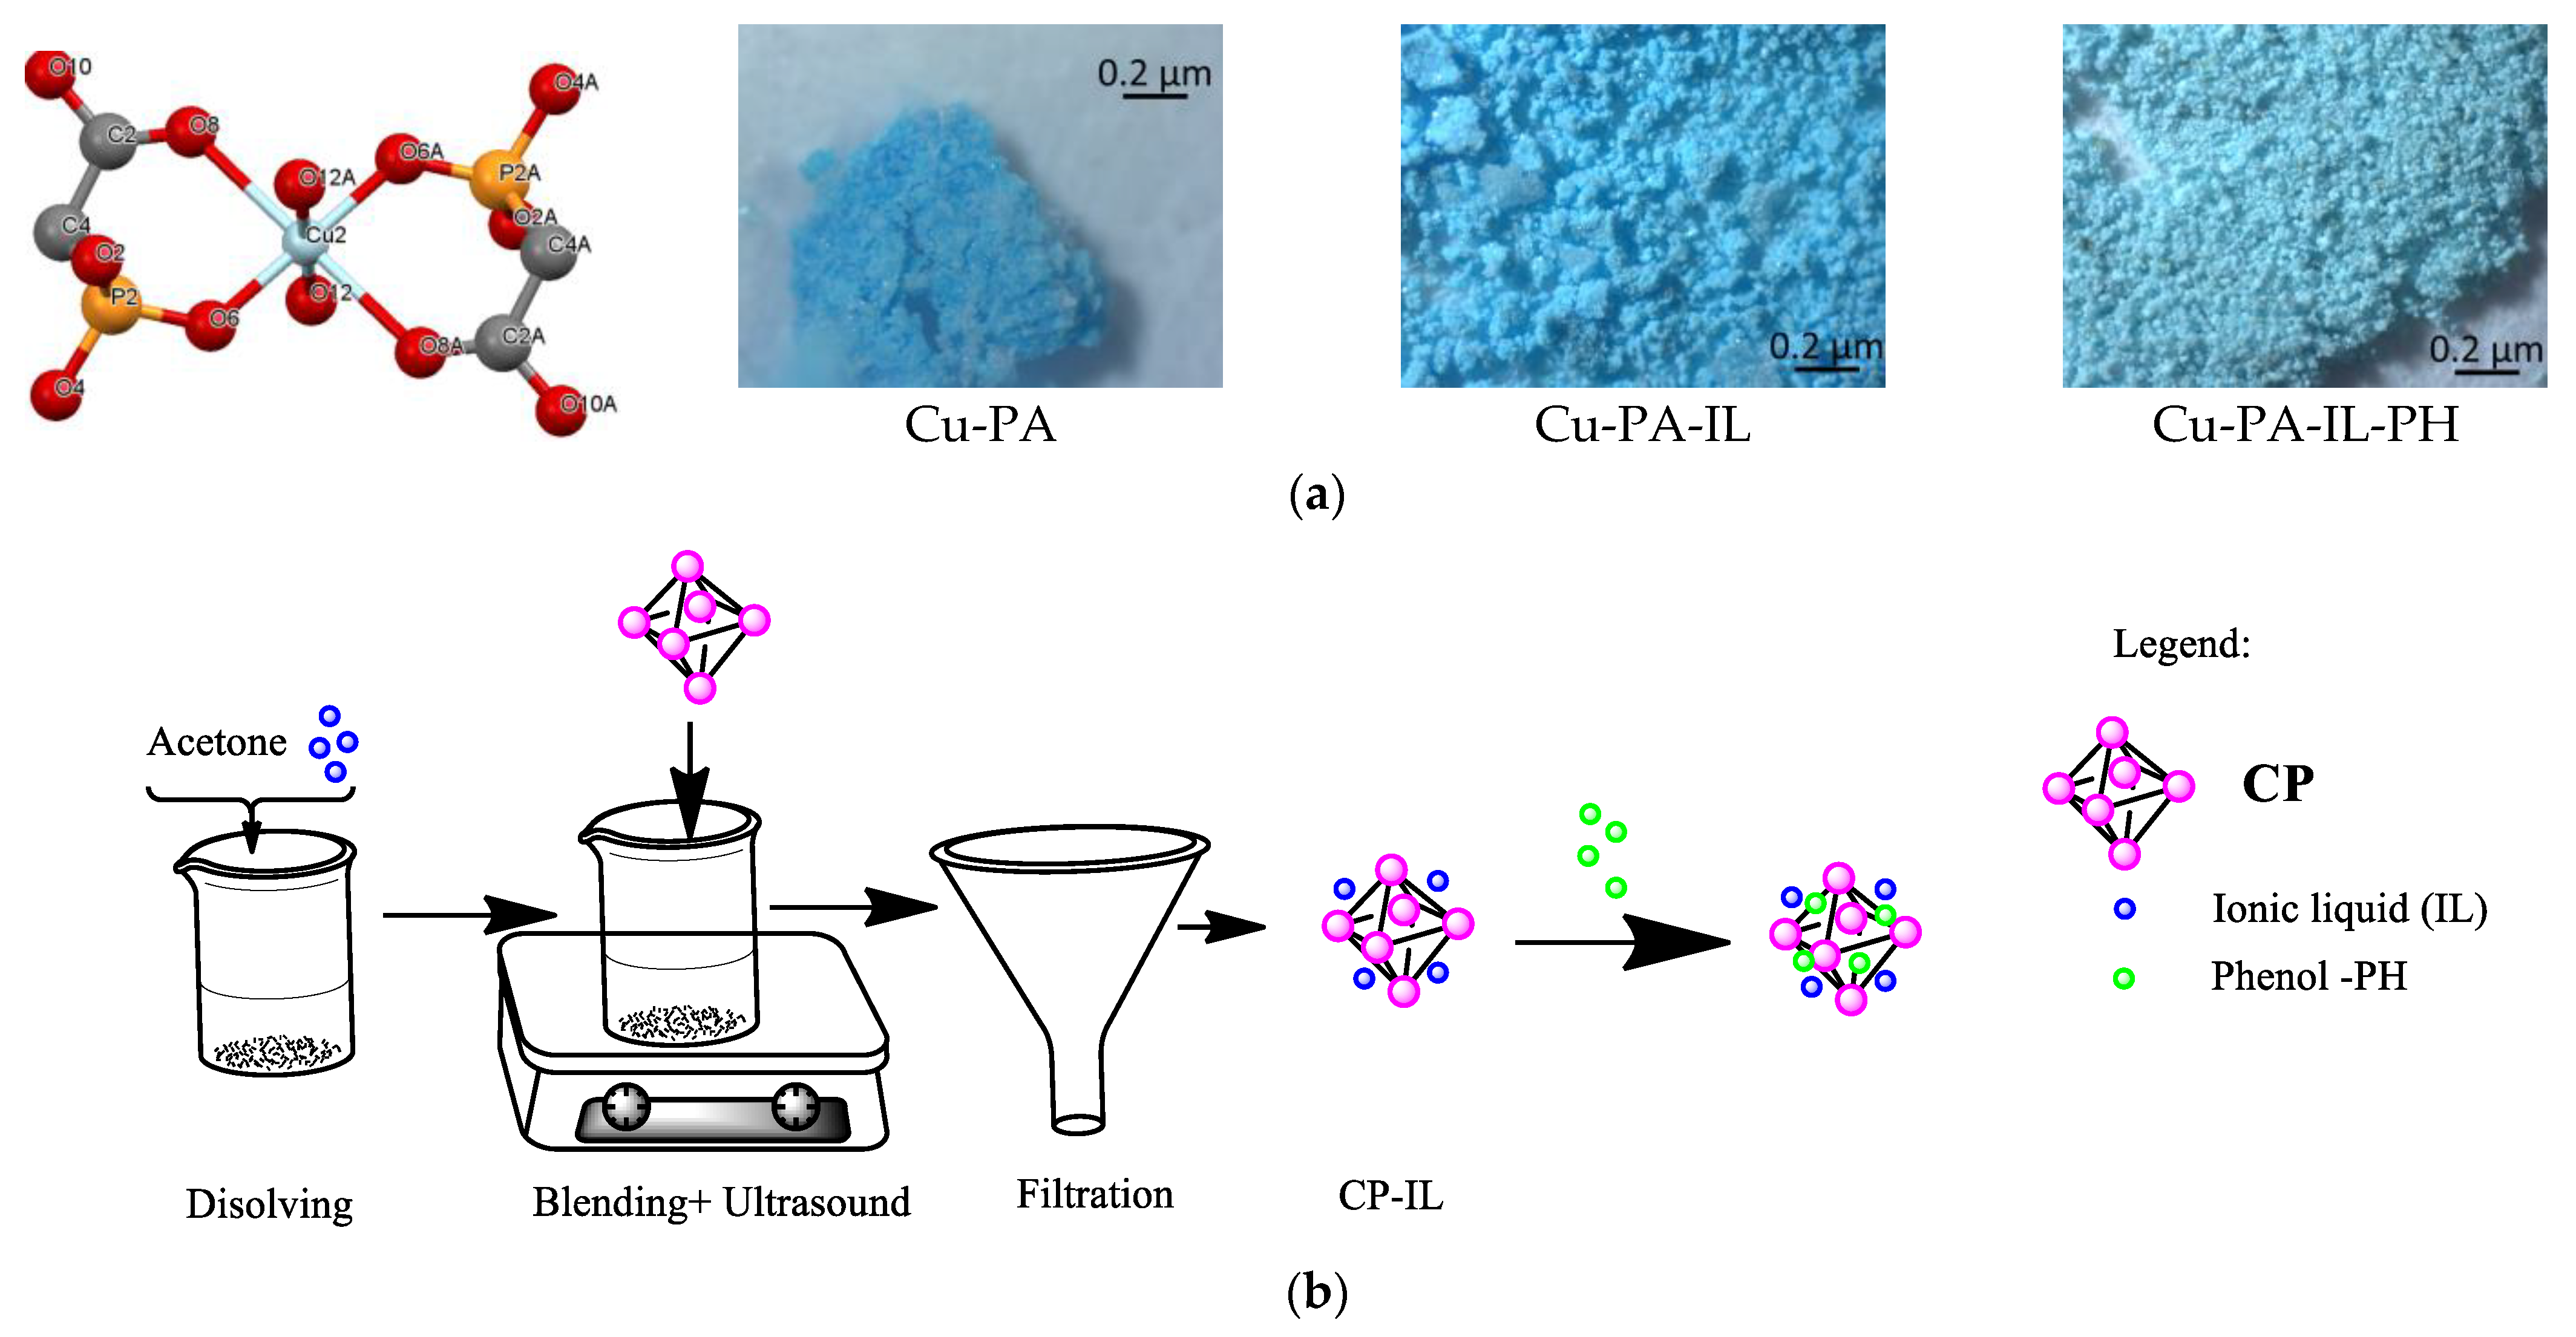
2.2. Preparation of Adsorbent—Spent Adsorbent

The phosphonate CP-type adsorbent was synthesized in our laboratory, according to the literature and our previous work [26,27,28,29,30], starting from CuSO4·5H2O (50.0 mmol), phosphonoacetic acid (50.0 mmol), urea (50.0 mmol), and bi-distilled water (100 mL) to form Cu-PA. The pH was adjusted to 2.8 with an aqueous solution of NaOH (0.1 M). The Cu-PA was synthesized using the hydrothermal method at 80 °C for 72 h. The resulting blue crystals were filtered, washed with bi-distilled water and dried in air (yield: 71%). Figure 1a exposes the Cu-PA structure and uses material microscope images. The ionic liquid (IL, in our case Aliquat 336) was impregnated on Cu-PA adsorbent according to the scheme illustrated in Figure 1b, forming Cu-PA-IL. The CuPA adsorbent is similar to previously synthesized diaqua-bis(phosphonoacetato-O,O′)-copper(II), Cu[μ2-OOC(CH2)PO3H]·2H2O M = 377.62 g/mol [31].
The adsorbents Cu-PA and Cu-PA-IL were used to extract phenol from artificial wastewater. As shown in Table 1, the spent adsorbent has phenol concentrations of 9.57 mg/g on Cu-PA and 18.4 mg/g on Cu-PA-IL, respectively.

2.3. Desorption of Phenol from Spent Adsorbent

For 400 min, samples weighing 0.015–0.020 g of wasted CP used in phenol desorption were stirred in a 3% NaCl solution. The release of PH in saline solution following immersion of the spent Cu-PA absorbent and the spent Cu-PA-IL adsorbent was examined using UV-VIS spectroscopy. According to the literature [1], the retention performance strongly depends on the pH value of the PH solution. At low pH (0 to 9), the pH value has a small effect on the retention performance, and at higher pH, the retention performance decreases as phenol ionization takes place. The pH of the saline system used in our research study is 6.65. The ammonium structure of IL has a permanent positive charge; it can form salts with anions over a wider pH range. Successful strategies for PH release from Cu-PA-IL involve the use of high chloride concentrations in the aqueous solution. In this respect, the 3% saline solution increases the amount of released PH and ensures good conductivity of the electrolyte.

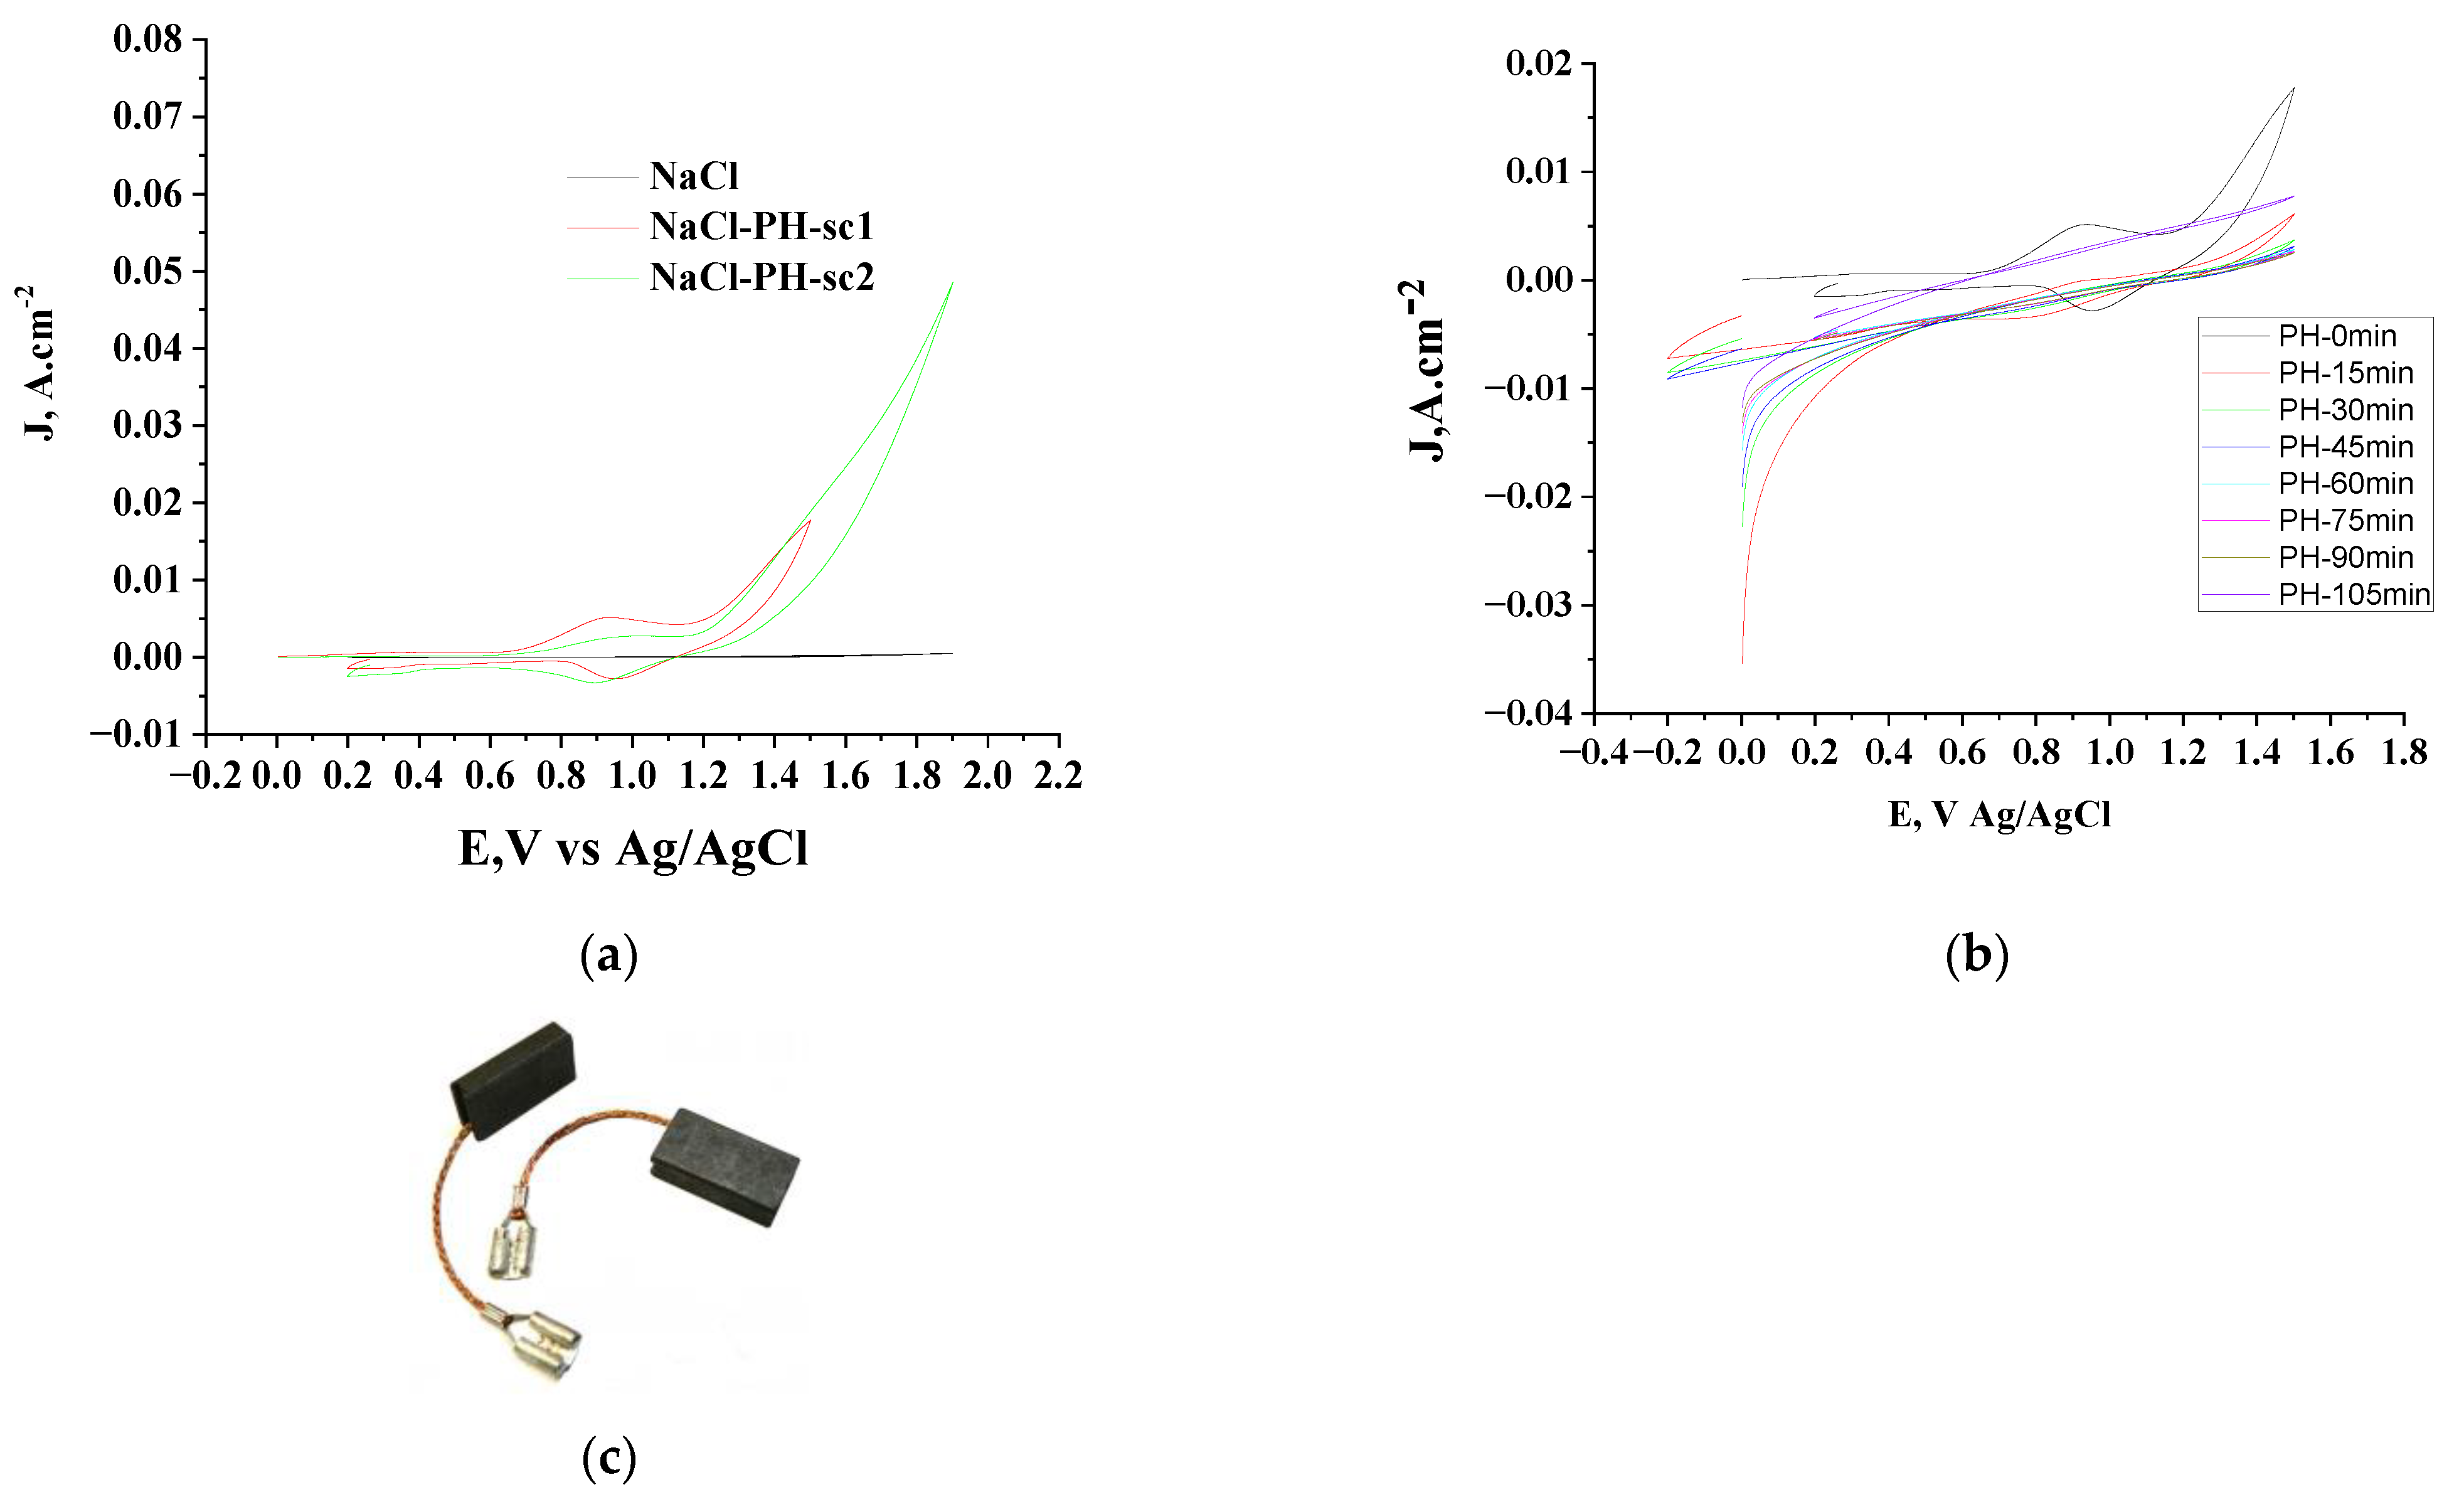
2.4. Electrochemical Characterization by Cyclic Voltammetry

The spent adsorbent was submerged in a 3% saline solution for electrochemical evaluation. A working electrode, a reference electrode (Ag/AgCl 3M), and two rods of graphite serving as an auxiliary electrode made up the four-electrode system. A commercial graphite electrode with an exposed area of 0.75 cm2 was selected as the working electrode (Graphite Brushes for Electric Motors Tools, 80-226442 Carbon Brush, 0.223” × 0.649” × 1”, Grade: K254). A Voltalab potentiostat (model PGSTAT 305, Eco Chemie B.V., Utrecht, The Netherlands) was used for voltammetric studies. The reactivity of the graphite anode in saline solution, which served as a supporting electrolyte, was examined using cyclic voltammetry (CV) within the potential window of 0.0 and 1.5 V versus Ag/AgCl. The system saline electrolyte/Cu-PA and Cu-PA-IL represents the saline solution which is in permanent contact with the used adsorbent. The electrodes were immersed in this system but not under stirring.

2.5. Electrochemical Impedance Spectroscopy

On a commercial graphite electrode, measurements using electrochemical impedance spectroscopy (EIS) were also utilized to examine the EO process. The FRA2 impedance module and an Autolab 302N potentiostat/galvanostat were used for the EIS. The sinusoidal potential amplitude was 10 mV, and the tested frequency range was 0.01 Hz to 100 kHz. All measurements were carried out at room temperature (rt) in a standard one-compartment, four-electrode cell that included an Ag/AgCl (3 M KCl) reference electrode, two graphite counter electrodes, and a graphite working electrode. The EIS spectra were recorded at the same potential (1.5 V) every 15 min during the electrochemical phenol oxidation process. The non-linear least squares approach in ZView-Scribner Associated Inc. software was utilized to fit the experimental data to an appropriate electrical equivalent circuit (EEC). In every instance, three samples were examined.

2.6. Degradation of Phenol

Commercial graphite brushes used as the anode for electric motor tools were used to electrooxidize phenol at 1.5 V. The systems of saline electrolyte/Cu-PA and Cu-PA-IL, respectively, were both studied. EIS looked at the simultaneous release of phenol (PH) from the used adsorbent and the electrooxidation of phenol. Following the electrochemical procedures, the total organic carbon (TOC) in the electrolyte was measured using a Shimadzu TOC analyzer (Columbia, MD, USA).

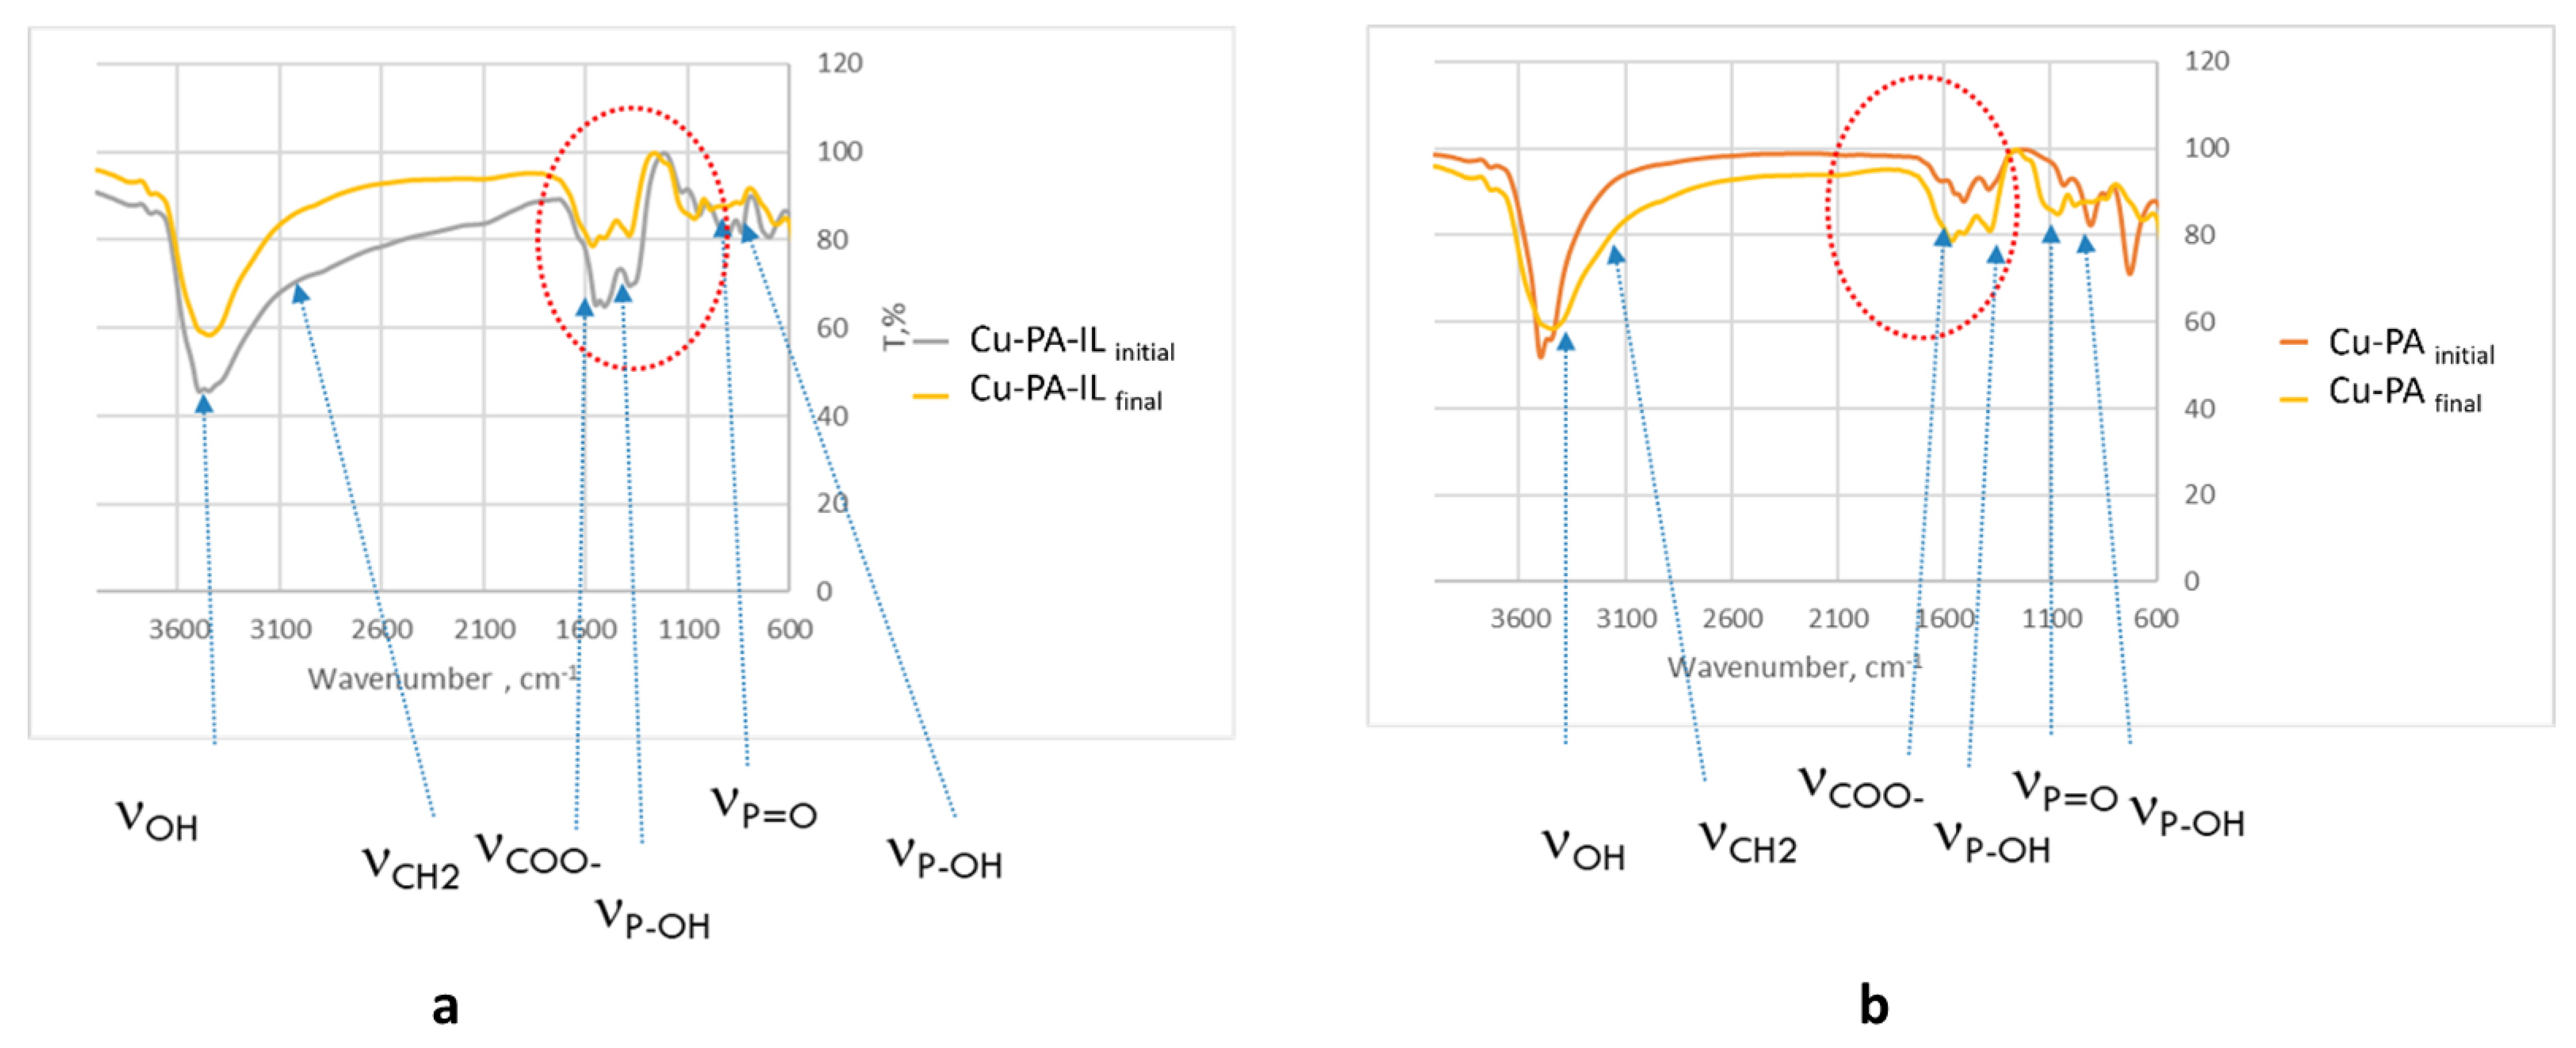
2.7. FTIR Spectroscopy of Spent Adsorbent

FTIR spectroscopy before and after PH electrooxidation of the spent adsorbent was performed to study the integrity of the adsorbent. The spectra were recorded on a Jasco-FT/IR-4200 instrument in the range 400–4000 cm−1 on compressed KBr pellets [32,33].

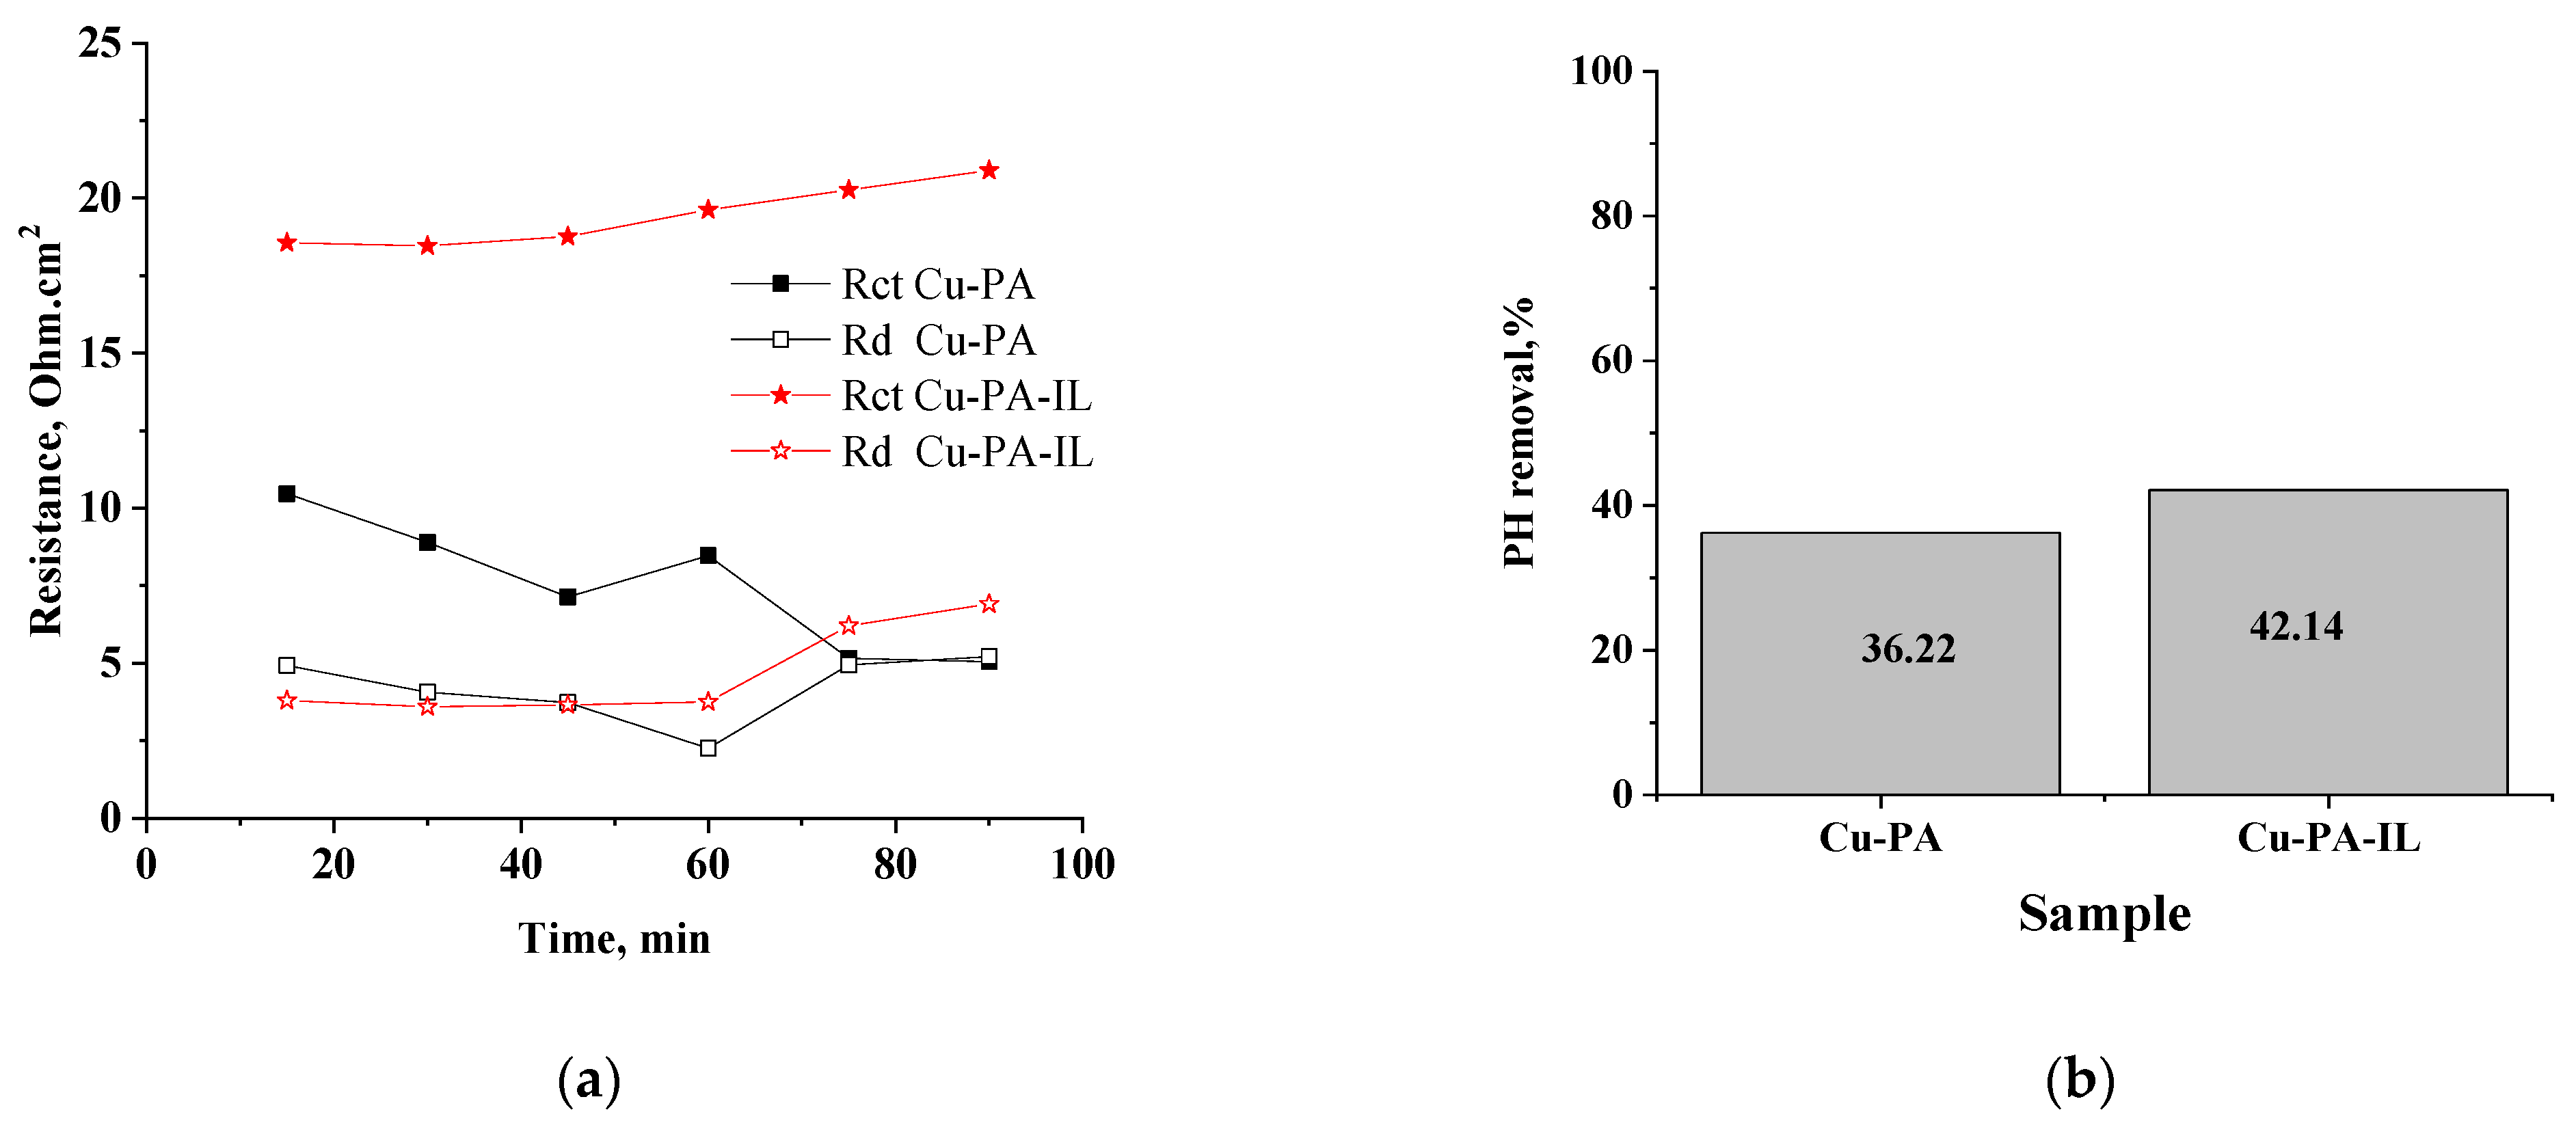
2.8. Efficiency of Electrooxidation

The energy consumption per volume of treated effluent was estimated from Equation (1) [34]:
Energy   consumption = Δ E c   ×   I   × t 3600 ×   V  
where ΔEc (V) is the average applied potential difference, I (A) is the electrolysis current, t is the time of electrolysis (s), and V is the sample volume (dm3).

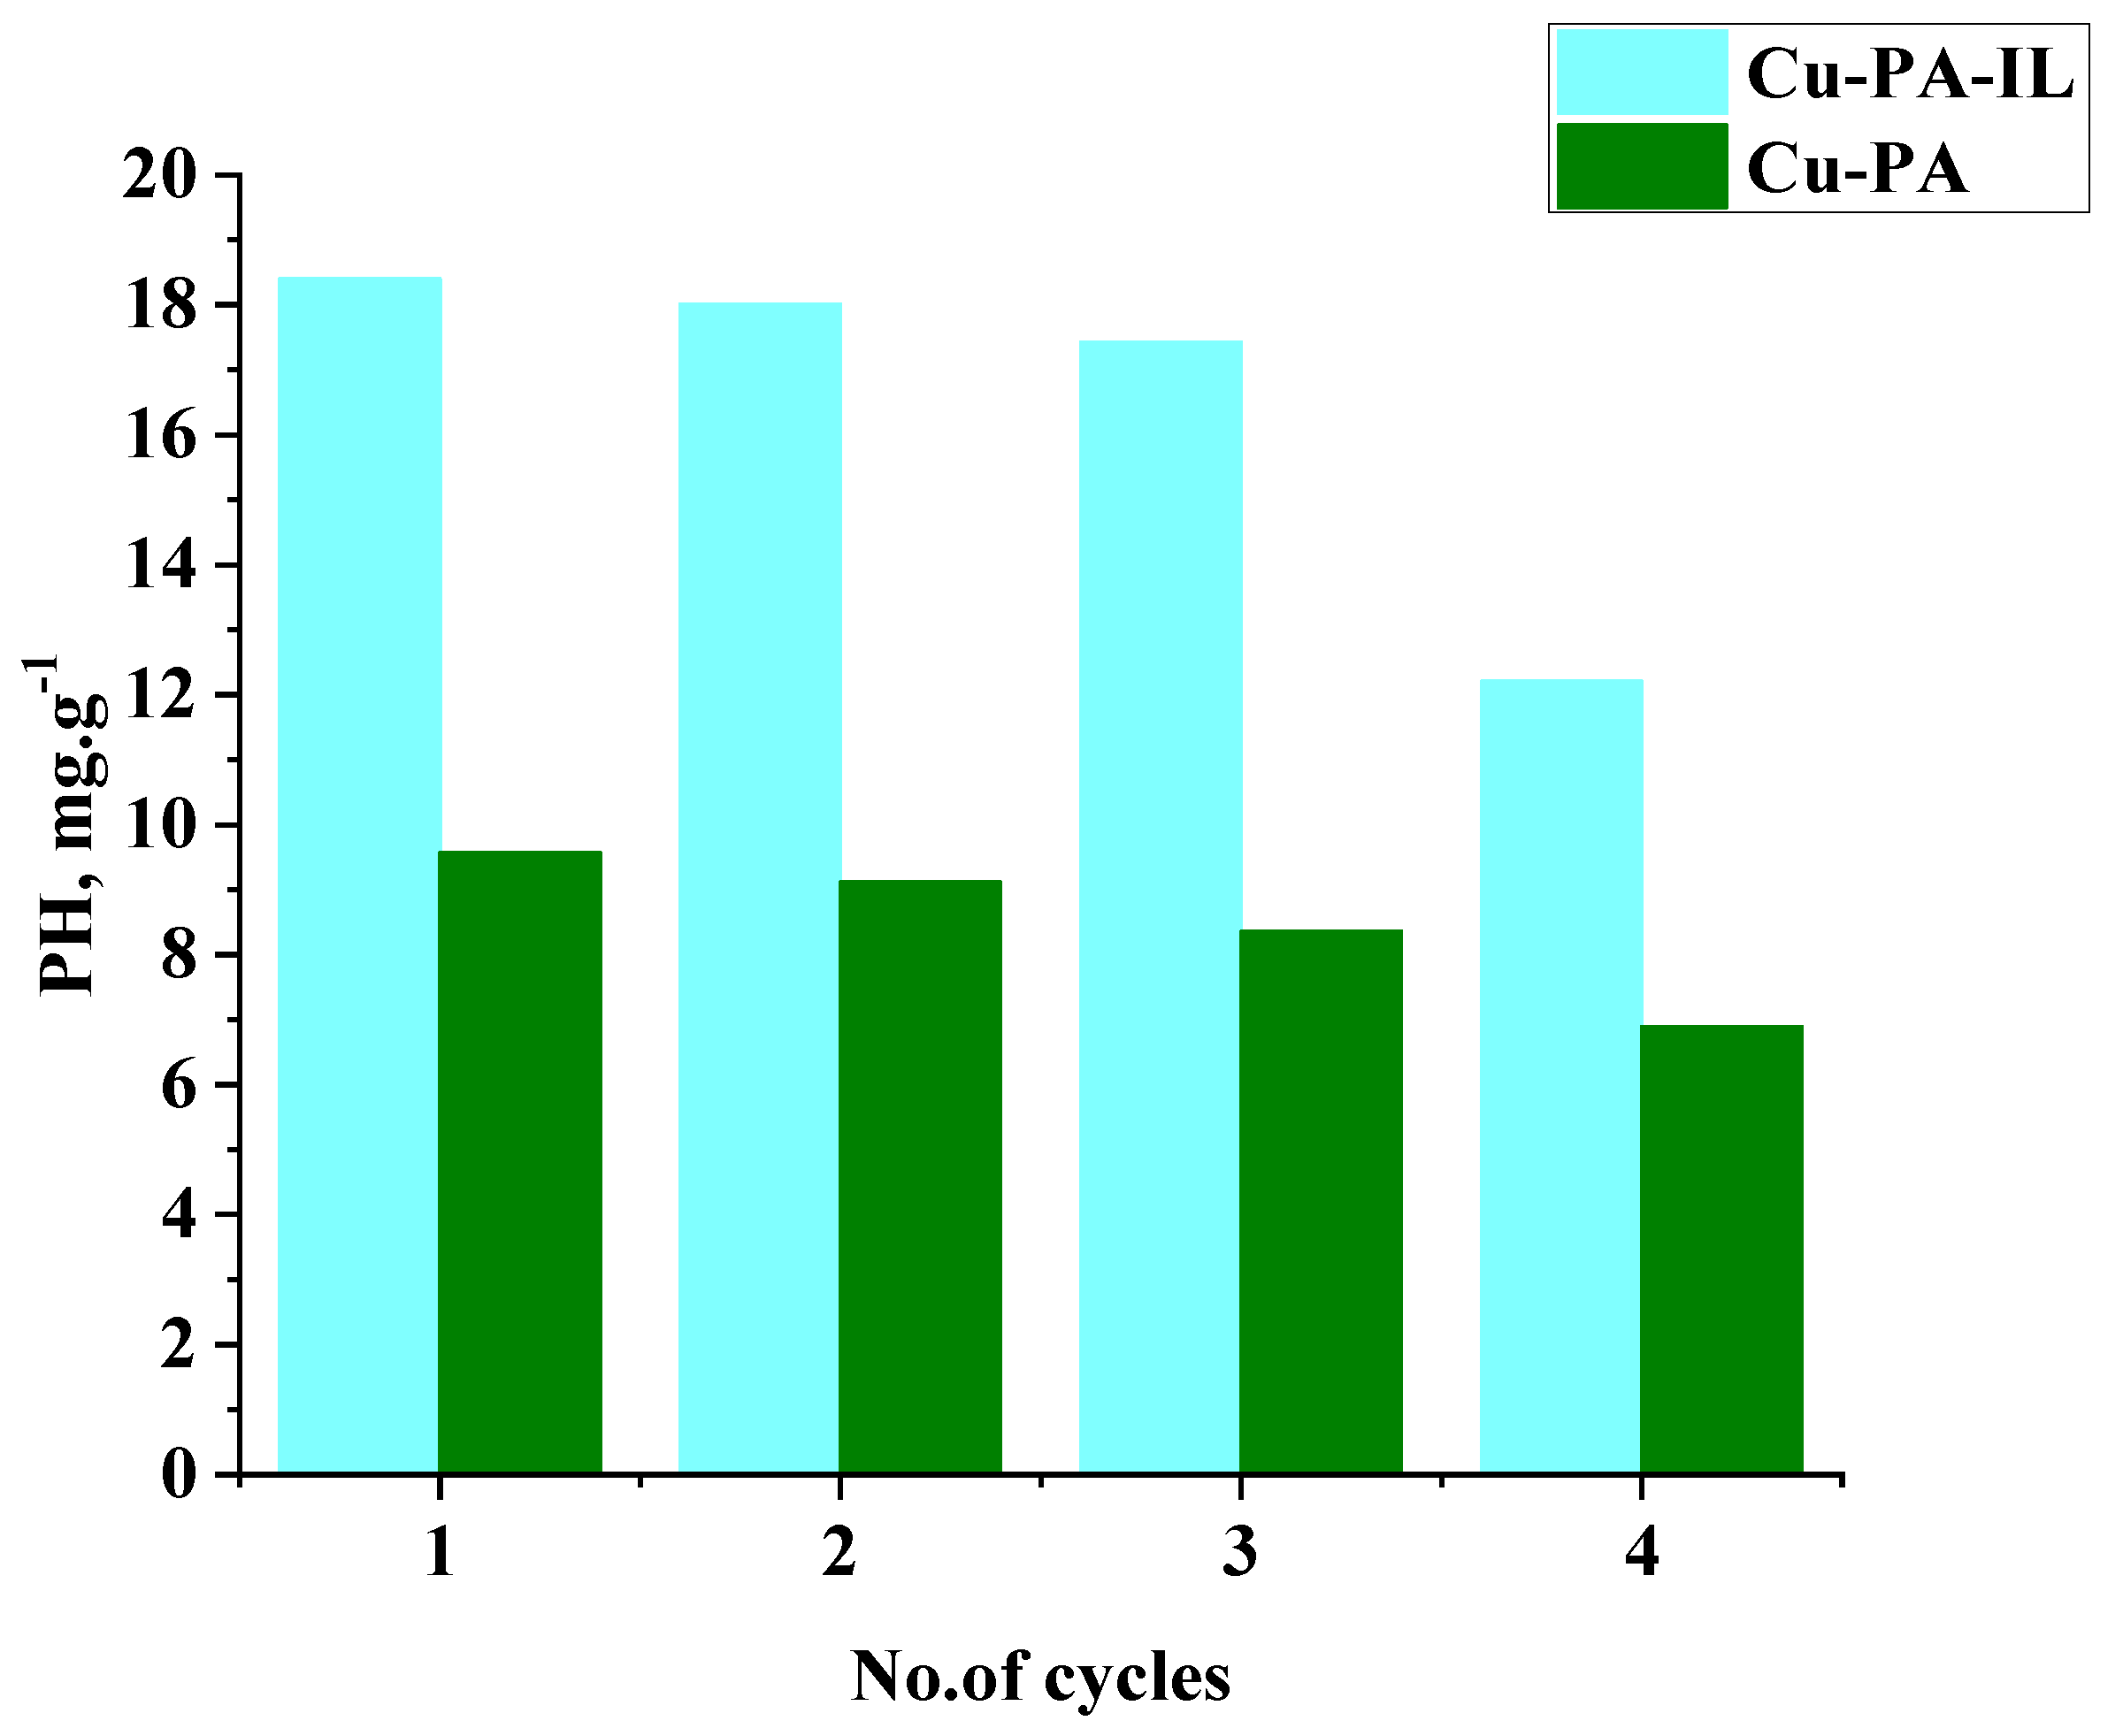
2.9. Reuse of Treated Adsorbents

A PH solution was employed to simulate wastewater. The adsorption studies were performed in batch mode with the sample stirred in a Julabo SW23 shaker bath at 200 rot/min. For adsorption studies, a UV-VIS Perkin Elmer Lambda 12, Rotkreutz spectrophotometer was used, and 0.005 g of recycled adsorbent in a 25 mL PH aqueous solution was employed for each adsorption cycle. The samples after the elapsed time were filtrated. For the resulting solutions, the residual concentration of the PH was determined by UV-VIS spectrophotometry to further calculate the absorption performance of the recycled adsorbent.

3. Results and Discussion

The adsorbents Cu-PA and Cu-PA-IL retain 9.57 mg/g and 18.4 mg/g of phenol, respectively. These adsorbents do not present a higher capacity for PH retention. The presence of IL improves the adsorption capacity of CP as it brings to the surface of the adsorbent materials an increase in the number of functional groups, which leads to better adsorption performance, as electrostatic interactions between the positive charge of the IL and the electronegativity of oxygen molecules from PH take place more easily.

3.1. Desorption Kinetics

We were able to comprehend the phenol release from the spent adsorbent in the saline solution thanks to the UV-Vis analysis. The absorbance readings at 252 nm in Figure 2, illustrate the standard curves of the phenol molecule in a 3% NaCl solution. The kinetic release patterns of the phenol molecule for the two types of adsorbents, Cu-PA and Cu-PA-IL, in a 3% NaCl solution are shown in Figure 2. A desorption process in which the rate of desorption is proportionate to the concentration of adsorbents at a particular moment is known as first-order desorption kinetics (Equation (2)).
Ln   ( C t C 0 ) =   K 1   ( t )
where Ct is the phenol quantity at desorption time t (mol L−1), Co is the phenol quantity desorption at initial time, K1 is the apparent desorption rate constant (min−1), and t is the time in s.
Second-order desorption kinetics refers to a desorption in which the rate-controlling step follows Equation (3):
t q t = 1 K 2   ×   q e 2 + t q e
where K2 is the second-order rate constant (g·mg−1 min−1) and qe is the adsorption capacity at equilibrium. Because diffusion resistance can impede the flow of adsorbents through the adsorbent layer, diffusion can be a limiting process. Equation (4) can be used to follow the kinetic data.
q t = K I ×   t 1 2 + C
where KI (the slope) and C (the intercept) represent the intraparticle diffusion rate constant (mg g−1 min−1/2) and a constant related to the thickness of the boundary layer.
A plateau in the phenol release kinetics is reached after 105 min. For a first-order model, the phenol delivery kinetics yield the highest regression factors, max 0.9822. Because of the adsorbent’s huge surface area and numerous pores, the release of PH molecules was typically very quick in the first 100 min and subsequently slowed until equilibrium was established.
It has been noted that for Cu-PA adsorbents, the first kinetic order respects the experimental data quite well, and for Cu-PA-IL, the intraparticle diffusion respects the data. Just 79.21% of the wasted adsorbents for Cu-PA and 60.87% of those for Cu-PA-IL may be desorbed by submerging them in saline water. In certain instances, the adsorbed molecule forms an ion–pair bond with the surface, restricting desorption and developing a strong adhesion. Although IL is less beneficial for PH release, it is beneficial for PH adsorption in the adsorbent. Applying a voltage to the surface, which causes the adsorbed molecule to either reduce or oxidize, is one method of increasing PH desorption and adsorbent recovery.

3.2. Electrochemical Oxidation of Phenol
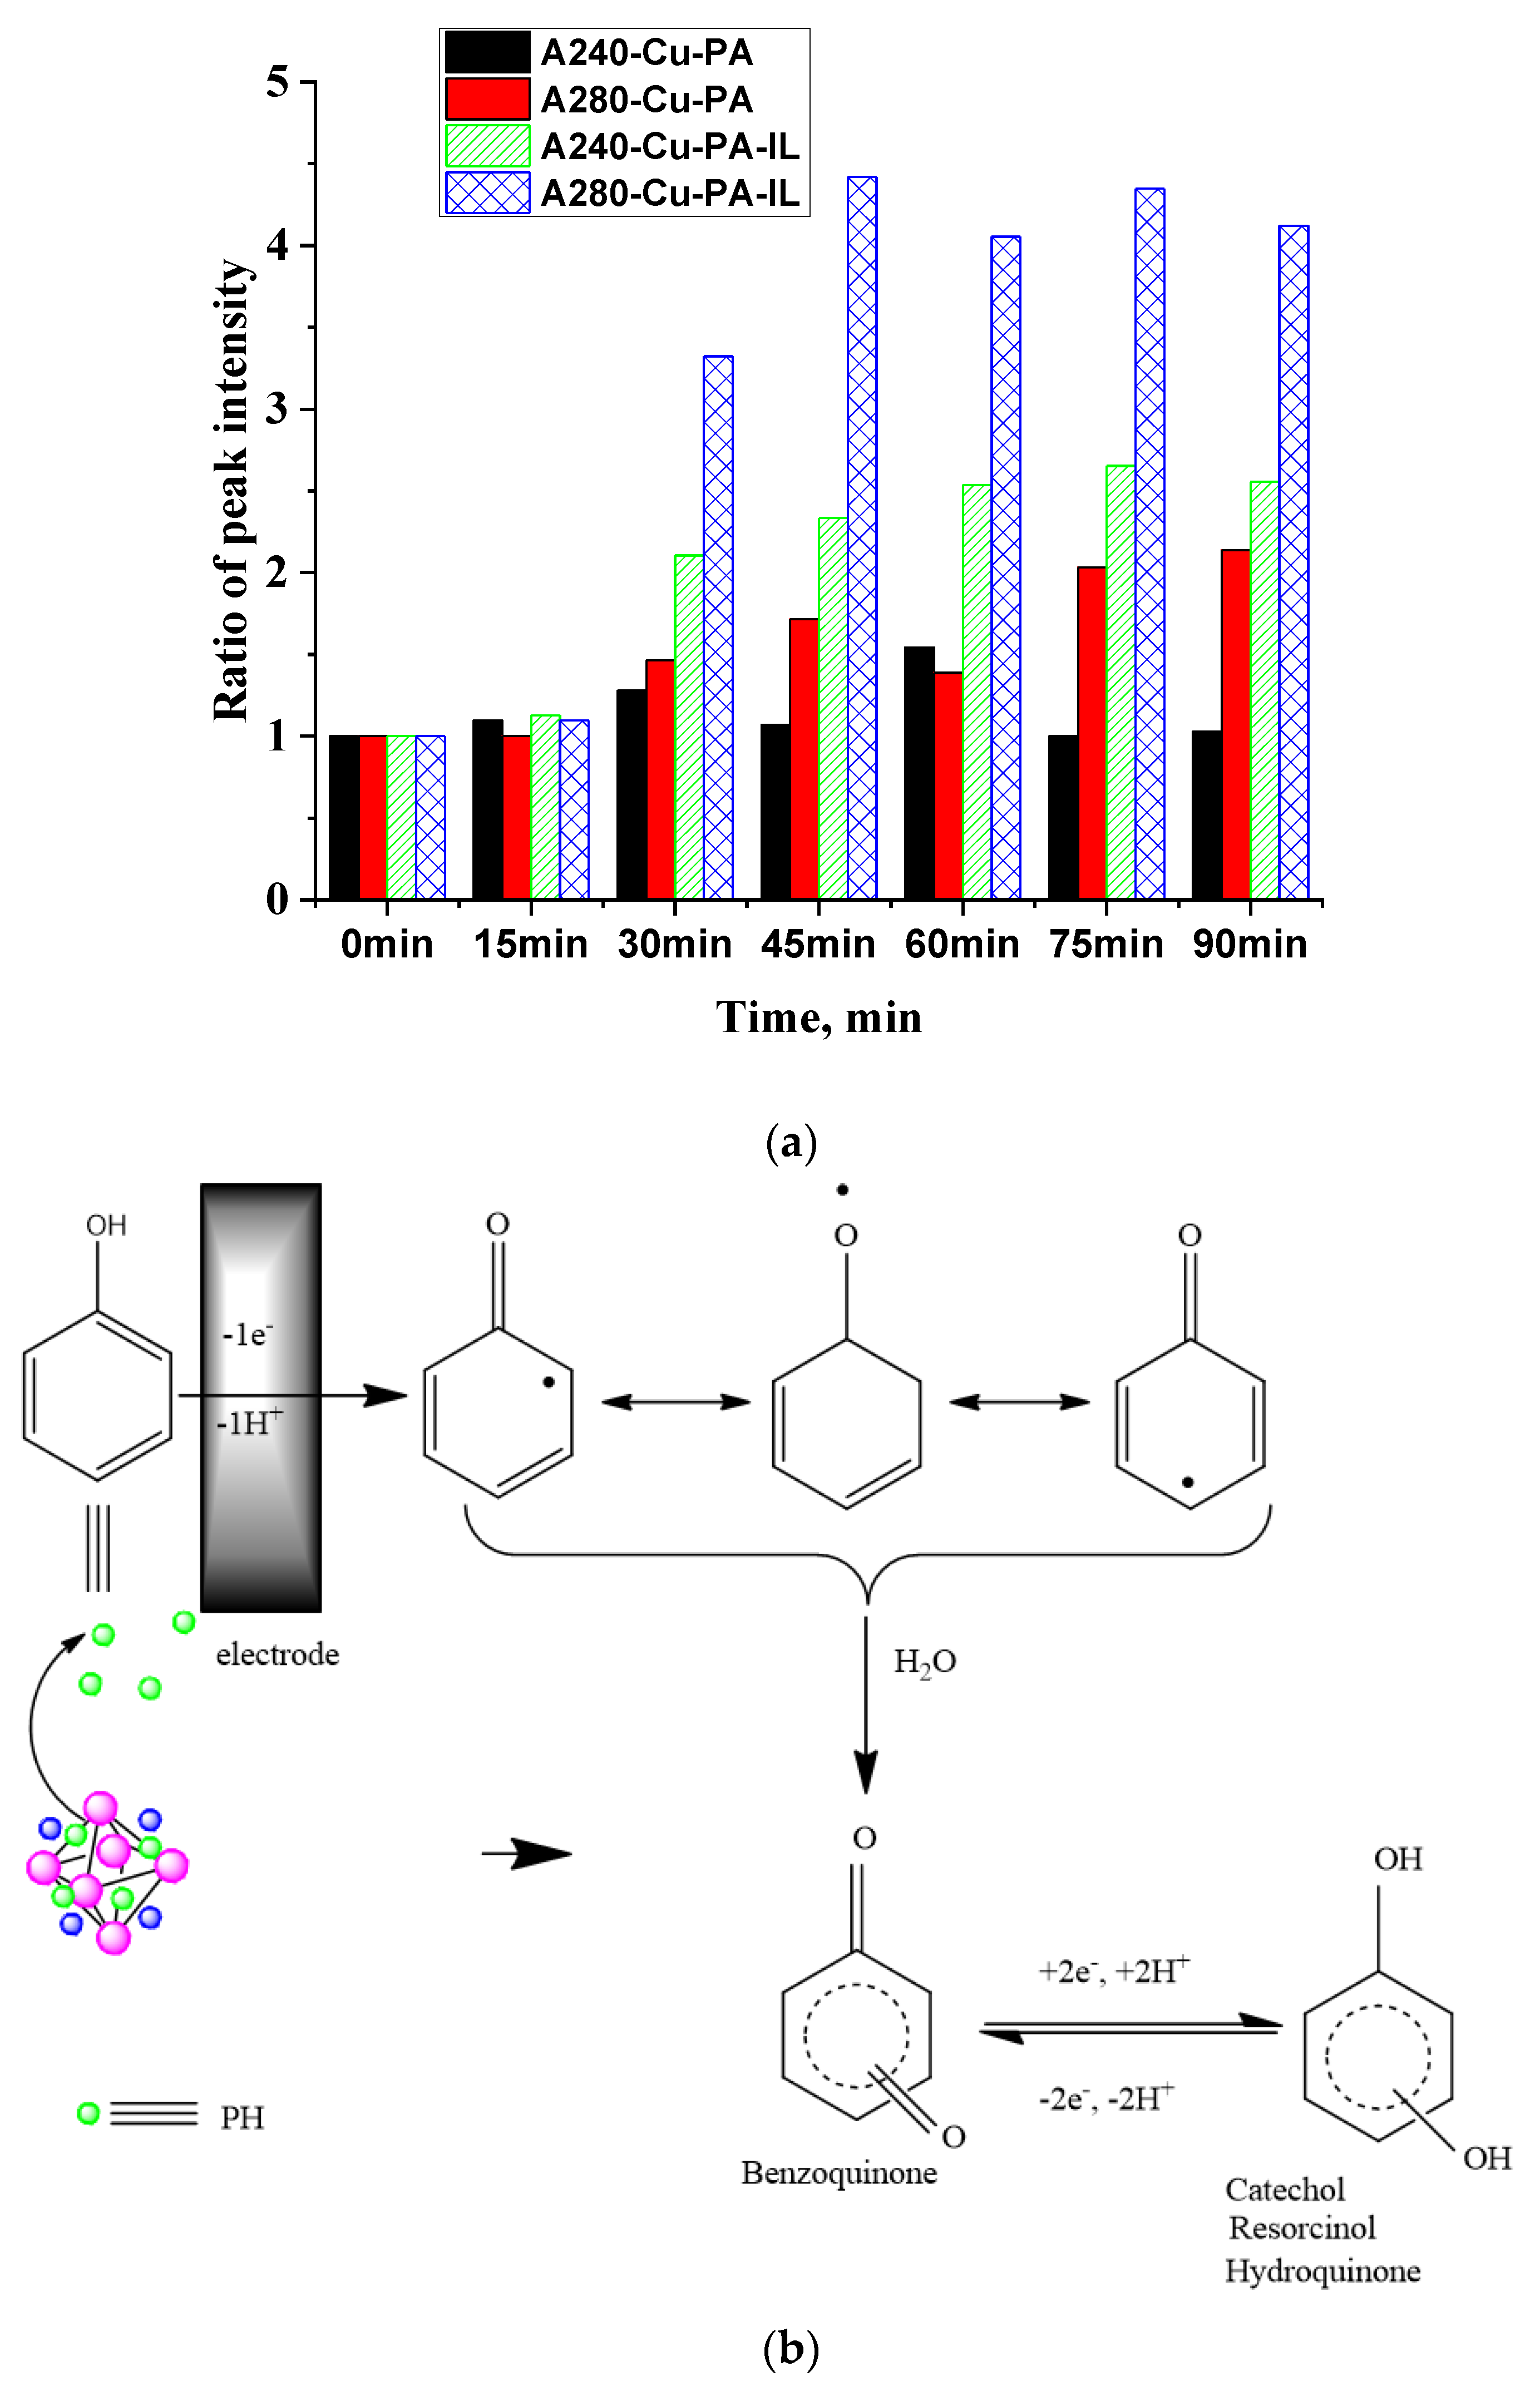
The cyclic voltammograms in Figure 3 show the electrooxidation of 0.025 mM PH release in saline solution at the graphite electrode.
When phenol was absent from the blank experiment, there was initially no evidence of a phenol oxidation peak (blue scan). A high oxidation current (0.0049 A) was measured at + 0.95 V vs. Ag/AgCl, indicating the direct oxidation of phenol on the electrode surface, when the phenol is present on the first scan. Every solution under investigation that contains phenol has a cyclic voltammogram with the same form. Figure 3a shows that following the initial scan (the first oxidation cycle), both the peak intensity and the current charge fall, suggesting a decrease in the anode’s electrochemical activity. The peak charge for the first cycle was 0.1553 C, and for the second cycle, it was 0.0017 C. The declining anode activity is caused by the EO products of incomplete phenol oxidation because of their characteristics (electrochemical inactivity, very low conductivity) [35]. The electrochemical process of phenol appears to be less reversible based on the appearance of an anodic oxidation peak and a less intense cathodic counter portion. The anode activity reduces further as the EO duration at 1.5 V increases (Figure 3b). The oxidation peak current density drops during electrooxidation because it is dependent on the phenol content. The anode deactivates over time as a result of low electrode activity, competition for active sites on the electrode’s surface, or the production of more phenoxide radicals [36]. The degradation product structures are stated in the literature [37].

3.3. UV-Vis Spectra

The UV-VIS examination provides qualitative insights into the intermediates and final EO products, respectively (Figure 4). The majority of the species produced during the degradation were hydroquinone, resorcinol, and p-benzoquinone, according to UV-vis data.
Prior to treatment, PH’s UV spectra displayed two distinct absorption bands at approximately 210 and 269 nm. Because of the presence of the aromatic ring, a weaker peak at 269 nm, and a peak at 210 nm, these bands can be attributed to π-π* type transitions.
The UV absorption spectrum of phenol following various electrolysis times is displayed in Figure 4a,b. These two absorption bands declined simultaneously and constantly during the electrolysis process. With the exception of p-benzoquinone, which has a single band at 247 nm, the absorption spectra of phenolic compounds in the UV area in Figure 4 showed a modest difference between compounds with two well-defined maxima for the majority of compounds (210 and 270 nm). The spectral overlap, especially at around 280 nm, between these compounds makes the interpretation for the determination of the degradation compounds—hydroquinone (HQ), catechol (CT), resorcinol (RS) and p-benzoquinone (BQ)—very problematic [38]. Different features for the spectra are shown by the UV-Vis spectra obtained at 1.5 V after varying times of electrooxidation based on the concentration of the phenolic solution. The greatest absorbance for PH, BQ, HQ, RS, and CT is found at 270 nm, 242 nm, 286 nm, 283 nm, and 289 nm, respectively, according to their UV spectra (Figure 4a,b).
A noteworthy observation is the peak of absorbance at around 210 nm, which is attributed to the release of PH during the EO process from the absorbent into solution. Hydroxy-phenolic (HS) is formed after one hour of electrooxidation, the maximum absorbance of phenol, which is located at 270 nm, is reduced and a bathochromic shift of the wavelength of the maximum absorption to higher values was observed. The peaks at 240 and 280 nm describe the degradation products. These peaks can be used as a tracer of EO products by correlating the intensity values at A240 nm and A280 nm at time t with the initial values at 0 min. After 90 min, the Cu-PA showed an increase in A240 from 0.7090 to 0.7267 linked to BQ formation and an increase in A280 linked to the formation of HS (hydroxylated species CT, RS, and HQ) from 0.3942 to 0.8429. In the case of Cu-PA-IL, the intensity of A240 rose from 0.43123 to 1.10248 and at A280, it rose from 0.1455 to 0.59957 (Figure 5a). This suggests a different electrooxidation pathway due to the different amounts of PH released during EO. These suggest that Cu-PA-IL retains strongly the PH, and the release is slower than in the case of Cu-PA. In the Cu-PA scenario, it was noted that the PH was constantly released into the electrolyte system for 60 min, during which time the A240 value changed noticeably, indicating that the BQ had been acquired preponderantly in the reaction mixture. The A280 increases after 60 min of electrooxidation at 1.5 V, indicating a rise in HS products (Figure 5b). The slow rate of PH will favor the production of BQ primarily in the case of Cu-PA-IL because the presence of IL strongly retains the PH (Figure 5b).

3.4. Electrochemical Impedance Spectroscopy (EIS)

The mechanisms, charge-transfer and mass-transfer processes, that occur at the anode/electrolyte interface were examined using electrochemical impedance spectroscopy. The saline solution has PH and no redox species in the first moment, when no oxidation or reduction reaction occurs at the measured open circuit potential (OCP). In the EIS, a straight line is visible, suggesting capacitive behavior. PH desorption occurs faster and easier during the EO reaction at 1.5 V, especially for Cu-PA-IL due to the bubbles produced during electrolysis. These bubbles are the result of multiple processes (interfacial mass transfer, chemical reactions, species transport) and seem to weaken (break) the ion pair interactions between IL and PH.
The EIS patterns are displayed in Figure 6 and describe the transmission of electrons across the electrode–electrolyte interface and the movement of redox species, which is associated with a finite mass-transport feature of ions [39]. The EIS patterns were fitted with the equivalent circuits (EECs) non-linear least squares approach. The EEC contains an Rs element that models the solution resistance, an Rct that describes the charge-transfer resistance (Rct), a CPEdl element (constant phase element) associated with the double-layer capacitance (Cdl), and instead of a Warburg element, an Rd, which represents the resistance to the transport of redox species and CPEd elements associated with the diffuse layer capacitance. EIS features depend on the concentration of the redox species across the electrode surface. Similar behavior was reported in the literature [40]. The EIS data were fitted with the EEC presented in Figure 6g in the frequency range of 0.15 to 1.5 × 10⁴ Hz, with a Chi-square value (the square of the standard deviation between the original data and the calculated spectrum) of 2.6 × 10⁻³ to 6.3 × 10⁻³ for Cu-PA and 1.2 × 10⁻⁴ to 3.9 × 10⁻³ for Cu-PA-IL. The results obtained for Rd and Rct are presented in Figure 7a. It was noticed that as the concentration of PH ions decreases, the semicircle diameter increases, indicating a rise in mass-transfer resistance and charge transfer (Figure 7). Because it took the PH molecules a longer time to reach the electrode surface, the semicircle width grows as the PH concentration drops. The charge-transfer process becomes a limiting process at low PH concentrations. In the case of Cu-PA, it is found that the semicircle diameter reduces with time, indicating that PH is released from the adsorbent. Additionally, the charge resistance and mass-transfer resistance decrease with an increase in PH concentration (Figure 7a).
Conversely, in the Cu-PA-IL scenario, it is seen that the semicircle diameter increases as the PH concentration in the saline solution decreases. This indicates that the IL is responsible for a significantly reduced PH release during the EO process. Because of the slow ion movement near the electrode surface, the mass transfer mechanism becomes limited as the electrooxidation period increases. The partial desorption of PH by simple immersion in saline water ensures a maximum desorption of 80%, which is much lower in the case of an absorbent with IL. Maintaining the electrolyte/absorbent system at a potential of 1.5 V involves both the release over time of the adsorbed phenol and its electrooxidation. The efficiency of PH removal from adsorbent during EO was determined to be 87.13% for Cu-PA and 72.92% for Cu-PA-IL. Through EO, it was determined that more of the adsorbed PH can be released from the used adsorbent; thus, for Cu-PA-IL, the amount of desorbed PH increases from 60.87% to 72.92% in the case of Cu-PA-IL and from 79.21% to 87.13% in the case of Cu-PA. Along with the desorption process, PH can be oxidized to HS compounds, which are less toxic than PH. The efficiency of PH electrooxidation (EOPH) was calculated based on TOC values. Cu-PA and Cu-PA-IL in 90 min of electrooxidation show an EOPH of 36.22% and 42.14%, respectively (Figure 7b), which is much higher than the EOPH of the solution that resulted after washing of the spent adsorbent with saline solution (22.58%). These values are promising compared to those reported in the literature, as shown in Table 2.
The energy consumption was 0.44 kWh dm−3 and 0.29 kWh dm−3 for PH removal in the cases of Cu-PA and Cu-PA-IL, respectively, based on Equation (1). Also, computational approaches are systematically used in environmental science to assist the experiment in order to expedite and save resources and costs [45,46].
The FTIR patterns of the adsorbents recorded after the desorption and EO of the PH pollutant (Figure 8a,b) indicate that they all retain their original structures. The electrooxidation does not lead to the collapse of the framework, and the adsorbent can be reused further.
As it can be seen, the in situ release during the EO allowed for the release of more PH from adsorbents than by simply washing. In this study, to overcome the disadvantage of a reduced desorption of phenol from the exhausted adsorbent, the electrooxidation of phenol was carried out in the presence of the adsorbent. The oxidation of phenol takes place via a direct electron transfer process in the potential region of water stability.
The regeneration and reuse of treated adsorbents is an important aspect that reveals their potential application for wastewater treatment. The mass balance presented in Equation (5) was used to calculate the adsorption performance developed by the studied materials.
q = ( C 0 C e ) V m
where q is the quantity of adsorbed phenolic compound onto the studied materials (mg/g); C0 and Ce represent the initial and equilibrium concentrations of phenolic compound in the solutions (mg/L), respectively. V is the volume of the solution (L), and m is the mass of the adsorbent (g) used in the experiments. The adsorption capacities of PH in the four cycles are presented in Figure 9.
It can be noticed that the adsorption capacities decreased gradually with the increase in regeneration cycles. The low adsorption capacity after regeneration mostly decreases as the sites on the adsorbent decrease during EO. It was observed that in the case of washing the adsorbent, only 70% of PH is desorbed; the rest remains attached to the adsorbent. By performing EO in the presence of a spent adsorbent during the electrochemical treatment, the amount of PH release increased for all studied adsorbents (87.13% for Cu-PA and 72.92% for Cu-PA-IL). With the further increase in the regeneration cycle, the adsorption sites of the adsorbent decreased. The adsorption efficiency decreased by 33.5% for Cu-PA-IL and by 31.2% after four cycles of reuse for PH. The number of cycles in which the adsorbent can be used without losing its absorbance ability is three. The mass of the adsorbent remains almost unchanged during adsorption–desorption. Therefore, recycled materials present adsorption capacity and recyclability for PH removal.

4. Conclusions

In this study, the EO of PH released in situ in saline from two spent adsorbents was evaluated. Commercially, the anode has been used as a working electrode to degrade PH pollutants.
Cu-PA releases 79.21% of its PH, and Cu-PA-IL releases 60.87% of its PH when immersed in saline water. A maximum desorption of 80% of the PH can be achieved by simple immersion in saline water; this is significantly less in the case of an adsorbent containing IL. Operating at a potential of 1.5 V, both the gradual release of the adsorbed phenol and its electrooxidation are present. In the electrolyte/Cu-PA example, it was seen that the PH was continuously released during EO at 1.5 V, and after 90 min, the HS had predominantly been acquired in the reaction mixture. In the case of Cu-PA-IL, the delayed rate of PH release promotes the synthesis of BQ. The slow ion transport at the electrode surface causes the mass transfer mechanism to become limiting as time grows. The efficiency of electrooxidation (EOPH) was almost double for Cu-PA and Cu-PA-IL after 90 min of electrooxidation, respectively, which was much higher than that of the solution after washing of the spent adsorbent with saline solution.

Author Contributions

Conceptualization, N.P. and A.V.; Data curation, N.P. and B.M.; Formal analysis, B.M.; Investigation, N.P. and M.T.-L.M.; Methodology, N.P., M.T.-L.M. and A.V.; Project administration, A.V.; Writing—original draft, N.P. and A.V.; Writing—review and editing, N.P. and A.V. All authors have read and agreed to the published version of the manuscript.

Funding

This work was partially supported by Program no 2, from the “Coriolan Dragulescu” Institute of Chemistry Timisoara, Romania and by a grant of the Ministry of Research, Innovation and Digitization, CNCS—UEFISCDI, project number PN-III-P4-PCE-2021-0089, within PNCDI III.

Data Availability Statement

Data are contained within the article.

Conflicts of Interest

The authors declare no conflict of interest.

References

  1. Yang, C.; Qian, Y.; Zhang, L.; Feng, J. Solvent extraction process development and on-site trial-plant for phenol removal from industrial coal-gasification wastewater. Chem. Eng. J. 2006, 117, 179–185. [Google Scholar] [CrossRef]
  2. Asghar, A.; Raman, A.A.A.; Daud, W.M. Advanced oxidation processes for in-situ production of hydrogen peroxide/hydroxyl radical for textile wastewater treatment: A review. J. Clean. Prod. 2015, 87, 826–838. [Google Scholar] [CrossRef]
  3. Dong, H.; Su, H.; Chen, Z.; Yu, H.; Yu, H. Fabrication of electrochemically reduced graphene oxide modified gas diffusion electrode for in-situ electrochemical advanced oxidation process under mild conditions. Electrochim. Acta 2016, 222, 1501–1509. [Google Scholar] [CrossRef]
  4. Mengoli, G.; Daolio, S.; Musiani, M.M. The influence of amines on the anodic coupling of phenols to polyoxyphenylene films. J. Appl. Electrochem. 1980, 10, 459–471. [Google Scholar] [CrossRef]
  5. Quiroz, M.A.; Sánchez-Salas, J.L.; Reyna, S.; Bandala, E.R.; Peralta-Hernández, J.M.; Martínez-Huitle, C.A. Degradation of 1-hydroxy-2,4-dinitrobenzene from aqueous solutions by electrochemical oxidation: Role of anodic material. J. Hazard. Mater. 2014, 268, 6–13. [Google Scholar] [CrossRef]
  6. Barisci, S.; Turkay, O.; Ozturk, H.; Sekar, M.G. Anodic oxidation of phenol by mixed-metal oxide electrodes: Identification of transformation by-products and toxicity assessment. J. Electrochem. Soc. 2017, 164, E129. [Google Scholar] [CrossRef]
  7. Xing, X.; Ni, J.; Zhu, X.; Jiang, Y.; Xia, J. Maximization of current efficiency for organic pollutants oxidation at BDD, Ti/SnO2-Sb/PbO2, and Ti/SnO2-Sb anodes. Chemosphere 2018, 205, 361–368. [Google Scholar] [CrossRef]
  8. Feng, Y.; Yang, L.; Liu, J.; Logan, B.E. Electrochemical technologies for wastewater treatment and resource reclamation. Environ. Sci. Water Res. Technol. 2016, 2, 800–831. [Google Scholar] [CrossRef]
  9. Tasic, Z.; Gupta, V.K.; Antonijevic, M.M. The mechanism and kinetics of degradation of phenolics in wastewaters using electrochemical oxidation. Int. J. Electrochem. Sci. 2014, 9, 3473–3490. [Google Scholar] [CrossRef]
  10. Liu, X.; You, S.; Ma, F.; Zhou, H. Characterization of electrode fouling during electrochemical oxidation of phenolic pollutant. Front. Environ. Sci. Eng. 2021, 15, 53. [Google Scholar] [CrossRef]
  11. Weiss, E.; Groenen-Serrano, K.; Savall, A. A comparison of electrochemical degradation of phenol on boron doped diamond and lead dioxide anodes. J. Appl. Electrochem. 2008, 38, 329–337. [Google Scholar] [CrossRef]
  12. Đuričić, T.; Prosen, H.; Kravos, A.; Mićin, S.; Kalčíková, G.; Malinović, B.N. Electrooxidation of phenol on boron-doped diamond and mixed-metal oxide anodes: Process evaluation, transformation by-products, and ecotoxicity. J. Electrochem. Soc. 2023, 170, 023503. [Google Scholar] [CrossRef]
  13. Feng, Y.J.; Li, X.Y. Electro-catalytic oxidation of phenol on several metal-oxide electrodes in aqueous solution. Water Res. 2003, 37, 2399–2407. [Google Scholar] [CrossRef] [PubMed]
  14. Iniesta, J.; González-García, J.; Expósito, E.; Montiel, V.; Aldaz, A. Influence of chloride ion on electrochemical degradation of phenol in alkaline medium using bismuth doped and pure PbO2 anodes. Water Res. 2001, 35, 3291–3300. [Google Scholar] [CrossRef] [PubMed]
  15. Zhi, J.-F.; Wang, H.-B.; Nakashima, T.; Rao, T.N.; Fujishima, A. Electrochemical incineration of organic pollutants on boron-doped diamond electrode. Evidence for direct electrochemical oxidation pathway. J. Phys. Chem. B 2003, 107, 13389–13395. [Google Scholar] [CrossRef]
  16. Chen, H.; Chen, S.; Quan, X.; Yu, H.; Zhao, H.; Zhang, Y. Fabrication of TiO2−Pt coaxial nanotube array schottky structures for enhanced photocatalytic degradation of phenol in aqueous solution. J. Phys. Chem. C 2008, 112, 9285–9290. [Google Scholar] [CrossRef]
  17. Kawde, A.N.; Morsy, M.A.; Odewunmi, N.; Mahfou, W. From electrode surface fouling to sensitive electroanalytical determination of phenols. Electroanalysis 2013, 25, 1547–1555. [Google Scholar] [CrossRef]
  18. Parisheva, Z.; Demirev, A. Ozonation of aqueous solutions of resorcinol and catechol. Environ. Prot. Eng. 2001, 2, 17–25. [Google Scholar]
  19. Martínez-Huitle, C.A.; Rodrigo, M.A.; Sirés, I.; Scialdone, O. A critical review on latest innovations and future challenges of electrochemical technology for the abatement of organics in water. Appl. Catal. B Environ. 2023, 328, 122430. [Google Scholar] [CrossRef]
  20. Urbansky, E.T.; Schock, M. Issues in managing the risks associated with perchlorate in drinking water. J. Environ. Manag. 1999, 56, 79–95. [Google Scholar] [CrossRef]
  21. Zhao, J.; Dang, Z.; Muddassir, M.; Raza, S.; Zhong, A.; Wang, X.; Jin, J. A New Cd(II)-Based Coordination Polymer for Efficient Photocatalytic Removal of Organic Dyes. Molecules 2023, 28, 6848. [Google Scholar] [CrossRef]
  22. Li, L.; Zou, J.; Han, Y.; Liao, Z.; Lu, P.; Nezamzadeh-Ejhieh, A.; Peng, Y. Recent advances in Al(iii)/In(iii)-based MOFs for the detection of pollutants. New J. Chem. 2022, 46, 19577–19592. [Google Scholar] [CrossRef]
  23. Zheng, M.; Chen, J.; Zhang, L.; Cheng, Y.; Lu, C.; Liu, Y.; Singh, A.; Trivedi, M.; Kumar, A.; Liu, J. Metal organic frameworks as efficient adsorbents for drugs from wastewater. Mater. Today Commun. 2022, 31, 103514. [Google Scholar] [CrossRef]
  24. Balasubramanian, A.; Venkatesan, S. Removal of phenolic compounds from aqueous solutions using Aliquat 336 as a carrier in emulsion liquid membrane. Korean J. Chem. Eng. 2012, 29, 1622–1627. [Google Scholar] [CrossRef]
  25. Bergmann, M.; Koparal, A.; Iourtchouk, T. Electrochemical advanced oxidation processes, formation of halogenate and perhalogenate species: A critical review. Crit. Rev. Environ. Sci. Technol. 2014, 44, 348–390. [Google Scholar] [CrossRef]
  26. Maranescu, B.; Lupa, L.; Mihali, M.T.L.; Plesu, N.; Maranescu, V.; Visa, A. The corrosion inhibitor behavior of iron in saline solution by the action of magnesium carboxyphosphonate. Pure Appl. Chem. 2018, 90, 1713–1722. [Google Scholar] [CrossRef]
  27. Simulescu, V.; Crasmareanu, E.; Ilia, G. Synthesis, Properties and Structures of Phosphorus-Nitrogen Heterocycles. Heterocycles 2011, 83, 275–291. [Google Scholar] [CrossRef]
  28. Maranescu, B.; Visa, A.; Ilia, G.; Simon, Z.; Demadis, K.; Colodrero, R.M.P.; Cabeza, A.; Vallcorba, O.; Rius, J.; Choquesillo-Lazarte, D. Synthesis and characterization of styryl phosphonic acid and its use as new ligand for phosphonate metal organic framework. J. Coord. Chem. 2014, 67, 1562–1572. [Google Scholar] [CrossRef]
  29. Vélez, G.Q.; Carmona-Sarabia, L.; Rodríguez-Silva, W.A.; Rivera Raíces, A.A.; Feliciano Cruz, L.; Hu, T.; Peterson, E.; López-Mejías, V. Potentiating bisphosphonate-based coordination complexes to treat osteolytic metastases. J. Mater. Chem. B 2020, 8, 2155–2168. [Google Scholar] [CrossRef]
  30. Visa, A.; Mracec, M.; Maranescu, B.; Ilia, G.; Popa, A.; Mracec, M. Structure simulation into a lamellar supramolecular network and calculation of the metal ions/ligands ratio. Chem. Cent. J. 2012, 6, 91. [Google Scholar] [CrossRef]
  31. Slepokura, K.; Piatkowska, A.; Lis, T. Isomorphous phosphonoacetic acid salts with magnesium (II), manganese(II), cobalt(II), zinc(II) and copper(II). Z. Krist.-Cryst. Mater. 2002, 217, 614–621. [Google Scholar] [CrossRef]
  32. Iliescu, S.; Ilia, G.; Pascariu, A.; Popa, A.; Plesu, N. Novel synthesis of phosphorus containing polymers under inverse phase transfer catalysis. Polymer 2006, 47, 6509–6512. [Google Scholar] [CrossRef]
  33. Iliescu, S.; Pascariu, A.; Plesu, N.; Popa, A.; Macarie, L.; Ilia, G. Unconventional method used in synthesis of polyphosphoesters. Polym. Bull. 2009, 63, 485–495. [Google Scholar] [CrossRef]
  34. Rocha, J.H.B.; Gomes, M.M.S.; Fernandes, N.S.; Da Silva, D.R.; Martínez-Huitle, C.A. Application of electrochemical oxidation as alternative treatment of produced water generated by Brazilian petrochemical industry. Fuel Process. Technol. 2012, 96, 80–87. [Google Scholar] [CrossRef]
  35. Krawczyk, P.; Skowroński, J.M. Multiple anodic regeneration of exfoliated graphite electrodes spent in the process of phenol electrooxidation. J. Solid State Electrochem. 2014, 18, 917–928. [Google Scholar] [CrossRef]
  36. Singh, R.N.; Anindita, D.M. Pd-1%Ni Composite Electrodes for Electrooxidation of Phenol in Acid Solution. Int. J. Electrochem. Sci. 2009, 4, 1638–1649. [Google Scholar] [CrossRef]
  37. Grabowska, E.; Reszczyńska, J.; Zaleska, A. Mechanism of phenol photodegradation in the presence of pure and modified-TiO2: A review. Water Res. 2012, 46, 5453–5471. [Google Scholar] [CrossRef] [PubMed]
  38. Stets, S.; Amaral, B.; Bach, L.; Nagata, N.; Peralta-Zamora, P.G. New insight into monitoring degradation products during the TiO2-photocatalysis process by multivariate molecular spectroscopy. Environ. Sci. Pollut. Res. 2017, 24, 6040–6046. [Google Scholar] [CrossRef]
  39. Leuaa, P.; Priyadarshani, D.; Tripathi, A.K.; Neergat, M. Internal and External Transport of Redox Species across the Porous Thin-Film Electrode/Electrolyte Interface. J. Phys. Chem. C 2019, 123, 21440–21447. [Google Scholar] [CrossRef]
  40. Leuaa, P.; Priyadarshani, D.; Choudhury, D.; Maurya, R.; Neergat, M. Resolving charge-transfer and mass-transfer processes of VO2+/VO2+ redox species across the electrode/electrolyte interface using electrochemical impedance spectroscopy for vanadium redox flow battery. RSC Adv. 2020, 10, 30887–30895. [Google Scholar] [CrossRef]
  41. Radjenovic, J.; Sedlak, D.L. Challenges and Opportunities for Electrochemical Processes as Next-Generation Technologies for the Treatment of Contaminated Water. Environ. Sci. Technol. 2015, 49, 11292–11302. [Google Scholar] [CrossRef]
  42. Zambrano, J.; Min, B. Comparison on efficiency of electrochemical phenol oxidation in two different supporting electrolytes (NaCl and Na2SO4) using Pt/Ti electrode. Environ. Technol. Innov. 2019, 15, 100382. [Google Scholar] [CrossRef]
  43. Iniesta, J.; Expósito, E.; González-Garcıá, J.; Montiel, V.; Aldaz, A. Electrochemical treatment of industrial wastewater containing phenols. J. Electrochem. Soc. 2002, 149, D57–D62. [Google Scholar] [CrossRef]
  44. Britto-Costa, P.H.; Ruotolo, L.A.M. Phenol removal from wastewaters by electrochemical oxidation using boron doped diamond (BDD) and Ti/Ti0.7Ru0.3O2 dsa® electrodes. Braz. J. Chem. Eng. 2012, 29, 763–773. [Google Scholar] [CrossRef]
  45. Crisan, L.; Bora, A. Small Molecules of Natural Origin as Potential Anti-HIV Agents: A Computational Approach. Life 2021, 11, 722. [Google Scholar] [CrossRef]
  46. Menachekanian, S.; Perez, C.M.; Pennathur, A.K.; Voegtle, M.J.; Blauth, D.; Prezhdo, O.V.; Dawlaty, J.M. Phenol as a tethering groupto gold surface: Stark response and comparison to benzenethiol. J. Phys. Chem. Lett. 2023, 14, 8353–8359. [Google Scholar] [CrossRef]
Figure 1. (a) Cu-PA structure and used materials and (b) impregnation sequence of Cu-PA with ionic liquid and retaining of PH.
Jcs 07 00510 g001
Figure 2. The desorption of PH from Cu-PA and Cu-PA-IL adsorbents in saline solution at rt.
Jcs 07 00510 g002
Figure 3. Cyclic voltammograms recorded for of (a) GC in 3% NaCl and 0.0025 M PH in NaCl scan 1 and 2, (b) electrooxidation of PH in saline solution at 1.5 V different time and (c) commercial graphite electrode (grade K254).
Jcs 07 00510 g003
Figure 4. UV-VIS spectra: (a) during electrooxidation of Cu-PA and (b) Cu-PA-IL in saline solution.
Jcs 07 00510 g004
Figure 5. (a) The ratio of peak intensity during EO and (b) EO stepway.
Jcs 07 00510 g005
Figure 6. (a) Nyquist and (b) Bode plots (log frequency vs. IZI and phase degree) recorded for Cu-PA and Cu-PA-IL saline solution at the first moments, (c) Nyquist and (d) Bode plots recorded for Cu-PA-PH saline solution and (e) Nyquist and (f) recorded for Cu-PA-IL- PH saline solution for different electrooxidation times at 1.5 V and (g) EEC used to fit the EIS data.
Jcs 07 00510 g006aJcs 07 00510 g006b
Figure 7. (a) Variation of Rct and Rd for Cu-PA and Cu-PA-IL saline solution with the EO time and (b) efficiency of PH electrooxidation (EOPH).
Jcs 07 00510 g007
Figure 8. FTIR spectra of (a) Cu-PA-IL and (b) Cu-PA.
Jcs 07 00510 g008
Figure 9. The variation in adsorption capacity of treated adsorbents for PH varies with the number of recycled cycles.
Jcs 07 00510 g009
Table 1. The kinetic parameters for PH desorption in saline solution.
Adsorbentqe exp.
mg/g
Pseudo-First OrderSecond OrderIntraparticle Diffusion Model
K1,
min−1
R2K2,
g mg−1 min−1
R2KI,
mg g−1 min−1/2
R2
Cu-PA9.570.01470.98181.202 × 10−40.95718.523 × 10−50.9597
Cu-PA-IL18.40.0860.96280.93 × 10−40.96592.04 × 10−40.9797
Table 2. Electrooxidation of PH: literature data.
ElectrodeElectrolytePhenol
mg L−2
pHTime,
h
Cell Potential, VCurrent Density,
mA cm2
Energy Consumption, kW/LRef
BODNaCl10076.74.550.002[41]
Ti-PtNaCl/
Na2SO4
1006669.60.025[42]
Ti-IrO2NaCl1005.523.51028[43]
Ti/Pt/SnO5/
SbO5
NaCl1006.223.52040
DSA®
(Ti/Ti0.7Ru0.3O2)
NaCl30350.76–0.878 150123[44]
BBD (boron-doped diamond)NaCl6070.76–0.878 150248[44]
GraphiteNaCl2.356.851.5100.29–0.44Present work
Disclaimer/Publisher’s Note: The statements, opinions and data contained in all publications are solely those of the individual author(s) and contributor(s) and not of MDPI and/or the editor(s). MDPI and/or the editor(s) disclaim responsibility for any injury to people or property resulting from any ideas, methods, instructions or products referred to in the content.

