Article

Collapse Resistance of Composite Structures with Various Optimized Beam–Column Connection Forms

1
Shanghai Fire Research Institute of MEM, Shanghai 200032, China
2
College of Civil Engineering, Tongji University, Shanghai 200092, China
*
Author to whom correspondence should be addressed.
J. Compos. Sci. 2023, 7(11), 477; https://doi.org/10.3390/jcs7110477
Submission received: 11 September 2023 / Revised: 10 October 2023 / Accepted: 7 November 2023 / Published: 15 November 2023
(This article belongs to the Section Composites Manufacturing and Processing)

Abstract

:
Steel–concrete composite structures are widely used in composite frame structures and super high-rise buildings. However, the lack of relevant building design standards to ensure their structural stability under extreme conditions has led to potential failures in beam–column connections due to excessive loads. These failures can trigger the progressive collapse of high-rise buildings, resulting in severe casualties. In this study, a comparative numerical analysis was conducted to evaluate the collapse resistance of composite structures in the event of a middle-column loss scenario, focusing on six commonly used beam–column connections. The results show that while the six connections exhibit minimal differences under normal operating conditions, they display significant variations when subjected to extreme loads. Furthermore, a design concept is proposed to enhance the collapse capacity of these structures, and its effectiveness is validated via analysis.

1. Introduction

Despite efforts to design and construct modern infrastructures to withstand external loads, the occurrence of extreme dynamic loads, such as earthquakes, vehicle collisions, and explosions, can still result in structural collapses and devastating casualties. Notable examples of such collapse accidents include the Ronan Point apartment building in Britain (1968) [1] and the Trade Centre Tower in New York City (2001) [2]. These incidents have underscored the significant threat posed by events like fires, explosions, man-made attacks, and vehicle crashes to structural safety, potentially leading to massive loss of life.
While the Department of Defense (DoD 2016) [3] and the General Services Administration guidelines (GSA 2016) [4] in the United States have proposed various procedures, strategies, and detailed methods (such as the tie force method, alternative load path method, and specific local resistance method) for urban infrastructure construction and critical buildings, adhering to these design codes for the anti-collapse design of traditional buildings is challenging due to high costs and complex construction processes. Therefore, it is crucial to optimize existing design methods and structural measures to enhance the collapse resistance of numerous existing buildings.
While extensive research has been conducted on the collapse resistance of concrete structures and steel structures, there is still a research gap when it comes to understanding the collapse resistance of steel–concrete composite structures. Wang et al. [5] conducted a study focusing on composite joints consisting of concrete-filled steel tube columns under a column removal scenario. They tested four specimens, with and without reinforced concrete slabs, to investigate their performance. The test results revealed that the composite nodes without the reinforced concrete plate experienced local buckling earlier at the top surface and the externally reinforced ring plate. Premature failure of the steel beam flange weakened the catenary effect.
In another study by Zhong et al. [6], the collapse resistance of steel–concrete composite beams with unequal spans was investigated via static loading tests. They examined the deformation development, damage modes, and resistance changes in composite structures at different span ratios. Finite element parameter analysis was also conducted in this study.
Dinu et al. [7] proposed a numerical model for a double-span steel frame structure and evaluated different beam–column connections. They found that the welded cover plate flange connection (CWP), haunch end-plate-bolted connection (EPH), and reduced beam section welded connection (RBS) exhibited good performance in terms of ductility and the catenary stage. The authors also suggested that strengthening the unstiffened extended end plate bolted connection could improve its progressive collapse resistance.
Wang et al. [8] investigated the progressive collapse behaviors of steel frames with various beam–column connections. Their study involved both experimental testing and numerical simulations. The results indicated that connections with welded flange plates exhibited higher flexural strength compared with those with bolts.
In a study by Guo et al. [9], the collapse resistance of rigid composite joints was studied and evaluated. The researchers found that these joints demonstrated good load-carrying capacity during the catenary stage.
Currently, research on structural anti-collapse predominantly centers on steel structures and concrete structures, with limited investigations into composite structures. However, given the escalating demand for composite structures in industrial and residential buildings, coupled with the heightened importance placed on anti-collapse measures, this paper seeks to enrich existing research knowledge concerning the anti-collapse of composite structures by addressing the following two pivotal issues: (a) the collapse failure modes of composite structures with varying beam–column connection forms, and (b) the selection of beam–column connection forms in structural design and construction.

2. Foundation of Theoretical Analysis

Currently, the field of engineering commonly employs connection forms such as welding, bolting, and hybrid connections that combine both welding and bolting [8,9]. These connection forms can be further classified into rigid, semi-rigid, and hinged (flexible) connections based on their rotational capacity strength, as depicted in Figure 1a, following the guidelines specified in Eurocode 3-Design of steel structures [10]. To provide a theoretical understanding of the significant influence of joints with different rotational stiffness on the structural anti-collapse capacity, the subsequent calculations and analyses initially focus on a structure equipped with ideal hinged connections and rigid connections.
Hypothesis 1. 
The beam–column joint is an ideal hinged connection, as illustrated in Figure 1b.
F 1 2 = F sin θ
tan θ = Δ y L
F A E = σ E = ε
Combining Equations (1)–(3),
F 1 2 A E sin θ = ε
Hypothesis 2. 
The beam–column joint is an ideal rigid connection, as illustrated in Figure 1c.
F 2 2 = 12 E I L 3 Δ y
M W = E ε
M = 6 E I L 2 Δ y
Combining Equations (5)–(7),
Δ y L F 2 4 E W = ε
Combining Equations (4) and (8),
D = F 1 F 2 = A 2 W Δ y 2 = k Δ y 2 ,   k = A 2 W
Note: D : the bearing capacity ratio; ε : the ultimate strain of the material; E : Young’s modulus; Δ y : the vertical displacement; W : the bending modulus of the cross-section; L : the span; and A : the cross-sectional area.
The relationship curve shown in Figure 1d represents Equation (9). The results indicate a substantial difference in bearing capacity between structures with hinge connections and rigid connections under ideal conditions. This difference becomes more pronounced as the structure approaches the collapse limit line. Furthermore, the structures demonstrate distinct anti-collapse capacities during the large deformation stage.
However, it is important to acknowledge that ideal rigid or hinge connections are rarely encountered in practical engineering applications. Instead, most connections take the form of semi-rigid connections, which provide a specific rotational stiffness to meet standard usage requirements. Therefore, it is advisable to select an appropriate connection form for conventional buildings that exhibits adequate rotational stiffness during the service stage, in accordance with specification requirements. Conversely, during the large deformation stage, the connection should demonstrate an excellent rotational capacity to enhance the ultimate bearing capacity and prevent structural collapse.
In this study, a comparative numerical analysis was conducted to investigate the collapse resistance of composite structures resulting from column failures. Six connection forms commonly used in engineering were examined, namely:
(1)
Fully welded beam–column connection (FEM-1);
(2)
Welding connection of the flange of the steel beam with local widening (FEM-2);
(3)
External stiffening ring plate connection (FEM-3);
(4)
Reduced steel beam section (RBS) connection (FEM-4);
(5)
Welded flange-bolted web connection (FEM-5);
(6)
Extended end-plate-bolted connection (FEM-6).
The numerical models of these six connections were compared based on the load–displacement curves at different stages of structural response, encompassing the elastic stage, plastic stage, catenary stage, and ultimate failure stage [11,12,13]. Moreover, the viability of the proposed anti-collapse design concept was substantiated via numerical computations employing a double-sided composite beam model.

3. Prototype Structure Description

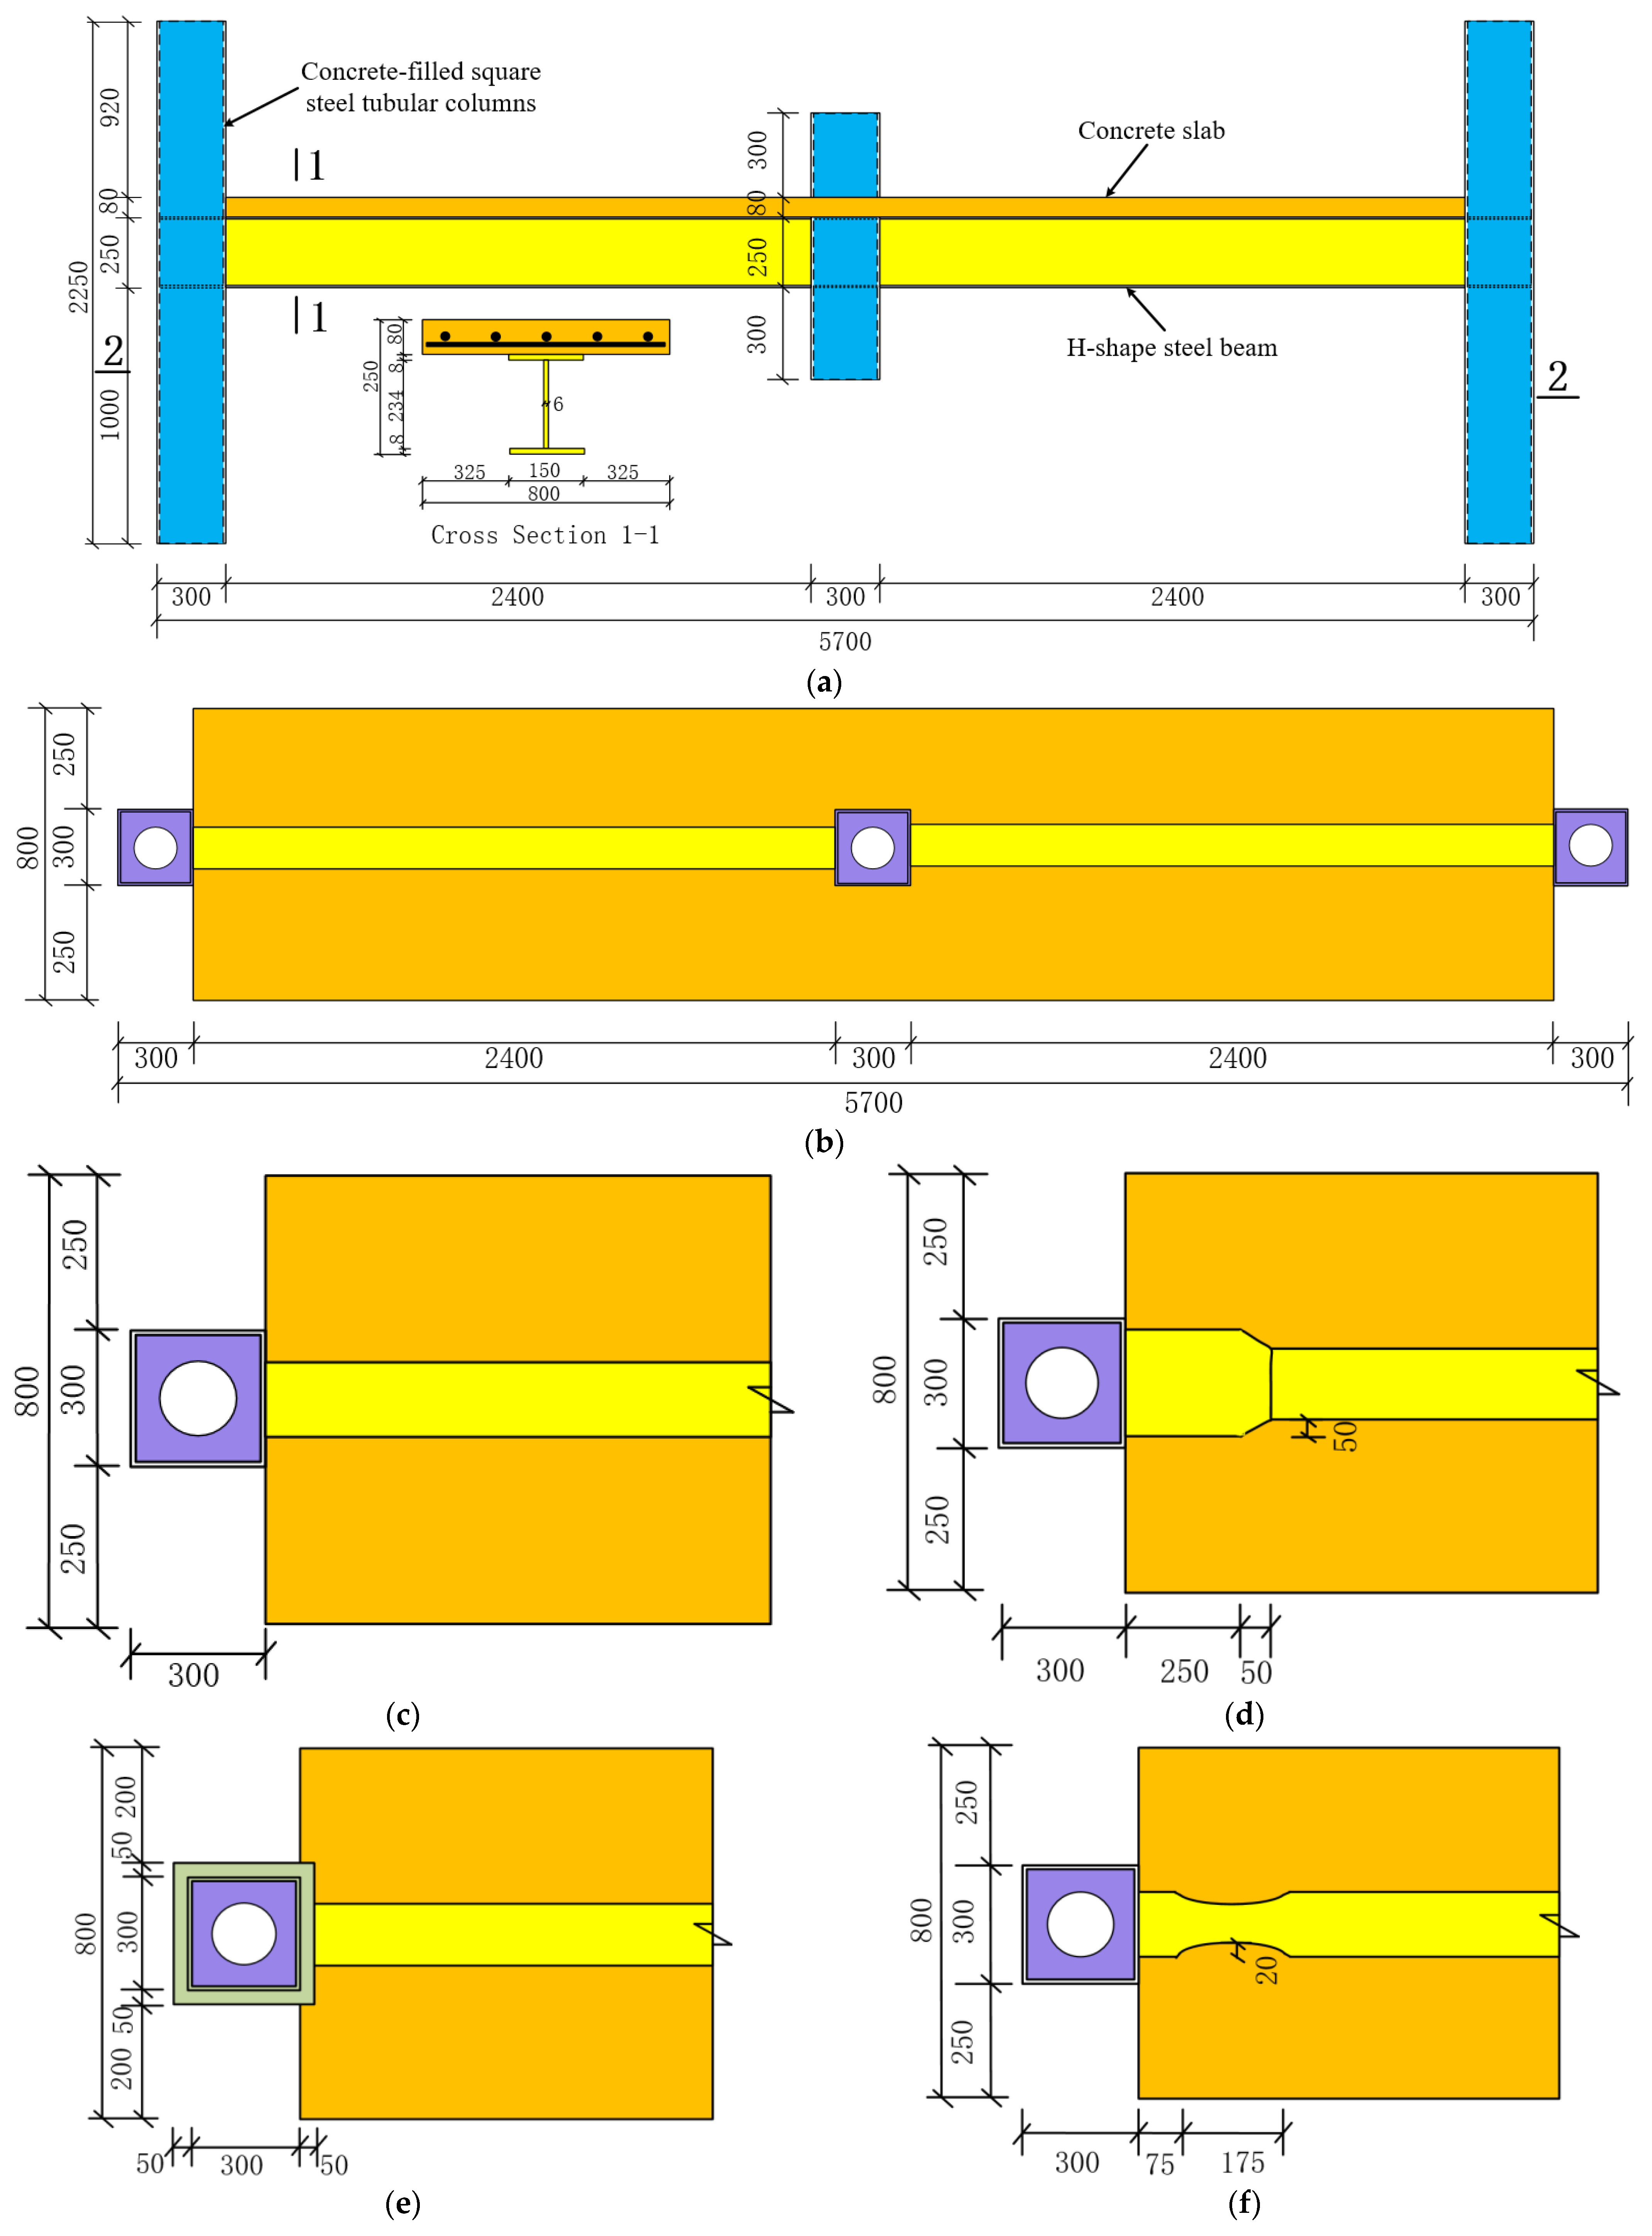
To accurately represent the performance of a composite floor system and ensure the alignment of the research content with real-world engineering scenarios, a meticulously designed typical multistory steel–concrete composite frame sub-system was chosen as a prototype structure for generating the numerical model [14,15], as depicted in Figure 2a. The sub-system consists of a concrete-filled steel tubular column and an H-shaped steel beam. Stud bolts are employed to connect the upper flange of the steel beam with the concrete floor. Specifically, one substructure was selected from the first floor of the peripheral composite frame. The side column of the two-dimensional steel frame is subjected to an axial load based on an axial compression ratio of 0.35. The boundary conditions of the substructure mirror those of the original structure, as illustrated in Figure 2b.

4. Finite Element Model Size

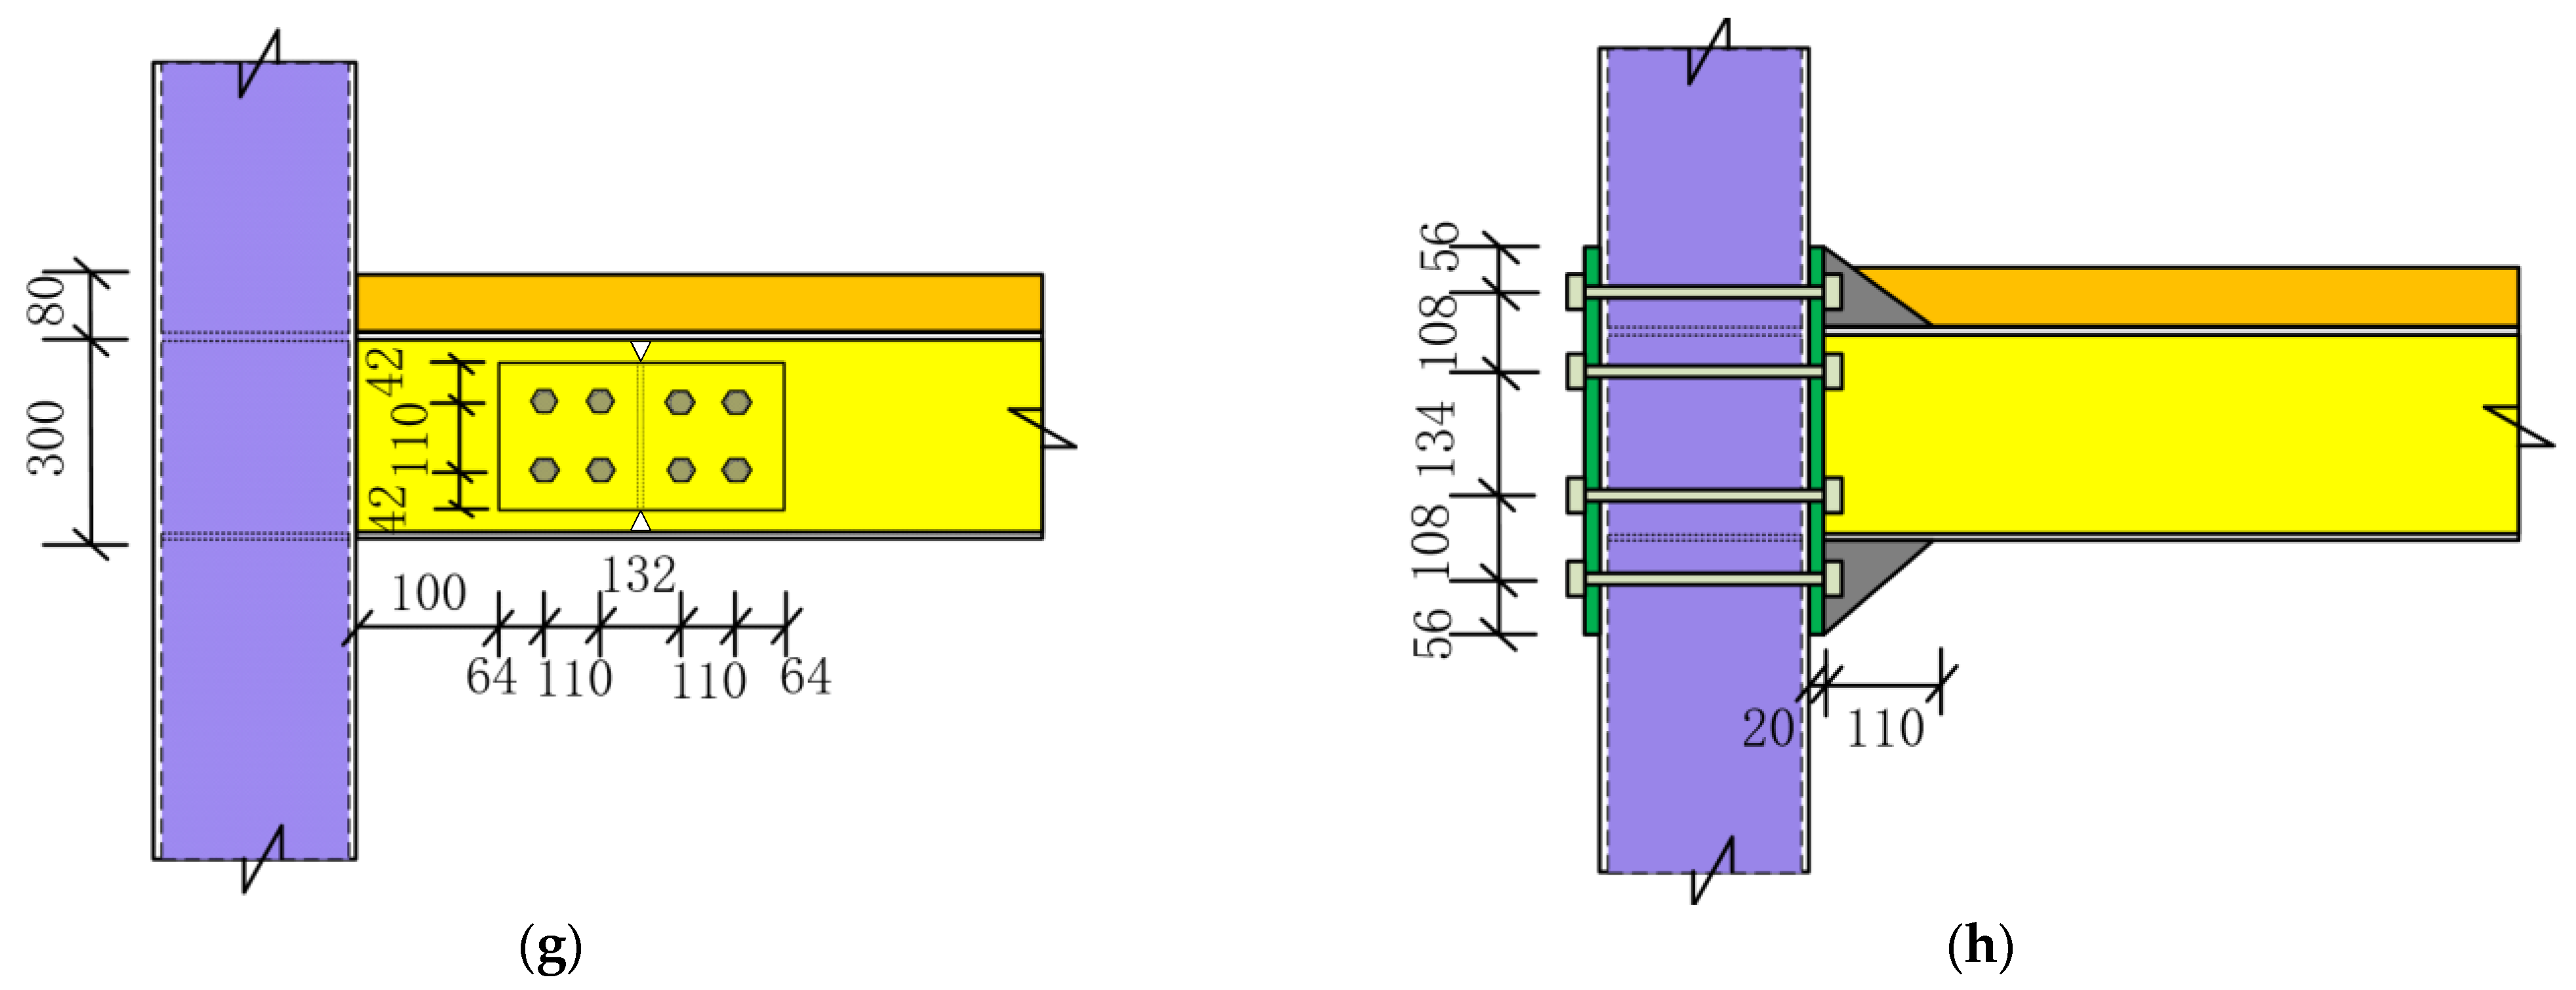
Six numerical models were generated to represent the structural components, with the only variation being the connection forms. These connection forms were selected in accordance with the Chinese Code GB 50017-2003 [14] and JGJ138-2016 [15] to investigate the influence of the joint rotation capacity on the collapse resistance of the structure. The square steel tube possesses a cross-section of 300 mm × 300 mm × 12 mm (length × width × thickness), while the side column has a height of 2250 mm and a span of 2400 mm. The H-shaped steel beam features a cross-section of H250 mm × 150 mm × 6 mm × 8 mm (height × width × web thickness × flange thickness), and the concrete slab has a cross-section of 800 mm × 80 mm (width × thickness). For further detailed dimensions of the substructure model, refer to Figure 3.

5. Finite Element Software Parameter Setting

Each numerical model in this study was developed using the commercial multipurpose finite element software package ABAQUS, considering both the material and geometric nonlinearity of steel and concrete, as the collapse state and large deformation are crucial aspects. For this analysis, the explicit dynamic analysis module and mass scaling were selected. Solid elements (C3D8R) were employed to represent the steel beam, column, concrete slab, and bolts, while truss elements (T3D2) were used for the reinforcement bars. In areas where stress concentration could lead to element deformation and model non-convergence, a smaller element size of 5 mm, such as for the bolts, was chosen. A grid size of 10 mm was utilized [16,17].
The connection forms between the concrete slab and the steel beam flange, as well as between the concrete and the steel column, were simulated as “tie” connections, representing a fully shear-resistant connection between a concrete slab and a steel beam. The reinforcement bars were appropriately embedded within the concrete slab. The contact surface between the high-strength friction-type bolts and the steel slab was modeled as “hard contact” with a tangential friction coefficient of 0.35, chosen to capture the frictional behavior. In this model, the axial compression ratio of the side column was set to 0.3, reflecting the applied axial load. The middle column was subjected to monotonic loading with vertical displacement, inducing the desired loading conditions [18], the loading was stopped when the failure load decreased to 85% of the ultimate load.
The high-strength friction-type bolts utilized in this study were M20-grade 8.9 bolts. The Poisson’s ratio and Young’s modulus values for the steel slab, bolts, and reinforcement bars were selected as 0.3 and 206,000 MPa, respectively. For concrete, a Poisson’s ratio of 0.2 and Young’s modulus of 30 GPa were assigned. To capture the behavior of the steel plate failure, a bilinear stress–strain curve model was adopted for the steel materials. Additionally, in order to simulate the fracture mode, a ductile metal failure criterion was chosen as the constitutive relationship for the steel material. Once the fracture strain was approached, the damaged elements could be deleted immediately. For the detailed material properties of the steel slab, concrete, bolts, and reinforcement bars, please refer to Table 1 and Figure 4.
Compressive relationship of concrete:
σ = ( 1 d c ) E c ε ,   d c =   { 1 ρ c α c ( x 1 ) 2 + x , x > 1 1 ρ c n n 1 + x n , x 1 ,   ρ c = f c , r E c ε c , r ,   n = E c ε c , r E c ε c , r f c , r ,   x = ε ε c , r
α c : the parameters of the failing section of the stress–strain curve under the uniaxial compression of concrete; f c , r : the uniaxial compressive strength of concrete; ε c , r : the peak compressive strain of concrete corresponding to the uniaxial compression strength; and d c : the damage evolution parameters of concrete under uniaxial compression.
Tensile relationship of concrete:
σ = ( 1 d t ) E c ε ,   d t = { 1 ρ t ( 1.2 0.2 x 5 ) , x 1 1 ρ t α t ( x 1 ) 1.7 + x , x > 1 ,   ρ t = f t , r E c ε t , r ,   x = ε ε t , r
α t : parameters of the failing section of the uniaxial tensile stress–strain curve of concrete; f t , r : the representative value of the uniaxial tensile strength of concrete; ε t , r : the peak compressive strain of concrete corresponding to the uniaxial compressive strength; and d t : the evolution parameter of the uniaxial tensile damage of concrete.

6. Finite Element Method Validation

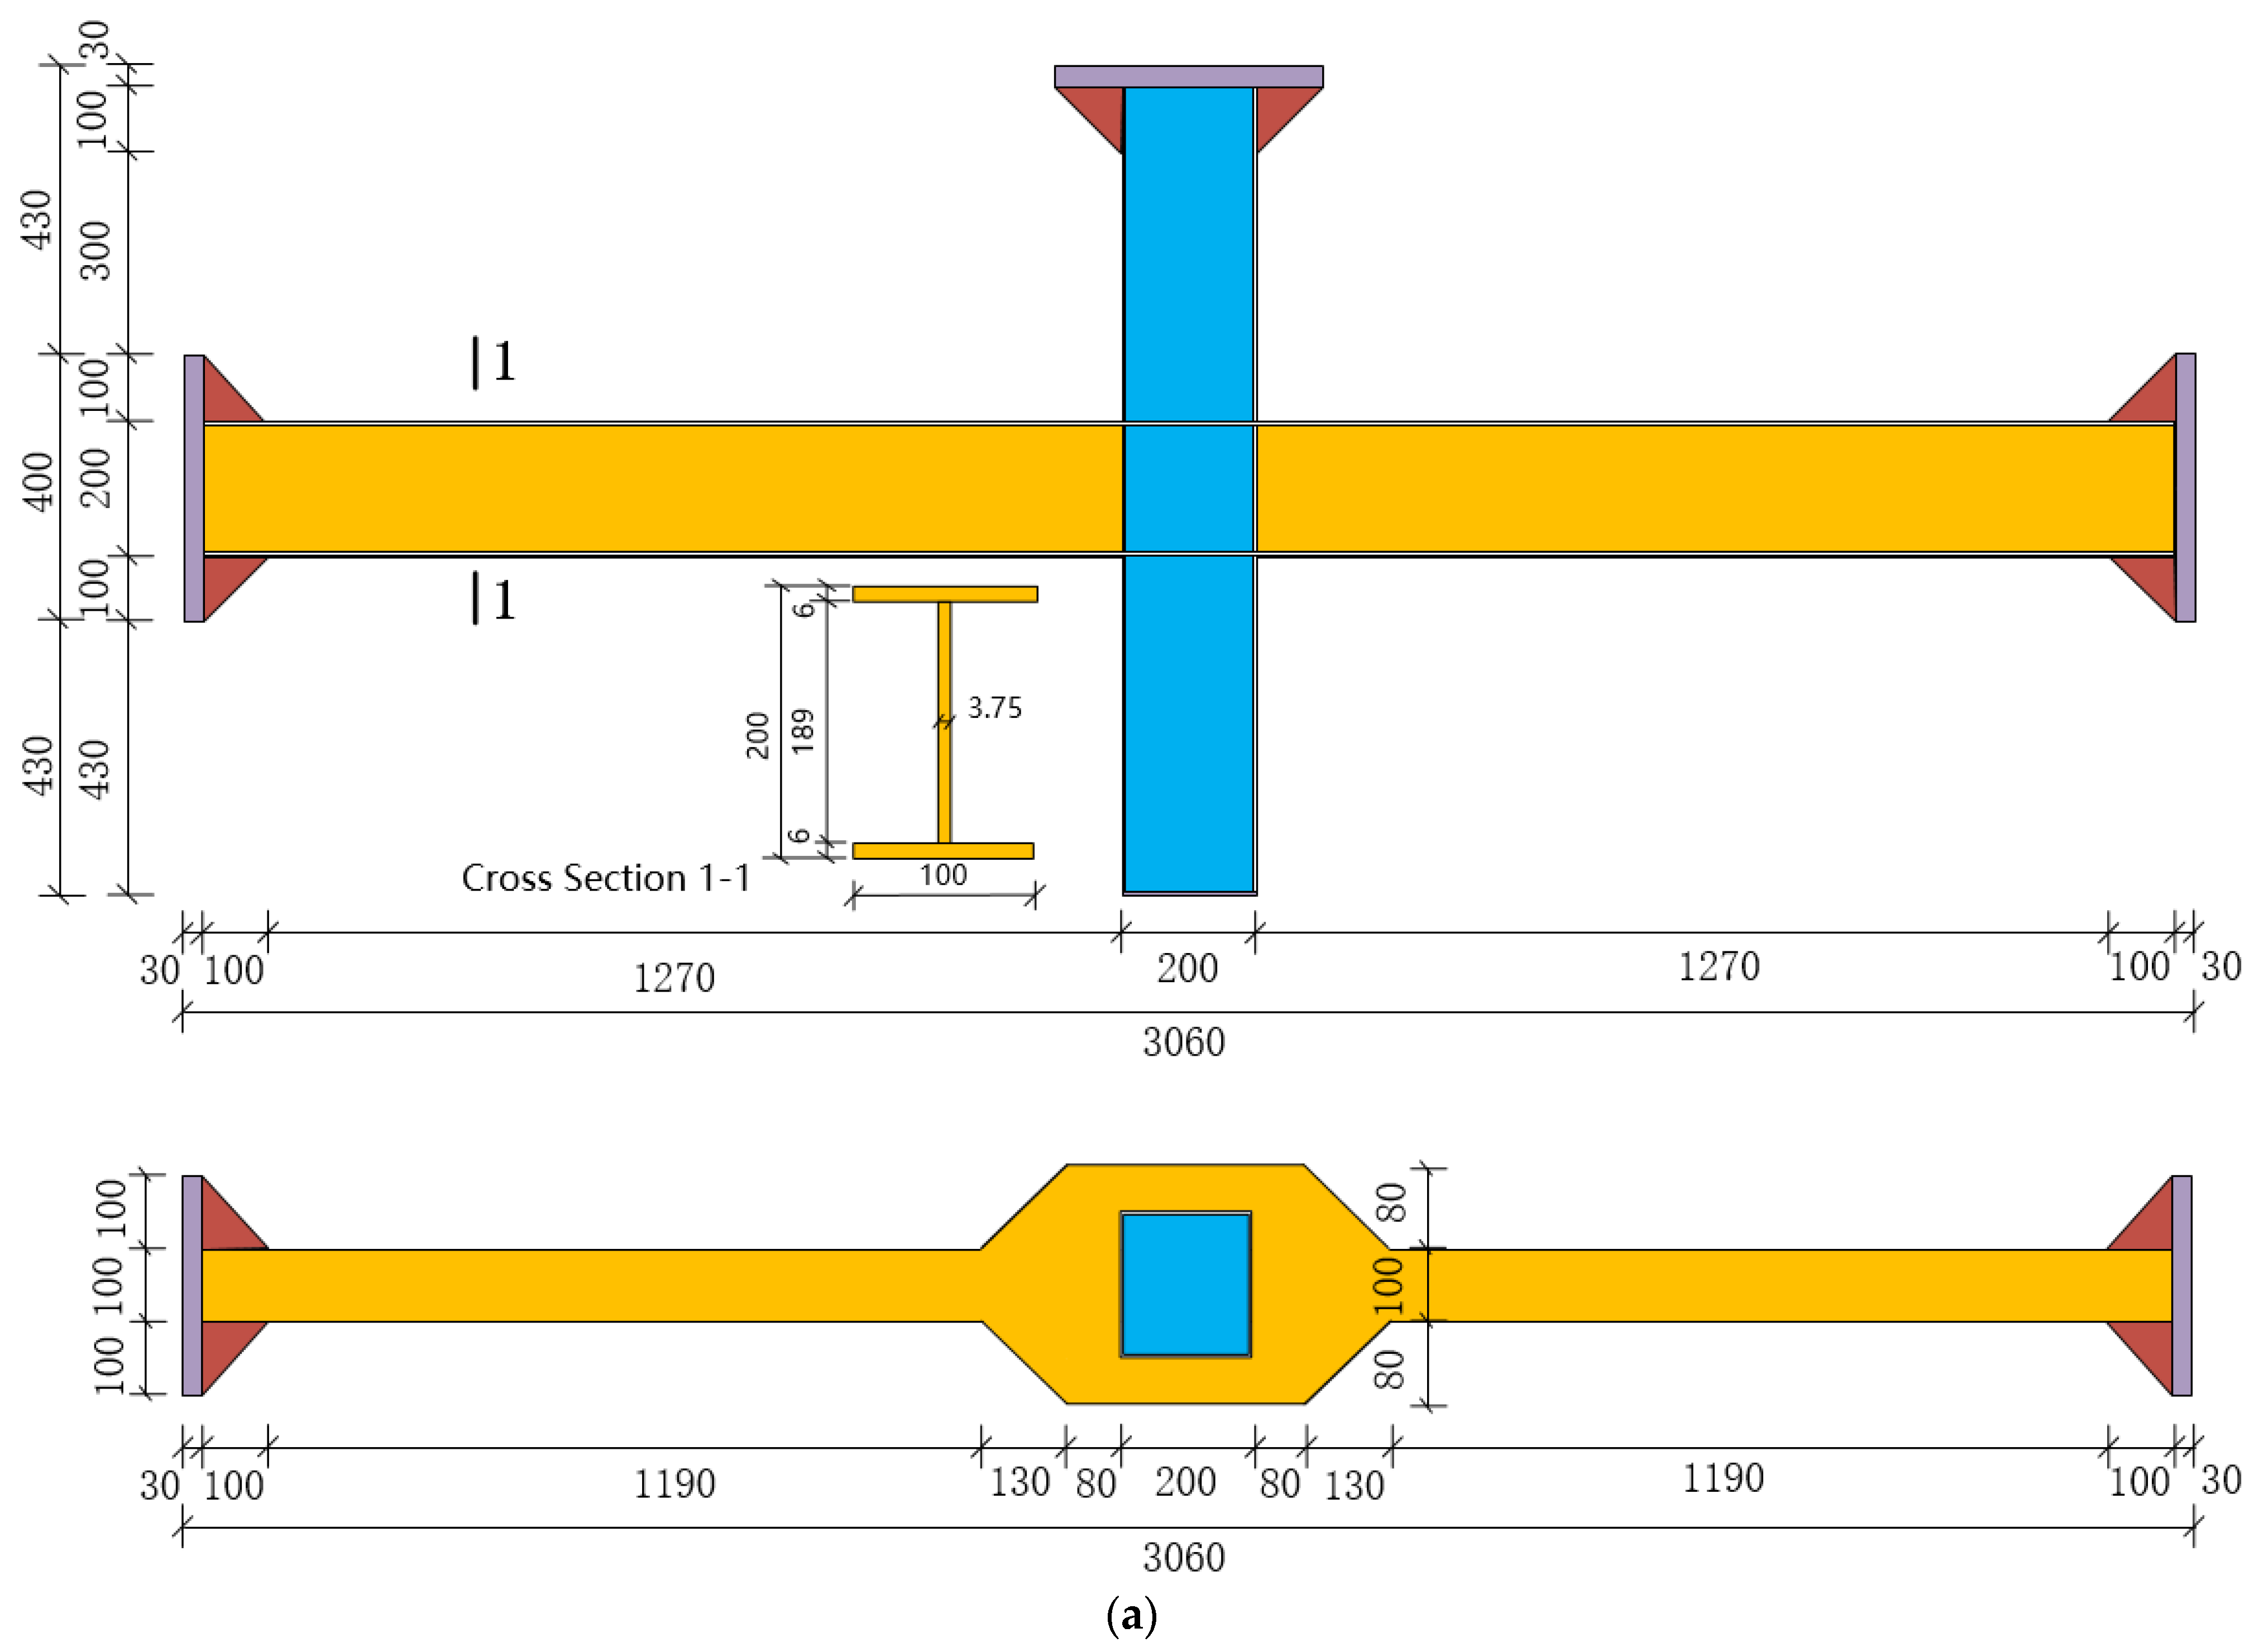
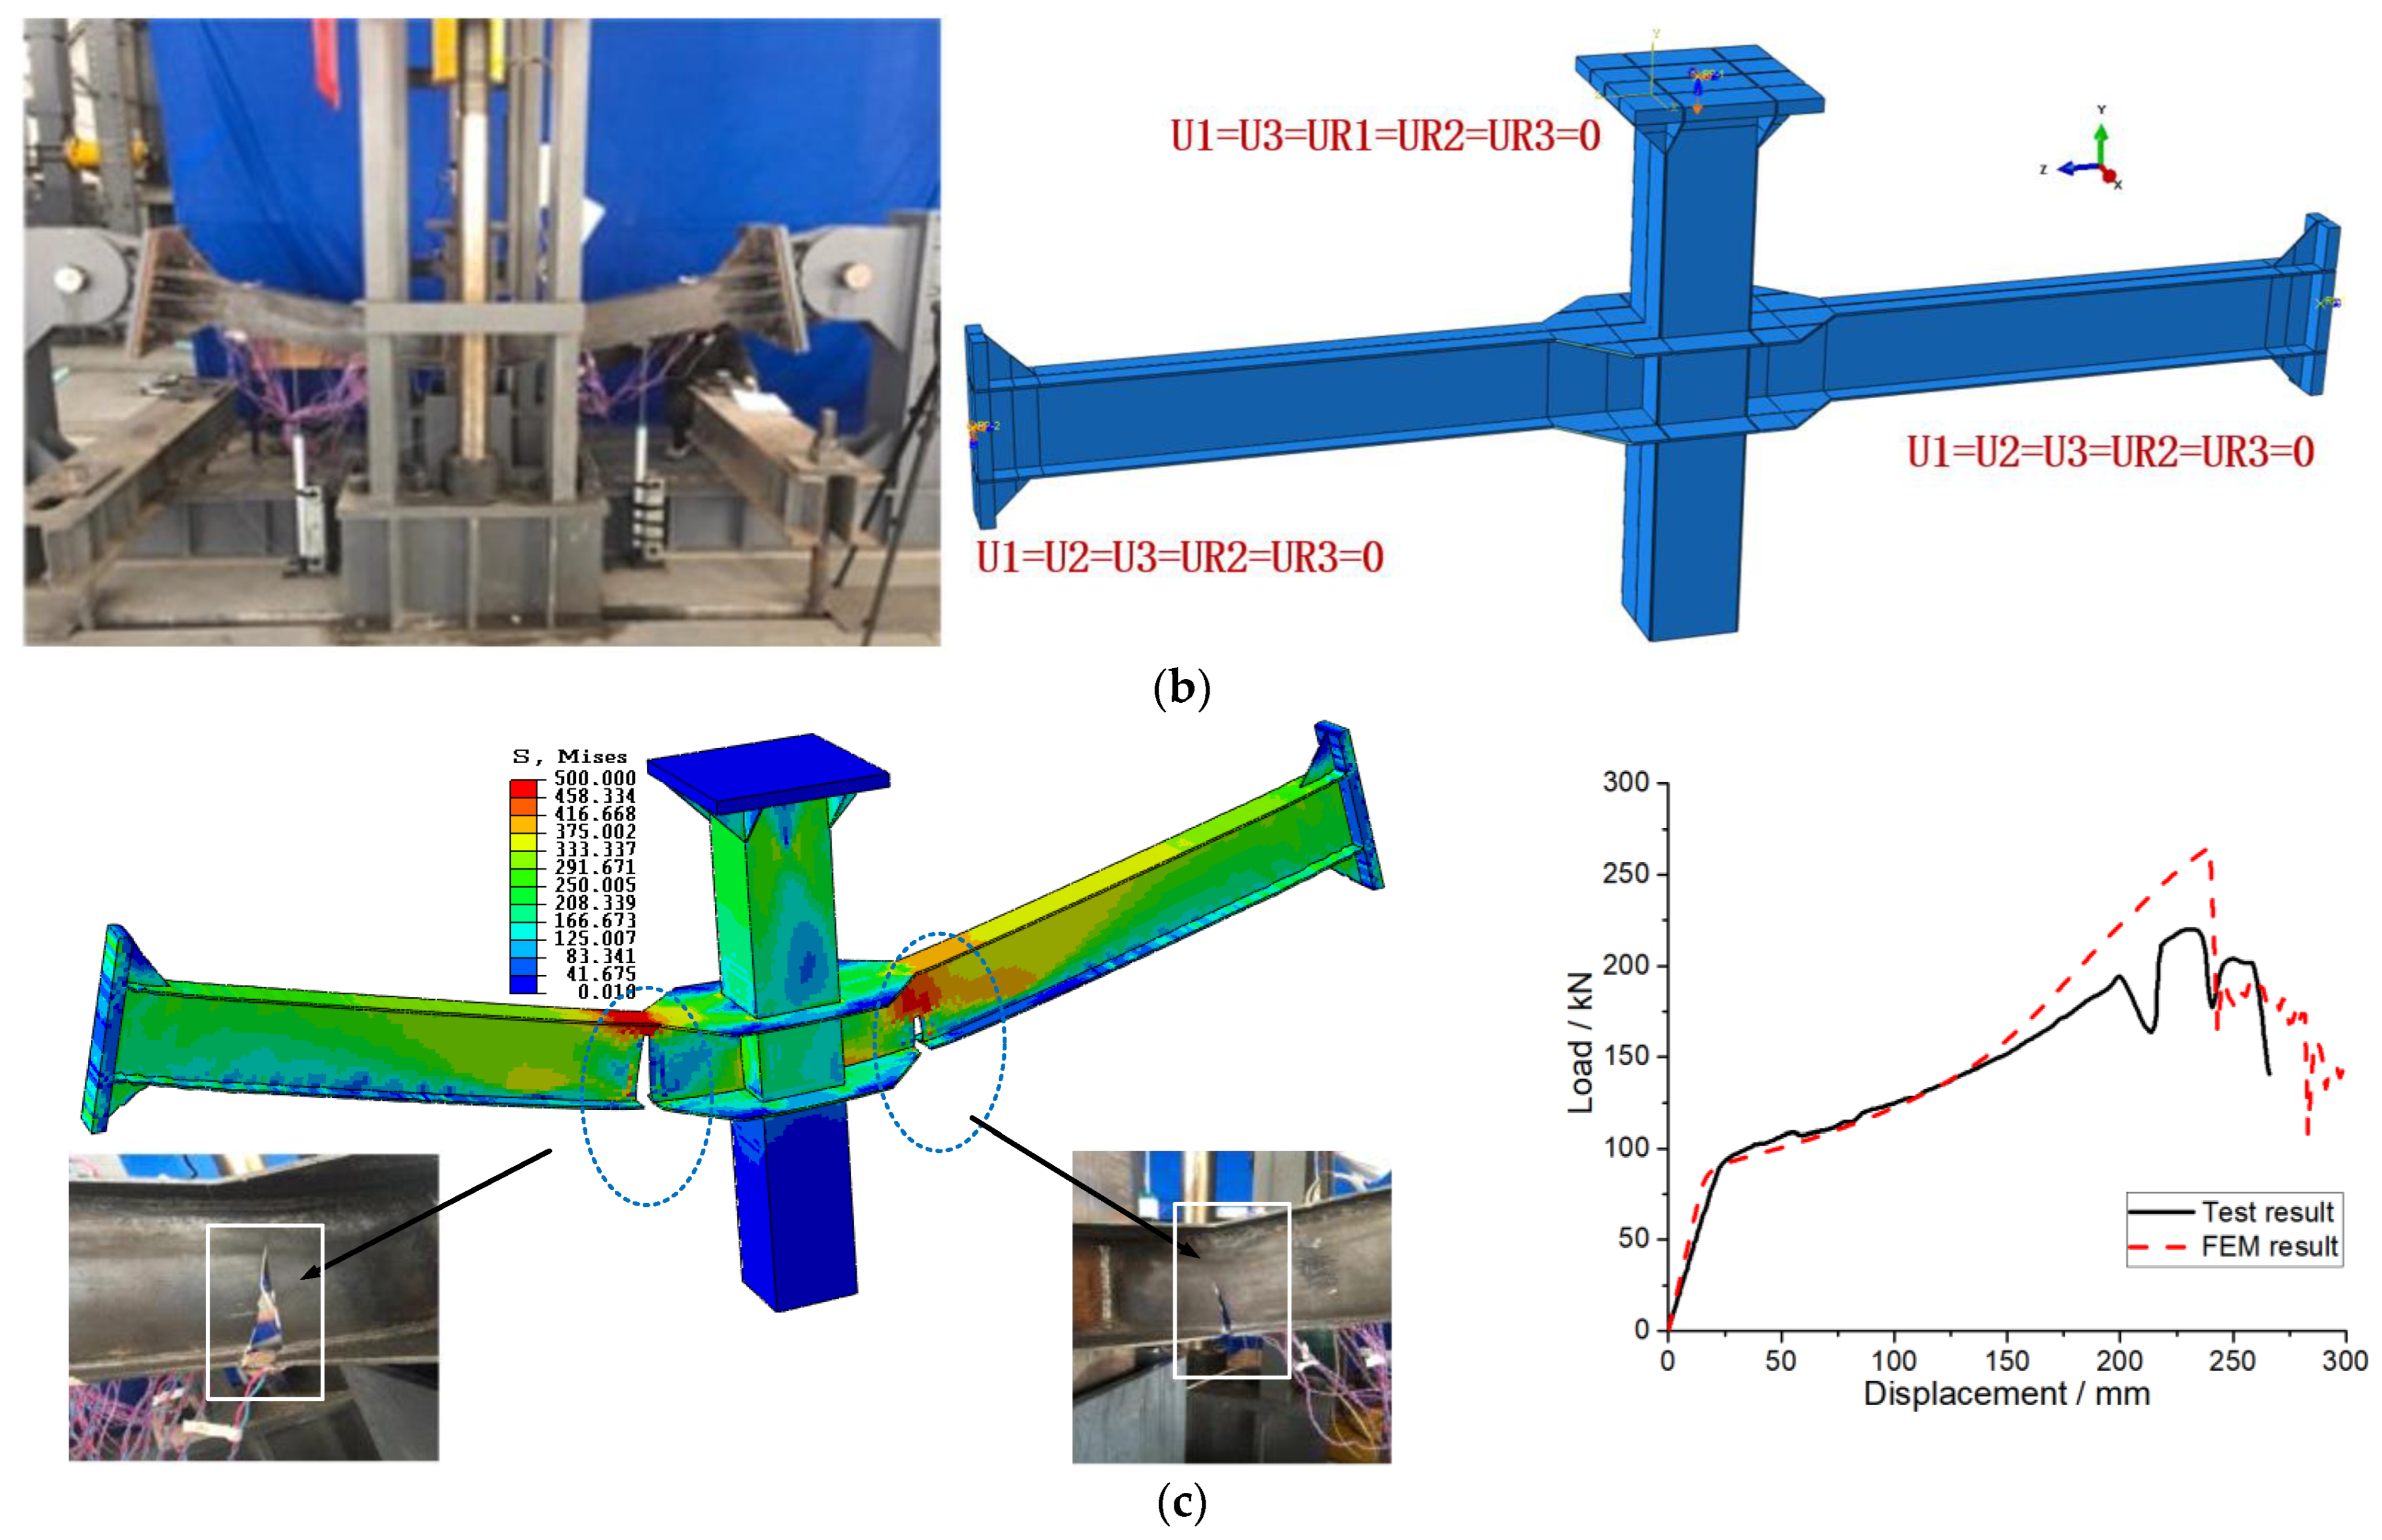
In this study, a finite element model was developed using the aforementioned finite element method, and its validity and reliability were established by comparing it with an experimental result reported by Wang [19]. The experimental setup involved applying a vertical load from a hydraulic jack on the top of the central columns, while the steel beam was connected to the reaction frame via hinged support. The maximum vertical displacement reached 500 mm [20]. The detailed information and results of the experiment are presented in Figure 5. Significantly, the final numerical results concerning the fracture location and the damage model of the steel beams exhibit similarities to the experimental observations, as depicted in Figure 5c. Moreover, there is minimal deviation between the load–displacement curves obtained from the numerical analysis and the experimental test. These findings provide evidence for the agreement between the numerical and experimental values, thus affirming the reliability and accuracy of the proposed numerical method in predicting the progressive collapse behavior of composite structures.

7. Results of Finite Element Analysis

7.1. Comparison of FEM-1 and FEM-3

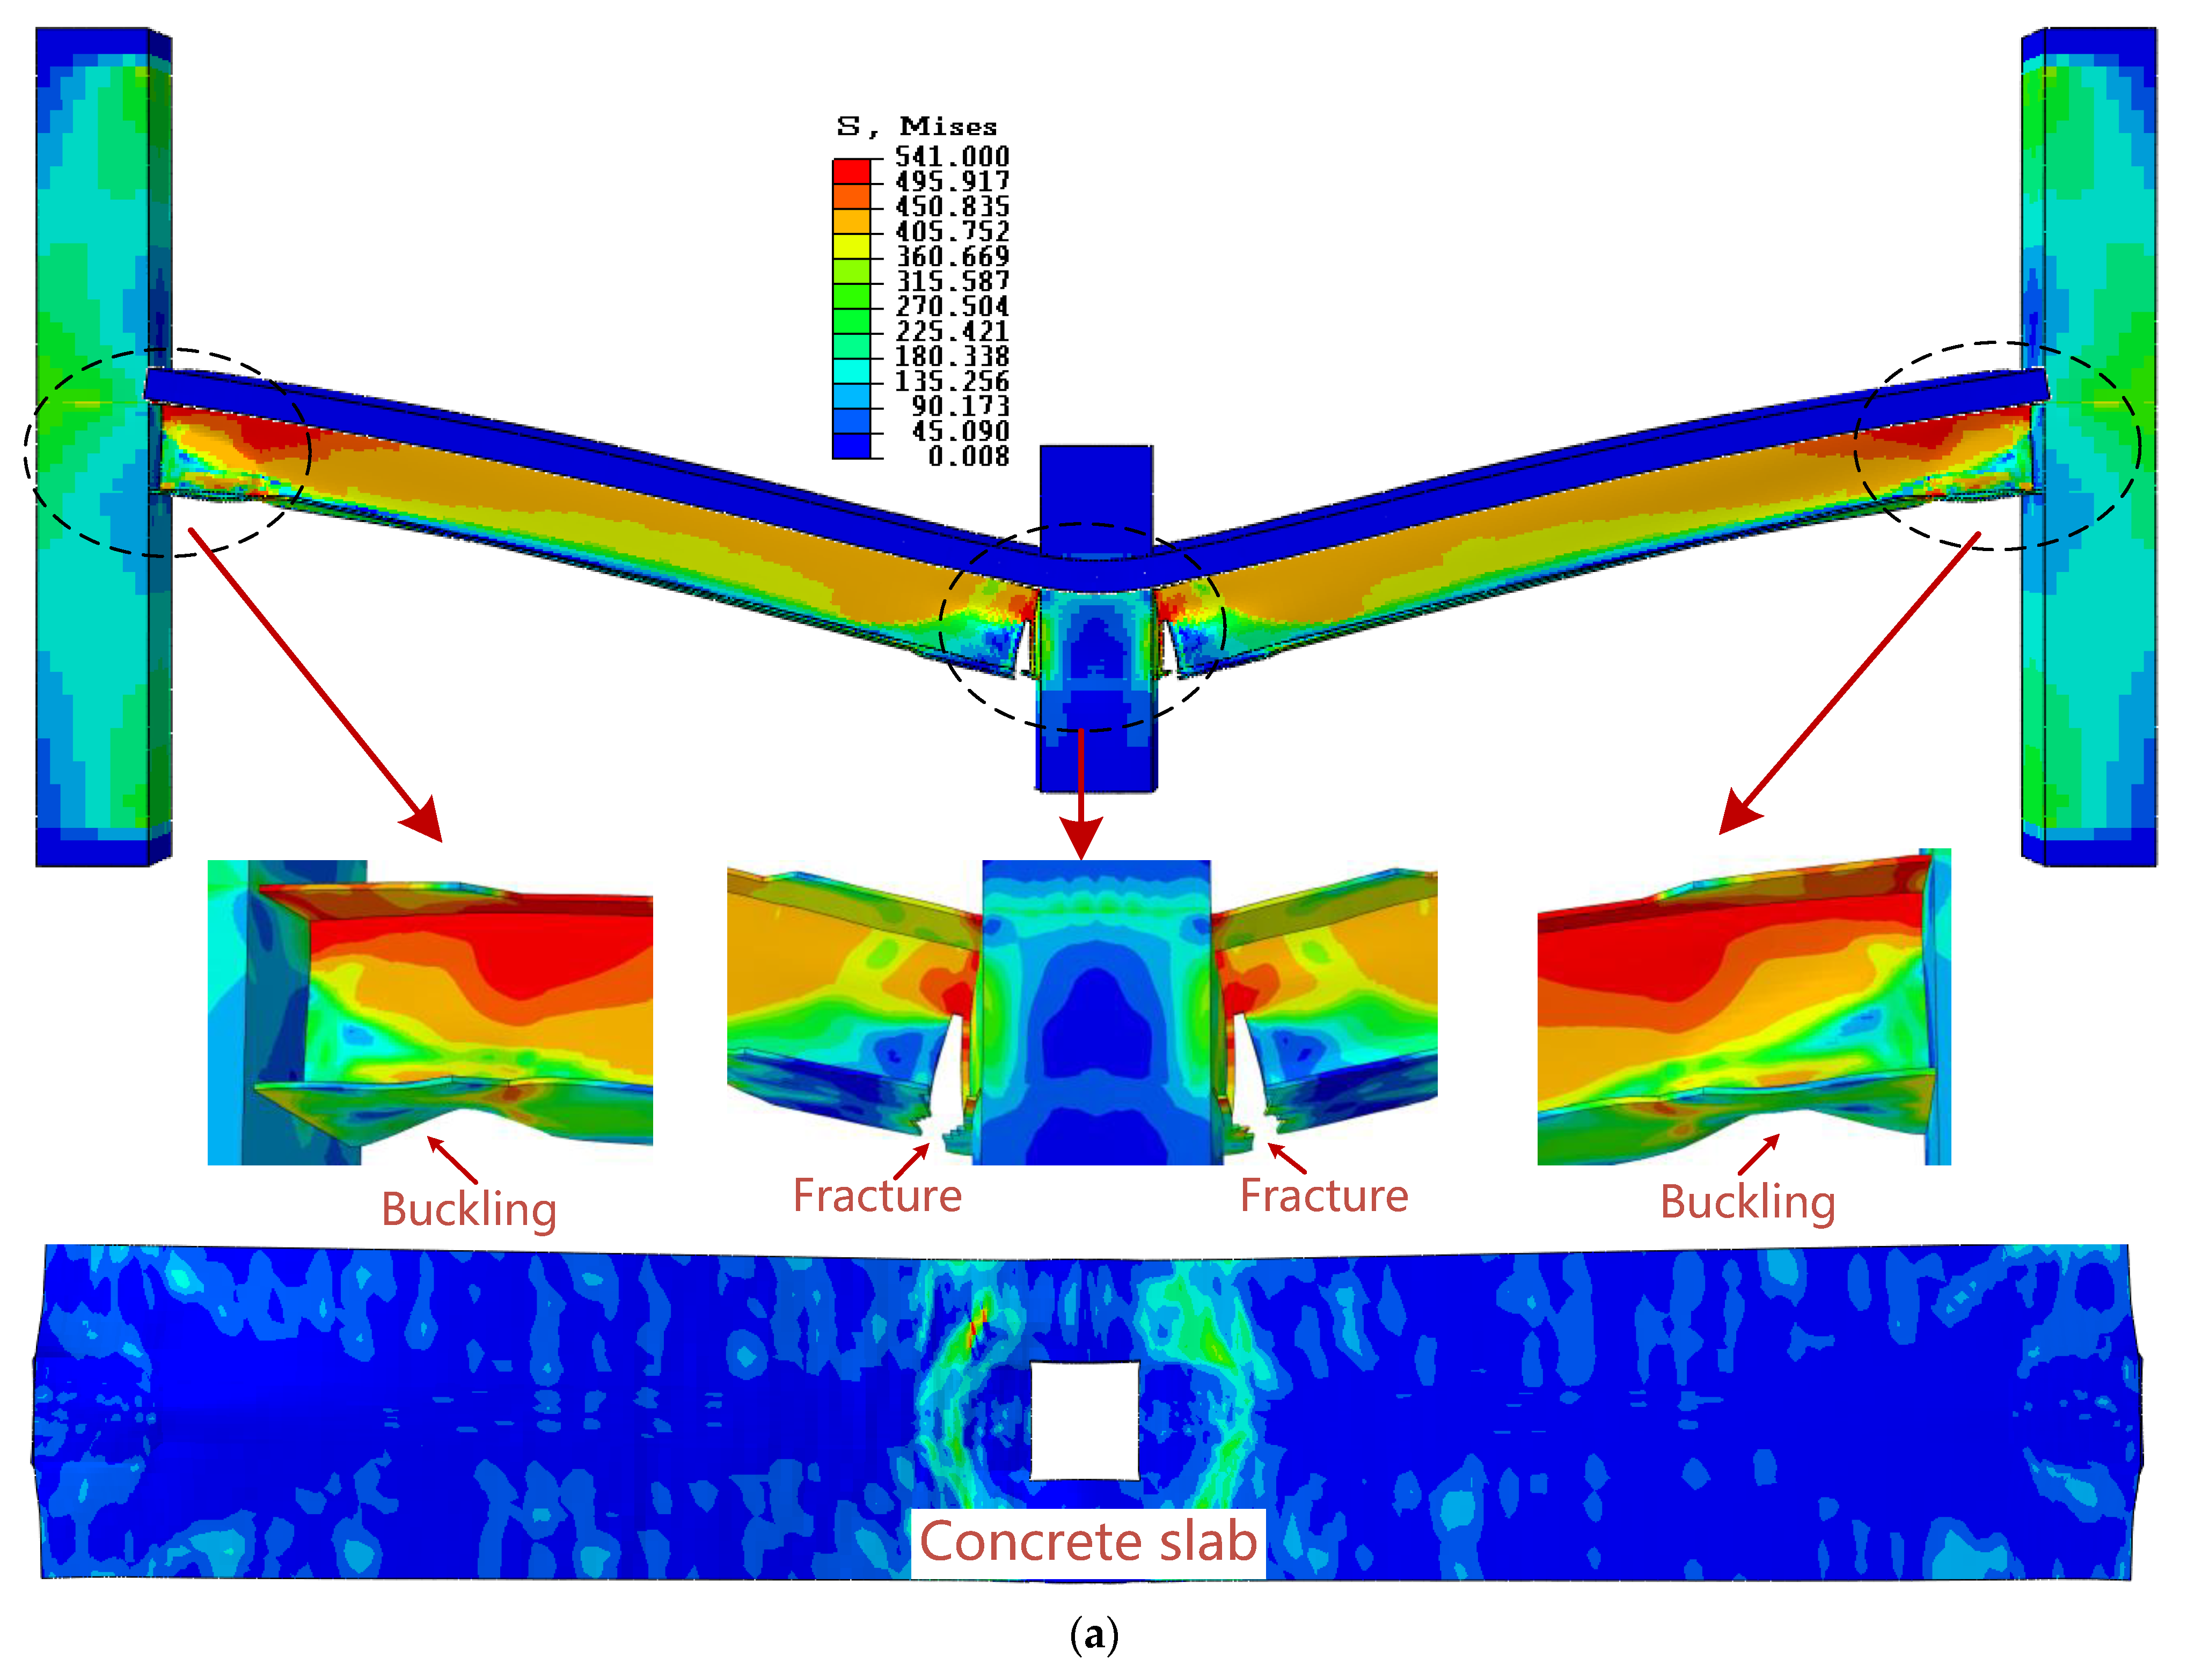
The results obtained from the numerical models FEM-1 and FEM-3 are presented in Figure 6. The load–displacement curves illustrate that the differences between the two models only become apparent at the catenary stage. Specifically, FEM-3 exhibits a 10.1% higher ultimate load compared with FEM-1, indicating its superior load-carrying capacity. Additionally, FEM-3 demonstrates an enhanced ductility performance, as shown in Figure 6e,f, which can be attributed to the restraining effect of the external stiffer ring plate on the steel flange. Concerning the ultimate failure mode, the fracture locations of the steel slabs in FEM-3 are distributed around the side column and middle column joints, whereas in FEM-1, the fracture locations of the steel plate are concentrated on both sides of the middle column.
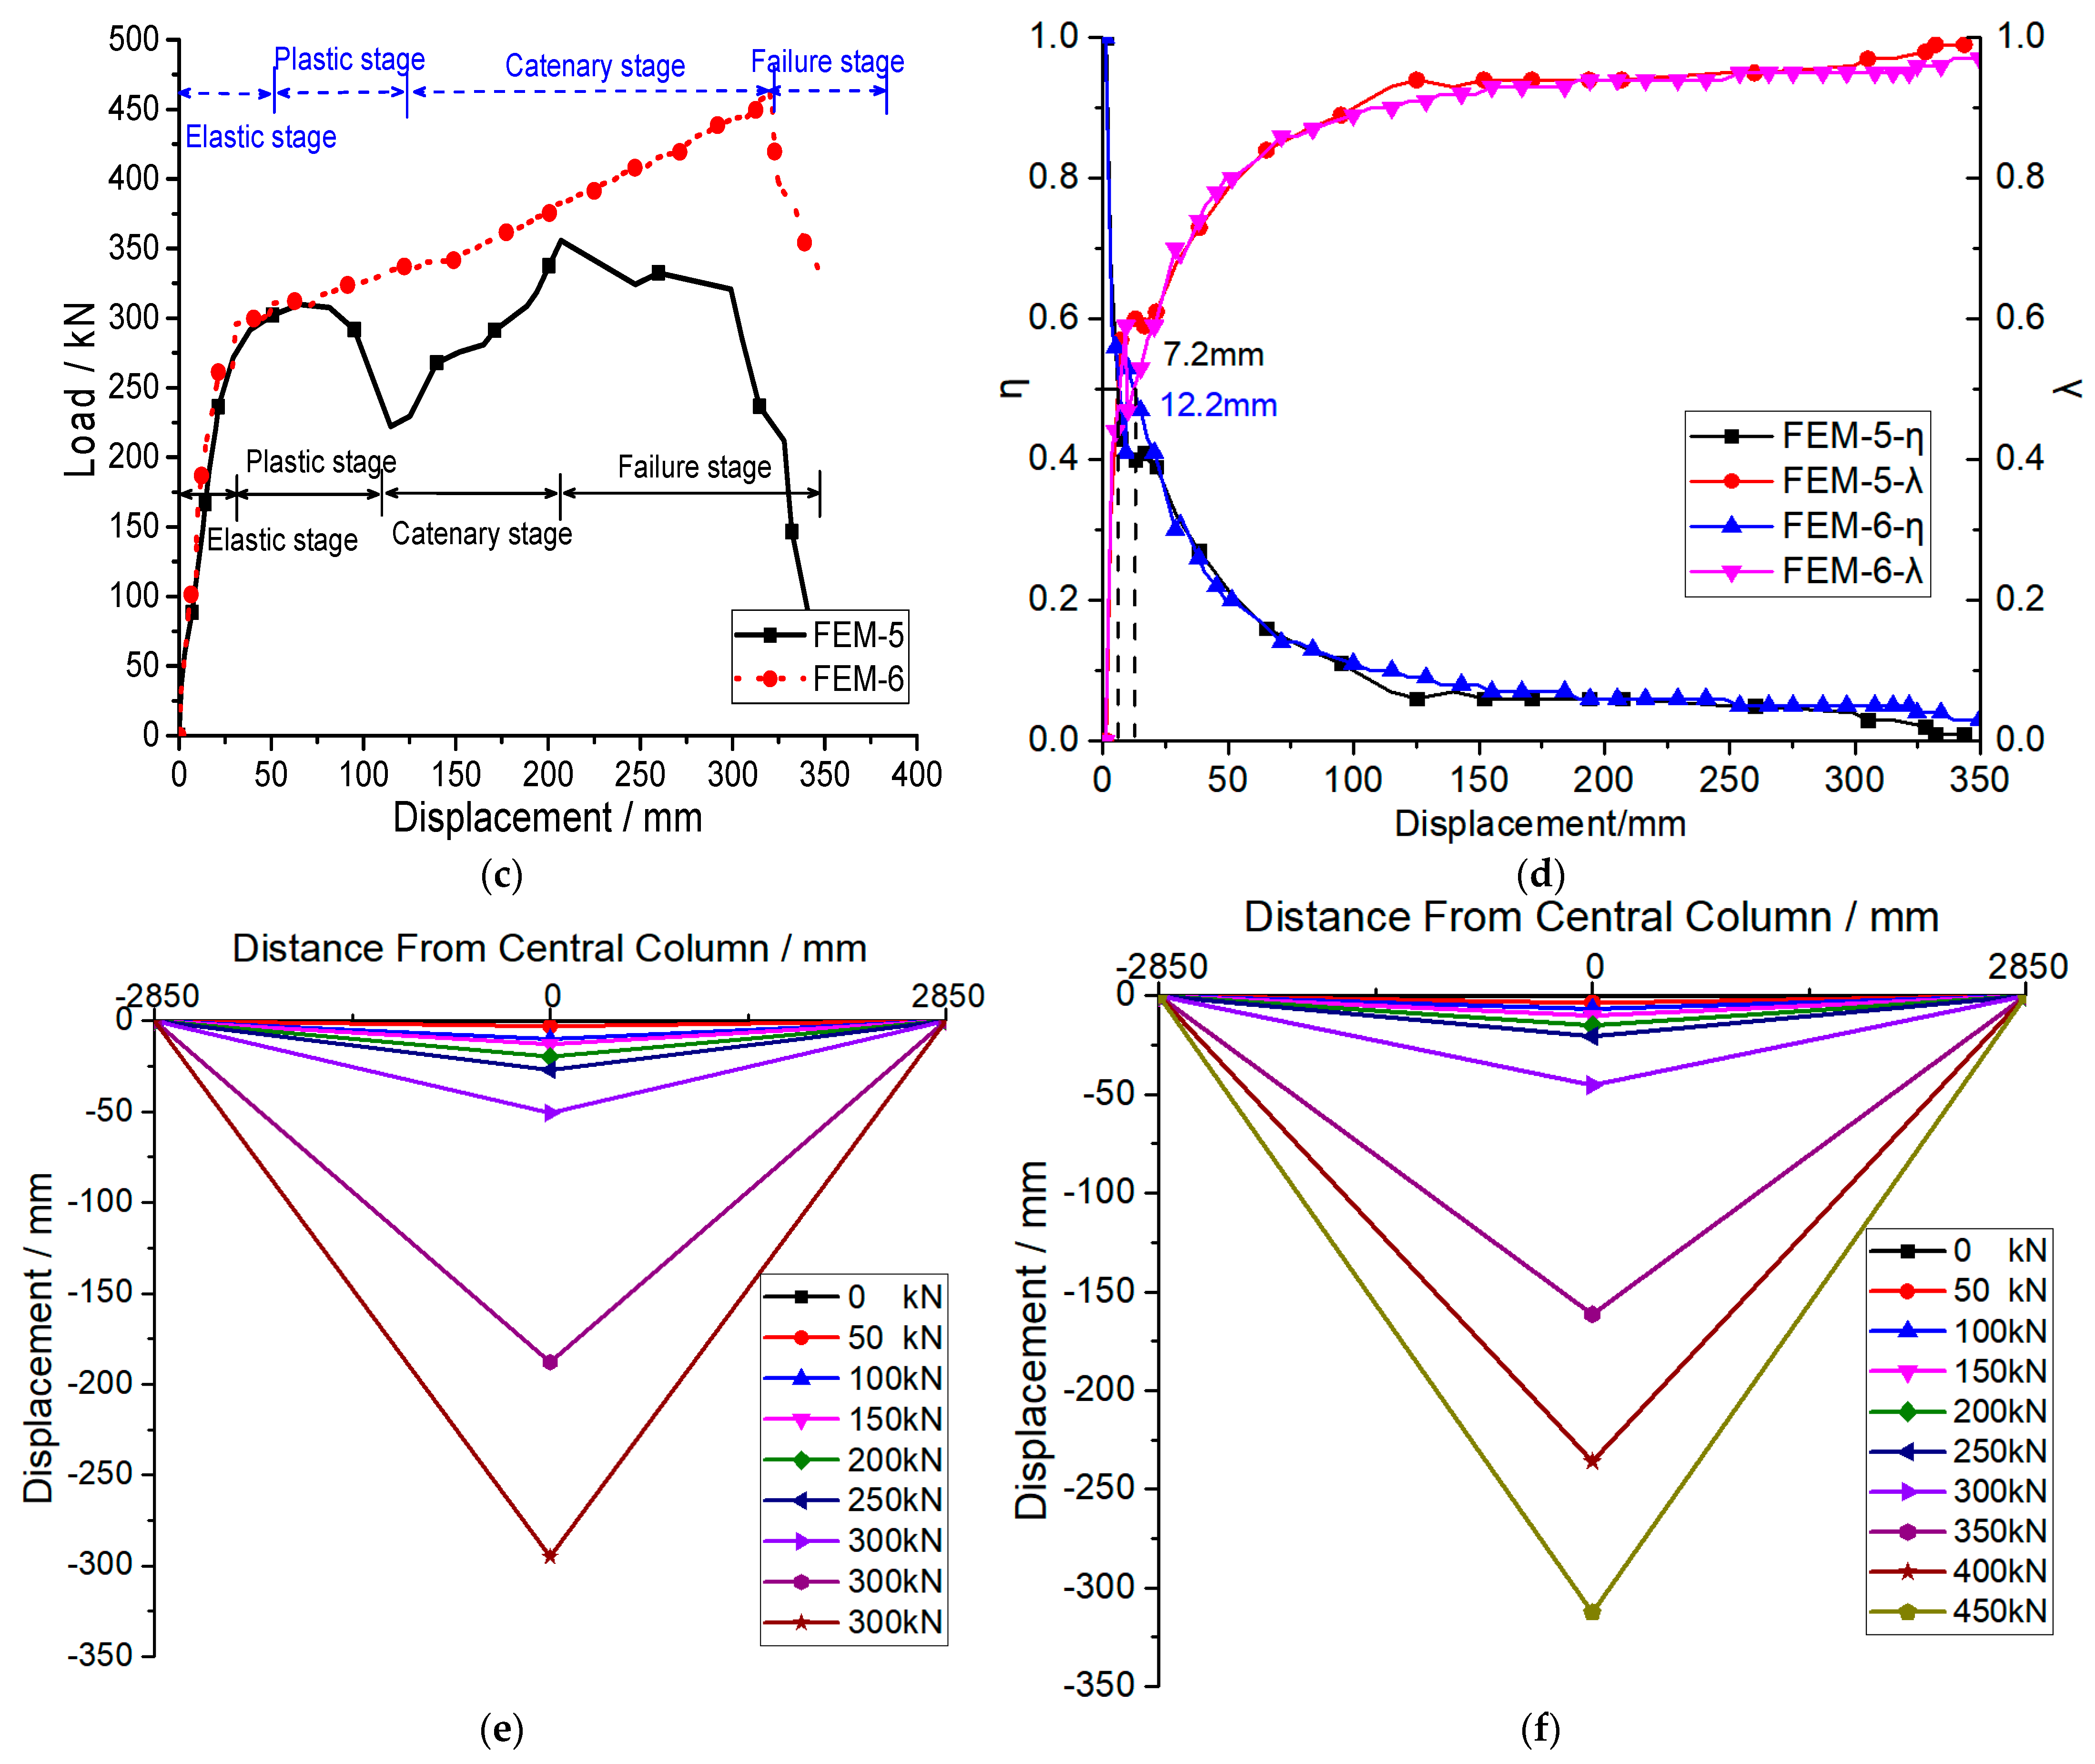
As the loading progresses, the structural stiffness undergoes a decrease due to the accumulated damage in both the concrete and steel components. To explore the pattern of stiffness accumulation during the loading process, two new concepts are introduced: the stiffness attenuation coefficient η and the cumulative stiffness damage influence coefficient λ . The stiffness attenuation coefficient of the structure η = K i K o ( K i : the secant stiffness of structure under grade i loading; K o : the initial secant stiffness of the structure) reflects the variation in structural stiffness with loading. On the other hand, the cumulative stiffness damage influence coefficient η = 1 λ indicates the extent to which stiffness is affected by the accumulated damage during loading. Additionally, η = λ = 0.5 shows that the structural stiffness decays by half, and the corresponding displacement value marks the point of the half-life for the structural stiffness, which serves as a significant indicator of the structural stiffness.
Through a detailed analysis of the load–displacement curves depicted in Figure 6c for each finite element model, the stiffness attenuation curve and cumulative stiffness damage influence coefficient curve shown in Figure 6d can be generated. The point at which the stiffness decays by half assumes critical importance, as it signifies a significant decline in the structural mechanical properties during this stage. To identify this point accurately, the stiffness attenuation curve and cumulative stiffness damage influence coefficient curve are plotted on the same graph, and their intersection corresponds to the half-life point of the structural stiffness.
As the intact structure is more vulnerable to damage, the initial loading stage is typically characterized by the rapid development of structural damage and a faster rate of decrease in structural stiffness. During this stage, the curve in Figure 6d exhibits a significant decline in structural stiffness as the loading process advances rapidly. When the displacement reaches 26.4 mm, both FEM-1 and FEM-3 reach the half-life stiffness simultaneously. Subsequently, the structural damage stabilizes, and the influence of new damage on structural performance diminishes. The final stiffness level remains at approximately 10% of the initial stiffness. It is noteworthy that there is no substantial difference in stiffness attenuation between FEM-1 and FEM-3.

7.2. Comparison of FEM-2 and FEM-4

In the current design code, the positioning of plastic hinges in steel beams and columns is controlled via full welding. To achieve a structural ductility design, two standard methods are commonly employed. One method involves locally widening the upper and lower flanges of the steel beam near the column, as illustrated in Figure 7a. The other method involves locally weakening the steel beam flange near the column, resembling a bone structure [21], as shown in Figure 7b. These two approaches aim to weaken and strengthen the upper and lower flanges of the steel beam, respectively. Consequently, their influence on the structural mechanical properties during normal usage stages is relatively minor, but their impact during the catenary stage requires further investigation.
At the elastic stage, there is no significant difference observed between FEM-2 and FEM-4, as illustrated in Figure 7c. However, due to the strengthening effect resulting from the widening of the steel beam flange and the weakening effect of the reduced steel beam section (RBS) connection mode on the steel beam flange [22], the yield value of FEM-2 is 30.4% higher than that of FEM-4. In the plastic stage, the deviation of the ultimate load between FEM-2 and FEM-4 is 15.8%. However, it is worth noting that the ductility coefficient of FEM-4 (6.2) slightly surpasses that of FEM-2, as indicated in Table 2 and Figure 7e,f. Consequently, in terms of the damage model, the final damage degree of FEM-4 is more severe than that of FEM-2.
Nevertheless, the stiffness attenuation curves presented in Figure 7d reveal a consistent pattern for both FEM-2 and FEM-4, reaching the half-life point at a displacement of 28 mm. This indicates that the structural damage has a minimal impact on the stiffness attenuation of composite beams with welded connections utilizing widened local steel beam flanges or reduced steel beam section (RBS) connections. As a result, it can be inferred that the RBS connection mode is more effective in achieving a structural ductility design. However, it is important to note that the ultimate bearing capacity of the RBS connection mode at the catenary stage is significantly lower than that of FEM-2, primarily due to the strengthening effect of the flange. This demonstrates that the load-bearing capacity is sensitive to the flange size. Overall, FEM-2, with its widened local steel beam flange, exhibits superior bearing capacity and exceptional collapse resistance [23].

7.3. Comparison of FEM-5 and FEM-6

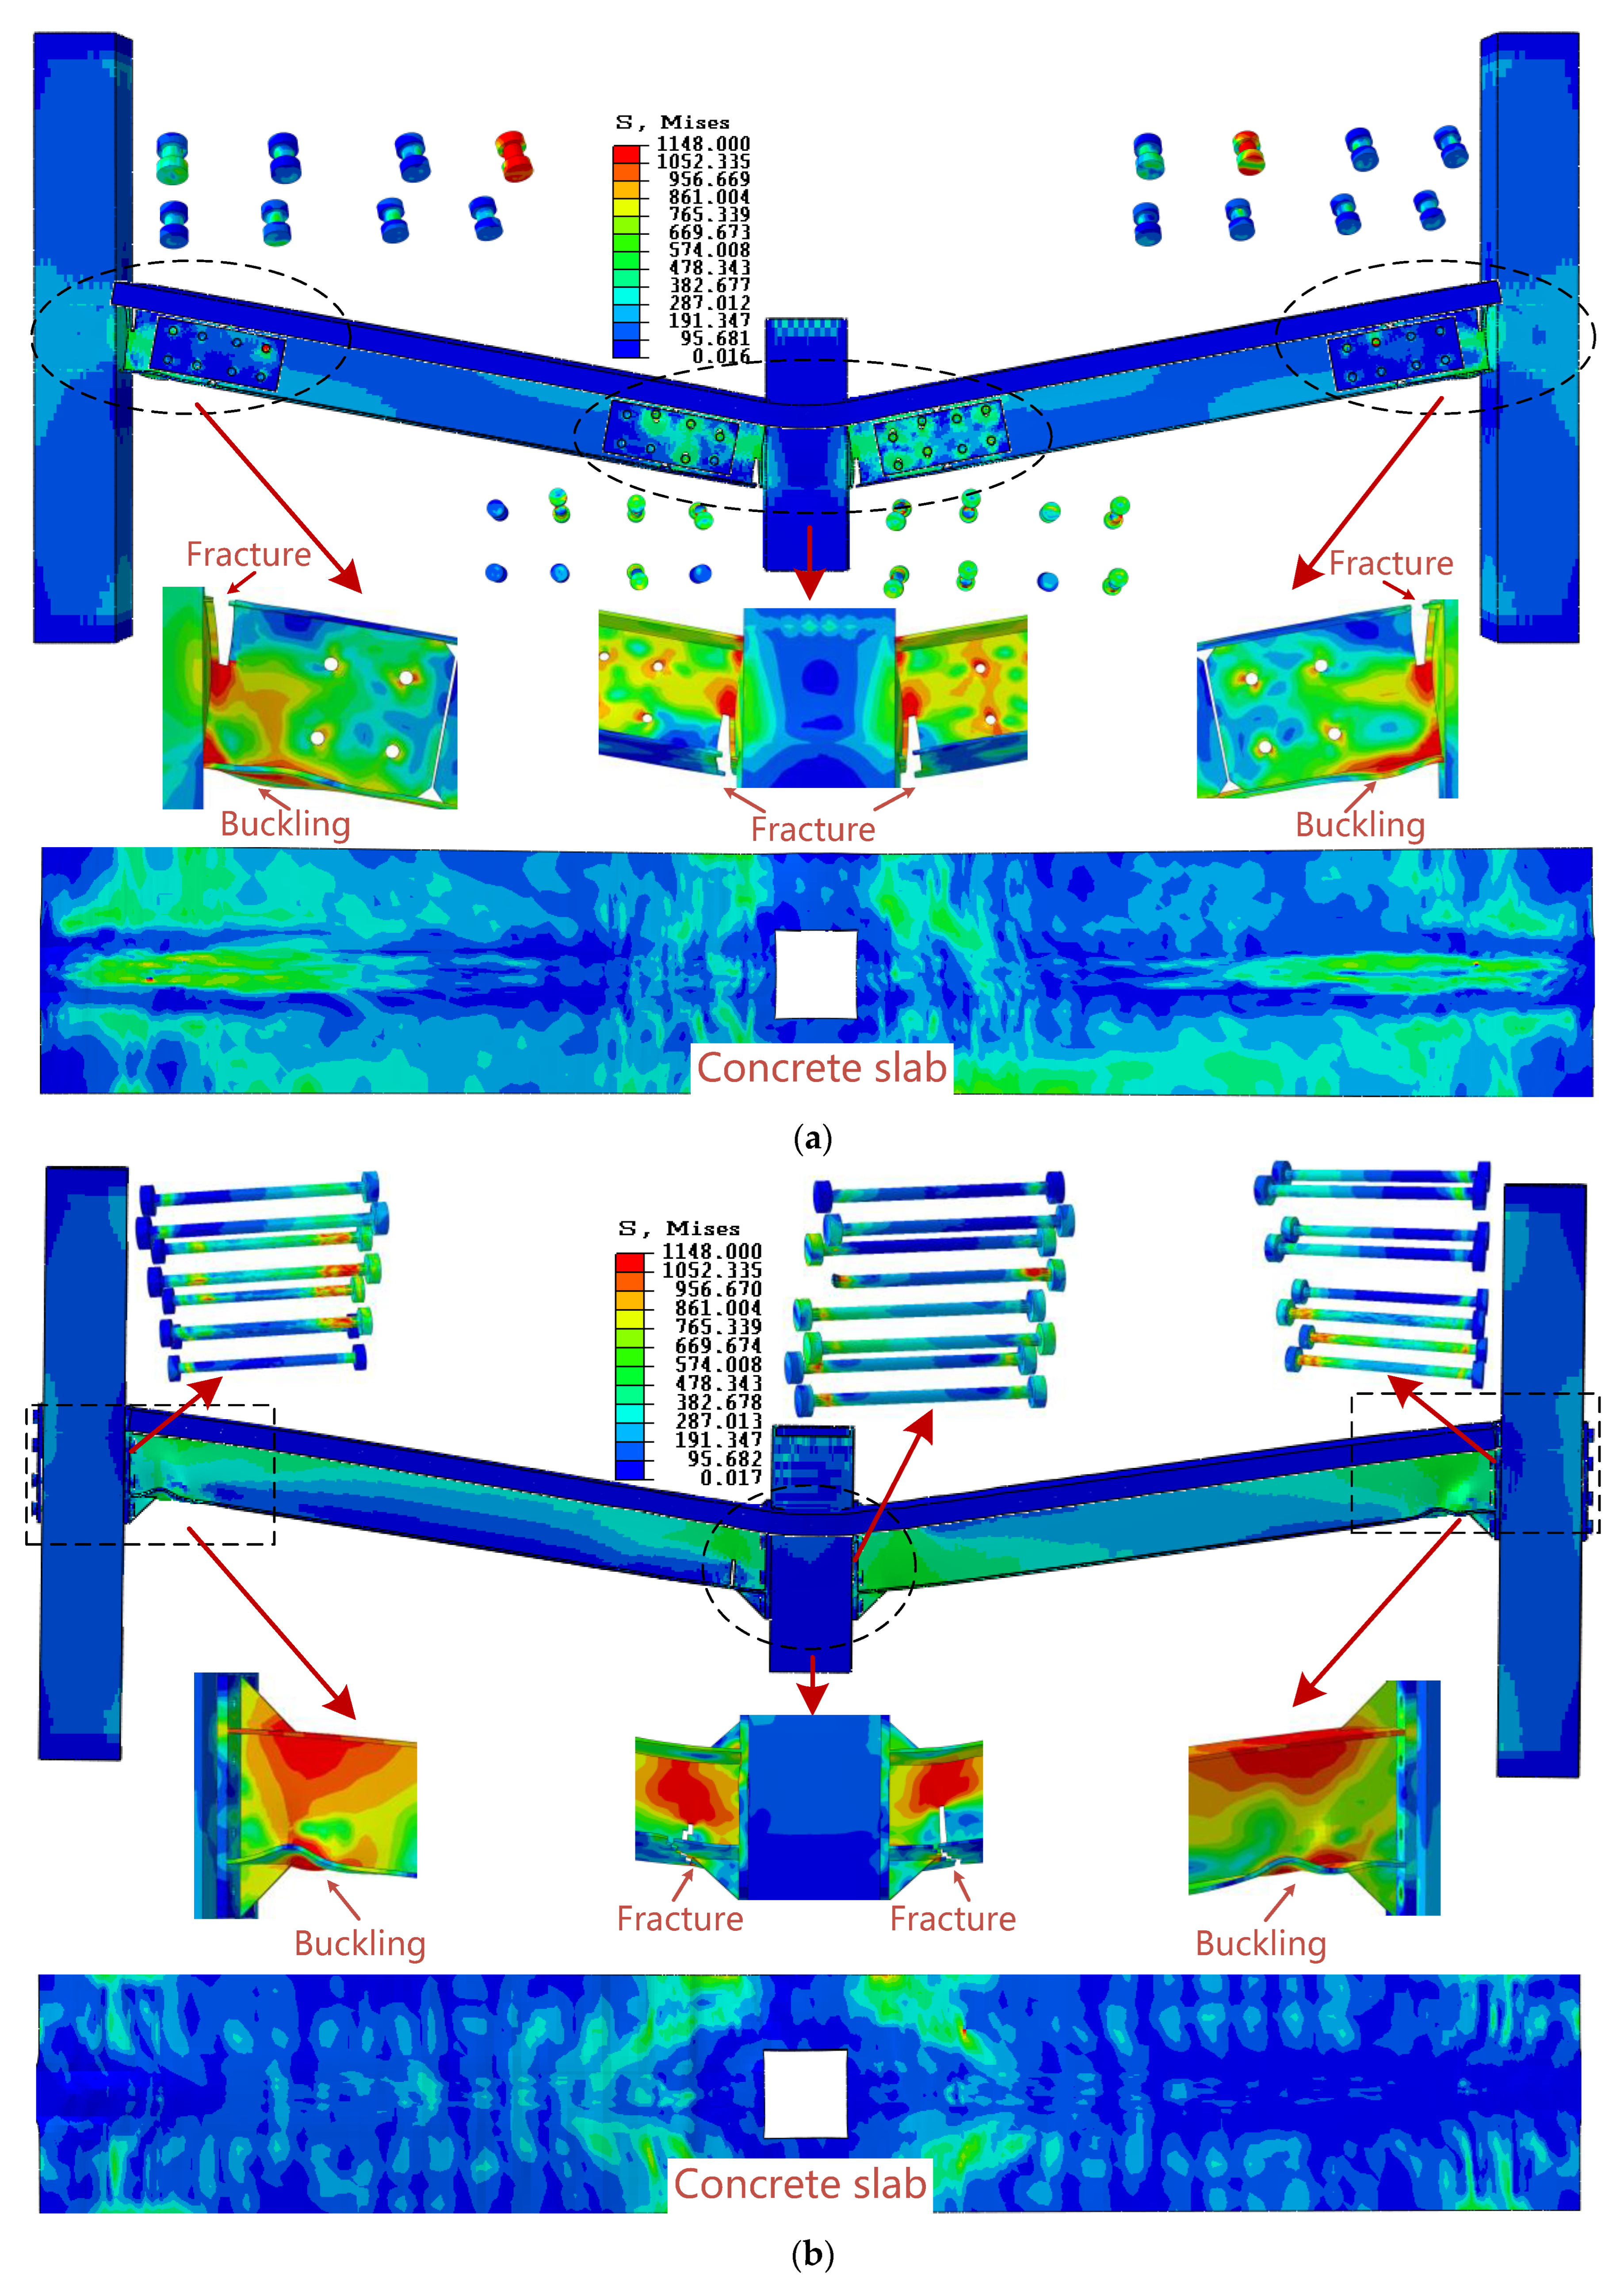
At the elastic stage, notable differences are observed between FEM-5 and FEM-6, as illustrated in Figure 8. However, the displacement corresponding to the half-life point is 7.2 mm lower for FEM-5 compared with FEM-6, with values of 12.2 mm and 19.4 mm, respectively. This indicates that the structure employing a welded flange-bolted web connection has a more pronounced reductive effect on the structural stiffness compared with the extended end-plate-bolted connection. As the analysis progresses to the plastic and catenary stages, the load-bearing performance of FEM-6 continues to improve, and the FEM-6 model exhibits significantly improved ductile deformation performance compared with FEM-5, as shown in Figure 8e,f. On the contrary, the load-bearing performance and stiffness of FEM-5 become unstable due to the fracture of the steel beam flanges in the tension zone. These findings underscore the significant role of the connection types in influencing the load-bearing capacity and structural stability, with FEM-6 demonstrating a superior performance in these aspects [24,25,26,27].

7.4. Failure Mode and Collapse Resistance Theory

The resistance of a structure during the small deformation stage is of paramount importance in determining its collapse potential. Subsequently, the structure transitions into the large deformation stage, known as the catenary stage. In this stage, the residual bearing capacity of the structure becomes crucial in determining whether it will undergo complete failure or not. Moreover, the theoretical calculations presented earlier highlight the significant influence of the connection form’s rotation capacity on the structural resistance performance during the large deformation stage. Therefore, the structural ultimate bearing capacity was selected as the primary index in this study to evaluate the quality of structural collapse resistance.
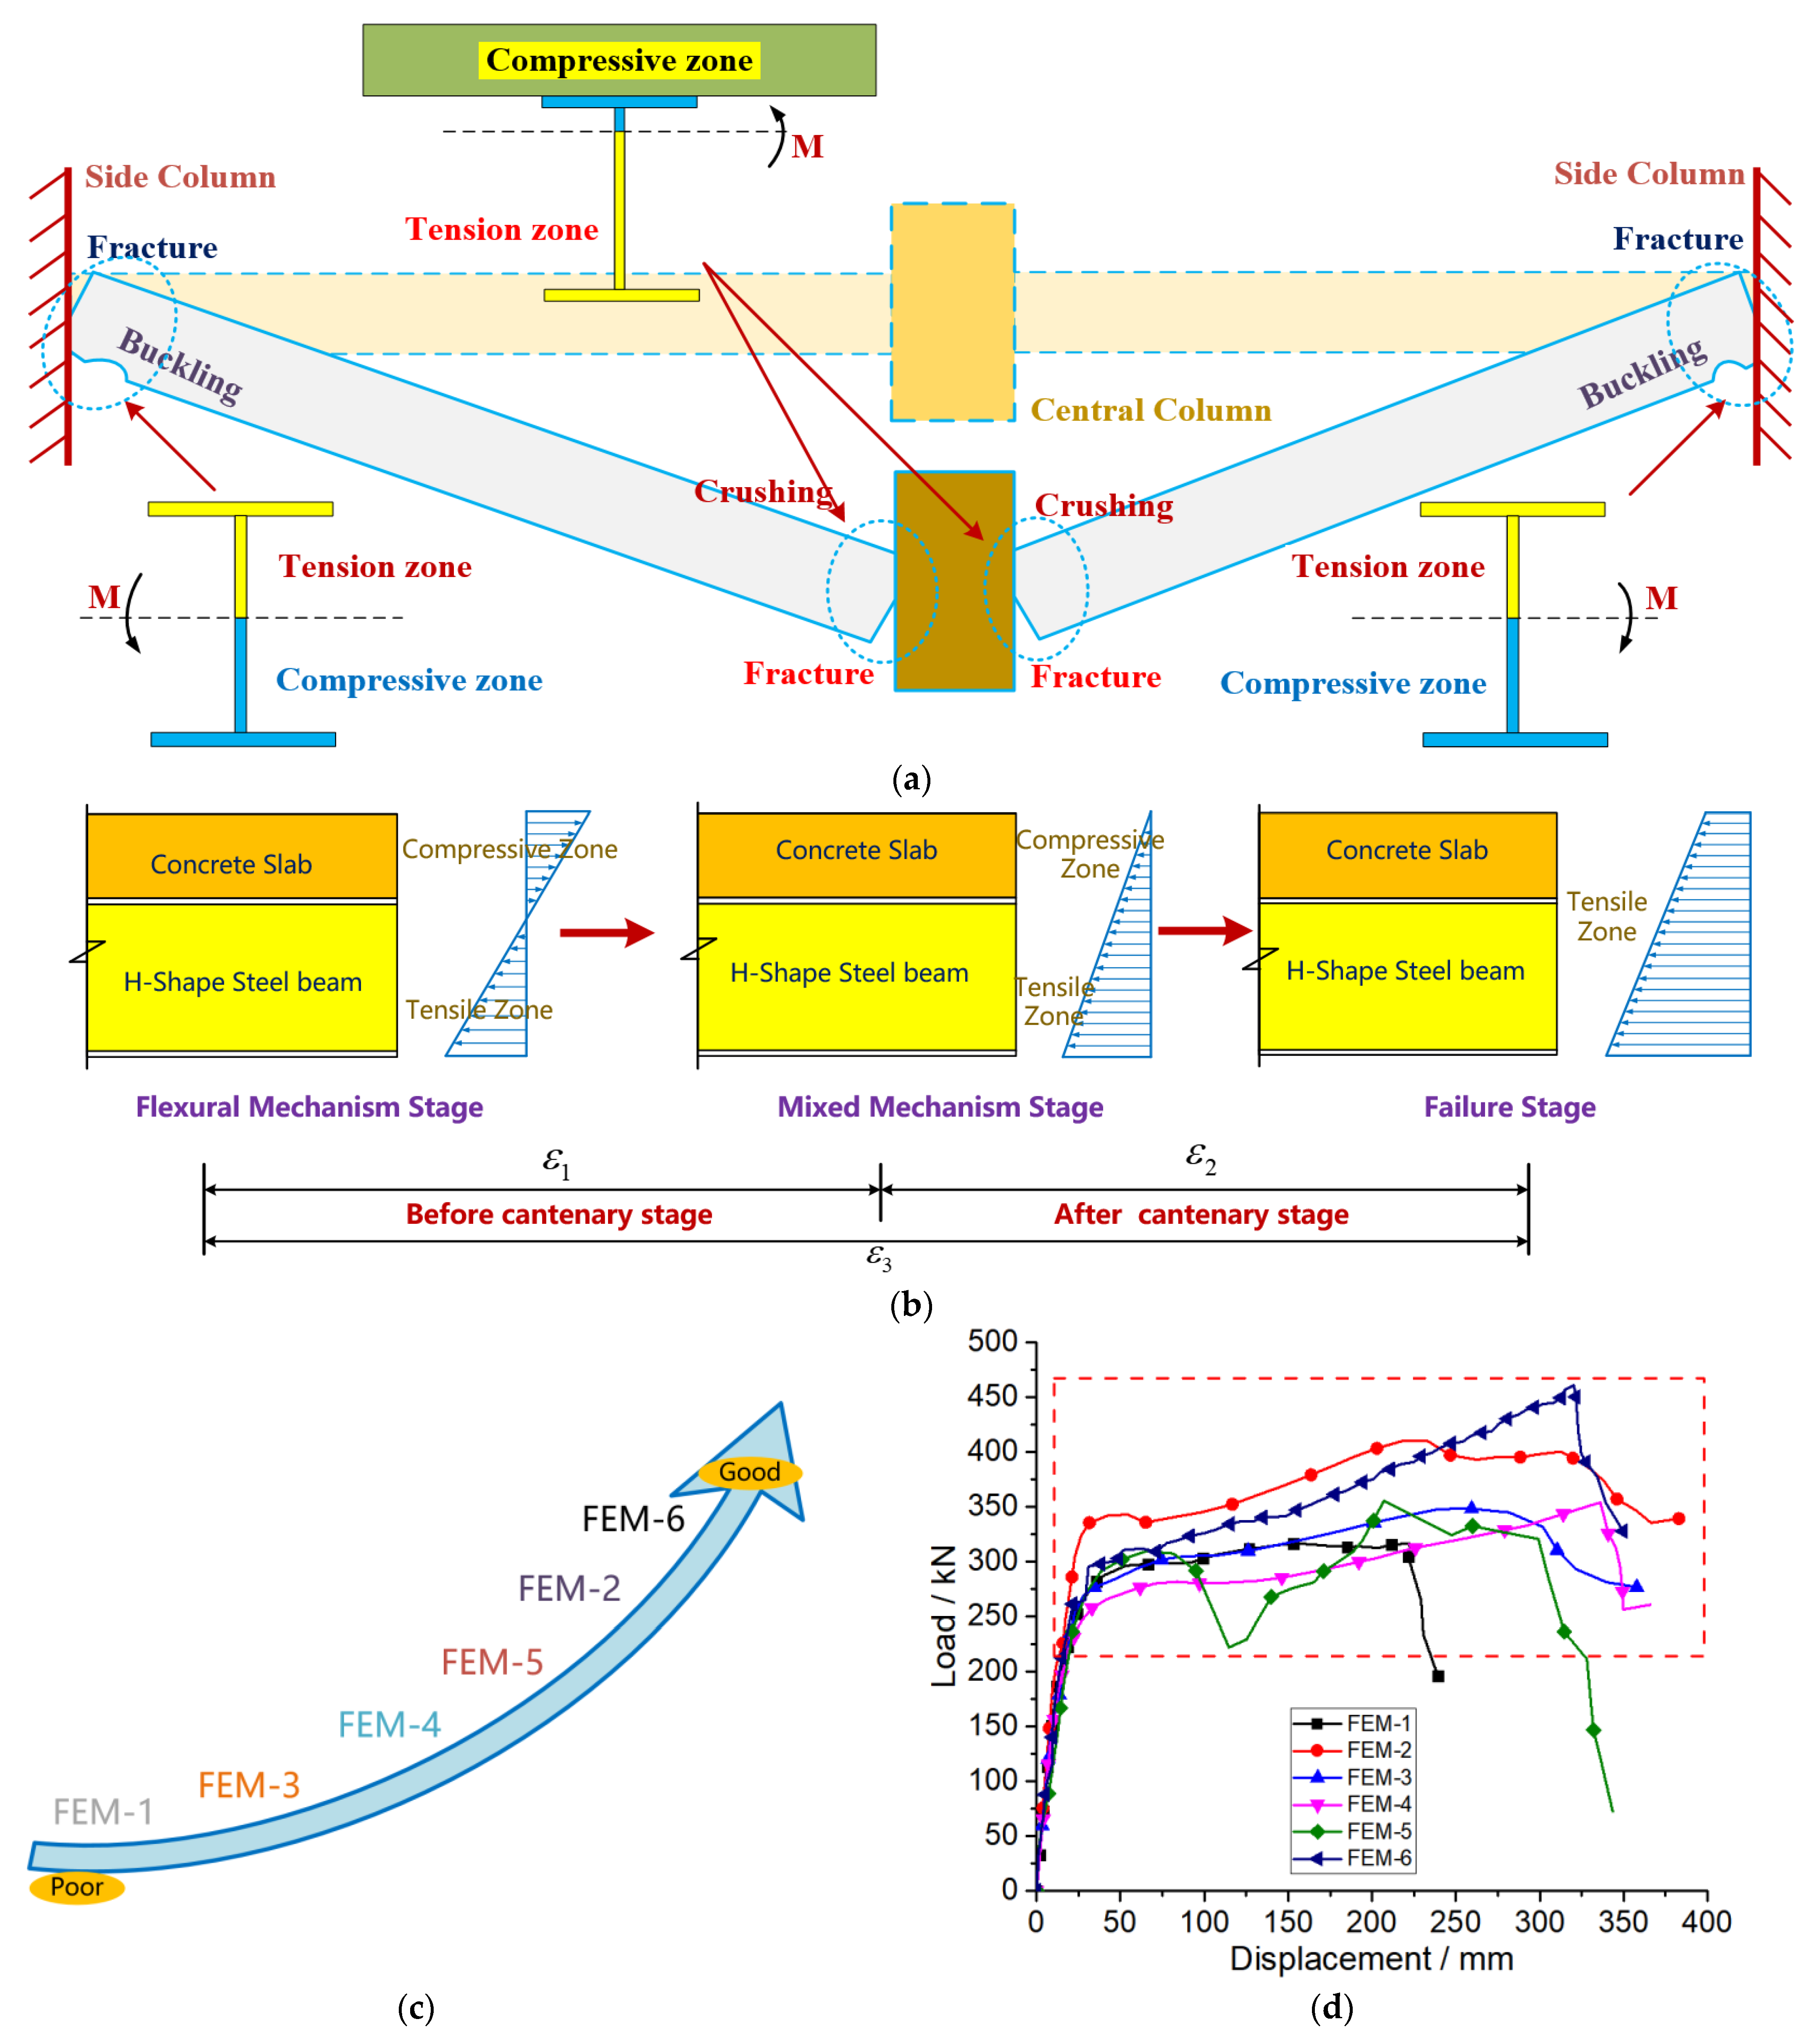
The characteristic values of each model are listed in Table 2, and the ranking of the anti-collapse capacity, based on the ultimate bearing capacity values in Table 2, is depicted in Figure 9c. The findings indicate that the extended end-plate-bolted connection positively impacts the anti-collapse capacity of a composite structure. Conversely, the fully welded beam–column connection exhibits limited improvement in the anti-collapse capacity of the composite structure. Thus, the utilization of a welded connection is not beneficial for enhancing the progressive collapse resistance of a composite structure.
The failure sequence observed in all models consistently reveals that flange fractures near the central column occur earlier in the tensile zone compared with those near the side column. Subsequently, there is a sharp decline in the structural mechanical properties, leading to an almost complete loss of load-bearing performance, as depicted in Figure 9a. This phenomenon can be attributed to the composite action between the beam and concrete slab, resulting in the neutral axis being positioned far away from the bottom flange in regions subjected to positive bending moments. Furthermore, due to the cumulative tensile forces during the catenary stage, fractures tend to occur on the bottom flange near the middle column, as illustrated in Figure 9b. Therefore, implementing measures to delay the occurrence of fractures in the steel beams adjacent to the middle column can further enhance the deformation and load-bearing capacity of the structure during the catenary stage [28,29].
The load–displacement curve of each finite element model exhibits distinct stages, including the elastic stage, plastic stage, catenary stage, and ultimate failure stage. However, as depicted in Figure 9d, the connection form exerts a notable influence on the structural mechanical properties only during the plastic and catenary stages, while no discernible impact is observed during the elastic stage [30,31,32].
The numerical calculation results indicate that the extended end-plate-bolted connection in FEM-6 demonstrates characteristics closer to a rigid connection, whereas the fully welded beam-to-column connection in FEM-1 exhibits similarities to a hinge connection. Subsequent data processing of FEM-1 and FEM-6 utilizing Equation (9) yields the gap curve, as illustrated in Figure 9e. This trend aligns with the prediction depicted in Figure 1d, thereby validating the accuracy of the theoretical calculation presented in Equation (9).
The stress distribution in the composite beam can be divided into two primary stages based on whether the structure enters the catenary stage or not, as illustrated in Figure 9f. The first stage is characterized by dominant flexural stress prior to the catenary stage, while the second stage is characterized by dominant tensile stress. In the first stage, the strain of the flange plate in the tension zone is M y E I = ε 1 . In the second stage, the strain of the flange plate in the tension zone is F 1 A E = ε 2 , the overall fracture strain of the flange plate is ε 1 + ε 2 = ε 3 , and the fracture strain of steel ε 3 is a fixed value [33,34].
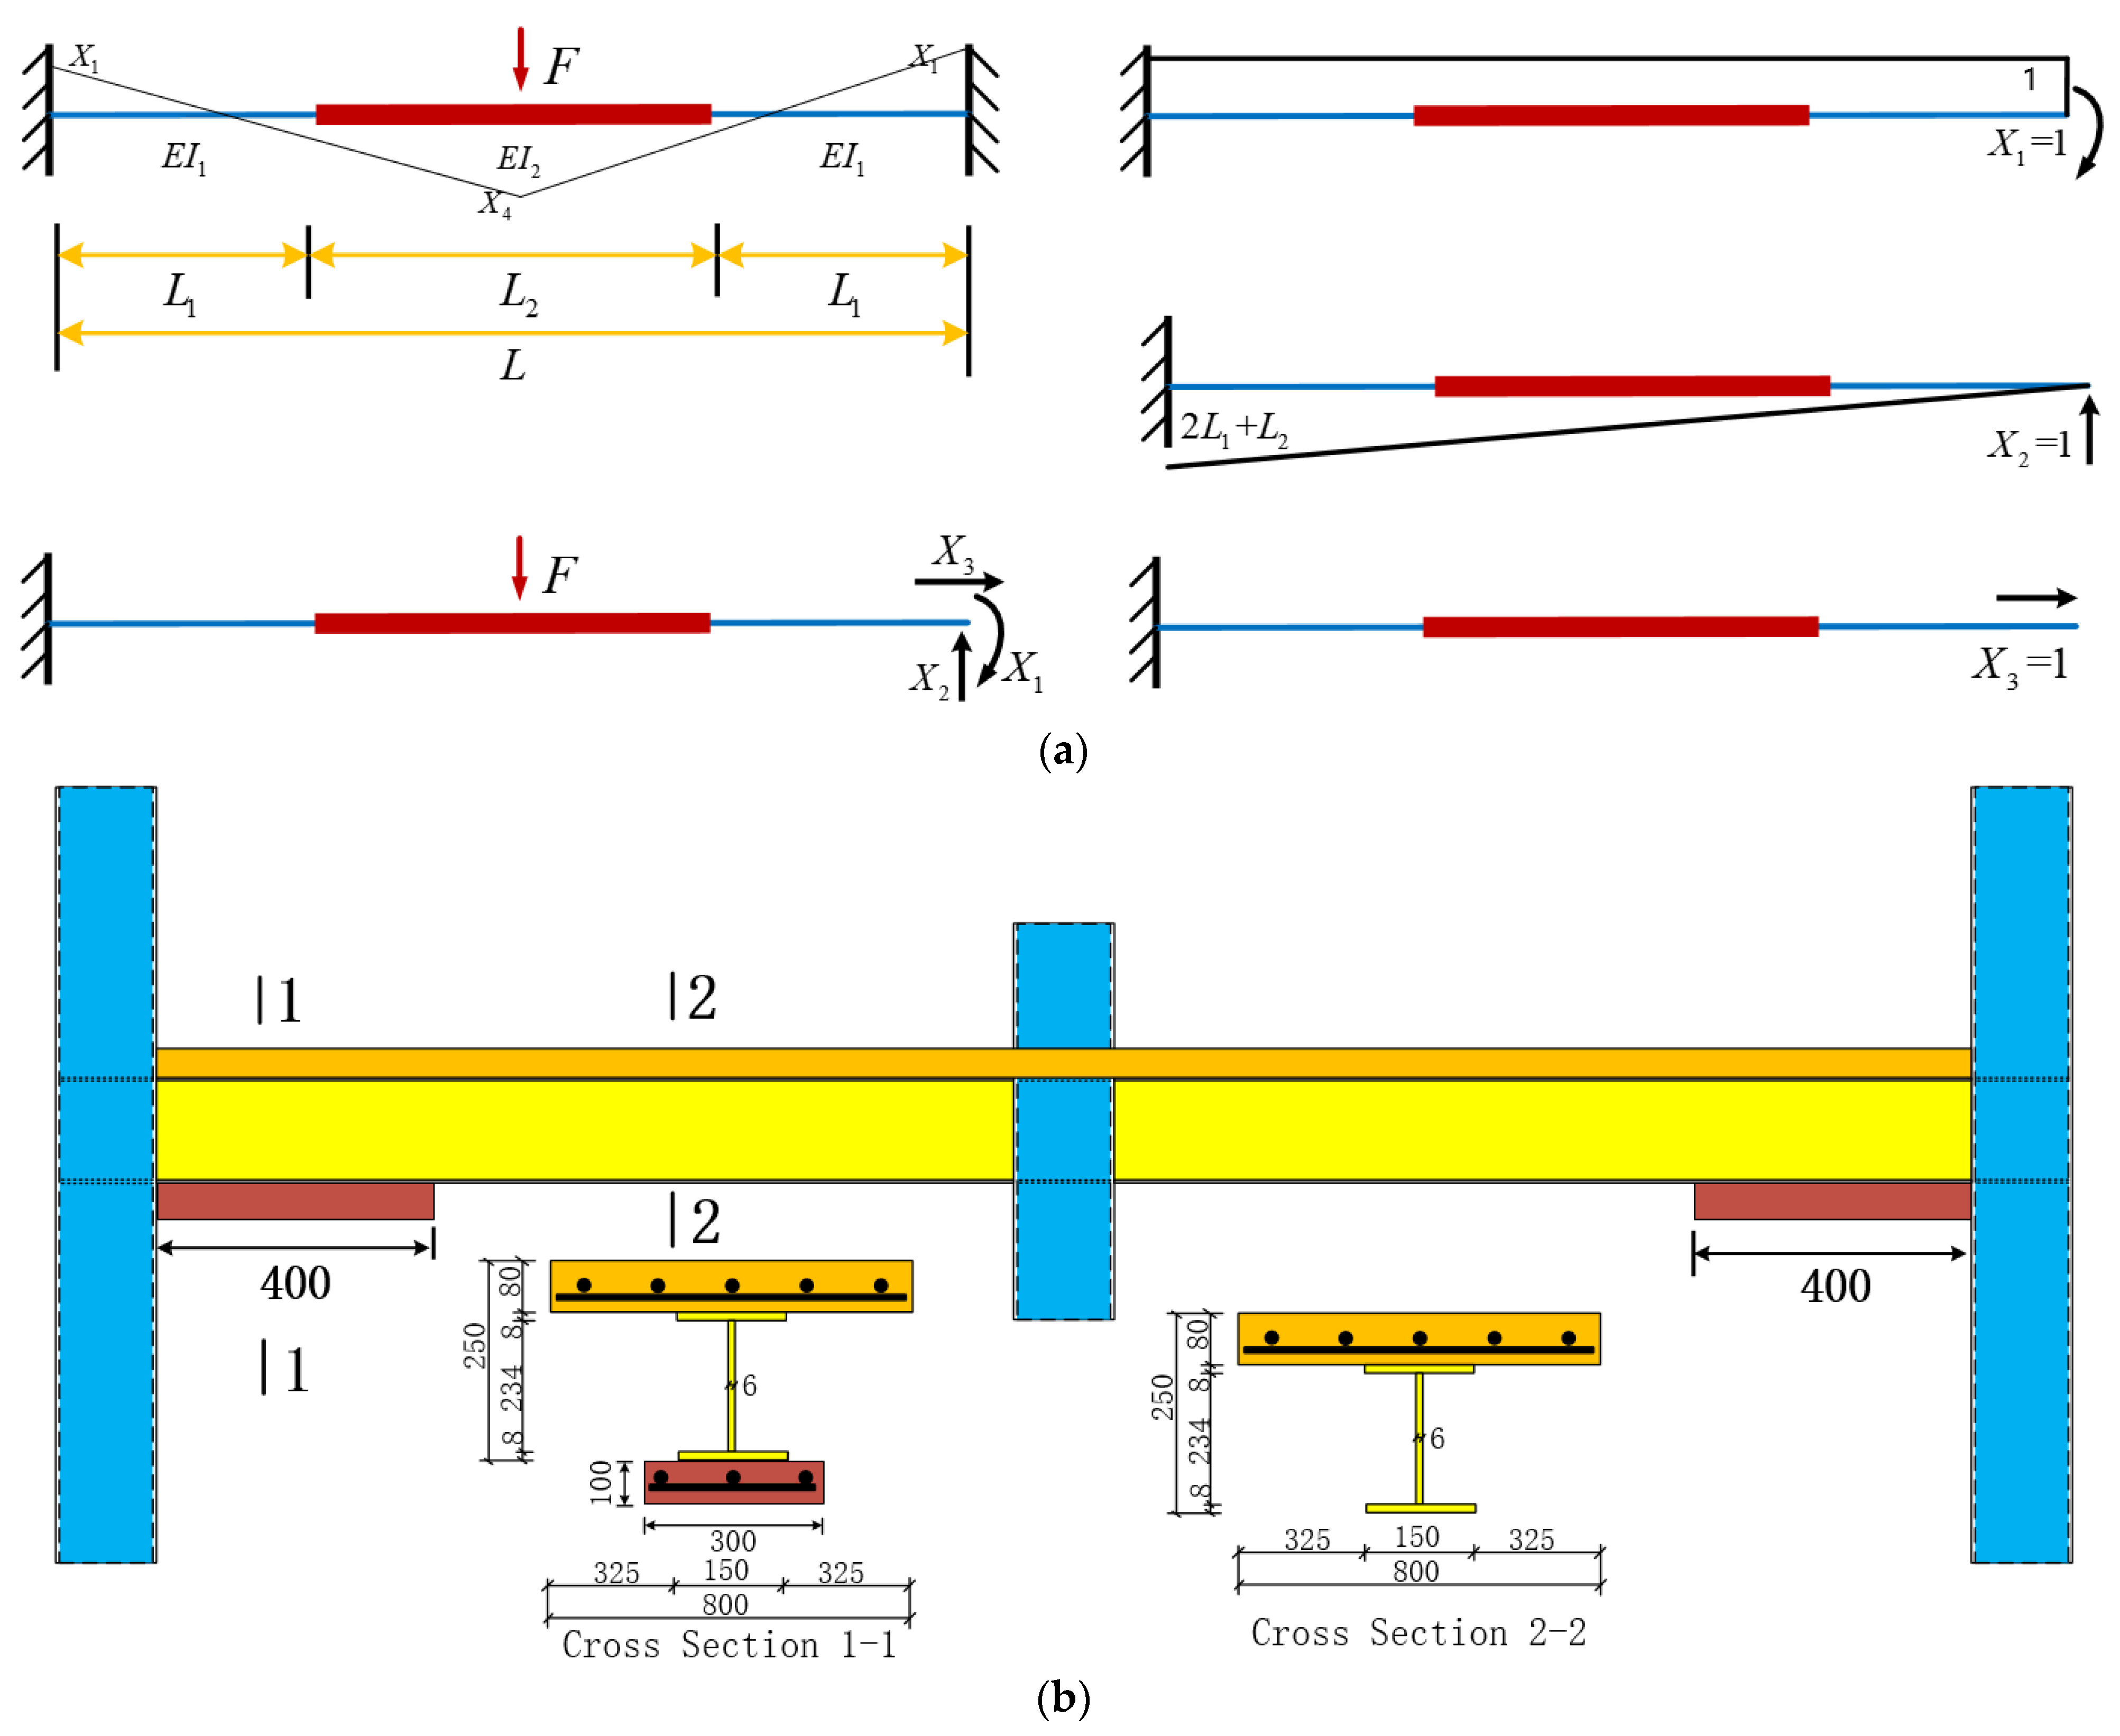
In order to investigate the correlation between the cross-section stiffness and internal forces in the positive and negative moment regions of composite beams, as shown in Figure 10a, the force equilibrium was established using Equations (10)–(12). These equations enabled the calculation of the statically indeterminate composite beam with varying stiffness.
X 1 δ 11 + X 2 δ 12 + X 3 δ 13 + δ 1 F = 0
X 1 δ 21 + X 2 δ 22 + X 3 δ 23 + δ 2 F = 0
X 1 δ 31 + X 2 δ 32 + X 3 δ 33 + δ 3 F = 0
due to
X 13 = X 31 = X 23 = X 32 = X 33 = X 3 F = 0 ,   X 2 = F 2
X 1 δ 11 + X 2 δ 12 + δ 1 F = 0
X 1 δ 21 + X 2 δ 22 + δ 2 F = 0
δ 11 = L 1 E I 1 + L 2 2 E I 2 ,   δ 12 = δ 21 = 2 L 1 2 + L 1 L 2 2 E I 1 2 L 1 L 2 + l 2 2 4 E I 2 , δ 2 F = F L 2 2 ( 3 L 1 + 4 L 2 ) 48 E I 2 + 9 F L 1 2 L 2 + 3 F L 1 L 2 2 + 7 F L 1 3 12 E I 1 , δ 22 = 11 L 1 3 + 3 L 1 2 L 2 12 E I 1 + 24 L 1 2 L 2 + 15 L 1 L 2 2 + 12 L 1 3 + 4 l 2 3 12 E I 2
X 1 = F ( L 1 2 4 E I 1 + 4 L 1 L 2 + L 1 2 16 E I 2 ) L 1 E I 1 + L 2 2 E I 2
making
E I 2 = k E I 1 ,   L 1 = L 4 ,   L 2 = L 2
The bending moment in the negative zone is:
X 1 = [ 1 16 + 1 64 ( k + 2 ) ] F L
The bending moment in the positive zone is:
X 4 = F L 64 ( 1 k + 2 12 ) ,   ( k 0 )
According to Equations (16) and (17), implementing measures to enhance the cross-section stiffness in the negative bending moment region can lead to the redistribution of internal forces within the structure prior to the occurrence of large deformations. Consequently, the internal force in the negative bending moment region increases, while the corresponding positive bending moment region experiences a decrease. Furthermore, considering that the catenary stage represents the final and crucial stage of structural resistance against collapse, it can be inferred from the formula M y E I = ε 1 that if the strain value ε 1 of the first stage before the catenary can be reduced by improving the stiffness, then the development space of the strain value ε 2 of the second stage can be effectively increased by decreasing the stiffness and increasing the rotation capacity. This, in turn, significantly enhances the collapse-bearing capacity of the structure.
To validate the aforementioned design concept aimed at enhancing the collapse-resistant bearing capacity of composite beams, model FEM-1 was selected for analysis. Various approaches can be employed to improve the cross-section stiffness in the negative bending moment region of composite beams. In this study, double-sided composite beams were chosen for verification, as shown in Figure 10b, wherein the lower concrete slab effectively enhances the stiffness during the service stage. Although the lower concrete loses most of its composite action and sustains damage during the plastic stage, it enables the steel beam to exhibit significant rotational capacity during the large deformation stage [35]. Expanding on model FEM-1 and referring to experimental data from the literature [36], a concrete plate was added to the lower surface of the lower flange of the steel beam in the negative bending moment area, as illustrated in Figure 10. The lower concrete slab possessed a strength of 69.5 MPa. The numerical simulation results of the resistance–displacement curve are presented in Figure 10. The findings demonstrate that this method of enhancing the stiffness in the negative bending moment zone before the catenary stage enhances the bearing capacity of the composite structure by approximately 16%, further reinforcing the collapse resistance of the composite beam. These results validate the feasibility of the design concept proposed in this paper [37,38,39,40].

8. Conclusions

The collapse resistance of a composite structure is intricately linked to its rotational bearing capacity, which is influenced by the configuration of the beam–column connections. In this study, the finite element method was utilized to analyze two-span composite structures with a middle column removed, considering six distinct connection forms. The objective was to assess and explore the anti-collapse behavior of the composite structure while validating a proposed design concept for enhancing collapse resistance. Based on the conducted research, the following conclusions can be deduced:
(1)
From the perspective of ultimate load-bearing performance, the structure employing the welding connection of the flange of the steel beam with local widening exhibited the best ultimate load-bearing performance, while the structure employing the reduced steel beam section (RBS) connection demonstrated the poorest performance.
(2)
From the perspective of ductile deformation performance, the structure employing the reduced steel beam section (RBS) connection exhibited the best ductile deformation performance, while the structure employing the welded flange-bolted web connection demonstrated the poorest performance.
(3)
The proposed structural connection scheme in this paper, utilizing double-sided composite action beams at the steel beam–column connection nodes, demonstrates significant improvements in both ultimate anti-collapse performance and failure modes.

Author Contributions

Conceptualization, Y.L. and J.W.; methodology, Y.L.; software, Y.L.; validation, J.W.; formal analysis, Y.L.; investigation, Y.L.; resources, J.W.; data curation, Y.L.; writing—original draft preparation, Y.L.; writing—review and editing, J.W.; visualization, J.W.; supervision, Y.L.; project administration, Y.L.; funding acquisition, J.W. All authors have read and agreed to the published version of the manuscript.

Funding

This research was funded by the National Key Research and Development Program of China (grant number 2021YFC3001904 and 2021YFC3090403), the Scientific and Technological Program of China National Fire and Rescue Administration (grant number 2021XFZD05).

Data Availability Statement

Some or all of the data, models, or codes that support the findings of this study are available from the corresponding author upon reasonable request.

Conflicts of Interest

The authors declare that they have no known competing financial interest or personal relationships that could have appeared to influence the work reported in this paper.

References

  1. Russell, J.M.; Sagaseta, J.; Cormie, D.; Jones, A.E.K. Historical review of prescriptive design rules for robustness after the collapse of Ronan Point. Structures 2019, 20, 365–373. [Google Scholar] [CrossRef]
  2. Usmani, A.S.; Chung, Y.C.; Torero, J.L. How did the WTC towers collapse: A new theory. Fire Saf. J. 2003, 38, 501–533. [Google Scholar] [CrossRef]
  3. DOD (Department of Defence). Design of Buildings to Resist Progressive Collapse; Unified Facilities Criteria (UFC 4-023-03, USA); DOD (Department of Defence): Washington, DC, USA, 2016. [Google Scholar]
  4. GSA (General Services Administration). Progressive Collapse Analysis and Design Guides for New Federal Office Buildings and Major Modernization Projects; GSA (General Services Administration): Washington, DC, USA, USA, 2016. [Google Scholar]
  5. Wang, W.-D.; Zheng, L.; Li, H.-W. Experimental investigation of composite joints with concrete-filled steel tubular column under column removal scenario. Eng. Struct. 2020, 219, 110956. [Google Scholar] [CrossRef]
  6. Zhong, W.-h.; Tan, Z.; Tian, L.M.; Meng, B.; Song, X.Y.; Zheng, Y.H. Collapse resistance of composite beam-column assemblies with unequal spans under an internal column-removal scenario. Eng. Struct. 2020, 206, 110143. [Google Scholar] [CrossRef]
  7. Dinu, F.; Marginean, I.; Dubina, D. Experimental testing and numerical modelling of steel moment-frame connections under column loss. Eng. Struct. 2017, 151, 861–878. [Google Scholar] [CrossRef]
  8. Wang, F.; Yang, J.; Pan, Z. Progressive collapse behaviour of steel framed substructures with various beam-column connections. Eng. Fail. Anal. 2020, 109, 104399. [Google Scholar] [CrossRef]
  9. Guo, L.; Gao, S.; Fu, F.; Wang, Y. Experimental study and numerical analysis of progressive collapse resistance of composite frames. J. Constr. Steel Res. 2013, 89, 236–251. [Google Scholar] [CrossRef]
  10. EN 1993; Eurocode 3-Design of Steel Structures, Part 1–8: Design of Joints. European Committee for Standardization CEN: Brussels, Belgium, 2005.
  11. Xuan, W.; Wang, L.; Liu, C.; Xing, G.; Zhang, L.; Chen, H. Experimental and Theoretical Investigations on Progressive Collapse Resistance of the Concrete-Filled Square Steel Tubular Column and Steel Beam Frame under the Middle Column Failure Scenario. Shock Vib. 2019, 2019, 2354931. [Google Scholar] [CrossRef]
  12. Kang, S.-B.; Tan, K.H.; Liu, H.-Y.; Zhou, X.-H.; Yang, B. Effect of boundary conditions on the behaviour of composite frames against progressive collapse. J. Constr. Steel Res. 2017, 138, 150–167. [Google Scholar] [CrossRef]
  13. Li, L.; Wang, W.; Chen, Y.; Lu, Y. Experimental investigation of beam-to-tubular column moment connections under column removal scenario. J. Constr. Steel Res. 2013, 88, 244–255. [Google Scholar] [CrossRef]
  14. GB 50017-2003; Code for Design of Steel Structures. Ministry of Construction of China: Beijing, China, 2003. (In Chinese)
  15. JGJ138-2016; Code for Design of Composite Structures. Ministry of Construction of China: Beijing, China, 2016. (In Chinese)
  16. Wang, J.; Wang, W.; Bao, Y. Full-Scale Test of a Steel–Concrete Composite Floor System with Moment-Resisting Connections under a Middle-Edge Column Removal Scenario. J. Struct. Eng. 2020, 146, 04020067. [Google Scholar] [CrossRef]
  17. Lu, X.; Zhang, L.; Lin, K.; Li, Y. Improvement to composite frame systems for seismic and progressive collapse resistance. Eng. Struct. 2019, 186, 227–242. [Google Scholar] [CrossRef]
  18. Meng, B.; Zhong, W.; Hao, J.; Song, X. Improving anti-collapse performance of steel frame with RBS connection. J. Constr. Steel Res. 2020, 170, 106119. [Google Scholar] [CrossRef]
  19. GB 50010-2010; Code for Design of concrete structures. Ministry of Construction of China: Beijing, China, 2010. (In Chinese)
  20. Chu, L.; Li, G.; Li, D.; Zhao, J. Study on Progressive Collapse Behavior of SRC Column-Steel Beam Hybrid Frame Based on Pushdown Analysis. Shock Vib. 2017, 2017, 3075786. [Google Scholar] [CrossRef]
  21. Chen, J.; Huang, X.; Ma, R.; He, M. Experimental Study on the Progressive Collapse Resistance of a Two-Story Steel Moment Frame. J. Perform. Constr. Facil. 2012, 26, 567–575. [Google Scholar] [CrossRef]
  22. Khandelwal, K.; El-Tawil, S.; Kunnath, S.K.; Lew, H.S. Macromodel-Based Simulation of Progressive Collapse: Steel Frame Structures. J. Struct. Eng. 2008, 134, 1070–1078. [Google Scholar] [CrossRef]
  23. Kiakojouri, F.; Sheidaii, M.R.; De Biagi, V.; Chiaia, B. Progressive Collapse Assessment of Steel Moment-Resisting Frames Using Static- and Dynamic-Incremental Analyses. J. Perform. Constr. Facil. 2020, 34, 04020025. [Google Scholar] [CrossRef]
  24. Johnson, E.S.; Meissner, J.E.; Fahnestock, L.A. Experimental Behavior of a Half-Scale Steel Concrete Composite Floor System Subjected to Column Removal Scenarios. J. Struct. Eng. 2016, 142, 04015133. [Google Scholar] [CrossRef]
  25. Kong, D.-Y.; Yang, Y.; Yang, B. Experimental Study on The Progressive Collapse of 3D Steel Frames under Concentrated and Uniformly Distributed Loading Conditions. In Proceedings of the 9th International Conference on Steel and Aluminium Structures (ICSAS), Bradford, UK, 3–5 July 2019; pp. 1270–1280. [Google Scholar]
  26. Tohidi, M.; Janby, A. Finite-Element Modeling of Progressive Failure for Floor-to-Floor Assembly in the Precast Cross-Wall Structures. J. Struct. Eng. 2020, 146, 04020087. [Google Scholar] [CrossRef]
  27. Liu, S.-W.; Liu, Y.-P.; Chan, S.-L. Advanced analysis of hybrid steel and concrete frames Part 2: Refined plastic hinge and advanced analysis. J. Constr. Steel Res. 2012, 70, 337–349. [Google Scholar] [CrossRef]
  28. Asgarian, B.; Rezvani, F.H. Progressive collapse analysis of concentrically braced frames through EPCA algorithm. J. Constr. Steel Res. 2012, 70, 127–136. [Google Scholar] [CrossRef]
  29. Gerasimidis, S.; Sideri, J. A new partial-distributed damage method for progressive collapse analysis of steel frames. J. Constr. Steel Res. 2016, 119, 233–245. [Google Scholar] [CrossRef]
  30. Zhong, W.; Meng, B.; Hao, J. Performance of different stiffness connections against progressive collapse. J. Constr. Steel Res. 2017, 135, 162–175. [Google Scholar] [CrossRef]
  31. Gao, S.; Xu, M.; Fu, F.; Guo, L. Performance of bolted steel-beam to CFST-column joints using stiffened angles in column-removal scenario. J. Constr. Steel Res. 2019, 159, 459–475. [Google Scholar] [CrossRef]
  32. Zhou, G.; Shi, J.; Li, P.; Li, H. Characteristics of structural state of stress for steel frame in progressive collapse. J. Constr. Steel Res. 2019, 160, 444–456. [Google Scholar] [CrossRef]
  33. Wei, J.-P.; Tian, L.-M.; Hao, J.-P.; Li, W.; Zhang, C.-B.; Li, T.-J. Novel principle for improving performance of steel frame structures in column-loss scenario. J. Constr. Steel Res. 2019, 163, 105768. [Google Scholar] [CrossRef]
  34. Tsai, M.-H. An analytical methodology for the dynamic amplification factor in progressive collapse evaluation of building structures. Mech. Res. Commun. 2010, 37, 61–66. [Google Scholar] [CrossRef]
  35. Mohamed, O.A. Assessment of progressive collapse potential in corner floor panels of reinforced concrete buildings. Eng. Struct. 2009, 31, 749–757. [Google Scholar] [CrossRef]
  36. Ding, J.; Li, Y.; Xing, W.; Ren, P.; Kong, Q.; Yuan, C. Mechanical properties and engineering application of single-span steel-concrete double-sided composite beams. J. Build. Eng. 2021, 40, 102644. [Google Scholar] [CrossRef]
  37. Alogla, K.; Weekes, L.; Augusthus-Nelson, L. A new mitigation scheme to resist progressive collapse of RC structures. Constr. Build. Mater. 2016, 125, 533–545. [Google Scholar] [CrossRef]
  38. Szyniszewski, S.; Krauthammer, T. Energy flow in progressive collapse of steel framed buildings. Eng. Struct. 2012, 42, 142–153. [Google Scholar] [CrossRef]
  39. Kiakojouri, F.; De Biagi, V.; Chiaia, B.; Sheidaii, M.R. Progressive collapse of framed building structures: Current knowledge and future prospects. Eng. Struct. 2020, 206, 110061. [Google Scholar] [CrossRef]
  40. Zandonini, R.; Baldassino, N.; Freddi, F.; Roverso, G. Steel-concrete frames under the column loss scenario: An experimental study. J. Constr. Steel Res. 2019, 162, 105527. [Google Scholar] [CrossRef]
Figure 1. Theoretical calculation model: (a) rotational stiffness classification of nodes; (b) hinged connection; (c) rigid connection; (d) theoretical calculation curve.
Jcs 07 00477 g001
Figure 2. Simplified schematic diagram of composite structure: (a) typical steel-concrete composite frame structure; (b) sub-system boundary conditions representation.
Jcs 07 00477 g002
Figure 3. The model size and connection details: (a) numerical model size; (b) cross-section 2-2; (c) FEM-1: fully welded beam-to-column connection; (d) FEM-2: welded connection with widening local steel beam flange; (e) FEM-3: outside stiffening ring plate connection; (f) FEM-4: reduced steel beam section connection; (g) FEM-5: welded flange-bolted web connection; (h) FEM-6: extended end-plate-bolted connection.
Jcs 07 00477 g003aJcs 07 00477 g003b
Figure 4. Stress–strain curve of steel: (a) steel property; (b) concrete property-compressive stress–strain curve; (c) concrete property-tensile stress–strain curve.
Jcs 07 00477 g004
Figure 5. Model verification results: (a) specimen size; (b) boundary condition; (c) numerical results.
Jcs 07 00477 g005aJcs 07 00477 g005b
Figure 6. FEM-1 and FEM-3: (a) failure model—FEM-1; (b) failure model—FEM-3; (c) load–displacement curve; (d) tangent stiffness–displacement curve; (e) deformation of the beam—FEM-1; (f) deformation of the beam—FEM-3.
Jcs 07 00477 g006aJcs 07 00477 g006bJcs 07 00477 g006c
Figure 7. FEM-2 and FEM-4: (a) failure model—FEM-2; (b) failure model—FEM-4; (c) load–displacement curve; (d) tangent stiffness–displacement curve; (e) deformation of the beam—FEM-2; (f) deformation of the beam—FEM-4.
Jcs 07 00477 g007aJcs 07 00477 g007b
Figure 8. FEM-5 and FEM-6: (a) failure model—FEM-5; (b) failure model—FEM-6; (c) load–displacement curve; (d) tangent stiffness–displacement curve; (e) deformation of the beam—FEM-5; (f) deformation of the beam—FEM-6.
Jcs 07 00477 g008aJcs 07 00477 g008b
Figure 9. Numerical results analysis: (a) failure model; (b) cross—section stress evolution process; (c) performance ranking; (d) load–displacement curve; (e) gap curve of FEM-1 and FEM-6; (f) deformation patterns of beams.
Jcs 07 00477 g009aJcs 07 00477 g009b
Figure 10. Theoretical verification results: (a) diagram of force method calculation; (b) double-sided composite beam—FEM-7; (c) numerical simulation result—FEM-7; (d) load−displacement curve.
Jcs 07 00477 g010aJcs 07 00477 g010b
Table 1. List of materials’ properties.
MaterialsThickness (Diameter)Yield Strength/MPaUltimate Strength/MPa
Steel slab6 mm400541
8 mm380519
12 mm396534
Reinforcement bar6 mm345448
High-strength friction-type bolts20 mm11101148
Concrete-Compressive strengthTensile strength
-352.6
Note: The material properties of concrete are as per the Chinese code for design of concrete structures GB50010-2010 [19].
Table 2. Feature values.
FEM-1FEM-3FEM-2FEM-4FEM-5FEM-6
Ductility coefficient5.55.95.56.23.25.2
Yield load/KN260269335257291299
3.5%30.4%2.7%
Ultimate load/kN316348410354355461
10.1%15.8%29.9%
Note: Ductility coefficient: μ = Δ max Δ y ; Δ max : the maximum vertical displacement; and Δ y : the yield displacement. The yield point is signaled by the load–displacement curve of the structure.
Disclaimer/Publisher’s Note: The statements, opinions and data contained in all publications are solely those of the individual author(s) and contributor(s) and not of MDPI and/or the editor(s). MDPI and/or the editor(s) disclaim responsibility for any injury to people or property resulting from any ideas, methods, instructions or products referred to in the content.