Article

Multiscale Characterisation of Staple Carbon Fibre-Reinforced Polymers

1
Institute of Polymer Engineering, FHNW University of Applied Sciences and Arts Northwestern Switzerland, Klosterzelgstrasse 2, 5210 Windisch, Switzerland
2
Faculty of Aerospace Engineering, Delft University of Technology, 2629 HS Delft, The Netherlands
3
Deutsche Institute für Textil- und Faserforschung, Körschtalstraße 26, 73770 Denkendorf, Germany
4
V-Carbon GmbH, Willy-Messerschmitt-Strasse 1, 82024 Taufkirchen, Germany
*
Author to whom correspondence should be addressed.
J. Compos. Sci. 2023, 7(11), 465; https://doi.org/10.3390/jcs7110465
Submission received: 7 September 2023 / Revised: 16 October 2023 / Accepted: 3 November 2023 / Published: 6 November 2023
(This article belongs to the Topic Advanced Carbon Fiber Reinforced Composite Materials)

Abstract

:
The aim of this study was to characterise the microstructural organisation of staple carbon fibre-reinforced polymer composites and to investigate their mechanical properties. Conventionally, fibre-reinforced materials are manufactured using continuous fibres. However, discontinuous fibres are crucial for developing sustainable structural second-life applications. Specifically, aligning staple fibres into yarn or tape-like structures enables similar usage to continuous fibre-based products. Understanding the effects of fibre orientation, fibre length, and compaction on mechanical performance can facilitate the fibres’ use as standard engineering materials. This study employed methods ranging from microscale to macroscale, such as image analysis, X-ray computed tomography, and mechanical testing, to quantify the microstructural organisations resulting from different alignment processing methods. These results were compared with the results of mechanical tests to validate and comprehend the relationship between fibre alignment and strength. The results show a significant influence of alignment on fibre orientation distribution, fibre volume fraction, tortuosity, and mechanical properties. Furthermore, different characteristics of the staple fibre tapes were identified and attributed to kinematic effects during movement of the sliver alignment unit, resulting in varying tape thicknesses and fuzzy surfaces.

1. Introduction

Fibre composites, especially carbon fibres (CFs), have recently gained significant attention due to their high strength and stiffness. Fibre-reinforced composite materials have been increasingly utilised in various industries due to their unique properties, such as high strength-to-weight ratios and excellent durability. Thus, the demand for composite materials has increased significantly, resulting in growth in the manufacturing and production of carbon fibre-reinforced polymers (CFRPs), which has led to an excess of end-of-life products [1,2].
Despite their high performance, the limited reusability of carbon fibres poses a significant challenge in the composite industry [3,4,5,6]. Disposing of carbon fibres and composite materials after their useful lives presents a significant environmental challenge. Landfilling or incineration to harness the thermal energy of composite waste are not environmentally sustainable options, and the lack of a feasible reclamation method for carbon fibres is a critical issue. The development of cost-effective and environmentally sustainable recycling methods for carbon fibres is an active area of research; such methods include mechanical recycling [7,8], chemical recycling [3,7,8,9], pyrometallurgical recycling [5,10], solvolysis [5,7], and hydrometallurgical recycling [5,11,12]. Each reclamation method has its advantages and limitations, as addressed in [3,4,6,13]. After reclamation, mechanical properties resulting from fibre alignment and fibre organisation have been destroyed.
In comparison to the usage of short fibres, nonwoven materials, or particulate reinforcements, the staple fibre architecture in composites is of considerable scientific interest due to its ability to enhance mechanical properties, such as tensile strength and impact resistance, through its unique arrangement and interlocking nature, resulting in improved load transfer and energy absorption characteristics. Recent developments in discontinuous CFs combined with advanced fibre alignment techniques have led to highly aligned staple fibre composite materials [14] with reasonable stiffness and strength properties compared to virgin CFRPs [14,15,16,17,18]. Table 1 summarises the current state-of-the-art in fibre alignment techniques.
Staple fibre composites are short fibres, typically between a few millimetres and several centimetres. Unlike continuous fibre composites, which are made of long fibres aligned in a specific direction, staple fibre composites offer a more flexible and cost-effective solution for many applications [15]. A critical process aspect of reusing carbon fibres is alignment, which helps the composite material maintain strong mechanical properties. The carding process is an essential step in preparing staple fibres for use in composite materials. This helps to ensure that the fibres are uniform and well-aligned, which is necessary for achieving favourable mechanical performance in the final composite product. The process involves several steps to prepare the fibres for use: 1. The fibre flock is opened. 2. The fibres are aligned through carding rolls covered with wire teeth that comb and align the fibres in the same direction. The fibres are then formed into a web, i.e., a uniform and continuous sheet of fibres. 3. The web of fibres is condensed into a sliver. A sliver is a compact and dense bundle of fibres that can be used for further processing, such as the manufacturing of yarns or tapes [18,25,26,27]. Table 1 summarises the state-of-the-art of the mechanical properties of discontinuous fibre-reinforced composite architectures, depending on the material and alignment process.
In all of the alignment methods mentioned above, considerable effort is spent in controlling the microstructure during processing to manufacture high-performance composite materials made from discontinuous carbon fibres that feature homogenously distributed, orientated, and aligned fibres [8,9]. In comparison to the state of art, it is crucial to understand the resulting properties from the microscale to the macroscale by multiscale characterisation because mechanical behaviour and damage mechanism will be different compared to continuous fibre-reinforced materials. Multiscale characterization is essential for its ability to provide a comprehensive understanding of complex systems and materials, offering advantages such as holistic insight, accurate predictions, tailored solutions, and defect identification, ultimately driving innovation and progress across various fields [28,29]. Hence, it is necessary to use multiscale characterisation methodologies to better understand the materials’ microstructure and macrostructure; this is the focus of this study. In the literature, a vast number of methods exist that have been explored within the field of fibre-reinforced composite materials, such as fibre orientation [30,31,32], fibre length [33,34], interfibre spacing [35], fibre diameter [36], fibre connectivity [37], fibre curvature [37], fibre volume fraction (FVF) [38], and porosity [39,40]. Each microstructural descriptor is measured using individual approaches by destructive methods, e.g., optical microscopy, including bright-field and polarised light microscopy [41,42] and mechanical testing, such as tensile testing or compression testing [11,21,27]; or non-destructive methods, e.g., X-ray-based techniques, such as X-ray diffraction [43], X-ray computed tomography [35,37,44,45,46,47] and ultrasound computed tomography [48]; ultrasonic testing [49,50,51], nuclear magnetic resonance spectroscopy and Raman spectroscopy [52,53]; image analysis using different algorithms, such as Fourier analysis [54], gradient-based methods, and structure tensor methods. Destructive testing provides precise measurements but destroys the sample, while non-destructive testing preserves sample integrity and allows for in situ applications but may offer less detailed information and require specialized equipment. Here, X-ray computed tomography facilitates the three-dimensional localization and measurement of microstructural defects such as fibre misalignment. Recent developments have positioned X-ray computed tomography as a highly promising approach for conducting three-dimensional non-destructive testing in material analysis and dimensional metrology, whereby the methods deliver extensive volumetric insights into material structure, composition, and both internal and external shapes [37,44].
The fibre orientation distribution (FOD) is an essential parameter that significantly influences the final mechanical properties because an aligned FOD improves the compaction behaviour and leads to higher stiffness properties. Fibre orientation has a crucial effect on the mechanical properties of cured parts. Usually, in laminates made from unidirectional (UD) layers, all the fibres are assumed to be perfectly orientated in the layers. In reality, not all fibres are perfectly orientated, especially when working with staple fibres [37]. A mathematical approach was used to modify the rule of mixture described by Yu et al. [22] and Kirupanantham [55]:
E 11 = η 0 η 1 V f E f + V m E m ,
where E 11 is Young’s modulus of the composite; η 0 is a correction factor for the fibre orientation; η 1 is a correction factor to take into account the overlap length between adjacent fibres, also called the Cox model [56]; V f and E f are the fibre properties; and V m and E m are the matrix properties. η 0 is defined as
η 0 = β i c o s 4 θ i ,
where β i is the frequency of the related fibre orientation angle θ i . Consequently, a perfect fibre orientation will lead to a value of 1. Figure 1 presents three representative FODs with their related alignment coefficients, η 0 . According to the shear-lag theory, η 1 is assumed to be 1, as the fibre lengths are >>1 mm. Consequently, there is a nondominant shear-lag domain.
The intricate interplay between the alignment process and mechanical properties stands as a pivotal factor in propelling the evolution of staple fibre architecture within structural fibre-reinforced composite materials. Thus, the identification of local microstructural defects and their influence at the larger scales is key to improving performance. To that end, this study explored and compared methods from the microscale to the macroscale, i.e., image analysis, X-ray computed tomography, and mechanical testing. The goal was to quantify different microstructural features such as FOD, FVF, and tortuosity using two alignment processing methods (low-stretch and high-stretch). First, image analysis based on 2D ply sections was performed using the structure tensor approach to characterise FODs. The structure tensor is a matrix that describes the local second-order structure of an image and is often used in computer vision and image processing for edge detection, texture analysis and directionality [57]. Second, X-ray computed tomography was used to reconstruct the fibre architecture at a single fibre path resolution. To identify microstructural features such as FOD, FVF, and tortuosity, a high level of contrast and a small voxel size was necessary. Furthermore, the level of homogenisation or representative volume element (RVE) was addressed in the frame of different region of interest (ROI) volumes. Lastly, mechanical tests were performed to validate the resulting microstructural features measured using two characterisation methods.

2. Materials and Methods

2.1. Materials

The methodology was demonstrated using two types of UD staple carbon fibre tapes with varying alignment processing parameters, designated as low-stretch (LS) and high-stretch (HS). The average length of a single filament in these tapes was approximately 50 mm, and the average fibre diameter was 7 μm. The fibre used in all samples was of the standard modulus/high-strength type, T700S-C-12K-50C, following the naming convention of Toray Industries, Inc. (Tokyo, Japan). Alongside the staple fibre tapes, a virgin reference plate was produced using a UD carbon fabric with 80 g/m2 using the same T700S-C-12K-50C tows. The epoxy resin system EPIKOTE™ 05545/EPIKURE™ 778/EPIKURE™ 120 (Hexion, Columbus, OH, USA) was employed in this study, with Marbocote HP7 used as a release agent. Figure 2 shows optical images of both tape configurations utilised in this study.

2.2. Specimen Manufacturing

The process of mixing the epoxy system was carried out using a Speedmixer DAC 1100.1 FVZ (Hauschild, Hamm, Germany), with two rounds of 2 min mixing intervals and reheating the resin to 80 °C between each round. Thorough mixing was achieved with a mixing speed of 1200 rpm while the resin was in its heated state. The resin was then degassed under a pressure of 100–200 mbar in a vacuum oven at 80 °C for 5–7 min to ensure the removal of any entrapped air. Table 2 summarises the resin mixing method for the epoxy system.
A total of 12 layers of staple carbon fibre tapes and 12 layers of the reference UD material were laminated to form flat test specimens using a compression moulding tool with dimensions of 170 mm × 85 mm, as depicted in Figure 3. Resin films with a thickness of 55 μm and a weight of 60 g/m2 were produced using a hot melt laboratory coater and laminator, specifically the HLCL-1000 model from ChemInstruments (West Chester Township, OH, USA). These resin films were then used to manufacture a prepreg by film-stacking them with carbon fibre tapes in the desired layup configuration.
The carbon fibre tapes were carefully aligned in parallel. Subsequently, each ply section was gently compressed using a hand-held flat iron. The iron surface was coated with a polytetrafluoroethylene film from Hightechflon GmbH & Co. KG (Konstanz, Germany) to prevent adherence to the resin film. A total of 12 plies were accurately cut to match the dimensions of the mould cavity. These plies were then stacked and subjected to vacuum degassing to ensure proper preconsolidation before the curing process. The preform was inserted into the female part of the mould and subjected to a press curing cycle, which included a 60 min hold at 100 °C, followed by a ramp up to 140 °C and a second hold at 140 °C for another 60 min.

2.3. Multiscale Characterisation Approach

The multiscale characterisation approach comprised three distinct methods, each operating at different scales: 3D fibre path reconstruction from micro-computed X-ray tomography images (micro), structure tensor analysis from optical surface images (meso), and mechanical testing by a classical tensile test in fibre direction (macro).

2.3.1. Three-Dimensional Fibre Reconstruction

Tomographic image collection for a comparative study was conducted using two samples extracted from the central region of the LS and HS plates. Firstly, high-resolution (HR) scans were performed using a Waygate Technologies (Lewistown, PA, USA) Phoenix Nanotom M equipped with an open 180 kV/20 W high-power nanofocus X-ray tube and a DXR detector (3072 × 2400 pixels). The measurement volume was 3012 × 928 pixels with 1692 projections, respectively 3 × 0.9 × 1.7 mm3. The resolution quality was set to 1 μm/voxel, represented as 16-bit unsigned data, equivalent to approximately seven pixels per carbon fibre diameter. The tomographic acquisition parameters were set at 60 kV, 150 μA and binning mode 1 × 1, resulting in a total scan time of 4 h. An ultra-high-resolution (UHR) scan was carried out on the HS staple carbon fibre plate using an RX Solution (Chavanod, France) EasyTom, equipped with nano-focus X-ray tube with a maximum voltage of 160 kV and a power of 16 W, and a CCD camera detector, consisting of 4008 × 2672 pixels, with a pixel pitch of 9 μm, to validate the derived microstructural features. The measurement volume was 1959 × 1959 pixels with 1931 projections, respectively 0.78 × 0.78 × 0.77 mm3. The resolution quality was set at 0.4 μm/voxel, corresponding to approximately 17.5 pixels per carbon fibre diameter. The tomographic acquisition parameters were set at 60 kV, 200 μA and binning mode 1 × 1, resulting in a total scan time of 16.5 h. Consequently, the scan volume of the UHR scan was smaller than that of the HR scan.
Data analysis and single fibre reconstruction were carried out using Avizo 3D software (Version 2022.1; Thermo Fischer, Waltham, MA, USA) in combination with the Avizo XFiber Extension module. The latter module computes the normalised cross-correlation of an image with a parametric solid or hollow cylinder, enabling the reconstruction of individual fibres. As this study focussed on assessing the level of homogenisation and potential influence on local properties such as the FVF and FOD, various regions of interest were examined in a preliminary study. Different fibre tracking methods, i.e., using the fibre diameter threshold, fibre length threshold, and fibre curvature threshold, were evaluated. The following procedure was implemented: (1) Median filtering with an iterative structuring element of seven pixels was utilised on all image sequences to reduce noise. (2) The Cylinder Correlation module was employed on the dataset. (3) The Trace Correlation Lines module was subsequently used to trace lines based on the correlation field, and the orientation field was computed using the Cylinder Correlation module. Each of the reconstructed single fibres (fitted cylinders) consisted of smaller graphs that resulted in segments with start and end points to reduce calculational effort. Thus, microstructural descriptors were assessed via the derivation of properties along the segment. In Avizo 3D, several microstructural descriptors are available by default, such as the in-plane fibre orientation, FVF, and tortuosity. All microstructural features were analysed at a single fibre resolution and eventually summarised as an average value with a standard deviation per ROI. The ROI is the specific area within the CT scan volume selected for analysis.
The fibre orientation angle represents the angle formed with the y-axis and varies in the range [−90, 90] degrees for a given 3 × 3 orientation tensor [58]. The orientation was calculated using the first eigenvector of the tensor, which represents the segment orientation. The eigenvalue and eigenvectors of the tensor were calculated and sorted in decreasing order of eigenvalues. Then, the orientation angle was computed with the first eigenvector as the angle between the segment orientation and the y-axis (0, 1, 0), and the range was adjusted to [−90, 90] degrees if necessary. Finally, the code outputs the calculated orientation angle theta in degrees. Additionally, the fibre volume fraction was derived based on the ratio of the summed fitted cylinders (fibre volume) to the entire composite volume. This is an important parameter, as it determines the mechanical properties of the composite material:
F V F = V f V f + V m ,
where V f is the volume of the fibres and V m is the volume of the matrix material.
Differential tortuosity is a concept in the study of fibrous materials that refers to the variation in tortuosity of fibres with respect to their orientation. Tortuosity measures the degree to which a fibre’s path deviates from a straight line. When fibres are randomly oriented, their tortuosity might also be random and vary across the material. However, when fibres are oriented in a preferred direction, the tortuosity is not uniform across the material but rather varies depending on the orientation of the fibres with respect to the preferred direction. Differential tortuosity is used, as otherwise, the resulting values group around one and, therefore, do not provide enough distinction [37]. Differential tortuosity τ is defined as the logarithmic ratio between the curved, L , and chord segment, L 0 , lengths:
τ = log L L 0 1 .

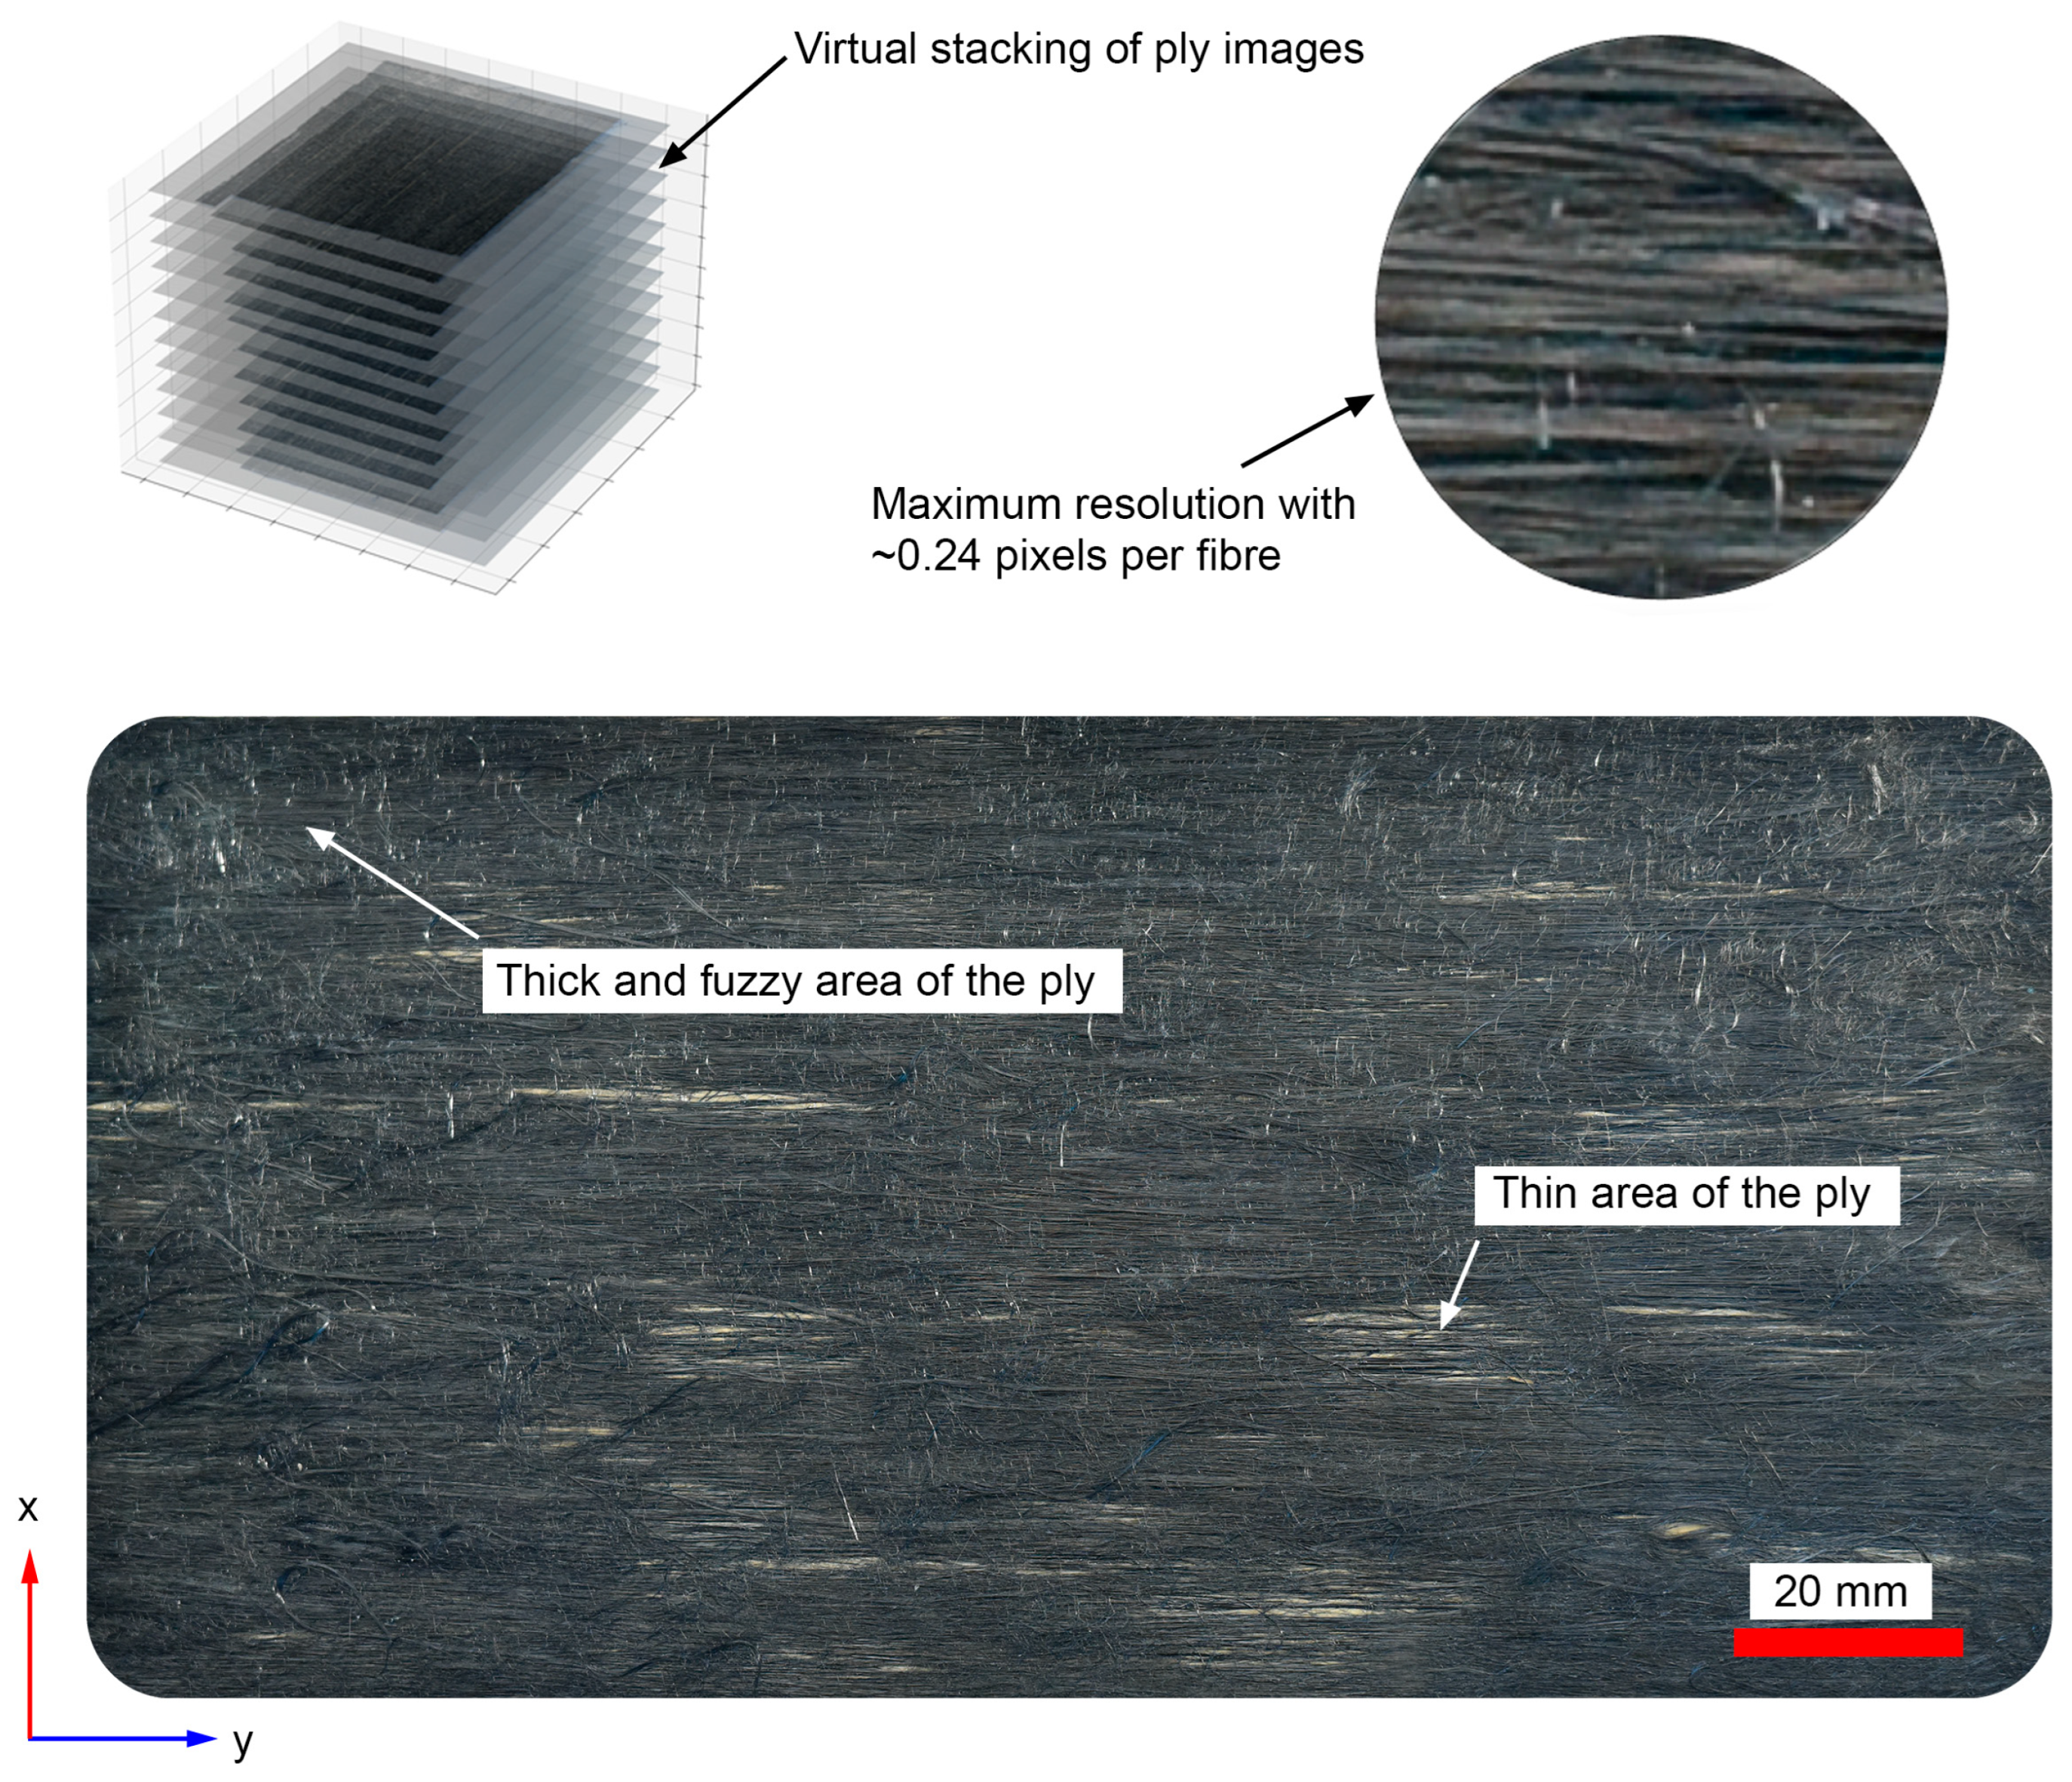
2.3.2. Two-Dimensional Mesoscopic Method

The 2D mesoscopic method was used to characterise the FODs. The structure tensor approach is a methodology based on an image analysis tool developed in Python (Version 3.8.12), comprising the following steps: (1) image acquisition, (2) derivation of the FODs, and (3) application and visualisation of the η 0 metric in a binned plot. During the process of manufacturing plate specimens, images of each layer were acquired using a full-format digital single-lens reflex (DSLR) camera (Nikon D810, Minato, Japan), equipped with a SIGMA 50 mm f/1.4 DG HSM lens (Rödermark, Germany) and a circular polarisation filter (Walimex, ø77 mm) to minimise artefacts from reflections of the carbon fibres. The resulting ply images had a resolution of 5759 × 2879 pixels, with a resolution of 300 dpi and 24 bits, resulting in an approximate resolution of 0.24 pixels per fibre. To mitigate the influence of distortion and in-plane effects caused by camera positioning, a camera calibration procedure using a checkerboard pattern plate based on OpenCV [59] was carried out.
Subsequently, the acquired images were processed using an automated Python script for further analysis. The images were partitioned into individual block segments, which acted as a homogenisation approach. Then, orientation analysis was conducted using the structure tensor approach implemented in Scikit [57], a popular machine-learning library in Python. The structure tensor method is computationally efficient and can be implemented using a convolution-based approach, making it a popular choice for fibre orientation analysis in optical images. The structure tensor method is well suited for images with complex fibre structures and high noise levels, as it is based on the local structure of the image and can effectively reduce the impact of noise [57]. The resulting histograms were utilised to calculate the probability density function to extract η 0 according to Equation (2) for each segment of the image. Consequently, the plies were virtually stacked and the alignment coefficient η 0 was calculated, resulting in a median and standard deviation value for each plate configuration.

2.3.3. Mechanical Testing

Five specimens were extracted from each laminated plate and subjected to quasi-static tensile loading conditions in accordance with ASTM D3039 [60]. The specimens had dimensions of length 170 mm, width 15 mm, and thickness 1 mm. Notably, the specimen length did not conform to the recommended length of 250 mm, with a free length between the clamps of 150 mm based on the available mould size.
The tests were conducted using a Zwick Roell Allround floor-standing testing machine, model BT2-FA100SN.A4K.002 (Ulm, Germany), equipped with a 100 kN load cell. The specimens were controlled using a constant displacement rate of 2 mm/min. A hydraulic pressure of 150 bar was applied to hold the specimens in place. The initial distance between the clamps was set at 120 mm. Strain measurements were captured using a mechanical extensometer, model BTC-EXMACRO.H02, which measured the strain between two points with a distance of 50 mm.

3. Results and Discussion

3.1. Characterisation of the Microstructural Architecture

Figure 4 presents micropolished cross-sections of the manufactured plate specimens, highlighting the degree of local misalignment shown by the elliptical shape of the fibres. The porosity was low, verifying that well-defined processing steps were applied to ensure favourable compaction behaviour of the staple fibres [55]. Despite this, cross-section analysis revealed that FVF had significant local variation, which raised discussion about a suitable representative volume.
Figure 5 presents an image of a ply section acquired during ply layup (specimen manufacturing) used for structure tensor evaluation showing the microstructural features of the surface, virtual stacking, and image resolution. The ply image shows different domains of fibre orientation: thick and fuzzy fibre surface features and thin areas with a high degree of fibre orientation. This effect is explained by kinematic effects inside the alignment unit. When the sliver passes through the alignment unit, two scenarios are plausible. First, sliver sections with a higher proportion of short fibres are believed to result in more random and thicker regions. Second, sliver sections with a more consistent and smaller proportion of short fibres result in robust and highly aligned tape regions. Consequently, the tape thickness varies, which can be adjusted by well-defined processing. Furthermore, the degree of fuzzy surface is influenced by potential movement or transport before consolidation.
First, the ply-wise 2D mesoscopic method was used to characterise each ply. A convergence study was performed to define the number of block segments. The results showed a nonlinear relationship between the number of bins with respect to the standard deviation of η 0 . This is because the local microstructural features vary depending on the block size. Thus, the images were partitioned into individual block segments of 10 × 10, with dimensions of 576 × 286 pixels, as the standard deviation was exceptionally high when the number of blocks was higher than 20 × 20. In Figure 6, results are presented for a single ply from the LS plate. It is evident that a high variation in alignment exists with η 0 between 0.55 and 0.9. The η 0   value is influenced by different processing steps such as carding, tape formation, prepreg consolidation, cutting, performing, and curing. The neat resin film only stabilises the textile topology and can be easily influenced. Generally, two characteristic phenomena are both seen in the image: under-aligned and over-aligned areas that are linked to areas highlighted in Figure 5. Under-aligned areas exist due to the presence of fuzzy surface areas, which eventually bias η 0 . Over-aligned areas show high fibre alignment because of the small number of fibres in the section. The images show that the highly aligned areas are thinner than other regions, making the background paper visible, which is caused by the stretching procedure applied during the alignment process. The under- and over-aligned segments represent a minority of the histogram. Thus, a representative area is marked within the probability density function (histogram) that represents the majority of segments. The essential metrics of each ply after the segmented structure tensor approach (homogenisation) were the average and standard deviation of the FOD value η 0 .
Next, the orientation η 0   values of all 12 plies were averaged and compared between the LS plate, HS plate, and the virgin UD reference using a box plot (see Figure 7). The low-aligned values, with an average of 0.741 and a standard deviation of 0.0252, are 5.1% lower compared to those of the highly aligned tape, with an average of 0.781 and a standard deviation of 0.024. This compares to the virgin UD reference, which has an average η 0 of 0.934 and a low standard deviation of 0.0089.
As is visible in the images, the orientation η 0   values are, in general, lower compared to the values in Table 1 due to the fuzzy surface, which biases the FOD. Despite this, the HS configuration shows improvement related to the FOD, which needs further investigation to understand the unbiased FOD within the tape. Consequently, the tape consists of core and edge effects, whereby the local properties change significantly. Furthermore, the method describes the scattering of values, whereby the virgin UD reference shows a significantly lower standard deviation in comparison to the staple fibre configurations. The apparent variation is an indication of alignment robustness. The virgin UD reference shows the highest orientation coefficient, comparable to existing values in the literature [11,22,23]. The optical images also allowed the detection of thickness depending on the amount of packing paper visible in the region; however, this idea was not further investigated.
Next, the 3D fibre path reconstruction is discussed. Figure 8 presents an overview of both scans for the HS plate configuration, whereby the increased resolution per single fibre is evident. Both scans reveal the pattern of fuzzy tape surfaces in the context of a laminate. Single fibre path reconstructions and their related parameters in Avizo were experimentally determined and iteratively improved by tuning the parameters in Table 3. First, smaller subvolumes were extracted to study the parameters’ effect on single fibre reconstruction. The quality and robustness were manually optimised by comparison of the reconstructed single fibres visualised as tube-like structures with the CT slices overlapping.
Figure 9 presents the reconstructed model of the UHR scan within an ROI with dimensions of 1166 × 1422 × 1206 pixels, respectively 0.46 × 0.57 × 0.48 mm3. A total of 5355 single fibres were identified. The reconstructed fibres were colour-coded by in-plane fibre orientation to observe effects such as interply phenomena. The different views (top and front) allowed the qualitative assessment of the reconstruction with the UHR scan, whereby both the model and scan correlated favourably. The accuracy of the reconstruction could not be evaluated due to the fact that there is no exact metric by which to determine the number of fibres lost during reconstruction. The figure compares different projections based on scan and reconstruction. The reconstructed model of the high-resolution (HR) scans exhibited reasonable performance, whereas the ultra-high-resolution (UHR) model demonstrated significantly superior results in respect of the 3D fibre reconstruction quality. Additionally, the model underlines the previous statement related to the fuzzy tape surface, which is again clearly visible. The red fibres show the highest deviation to the y-axis (zero degree), qualitatively separating the laminate into individual ply layers.
Analysis of the 3D-reconstructed model showed different absolute values compared to the 2D approach. Figure 10 presents the η 0 values for the HR and UHR scans, whereas Figure 11 shows the resulting FVF and tortuosity. The analysis of the differential tortuosity is sensitive to L 0 [37]. Thus, only the HR scans were compared, as they are based on the same scan volume and method. In the following, the alignment factor η 0 , the FVF, and the tortuosity τ are discussed for the LS and HS samples with high-resolution (HR) and ultra-high-resolution (UHR) measurement. The alignment factor η 0   values were averaged and compared between the LS and HS plates in a box plot (see Figure 10). The LS values with an average of 0.86 with a standard deviation of 0.02 are 1.71%/6.52% lower compared to those for the HS tape with an average of 0.875 (HR)/0.92 (UHR) and a standard deviation of 0.01 (HR)/0.015 (UHR). Hence, the HS plate performs slightly better with better alignment and lower scattering. Furthermore, the histogram in Figure 10 shows a small proportion of highly misaligned fibres, >70°/<−70°, which are also visible in Figure 9. The FVF was calculated based on the ratio between the total volume of all reconstructed single fibres to the ROI volume. The low-stretch HR scan obtained an FVF of 39.5 ± 0.05%, and the high-stretch HR and UHR obtained FVF values of 46.5 ± 0.075% and 41.8 ± 2%, respectively. The differential tortuosity for the low-stretch HR scans was −4.1 with a standard deviation of 2.8, and for the high-stretch HR, it was −4.35 with a standard deviation of 3.2. The median values show a slight decrease in differential tortuosity, leading to the assumption that the HS configuration is less tortuous. However, the tortuosity in combination with mesoscopic defects is more interesting and needs to be analysed in detail. As mentioned before, the ROI played a substantial role, as there were significant changes in FVF. Several measurements were performed on smaller ROIs showing deviations of >15% in FVF (e.g., from 35 to 49%). The η 0 shows similar scattering related to the subsequent ROI. The size and location of the ROI play a crucial role in calculating the microstructural features. Variations influence the local microstructural features in size and location. Validation of the chosen ROI through comparison with other techniques or reference data is recommended, and documenting the ROI selection process is important for the traceability and reproducibility of results in a study.
When the relative change in an ROI does not affect the average or standard deviation of the resulting property, an RVE can be defined. An RVE of approximately 0.9 × 0.9 × 1 mm3 was found to result in robust results based on the investigation with the HR scans, which included and averaged local extreme values found in this study. The chosen ROI for the UHR scan was 0.6 × 0.6 × 0.6 mm3 with a total scan size of <0.8 × 0.8 × 0.8 mm3; this was found to be too small to result in repeatable ROI segments. Thus, the UHR scan shows more optimistic values in comparison to the HR scans within all investigated microstructural features. Therefore, a more aligned ROI was chosen for the analysed UHR scan, which does not represent the values from the representative volume. Furthermore, when the resolution of the tomographic acquisition is decreased, the loss of information of well-aligned, parallel fibers, especially the ones very close to each other, is more likely compared to misaligned fibres. As η 0 is a summative property, the number of detected fibres influences the value and thus underestimates it. Nonetheless, the sensitivity analysis of the RVE is not conclusive and needs further consideration.
The measurements demonstrate a strong correlation between differential tortuosity, η 0 , and FVF. An ideally straight fibre’s differential tortuosity goes towards -∞, indicating that the presented staple fibre composites exhibit lower tortuosity with a higher variation compared to continuous fibre architectures [37]. The high-stretch HR tape shows a slightly improved tortuosity distribution compared to the low-stretch HR tape. These results underscore the importance of carefully controlling the stretching process to optimise the composite’s tortuosity and other mechanical properties. Figure 12 presents a representation of the FOD and differential tortuosity of the first 150 μm projected to the origin of the y-plane. The figures underline the previous correlations between FVF, FOD, and tortuosity. First, the FOD in Figure 12a,b shows that the qualitative assumption related to the fuzzy tape surfaces was correct, as the scattering within the binned plot presents a distinction and higher variation within the tape boundaries. Furthermore, the pattern reveals the proportion of misaligned fibres within the specimen. Regions at z = −1100 pixels and z = −100 pixels present the highest number of misaligned fibres in comparison to other regions. In contrast, the differential tortuosity in Figure 12c,d does not show a correlation between misaligned and aligned fibres. Nonetheless, there is a pattern observed at z = −1000 pixels whereby the median value of differential tortuosity abruptly shifts to a lower value, which is due to the resin rich area and misaligned region explained before. Furthermore, Figure 12d reveals resin rich areas with only a few fibres available at z = −1000 pixels and z = −100 pixels. Consequently, there are repeatable defects in the laminate from (a) resin-rich area with no fibres influenced by highly misaligned fibres to (b) highly aligned fibres [61].
Figure 13a,b present the single fibres represented as circular elements and the FVF as a binned plot. The figure primarily focuses on the structure and distribution of the FVF. Here, it is possible to analyse the high amount of scattering within the cross-section leading to regions with high and low FVF. The regions with high FVF > 0.6 provide a reasonable contribution to the high mechanical performance. The highly brittle regions with low FVF eventually initiate early failure of the specimen during mechanical testing. At z = −500 pixels, a mesoscopic defect is dominant, whereby a few highly misaligned fibres (see Figure 12) block the upper and lower fibre bundles to consolidate homogenously, creating a resin rich area. This defect is also visible in Figure 9. The microstructural defects mentioned above also apply here.
Compared to the previous data presented in Figure 7, the FOD alignment factor η 0 provides an average factor for the ply surface but does not provide insights into the ply thickness itself. For the high-stretch configuration, an average η 0 of 0.78 was obtained as reported in Figure 7. The CT analysis is limited to the scan dimension but provides an insight into the variation along the thickness of the manufactured laminate. In this case, the related orientation factor of the selected ROI is 0.875 for high resolution (HR) and 0.925 for ultra-high resolution (UHR). This indicates that analysis of the ply surface only by the 2D mesoscopic method underestimates the orientation factor by 12% for HR and 18.5% for UHR, which are conservative estimates. The CT analysis shows that most fibres that are not properly aligned appear at the ply surface/boundaries, and therefore the 2D mesoscopic analysis can be used as it measures the critical areas. In addition, 2D measuring methods are easier to implement in a quality system because they are cheaper in terms of hardware, are faster, and nearly in situ measurements of a running process are possible.

3.2. Evaluation and Comparison of Mechanical Properties

The longitudinal tensile properties of UD composites consisting of discontinuous fibres depend on several structural factors, including the composition of the material and the fibre orientation, length, and volume fraction. The alignment of UD discontinuous carbon fibres plays a critical role in determining the properties of the composite. Thus, this section presents the results of structural parameters based on tensile testing. Figure 14 presents the tensile stiffness and tensile strength of the two studied tape variants, i.e., “low stretch” and “high stretch”. The graphs indicate that the typical longitudinal maximum tensile stiffness and longitudinal tensile strength of the discontinuous carbon fibre composite used in this study are 70,155 +/− 2177 MPa and 1503 +/− 159 MPa, respectively, for the low-stretch variant and 74,285 +/− 953 MPa and 1663 +/− 85 MPa, respectively, for the high-stretch variant. In comparison to the staple fibre variants, the reference laminate, made from virgin continuous carbon fibre, provides a longitudinal tensile stiffness of 142,193 +/− 7882 MPa and a maximum tensile strength of 2014 +/− 237 MPa. All values presented here were normalised based on the simple rule of mixture to a fibre volume content of 55%.
The mechanical results show that the alignment factor is significant. The highly aligned tape is 5.8% stiffer and 10.6% stronger. At the same time, increasing the alignment reduces the standard deviation. The 5.8% increase in longitudinal tensile stiffness (Young’s modulus) nearly correlates with a 5.1% increase in alignment factor η 0 obtained using the 2D mesoscopic method. Further tests with different degrees of alignment are recommended to obtain more data points to establish the correlation between the tensile stiffness and the alignment factor.
In Figure 15, fractured samples are shown. The fracture surfaces appear similar to those of virgin UD carbon fibre composites. The stress–strain relationship is very linear with a brittle fracture, as is common for carbon fibre composites when tested along the fibre direction in quasi-static tensile loading conditions.
Table 4 summarises the resulting Young’s modulus based on classical laminate theory from Equation (1). Both methods (3D and 2D) show an increase in Young’s modulus from LS to HS because η 0 and E 11 are proportional. However, both methods overestimate the mechanical properties by >20%. Consequently, the simplified model used does not apply to the staple fibre architecture measured in this study, as local variations cannot be homogenised for the full laminate and significantly influence the mechanical properties. Thus, in spite of characteristic mesoscopic defects, the stiffness and especially the strength are considerably high.

4. Conclusions

In the present study, we aimed to quantify the results of the alignment process of staple fibres using various methods, such as 2D image analysis, 3D CT reconstruction, and mechanical testing. We utilised a fibre orientation histogram to calculate the degree of alignment as a dimensionless number. Our findings show that the 2D approach to the ply surface underestimates the fibre orientation distribution since most misalignments occur on the tape surface. This observation is consistent with CT data reconstruction results. We compared the alignment and resulting orientation factor to mechanical test results and observed a relationship between orientation and increased strength. Our conclusions are summarised as follows:
  • The results of measuring the alignment coefficient η 0 using the 2D mesoscopic method on the ply surface are, on average, 15% lower, making this method more conservative compared to the detailed CT analysis.
  • The investigation revealed that most fibres that are not correctly aligned appear at the ply surface/boundaries. Thus, 2D mesoscopic analysis can be utilised to identify critical fuzzy tape areas.
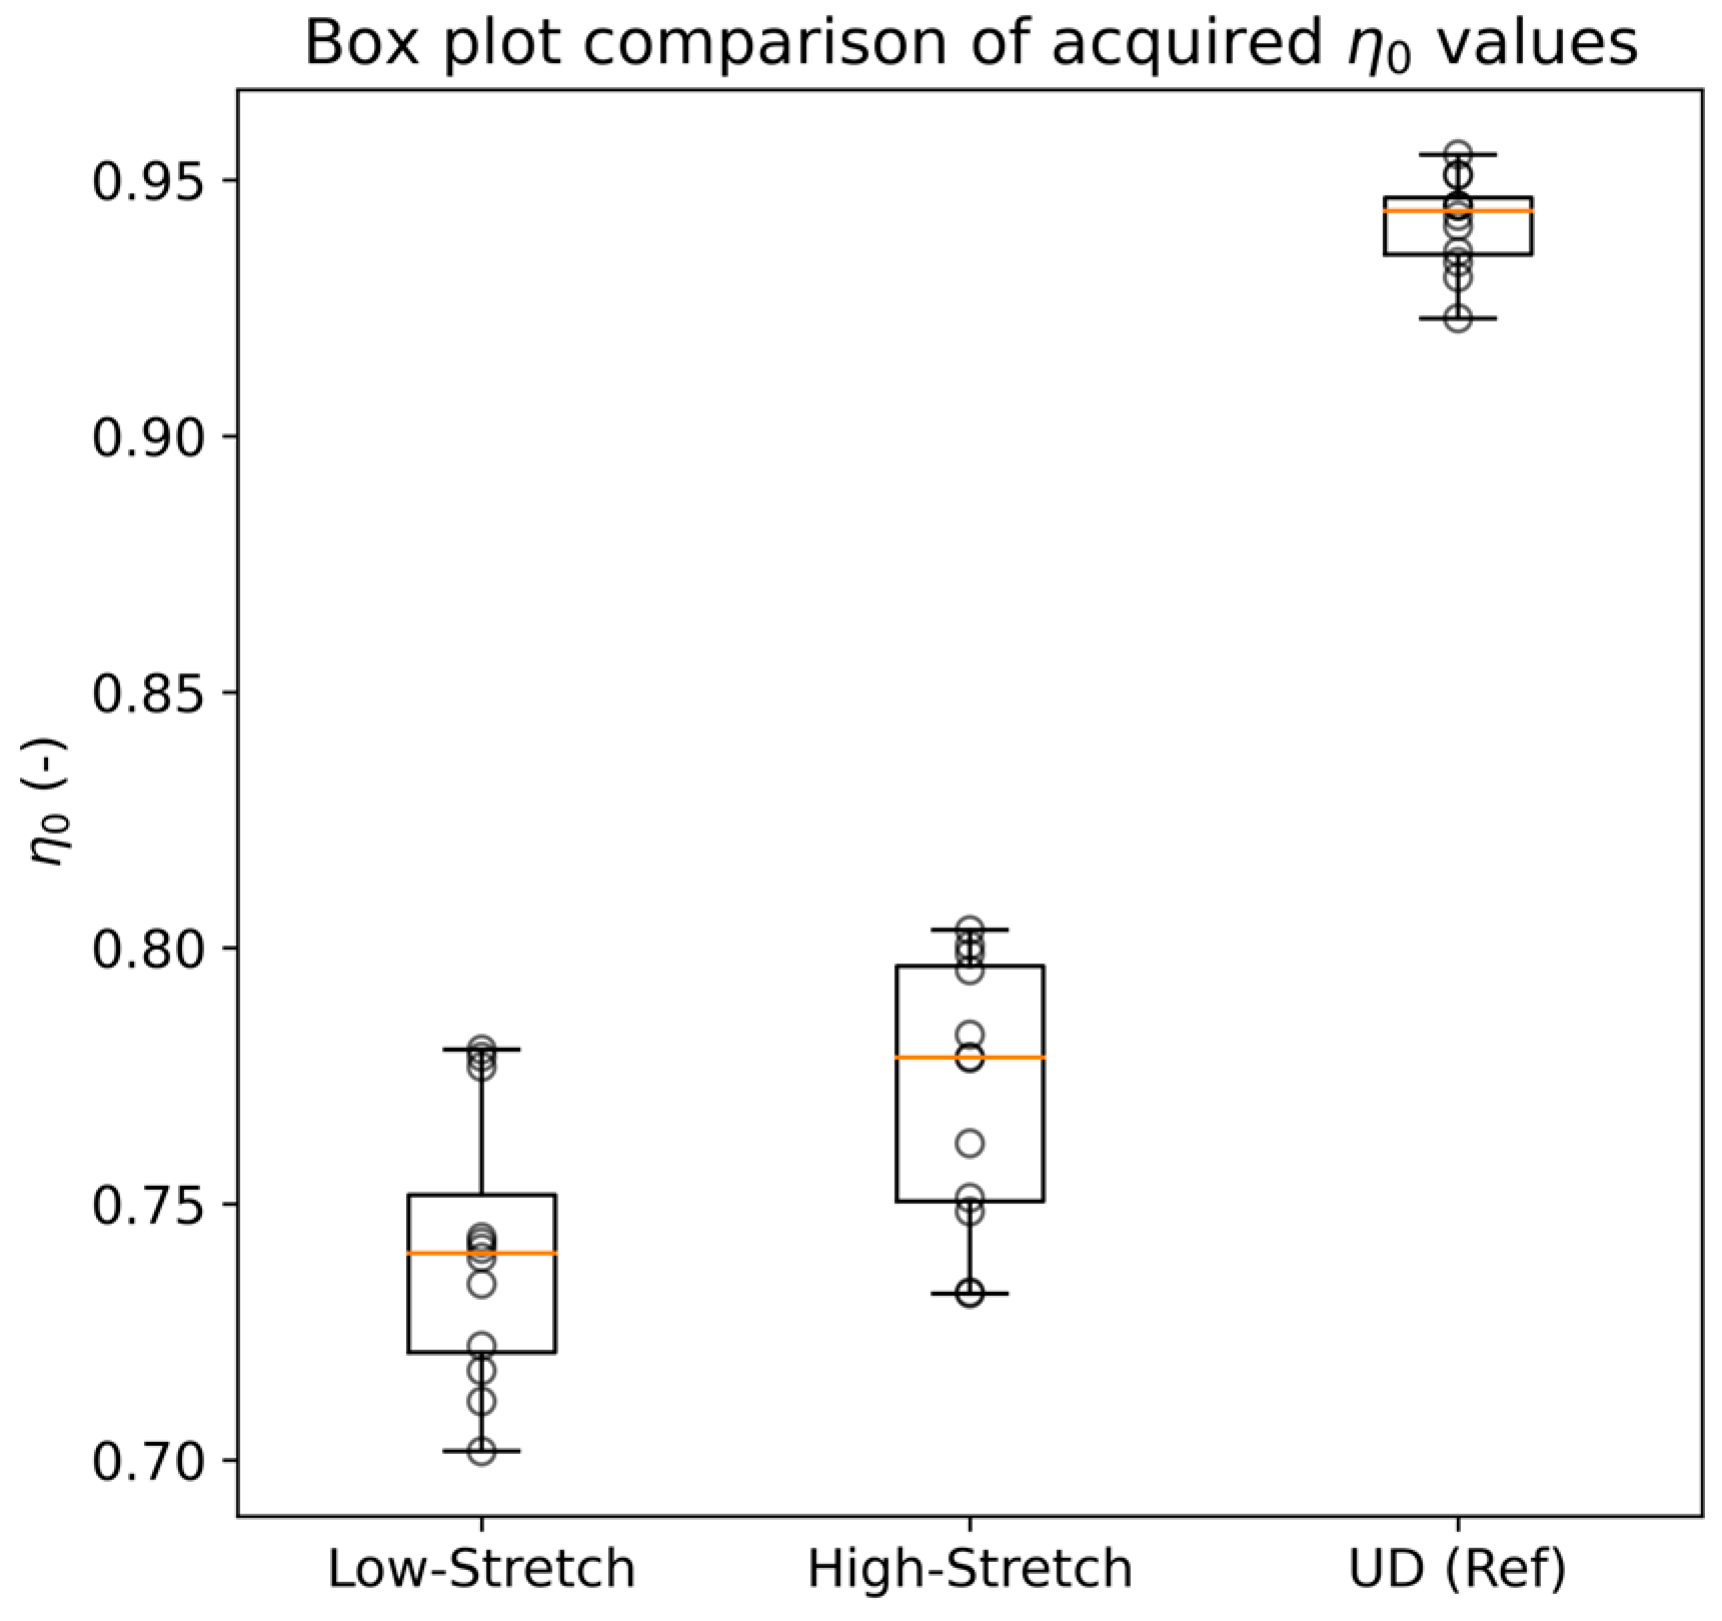
  • Our mechanical results indicate the influence of the alignment process. Highly aligned tapes are 5.8% stiffer and have 10.6% higher strength compared to tapes with a low fibre alignment. Moreover, an increase in alignment leads to a decrease in standard deviation.
  • The increase of 5.8% in stiffness almost correlates with an increase of 5.1% in alignment factor η 0 (2D mesoscopic method). The strength correlates with a factor of 2.1. However, further tests with different alignment degrees are recommended to obtain additional data points.
  • The derived microstructural properties of differential tortuosity, fibre volume fraction, and fibre orientation distribution correlate with defects arising from the alignment process, such as resin rich areas or high fibre volume fraction areas with increased fuzziness.
  • The usage of a homogenised η 0 for the staple fibre architecture overestimated the mechanical performance by >20% as defects were not taken into account, e.g., porosity and resin rich areas with a low fibre volume fraction.
In comparison to the state-of-the-art [16,17], the achieved values of longitudinal maximum tensile strength and longitudinal tensile stiffness are high despite characteristic mesoscopic defects and demonstrate the potential use of discontinuous carbon fibre composites in second-life applications for loadbearing structures.
The presented study will be a starting point to develop new homogenisation methods or to use the data for multiscale simulation by transferring the microscale data towards voxel or mesh-based simulation methods.

Author Contributions

L.Z., conceptualization, methodology, investigation, formal analysis, validation, software, visualisation, writing—original draft preparation, and writing—review and editing; J.K., investigation, validation, writing—original draft preparation, and writing—review and editing; C.D., conceptualisation, methodology, writing—original draft preparation, and writing—review and editing; B.C., conceptualisation, writing—original draft preparation, and writing—review and editing; S.B., writing—original draft preparation, and writing—review and editing; D.C., supervision; G.T.G., supervision; C.B., conceptualization, methodology, formal analysis, writing—original draft preparation, and writing—review and editing. All authors have read and agreed to the published version of the manuscript.

Funding

This research was conducted using our resources and without additional funding from a nationally funded project.

Data Availability Statement

The data presented in this study are available on request from the corresponding author.

Acknowledgments

We wish to express our sincere gratitude to maXerial AG, represented by Roger Herger, for their generous support in the scanning and analysis activities. We also thank PH/Phi for conducting high-resolution computer tomography scans.

Conflicts of Interest

The authors declare no conflict of interest.

References

  1. Pickering, S.J.; Liu, Z.; Turner, T.A.; Wong, K.H. Applications for carbon fibre recovered from composites. IOP Conf. Ser. Mater. Sci. Eng. 2016, 139, 012005. [Google Scholar] [CrossRef]
  2. Sloan, J. Composites Recycling Becomes a Necessity. Available online: https://www.compositesworld.com/articles/composites-recycling-becomes-a-necessity (accessed on 3 March 2023).
  3. Feraboli, P.; Kawakami, H.; Wade, B.; Gasco, F.; DeOto, L.; Masini, A. Recyclability and reutilization of carbon fiber fabric/epoxy composites. J. Compos. Mater. 2011, 46, 1459–1473. [Google Scholar] [CrossRef]
  4. Kim, K.W.; Lee, H.M.; An, J.H.; Chung, D.C.; An, K.H.; Kim, B.J. Recycling and characterization of carbon fibers from carbon fiber reinforced epoxy matrix composites by a novel super-heated-steam method. J. Environ. Manag. 2017, 203, 872–879. [Google Scholar] [CrossRef] [PubMed]
  5. Karuppannan Gopalraj, S.; Kärki, T. A review on the recycling of waste carbon fibre/glass fibre-reinforced composites: Fibre recovery, properties and life-cycle analysis. SN Appl. Sci. 2020, 2, 433. [Google Scholar] [CrossRef]
  6. Kim, Y.N.; Kim, Y.O.; Kim, S.Y.; Park, M.; Yang, B.; Kim, J.; Jung, Y.C. Application of supercritical water for green recycling of epoxy-based carbon fiber reinforced plastic. Compos. Sci. Technol. 2019, 173, 66–72. [Google Scholar] [CrossRef]
  7. Rybicka, J.; Tiwari, A.; Leeke, G.A. Technology readiness level assessment of composites recycling technologies. J. Clean. Prod. 2016, 112, 1001–1012. [Google Scholar] [CrossRef]
  8. Krauklis, A.E.; Karl, C.W.; Gagani, A.I.; Jørgensen, J.K. Composite material recycling technology—State-of-the-art and sustainable development for the 2020s. J. Compos. Sci. 2021, 5, 28. [Google Scholar] [CrossRef]
  9. Zhang, J.; Chevali, V.S.; Wang, H.; Wang, C.H. Current status of carbon fibre and carbon fibre composites recycling. Compos. Part B Eng. 2020, 193, 108053. [Google Scholar] [CrossRef]
  10. Li, Y.F.; Li, J.Y.; Ramanathan, G.K.; Chang, S.M.; Shen, M.Y.; Tsai, Y.K.; Huang, C.H. An experimental study on mechanical behaviors of carbon fiber and microwave-assisted pyrolysis recycled carbon fiber-reinforced concrete. Sustainability 2021, 13, 6829. [Google Scholar] [CrossRef]
  11. Longana, M.L.; Ong, N.; Yu, H.N.; Potter, K.D. Multiple closed loop recycling of carbon fibre composites with the HiPerDiF (High Performance Discontinuous Fibre) method. Compos. Struct. 2016, 153, 271–277. [Google Scholar] [CrossRef]
  12. Tapper, R.J.; Longana, M.L.; Norton, A.; Potter, K.D.; Hamerton, I. An evaluation of life cycle assessment and its application to the closed-loop recycling of carbon fibre reinforced polymers. Compos. Part B Eng. 2020, 184, 107665. [Google Scholar] [CrossRef]
  13. Pimenta, S.; Pinho, S.T. Recycling carbon fibre reinforced polymers for structural applications: Technology review and market outlook. Waste Manag. 2011, 31, 378–392. [Google Scholar] [CrossRef]
  14. Baz, S.; Ausheyks, L.; Reichert, O.; Dinkelmann, A.; Finckh, H.; Hehl, J.; Poeppel, A.; Gresser, G.T. Recycling of long carbon fibers, Part I: Development of a high aligned RCF-sliver for a binder tape manufacturing process. In Proceedings of the ECCM 2018—18th European Conference on Composite Materials, Athens, Greece, 24–28 June 2018. [Google Scholar]
  15. Goergen, C.; Baz, S.; Mitschang, P.; Gresser, G.T.; Heitmann, U. Plastically deformable thanks to staple fibers. Kunststoffe Int. 2016, 5, 25–28. [Google Scholar]
  16. Goergen, C.; Baz, S.; Reichert, O.; Mitschang, P.; Gresser, G.T. Organic sheets with deep-drawing ability made of recycled carbon fibers. Z. Kunststofftechnik/J. Plast. Technol. 2019, 1, 54–94. [Google Scholar] [CrossRef]
  17. Hasan, M.M.B.; Nitsche, S.; Abdkader, A.; Cherif, C. Carbon fibre reinforced thermoplastic composites developed from innovative hybrid yarn structures consisting of staple carbon fibres and polyamide 6 fibres. Compos. Sci. Technol. 2018, 167, 379–387. [Google Scholar] [CrossRef]
  18. Hasan, M.M.B.; Hengstermann, M.; Dilo, R.; Abdkader, A.; Cherif, C. Investigations on the manufacturing and mechanical properties of spun yarns made from staple cf for thermoset composites. Autex Res. J. 2017, 17, 395–404. [Google Scholar] [CrossRef]
  19. Yu, H.; Potter, K.D.; Wisnom, M.R. A novel manufacturing method for aligned discontinuous fibre composites (High Performance-Discontinuous Fibre method). Compos. Part A Appl. Sci. Manuf. 2014, 65, 175–185. [Google Scholar] [CrossRef]
  20. Heider, D.; Tierney, J.; Deitzel, J.; Kubota, M.; Thiravong, J.; Gargitter, V.; Burris, W.; Morris, J.; Shevchenko, N.; Yarlagadda, S.; et al. Closed loop recycling of CFRP into highly aligned high performance short fiber composites using the tuff process. In Proceedings of the International SAMPE Technical Conference, Charlotte, NC, USA, 20–23 May 2019. [Google Scholar]
  21. Yarlagadda, S.; Deitzel, J.; Heider, D.; Tierney, J.; Gillespie, J.W. Tailorable Universal Feedstock for Forming (TUFF): Overview and performance. In Proceedings of the International SAMPE Technical Conference, Charlotte, NC, USA, 20–23 May 2019. [Google Scholar]
  22. Heider, D.; Tierney, J.; Henchir, M.A.; Gargitter, V.; Yarlagadda, S.; Gillespie, J.W.; Sun, J.; Sietins, J.M.; Knorr, D. Microstructural evaluation of aligned, short fiber Tuff material. In Proceedings of the International SAMPE Technical Conference, Charlotte, NC, USA, 20–23 May 2019. [Google Scholar]
  23. Walker, L. Development of Prepreg and Processing Technologies for recycled Carbon Fibre Based Textiles. Master’s Thesis, FHNW University of Applied Sciences and Arts Northwestern Switzerland, Windisch, Switzerland, 2021. [Google Scholar]
  24. Khurshid, M.F.; Gereke, T.; Hasan, M.M.B.; Abdkader, A.; Cherif, C. Theoretical modeling of tensile properties of thermoplastic composites developed from novel unidirectional recycled carbon fiber tape structure. J. Thermoplast. Compos. Mater. 2023. [Google Scholar] [CrossRef]
  25. Xiao, B.; Zaima, T.; Shindo, K.; Kohira, T.; Morisawa, J.; Wan, Y.; Yin, G.; Ohsawa, I.; Takahashi, J. Characterization and elastic property modeling of discontinuous carbon fiber reinforced thermoplastics prepared by a carding and stretching system using treated carbon fibers. Compos. Part A Appl. Sci. Manuf. 2019, 126, 105598. [Google Scholar] [CrossRef]
  26. Manis, F.; Stegschuster, G.; Wölling, J.; Schlichter, S. Influences on textile and mechanical properties of recycled carbon fiber nonwovens produced by carding. J. Compos. Sci. 2021, 5, 209. [Google Scholar] [CrossRef]
  27. Khurshid, M.F.; Abdkader, A.; Cherif, C. Processing of waste carbon and polyamide fibres for high-performance thermoplastic composites: Influence of carding parameters on fibre orientation, fibre length and sliver cohesion force. J. Text. Inst. 2020, 111, 1277–1287. [Google Scholar] [CrossRef]
  28. Hu, N.; Fish, J.; McAuliffe, C. An adaptive stochastic inverse solver for multiscale characterization of composite materials. Int. J. Numer. Methods Eng. 2017, 109, 1679–1700. [Google Scholar] [CrossRef]
  29. Zobeiry, N.; Forghani, A.; Li, C.; Gordnian, K.; Thorpe, R.; Vaziri, R.; Fernlund, G.; Poursartip, A. Multiscale characterization and representation of composite materials during processing. Philos. Trans. R. Soc. A Math. Phys. Eng. Sci. 2016, 374, 20150278. [Google Scholar] [CrossRef] [PubMed]
  30. Laurencin, T.; Dumont, P.J.J.; Orgéas, L.; Corre, S.L.; Martoïa, F.; Rolland du Roscoat, S.; Laure, P. 3D real time and in situ observation of the fibre orientation during the plane strain flow of concentrated fibre suspensions. J. Nonnewton. Fluid Mech. 2023, 312, 104978. [Google Scholar] [CrossRef]
  31. Belliveau, R.; Léger, É.; Landry, B.; LaPlante, G. Measuring fibre orientation and predicting elastic properties of discontinuous long fibre thermoplastic composites. J. Compos. Mater. 2021, 55, 321–330. [Google Scholar] [CrossRef]
  32. Sebaey, T.A.; Catalanotti, G.; O’Dowd, N.P. A microscale integrated approach to measure and model fibre misalignment in fibre-reinforced composites. Compos. Sci. Technol. 2019, 183, 107793. [Google Scholar] [CrossRef]
  33. Salaberger, D.; Kannappan, K.A.; Kastner, J.; Reussner, J.; Auinger, T. Evaluation of computed tomography data from fibre reinforced polymers to determine fibre length distribution. Int. Polym. Process. 2011, 26, 283–291. [Google Scholar] [CrossRef]
  34. Melenka, G.W.; Gholami, A. Fiber identification of braided composites using micro-computed tomography. Compos. Commun. 2021, 27, 100813. [Google Scholar] [CrossRef]
  35. Maksimcuka, J.; Obata, A.; Sampson, W.W.; Blanc, R.; Gao, C.; Withers, P.J.; Tsigkou, O.; Kasuga, T.; Lee, P.D.; Poologasundarampillai, G. X-ray tomographic imaging of tensile deformation modes of electrospun biodegradable polyester fibers. Front. Mater. 2017, 4, 43. [Google Scholar] [CrossRef]
  36. Diaz, A.; Guizar-Sicairos, M.; Poeppel, A.; Menzel, A.; Bunk, O. Characterization of carbon fibers using X-ray phase nanotomography. Carbon 2014, 67, 98–103. [Google Scholar] [CrossRef]
  37. Gomarasca, S.; Peeters, D.M.J.; Atli-Veltin, B.; Dransfeld, C. Characterising microstructural organisation in unidirectional composites. Compos. Sci. Technol. 2021, 215, 109030. [Google Scholar] [CrossRef]
  38. Katuin, N.; Peeters, D.M.J.; Dransfeld, C.A. Method for the microstructural characterisation of unidirectional composite tapes. J. Compos. Sci. 2021, 5, 275. [Google Scholar] [CrossRef]
  39. Nikishkov, Y.; Seon, G.; Makeev, A. Structural analysis of composites with porosity defects based on X-ray computed tomography. J. Compos. Mater. 2014, 48, 2131–2144. [Google Scholar] [CrossRef]
  40. Nikishkov, Y.; Airoldi, L.; Makeev, A. Measurement of voids in composites by X-ray Computed Tomography. Compos. Sci. Technol. 2013, 89, 89–97. [Google Scholar] [CrossRef]
  41. Sharp, N.D.; Goodsell, J.E.; Favaloro, A.J. Measuring fiber orientation of elliptical fibers from optical microscopy. J. Compos. Sci. 2019, 3, 23. [Google Scholar] [CrossRef]
  42. Sharma, B.N.; Naragani, D.; Nguyen, B.N.; Tucker, C.L.; Sangid, M.D. Uncertainty quantification of fiber orientation distribution measurements for long-fiber-reinforced thermoplastic composites. J. Compos. Mater. 2018, 52, 1781–1797. [Google Scholar] [CrossRef]
  43. Yamanaka, A.; Terada, M.; Ichiki, M.; Kimoto, Y.; Shiraki, K.; Nagata, M.; Shimamoto, D.; Hotta, Y. Evaluation of fiber orientation by x-ray diffraction on carbon fiber reinforced polyamide 6. J. Fiber Sci. Technol. 2020, 76, 199–207. [Google Scholar] [CrossRef]
  44. Dilonardo, E.; Nacucchi, M.; De Pascalis, F.; Zarrelli, M.; Giannini, C. High resolution X-ray computed tomography: A versatile non-destructive tool to characterize CFRP-based aircraft composite elements. Compos. Sci. Technol. 2020, 192, 108093. [Google Scholar] [CrossRef]
  45. Dilonardo, E.; Nacucchi, M.; De Pascalis, F.; Zarrelli, M.; Giannini, C. Inspection of Carbon Fibre Reinforced Polymers: 3D identification and quantification of components by X-ray CT. Appl. Compos. Mater. 2022, 29, 497–513. [Google Scholar] [CrossRef]
  46. Galvez-Hernandez, P.; Kratz, J. The effect of convolutional neural network architectures on phase segmentation of composite material X-ray micrographs. J. Compos. Mater. 2023, 57, 2899–2918. [Google Scholar] [CrossRef]
  47. Frącz, W.; Janowski, G.; Pruchniak, M.; Wałek, Ł. The use of computed tomography in the study of microstructure of molded pieces made of poly(3-hydroxybutyric-co-3-hydroxyvaleric acid) (phbv) biocomposites with natural fiber. Polymers 2021, 13, 2942. [Google Scholar] [CrossRef]
  48. Yang, X.; Ju, B.F.; Kersemans, M. Assessment of the 3D ply-by-ply fiber structure in impacted CFRP by means of planar Ultrasound Computed Tomography (pU-CT). Compos. Struct. 2022, 279, 114745. [Google Scholar] [CrossRef]
  49. Pelivanov, I.; Ambroziński, Ł.; Khomenko, A.; Koricho, E.G.; Cloud, G.L.; Haq, M.; O’Donnell, M. High resolution imaging of impacted CFRP composites with a fiber-optic laser-ultrasound scanner. Photoacoustics 2016, 4, 55–64. [Google Scholar] [CrossRef]
  50. Katunin, A.; Dragan, K.; Dziendzikowski, M. Damage identification in aircraft composite structures: A case study using various non-destructive testing techniques. Compos. Struct. 2015, 127, 1–9. [Google Scholar] [CrossRef]
  51. Li, C.; Pain, D.; Wilcox, P.D.; Drinkwater, B.W. Imaging composite material using ultrasonic arrays. NDT E Int. 2013, 53, 8–17. [Google Scholar] [CrossRef]
  52. Dong, L.; Hang, H.; Park, J.G.; Mio, W.; Liang, R. Detecting Carbon Nanotube Orientation with Topological Analysis of Scanning Electron Micrographs. Nanomaterials 2022, 12, 1251. [Google Scholar] [CrossRef] [PubMed]
  53. Tanaka, M.; Young, R.J. Review Polarised Raman spectroscopy for the study of molecular orientation distributions in polymers. J. Mater. Sci. 2006, 41, 963–991. [Google Scholar] [CrossRef]
  54. Alavi, S.H.; Ruiz, V.; Krasieva, T.; Botvinick, E.L.; Kheradvar, A. Characterizing the collagen fiber orientation in pericardial leaflets under mechanical loading conditions. Ann. Biomed. Eng. 2013, 41, 547–561. [Google Scholar] [CrossRef] [PubMed]
  55. Kirupanantham, G. Characterisation of Discontinuous Carbon Fibre Preforms for Automotive Applications. Ph.D. Thesis, University of Nottingham, Nottingham, UK, 2013. [Google Scholar]
  56. Cox, H.L. The elasticity and strength of paper and other fibrous materials. Br. J. Appl. Phys. 1952, 3, 72–79. [Google Scholar] [CrossRef]
  57. Scikit Image Processing in Python. Available online: https://scikit-image.org/docs/stable/api/skimage.feature.html#skimage.feature.structure_tensor (accessed on 10 March 2023).
  58. Avizo 3D Manual. Available online: https://www.thermofisher.com/ch/en/home/electron-microscopy/products/software-em-3d-vis/avizo-software.html (accessed on 28 July 2023).
  59. Mallick, S.; Sadekar, K. Camera Calibration Using OpenCV. Available online: https://learnopencv.com/camera-calibration-using-opencv/ (accessed on 10 March 2023).
  60. Standard Test Method for Tensile Properties of Polymer Matrix Composite Materials. Available online: https://www.astm.org/d3039_d3039m-08.html (accessed on 17 April 2023).
  61. Such, M.; Ward, C.; Potter, K. Aligned Discontinuous Fibre Composites: A Short History. J. Multifunct. Compos. 2014, 2, 155–168. [Google Scholar] [CrossRef]
Figure 1. Fibre orientation distributions (FODs) with their resulting η 0 .
Jcs 07 00465 g001
Figure 2. Top-view images of the tapes utilised in this study depicting (a) low-stretch tape and (b) high-stretch tape, both with a nominal width of 16 mm.
Jcs 07 00465 g002
Figure 3. Manufacturing steps of flat test specimens in compression moulding process.
Jcs 07 00465 g003
Figure 4. Micropolished cross-sectional analysis of specimens derived from manufactured (a) LS and (b) HS staple carbon fibre plates.
Jcs 07 00465 g004
Figure 5. Image acquisition of LS plate ply section taken with Nikon D810 digital single-lens reflex (DSLR) camera.
Jcs 07 00465 g005
Figure 6. Results of the 2D mesoscopic analysis for a single ply within the LS plate (a) image segmented into 10 × 10 binned grid; (b) derived η 0 in every binned segment; (c) resulting histograms from every binned segment; (d) histogram with a fitted probability density function of η 0 .
Jcs 07 00465 g006
Figure 7. Derived η 0 values from virtually stacked optical images acquired ply-by-ply with a DLSR camera.
Jcs 07 00465 g007
Figure 8. Overview of (a) HR and (b) UHR computer tomography scans and their resulting single fibre quality.
Jcs 07 00465 g008
Figure 9. Resulting single fibre reconstruction of UHR scan within an ROI with the dimensions 1166 × 1422 × 1206 pixels and coloured using an in-plane fibre orientation for each fibre based on Avizo XFiber (a) 3D view; (b) front view; (c) top view.
Jcs 07 00465 g009
Figure 10. (a) Correction factor η 0   and (b) fibre orientation distribution (FOD) derived for the HR and UHR scans, based on 3D fibre reconstruction.
Jcs 07 00465 g010
Figure 11. (a) FVF as a function of the HR and UHR scans and (b) differential tortuosity as a function of HR scans, based on 3D fibre reconstruction.
Jcs 07 00465 g011
Figure 12. Contour and bin scatter plots of the local microstructural features based on 3D fibre reconstruction of the UHR scan whereby the first 150 μm of the y-axis was projected to the y-plane: (a,b) fibre orientation distribution (FOD); (c,d) differential tortuosity.
Jcs 07 00465 g012
Figure 13. (a) Detected fibres within the first 150 μm of the y-axis represented as circular points; (b) binned plot of FVF.
Jcs 07 00465 g013
Figure 14. Longitudinal tensile modulus (left) and longitudinal maximum tensile strength (right) of low-stretch and high-stretch tape configurations.
Jcs 07 00465 g014
Figure 15. Fracture surfaces after quasi-static tensile test for low-stretch (a) and high-stretch (b) variants.
Jcs 07 00465 g015
Table 1. Comparison of relevant mechanical properties of staple carbon fibre architecture.
Project,
Year
MatrixFibreAverage Fibre Length
(mm)
Fibre
Alignment
Fibre
Alignment
Factor, η 0
Calculation Method of AlignmentFibre Volume Fraction
(%)
Young’s
Modulus in the Main Fibre Direction E11+
(GPa)
Strength in the Main
Fibre Direction
R11+
(MPa)
HiPerDiF
2013 [19]
EpoxyCarbon3±3° (67%)~0.912D (in-plane microscope images)551151509
TuFF
2019 [20]
EliumCarbon IM73---3072765
TuFF
2019 [21]
PEICarbon IM73±5° (95%)~0.98-631732668
TuFF 2019 [22]PEICarbon IM73–7±5° (94%)/±5° (87%)~0.98/~0.913D CT/2D (out-of-plane microscope images)631732668
L.Walker, FHNW 2021 [23]EpoxyCarbon T70050±10° (61%)0.85 53991203
Khurshid et al., 2023 [24]PA6Carbon (Teijin)38-0.932D (out-of-plane microscope images)45851350
Table 2. Resin mixing method for Hexion system EPIKOTETM 05545/EPIKURETM 778/EPIKURETM 120.
NameMixing Ratio (w%)Mixing Temperature (°C)
EPIKOTE™ Resin 0554510080
EPIKURE™ Curing Agent 7781625
EPIKURE™ Catalyst 120325
Table 3. Experimentally determined cylinder correlation and trace correlation line parameters for Avizo XFiber Extension.
ParameterHR Scans (1 μm/voxel)UHR Scans (0.4 μm/voxel)
Cylinder length (nm)6060
Angular sampling55
Mask cylinder radius (μm)48.5
Outer cylinder radius (μm)3.58
Inner cylinder radius (μm)00
Minimum seed correlation7070
Minimum continuation6045
Direction coefficient0.40.4
Minimum distance (μm)716
Minimum length (μm)6060
Angle (deg)3737
Minimum step size (%)1010
Table 4. Resulting Young’s modulus based on calculations from 3D fibre reconstruction, 3D mesoscopic method with the laminate theory from Equation (1), and mechanical tests.
Alignment Process3D Fibre Reconstruction (MPa)2D Mesoscopic Method (MPa)Mechanical Testing (MPa)
Low-stretch configuration117,300–119,40592,340–97,40070,155
High-stretch configuration120,100–123,45097,400–102,46074,285
Disclaimer/Publisher’s Note: The statements, opinions and data contained in all publications are solely those of the individual author(s) and contributor(s) and not of MDPI and/or the editor(s). MDPI and/or the editor(s) disclaim responsibility for any injury to people or property resulting from any ideas, methods, instructions or products referred to in the content.

