Article

Biomass Derived High Porous Carbon via CO2 Activation for Supercapacitor Electrodes

1
Institute of Combustion Problems, 172 Bogenbay Batyr Str., 050012 Almaty, Kazakhstan
2
Faculty of Chemistry and Chemical Technology, Al Farabi Kazakh National University, Al-Farabi Avenue 71, 050040 Almaty, Kazakhstan
3
Bes Saiman Group, 171a Zharokov Str., 050057 Almaty, Kazakhstan
4
Institute of Combustion Problems, Satbayev University, 22a Satpaev Str., 050013 Almaty, Kazakhstan
5
Institute of Nuclear Physics, 1 Ibragimova Str., 050032 Almaty, Kazakhstan
6
National Laboratory Astana, Nazarbayev University, 53 Kabanbay Batyr Ave., 010000 Nur-Sultan, Kazakhstan
7
Université de Lorraine, CNRS, IJL, 88000 Epinal, France
*
Author to whom correspondence should be addressed.
J. Compos. Sci. 2023, 7(10), 444; https://doi.org/10.3390/jcs7100444
Submission received: 25 September 2023 / Revised: 11 October 2023 / Accepted: 13 October 2023 / Published: 21 October 2023
(This article belongs to the Section Biocomposites)

Abstract

:
In this study, we systematically study the efficient production method and electrochemical characteristics of activated carbons (AC) derived from rice husk (RH) and walnut shell (WS). In particular, the effectiveness of physical activation using carbon dioxide (CO2) was investigated and compared with the more common chemical activation method using potassium hydroxide (KOH). The results show that the KOH–activated samples have remarkable specific capacities, reaching 157.8 F g−1 for RH and 152 F g−1 for WS at 1 A g−1. However, the rate capability of AC obtained via KOH decreases significantly as the scanning rate increases, retaining only 51.5% and 68% of their original capacities for RH–KOH and WS–KOH, respectively, at 20 A g–1. In contrast, CO2–activated samples show a superior rate performance with a capacity retention of 75.6% for WS and 80% for RH at the same current density. In addition, electrochemical impedance spectroscopy (EIS) analysis shows that AC obtained via CO2 has a lower charge transfer resistance compared to its KOH counterparts. CO2–activated RH and WS electrodes show Rct values of 0.1 Ω and 0.24 Ω, respectively, indicating improved ion transport kinetics and surface area utilization. These results highlight the importance of activation techniques in tailoring the electrochemical behavior of biomass–derived carbon. This study not only expands the understanding of the interaction between activation, morphology, and performance but also indicates the potential of CO2 activation as an environmentally friendly and efficient alternative. As the field of sustainable energy storage advances, this work provides valuable guidance for the development of high–performance supercapacitor electrodes with less environmental impact.

1. Introduction

Activated carbons have consistently garnered significant attention from researchers across various scientific disciplines due to their wide array of applications in both fundamental and applied research [1,2,3,4,5]. A critical prerequisite for their successful utilization in areas such as catalysis, water purification, or carbon dioxide capture is the attainment of a high specific surface area, tunable porous structure, and the presence or absence of specific functional groups on their surface. The principal sources for production encompass coal, wood, or biomass derived from agricultural residues [6,7]. Of these, biomass stands out as the most economically advantageous option, owing to its cost–effectiveness and its absence of deleterious contaminants, distinguishing it from fossil sources.
Also, the choice of an appropriate activation method, reagent, temperature, time, and other parameters is a determining factor for the production of high–quality, eco–friendly, and economically viable products with tunable characteristics for employing as active electrode mass in energy storage systems. The preparation of activated carbons from biomass usually includes the process of activation via various aggressive reagents at high temperatures. The chemical activation method using potassium hydroxide (KOH) is the most effective and common method for producing AC from biomass and is widely described in the scientific literature [8,9]. However, its use poses certain dangers to the environment and has technological drawbacks [10,11]. KOH is a strong alkali and can cause serious irritation of the skin, eyes, respiratory tract, and other mucous parts of the body [12]. Therefore, handling requires strict protective measures, which complicates the technology of preparing the final product. Another drawback is the impact on the environment both during production and during disposal after use. The high cost of the activating agent itself is also worth noting [13]. In general, the use of KOH has a clear set of dangers and drawbacks that must be carefully considered when producing AC.
Alternative methods, such as physical activation using carbon dioxide (CO2), can offer a safer, cheaper, faster, and more economical approach to the production of AC from various biomass materials. A previous study compared the efficiency of physical and chemical activation methods for producing AC based on Mimosa tannin with the aim of optimizing the production process [14]. Along with the advantages of the method, the study showed that physical activation using CO2 has some disadvantages. One of the main drawbacks is the lower specific surface area with a narrower range of pore sizes in Mimosa tannin compared to the chemical activation method. This observation could potentially be associated with the relatively low reactivity of CO2 towards the oxidation of inorganic components in the raw material, particularly when compared to the efficacy of KOH [15,16]. Therefore, there is a need to search for cheap and widely available biomass with the most suitable chemical composition and morphological characteristics for activation using CO2.
If, in the case of chemical activation, the opening of pores occurs due to the interaction of chemical reagents with disorganized carbon and an inorganic structure, then, in the case of activation via CO2, the physical expansion of the pores occurs with their further expansion in diameter [17]. This interaction occurs due to the chemical reaction of AC active atoms with the activation gas, which leads to the formation or expansion of pores [18,19,20]. All these processes require a full understanding of the influence of activation methods on the final physicochemical characteristics of the resulting material in order to achieve the expected effect in the application.
In this study, the activation of two different biomass materials was conducted using KOH and CO2, with particular attention to the thermal carbonization process of the starting materials. The influence of activation methods on the final product characteristics was also investigated. The influence of activation methods on the final product characteristics was also investigated. The effectiveness of these products for use as active materials for supercapacitor electrodes was studied. Based on a comprehensive review of the numerous experimental data sets on activated carbons (as detailed in Table S1, Figure 1), walnut shells (WS) were chosen as the study object, and rice husks (RH) as an alternative. Also, a comparison table of the electrochemical performance of the electrodes of this present work and a previous study is presented in Table S2.
The activated carbons obtained from selected materials showed good results in porosity, high specific surface, and mechanical and chemical stability. Both have high contents of cellulose and hemicellulose. It is also important to note that rice husks contain high amounts of lignin and silicates [21,22,23]. The obtained activated carbons were subjected to comprehensive characterization employing elemental analysis (EA), Brunauer–Emmett–Teller analysis (BET), X–ray diffraction (XRD), Fourier–transform infrared spectroscopy (FT–IR), and differential scanning calorimetry–thermogravimetry (DSC–TG). The outcomes of these analytical techniques were systematically utilized to elucidate the impact of various activation procedures and biomass on the electrochemical properties within an aqueous electrolyte solution (1 M H2SO4) in the context of supercapacitors (SCs). The activated carbons thus obtained were employed as the active electrode materials.

2. Materials and Methods

2.1. Materials

RH and WS are commercially available waste from a local farm. KOH, carbon black, PTFE (60 wt.% suspension in water), and 1 M H2SO4 aqueous solution were all purchased from Sigma Aldrich and used as received.

2.2. Synthesis

2.2.1. Chemical Activation

The carbonization process takes place at a temperature of 550 °C for 120 min with a linear heating rate of 5 K min−1 in an inert atmosphere with an N2 gas flow rate of 150 cm3 min−1. For chemical activation, carbonized materials are mixed with potassium hydroxide powder in a mass ratio of 1:4. Chemical activation occurs at a temperature of 850 °C for 90 min with a heating rate of 5 °C min−1 in an inert atmosphere with an Ar gas flow rate of 250 cm3 min−1. After activation, the obtained samples are washed with distilled water until the pH is normalized. Then, the samples are dried in an oven at 120 °C for 12 h.

2.2.2. Physical Activation

The carbonization process takes place at a temperature of 550 °C for 120 min with a heating rate of 5 K min−1 in an inert atmosphere with an N2 gas flow rate of 150 cm3 min−1.
Physical activation was carried out at a temperature of 900 °C with a heating rate of 5 K min−1 in an inert atmosphere with an N2 gas flow rate of 100 cm3 min−1. After reaching the temperature, N2 was switched to CO2 at a flow rate of 50 cm3 min−1 and held for 30 to 120 min. The CO2 was then switched back to N2, and the samples were allowed to cool to room temperature. Theoretical principles and processes of chemical and physical activations are schematically represented in Figure 2.

2.3. Electrode Fabrication and Electrochemical Measurements

The investigated carbon material was mixed with carbon black and PTFE (60 wt% suspension in water) to prepare a paste in a weight ratio of 85:5:10, respectively. Disk−shaped electrodes (5 mm in diameter) were cut out from this paste. These electrodes were impregnated with a 1 M H2SO4 solution, which served as an aqueous electrolyte, and then placed for testing in a two–electrode cell with gold current collectors. SC cells were assembled using two electrodes of identical material and mass and separated using a porous glass fiber mat. Electrochemical characterization was performed on a VSP–300 electrochemical workstation (Biologic). Cyclic voltammetry (CV) curves were obtained within a potential window of 1 V. Galvanostatic charge–discharge (GCD) tests were performed with the specifically applied current (I) varying from 1 to 35 A g−1, and the impedance was studied in the frequency range of 100 kHz–10 mHz with a potential amplitude of 5 mV. Specific capacitances were calculated from GCD curves using the following equation:
C = 4 I Δ t m Δ V
where C (F g−1) is the specific capacitance; I (A) is the discharge current; ∆t (s) is the discharge time; ∆V (V) is the potential window; m (mg) is the total mass of two electrodes.
Specific capacitance from CV curve was calculated using the following equation:
C = 2 m ν ( V b V a ) V a V b I d V
where C (F g−1) is the specific capacitance; m (mg) is the total mass of two electrodes; v (mV s−1) is the scan rate; I (A) is the discharge current; Vb and Va are high and low limits of the CV test [24].

2.4. Characterization of Obtained Samples

Various types of biomasses were investigated using differential scanning calorimetry (DSC) and thermo–gravimetry (TG) methods on a RIGAKU TG 8120 instrument, operating within a temperature range from −180 to +725 °C (with an accuracy of ±0.05 °C) at a heating rate of 0.1–25 K min−1. The heating rate in the experiment was 5 K min−1, and the studies were carried out under N2 gas with a flow rate of 100 cm3 min−1. Samples were placed in ceramic crucibles with vertical loading. Raman spectroscopy studies were carried out on the Raman spectrometer NTEGRA SPECTRA™ (NT–MDT Spectrum) equipped with solid–state laser at the excitation wavelength of 473 nm. XRD spectra were recorded with X–ray diffractometer (Drone–8, LOMO), using CuKa radiation (k = 0.15418 nm). The AC surface was studied with scanning electron microscope (Quanta 3D 200i Dual System). The surface morphology of the activated carbons was examined using a JEOL scanning electron microscope (model JSM–6490LA) with an accelerating voltage ranging from 0.1 to 30 kV. The probe diameter was up to 3.0 nm, and magnification ranged from ×5 to ×300,000, following standard methodology. Elemental analysis of the resulting carbon structure was performed using energy–dispersive X–ray analysis (EDX) on a JSM–6490LA instrument, which is a scanning electron microscope equipped with an embedded energy–dispersive X–ray analyzer. To determine the specific surface area of activated carbon obtained using physical and chemical activation methods, nitrogen adsorption–desorption was measured at 77 K on a gas sorption analyzer SORBTOMETER m (KATAKON). Secondary vacuum outgassing at 110 °C was carried out before adsorption analysis.

3. Results and Discussion

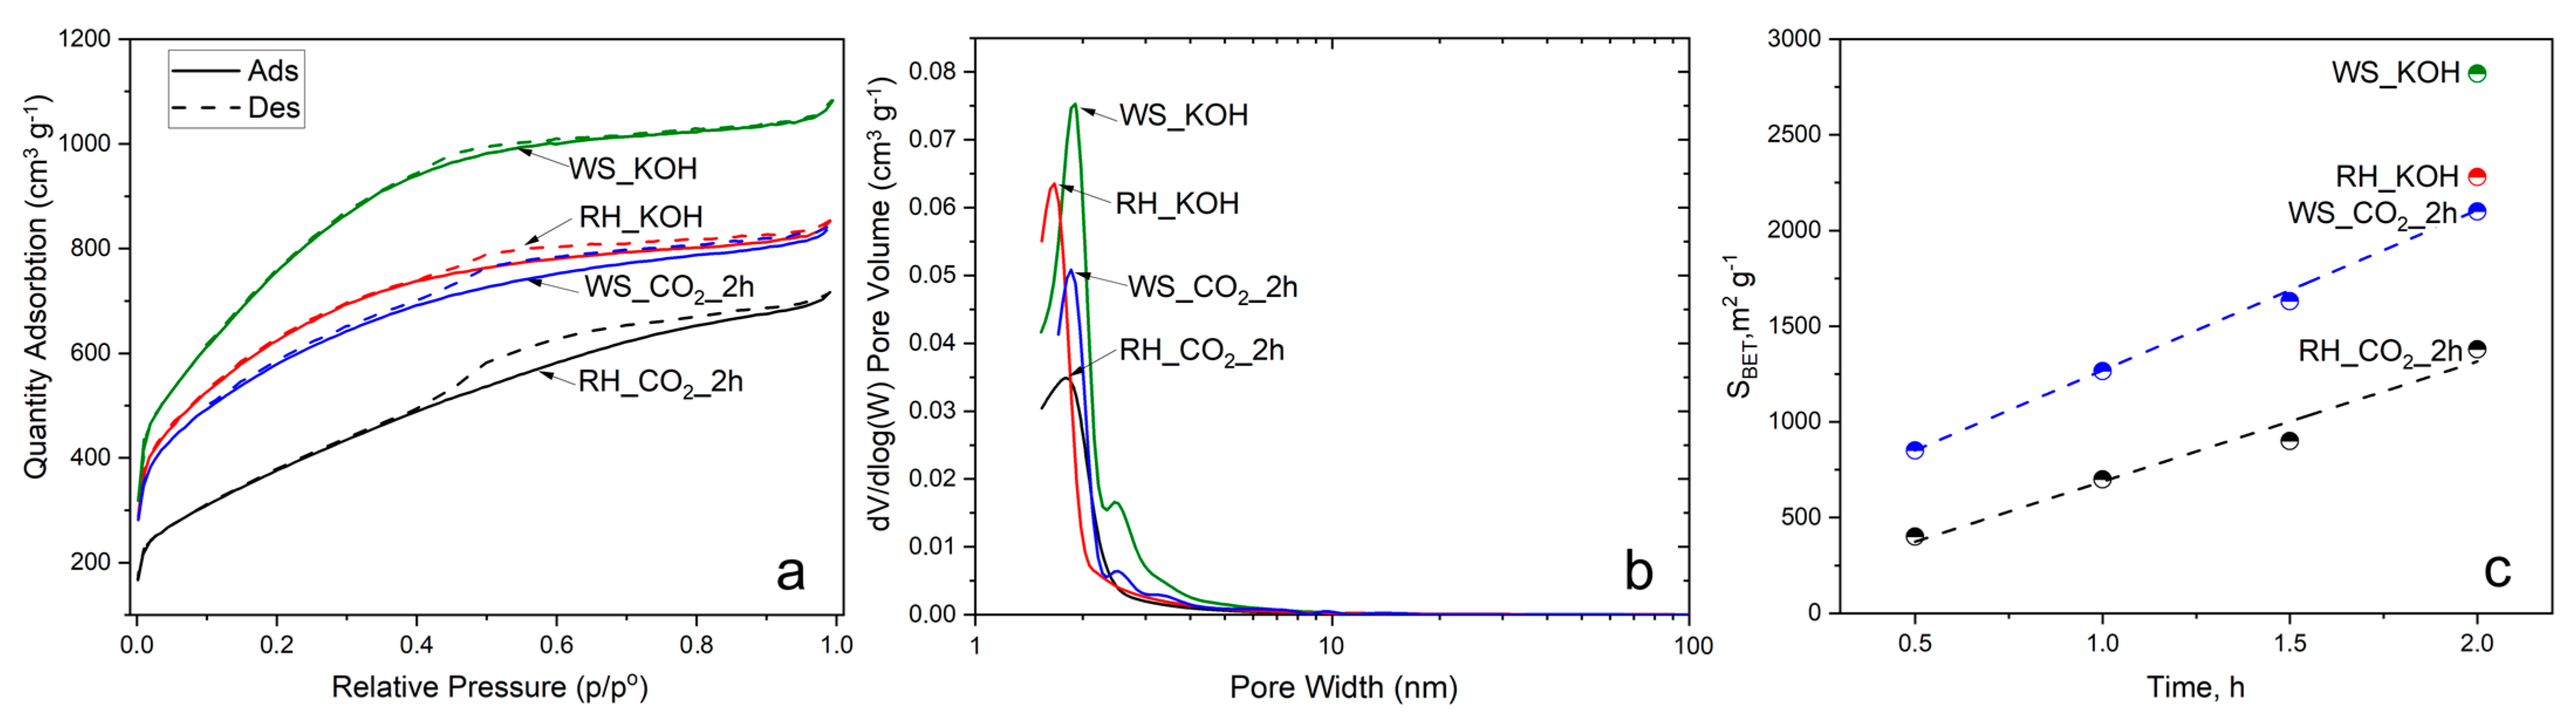
3.1. Morphology and Textural Properties

Figure 3a shows the N2 adsorption–desorption isotherms for RH and WS samples treated with KOH and CO2. All isotherms have a characteristic combination of type I and IV features that are characteristic of micromesoporous materials. An increase in gas absorption is observed at relatively low pressures (p/p0 < 0.2). This indicates a developed microporous structure with an increase in the pore radius for all samples. This is also consistent with Figure 3b, which shows the pore size distribution and confirms the assumption of developed microporosity.
The results make it possible to compare how the impact of different activations affects the porous structure of the final product. The activation of KOH promotes more intensive development and expansion of microporosity. On the other hand, activation with carbon dioxide (CO2) is expected to have a greater effect on expanding the existing microporous structure. This phenomenon is also confirmed via pore size analysis. At higher relative pressures (p/p0 > 0.5), we observe characteristic H2a hysteresis loops associated with the mesoporous structure. This is especially observed in the case of samples RH_KOH and RH_CO2_2h. These results suggest that carbon dioxide (CO2) activation promotes the development of a mesoporous structure.

3.2. Chemical Characterization

Figure 4 shows the identification of the D, G, and 2D (G’) bands, which are characteristic of the Raman spectra of most carbon–based materials [25]. In all samples, the D–band is located in the range of 1300–1350 cm−1, which is associated with defectiveness and disorganization. The high intensity may be due to an activation process that introduces defects. The G–band is located around 1580–1600 cm−1 and indicates the presence of graphitic carbon (sp2) and crystallinity. An analysis of the 2D stripe can provide additional information about the layered structure of the material [26].
From the spectra provided, it can be seen that the KOH–treated samples have a moderate D/G ratio, indicating a balanced presence of both disorganized and graphitic carbon. This assumes that the content of amorphous carbon is equivalent to that of rhythmic carbon in the structure of the obtained materials. As a result, it is concluded that the resulting AC has a significant degree of disorganization with point and line defects, possibly due to the activation process with an aggressive reagent. The G band in the RH–KOH pattern is the lowest to the D band. The presence of a G–band may indicate the presence of graphitic carbon but not the total content of graphite. Samples treated with CO2 have a low D/G ratio and are indicative of a graphitic carbon content relatively higher than that of the sample after KOH treatment. The Raman spectrum and peak ratios together indicate that the AC obtained from the WS via the physical activation of CO2 has the most graphitized structure. Samples activated with CO2 have a ratio of G/2D peaks RH = 0.45 and WS = 0.49, which indicates that the AC contains a few–layer graphene structure. In the case of samples of activated KOH, samples RH = 0.52 and WS = 055, which indicate a multilayer structure of the material.
Figure 4b shows a detailed X–ray diffraction pattern of the resulting AC. The X–ray pattern clearly demonstrates the characteristic amorphous nature of all samples. Broad peaks of low intensity are distinguishable at low values of 2θ, especially around 20° and 30°. These features highlight the disordered structure of AC, which is a hallmark of its large surface area and adsorption capacity.
Samples after chemical activation are observed to contain small amounts of Fe3O4 (magnetite) [27], elemental iron (Fe), and iron nitride (FeN0.0324) [28,29], which were formed on the surface of coals as a result of carbonization in a steel reactor. On a sample obtained from RH, we observed the appearance of well–defined peaks at 2θ values around 30°, 35°, 57° and 63°. These peaks are uniquely associated with the presence of Fe3O4, also known as magnetite. Both samples obtained via KOH treatment show a peak at 45°, which indicates the crystallographic characteristics of the elemental iron present on the surface of the coals. Also, the peak of FeN0.0324 at 2θ values of about 43° for the sample obtained based on WS during chemical activation was distinguished. Figure 3b shows well–defined intense graphite peaks for all samples at 26°. This characteristic feature confirms the presence of a graphitized structure of the obtained AC and is consistent with the results of Raman spectroscopy.
Figure 5 presents the mass loss, heat release, and heat flow curves during the thermolysis of RH and WS under nitrogen gas flow at a 5 K min−1 heating rate. In the 100–150 °C range, RH and WS undergo dehydration characterized by the loss of physically bound water in the composition, leading to an approximate loss of 5.1 and 5.6% of mass, respectively.
This is followed by the active pyrolysis process with intense mass loss in the temperature range of ~150–500 °C, where the primary thermal decomposition of volatile organic compounds occurs. The sequential decomposition of hemicellulose (WS–300 °C; in the case of RH, there is no distinctly pronounced peak for determining the temperature of complete decomposition), cellulose (about 390–400 °C for both samples), and lignin compounds (about 450–460 °C for both samples) can be observed.
In assessing the decomposition of RH and WS, parameters such as heat absorption and heat release were calculated based on the integration of the internal area of endothermic and exothermic peaks. Figure 5c shows that almost an equal amount of energy, around 23–25 J g−1, was expended for the decomposition of RH and WS. However, during the exothermic reaction associated with the decomposition of volatile organic products, more energy is released via RH (16.9 J g−1) than WS (8.1 J g−1). This could be attributed to the absence of intermediate products in the composition of volatile gases that do not consume energy.

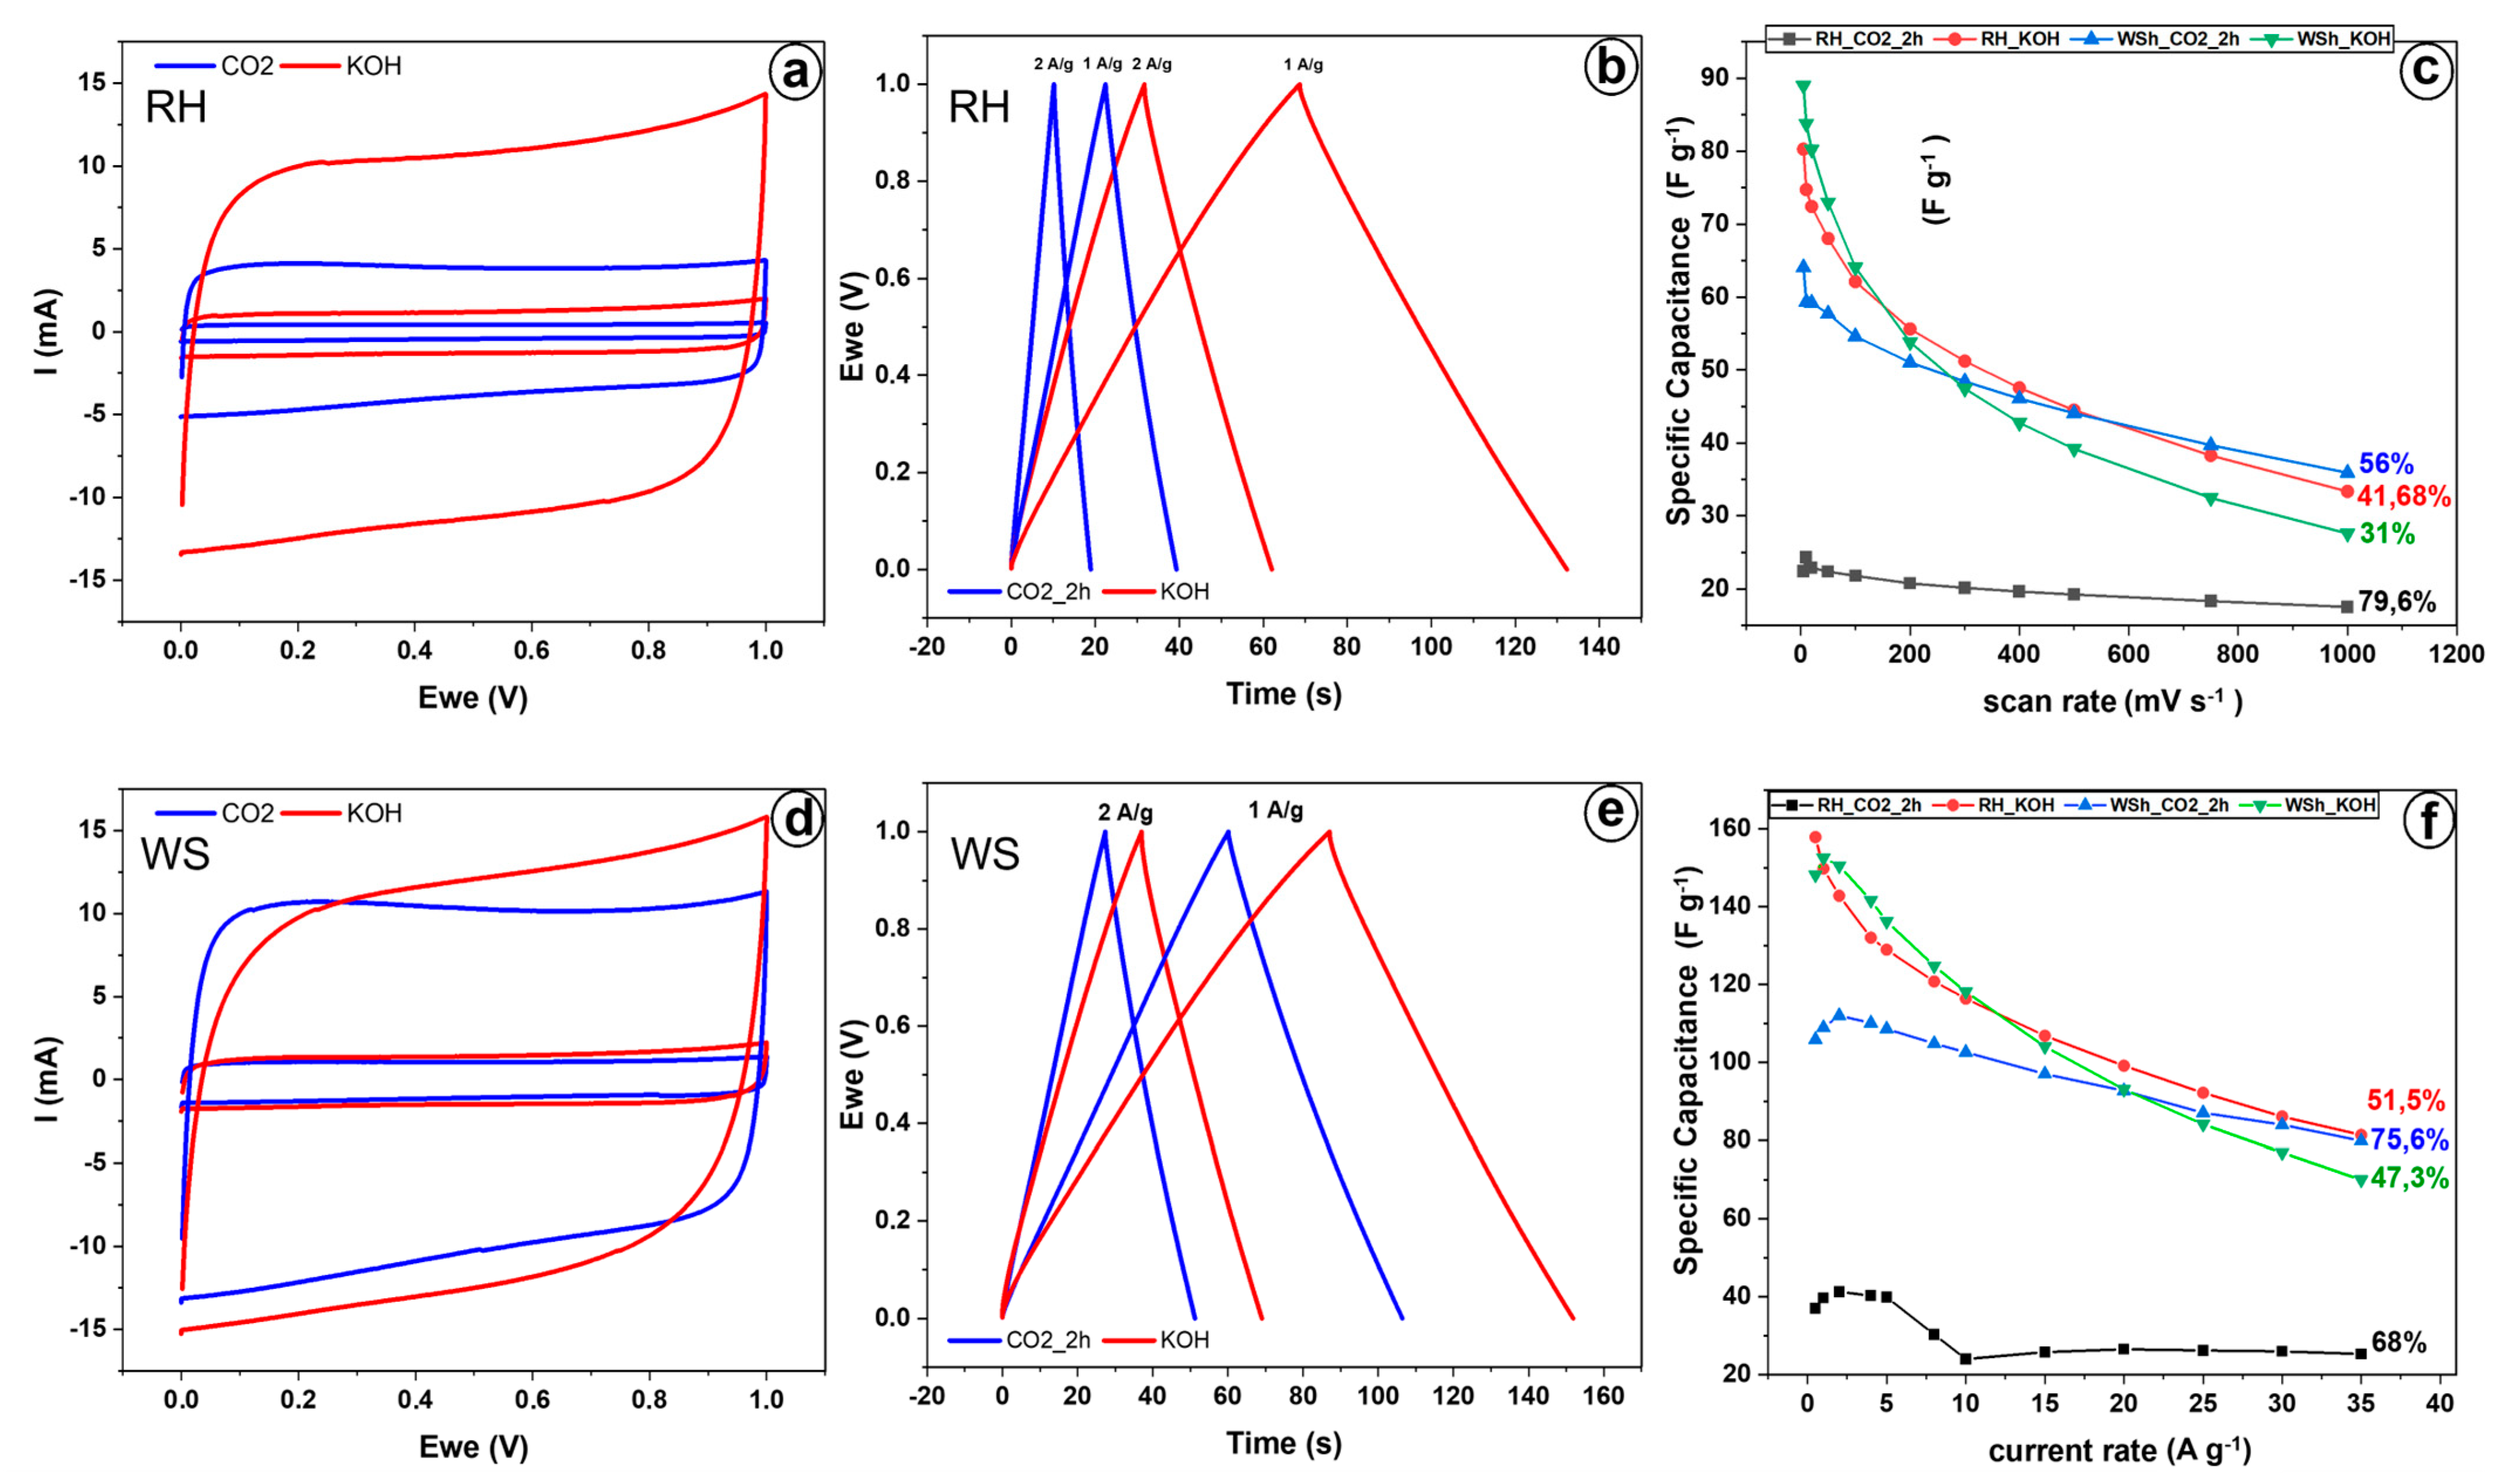
3.3. Electrochemical Characterization

Figure 6 illustrates the electrochemical characteristics of AC derived from RH and WS, activated chemically via KOH and physically via CO2. Cyclic voltammetry (CV) tests on RH–AC and WS–AC materials were conducted at scan rates ranging from 5 to 500 mV s−1 (refer to Supplementary Materials). In Figure 6a,d, CV curves acquired at 10 and 100 mV s−1 present a near–rectangular shape, indicative of electric double–layer capacitor behavior, with no peaks for Faradaic reactions observed.
Figure 6a demonstrates that at a low scan rate of 10 mV s−1, RH_KOH and RH_CO2_2h reach high specific cell capacitances of 74.7 and 24.3 F g−1, respectively. It is also noteworthy that at all scan rates between 5 and 500 mV s−1, the cell capacitance of RH_KOH is significantly higher than that of RH_CO2_2h (Figure 6c). However, as the scan rate escalates, the specific capacitance for RH_KOH decreases substantially, maintaining only 41.68% of its initial capacitance. In contrast, RH_CO2_2h witnesses a relatively minor decrease, with about 80% capacity retention when the scan rate is amplified from 5 to 500 mV s−1, indicating easy accessibility of the pore network for electrolyte penetration and superior charge transfer.
Galvanostatic charge–discharge (GCD) tests were performed with the specifically applied current (I) varying from 1 to 35 A g−1 (see Supplementary Materials); Figure 6b exhibits curves obtained at 1 and 2 A g−1. These curves are triangular, suggesting SC behavior. Cell capacitance was calculated from the discharge curve and is depicted in Figure 6c as a function of I. RH_KOH consistently outperformed RH_CO2_2h, validating the CV results. At 1 A g−1, specific capacitance reached peak values of 150 F g−1 for RH_KOH (with an energy density of 5.2 Wh kg−1 at a power density of 300 W kg−1) and 40 F g−1 for RH_CO2_2h (with an energy density of 1.4 Wh kg−1 at a power density of 300 W kg−1). As I rose, the capacitance decreased, showcasing capacitance retentions of 51.5 and 68% for RH_KOH (with an energy density of 2.82 Wh kg−1 at a power density of 10.3 kW kg−1) and RH_CO2_2h (with an energy density of 0.9 Wh kg−1 at a power density of 10.3 kW kg−1), respectively (refer to Figure 6f again).
In the case of the walnut shell–derived electrodes, at low scan rates and charge–discharge currents (see Figure 6d,e), the specific capacitance of the KOH–activated electrode (WS_KOH) is higher than the capacitance of the CO2–activated electrode (WS_CO2_2h), indicating 74.7 F g−1 and 59 F g−1 at 10 mV s−1, 152 F g−1 (with an energy density of 5.3 Wh kg−1 at a power density of 300 W kg−1) and 109 F g−1 (with an energy density of 3.9 Wh kg−1 at a power density of 300 W kg−1) at 1 A g−1, respectively.
RH_KOH and WS_KOH electrodes showed higher specific capacitances and energy densities because chemical activation yields more specific surface area than physical activation, as seen in Figure 3c. At low scanning and charge–discharge currents, an increasing number of electrode active material pores interact with the electrolyte and contribute to the charge accumulation process.
However, as the scan rate and charge–discharge current increase, the specific capacitance of the WS_KOH electrode plummets swiftly compared to the WS_CO2_2h electrode, reaching similar values at 200 mV s−1 and 20 A g−1. When the scan rate is amplified to 1000 mV s−1, WS_CO2_2h retains 56% of its maximum capacity, while WS_KOH maintains only 31%. With a surge in the charge–discharge current to 35 A g−1, the capacity retention for WS_KOH is 47.3% (with an energy density of 2.43 Wh kg−1 at a power density of 10.3 kW kg−1), and for WS_CO2_2h is 75.6% (with an energy density of 2.77 Wh kg−1 at a power density of 10.3 kW kg−1). As can be seen, the rate capability of WS_CO2_2h surpasses that of WS_KOH, signaling easy accessibility of the pore network for electrolyte penetration and superior charge transfer in the WS_CO2_2h electrode structure.
In a general comparison of the samples (Figure 6c,f), it is obvious that the specific capacity (as well as the specific surface area) of the RH_CO2_2h electrode is the lowest at all scanning rates and charge–discharge currents, while the electrodes (WS_KOH and RH_KOH) activated using potassium hydroxide exhibit the highest specific capacity (as well as specific surface area). Contrary to rice husk, the characteristics of WS_CO2_2h do not lag significantly behind WS_KOH.
We associate these features with the initial composition of the bio–precursors of rice husk and walnut shell. For instance, the composition of rice husk contains an estimated 15–25% silicon dioxide and other inorganic compounds [30,31,32], while the ash content in walnut shells averages 0.1–3.4% [33,34,35]. Given that 25% of the rice husk composition consists of inorganic components that are less susceptible to the effect of CO2, the formation of new (meso and micro) pores does not take place, ultimately leading to significantly lower specific surface area and electrochemical characteristics of RH_CO2_2h. In the sample treated with potassium hydroxide, the ash and silicon present in the raw material are completely washed away, thereby increasing the total specific surface area and, consequently, improving the electrochemical characteristics of RH_KOH.
The composition of the walnut shell does not contain silicon, and ash is present in small quantities. Hence, the specific surface area and, accordingly, the electrochemical characteristics of the electrodes WS_CO2_2h and WS_KOH differ slightly, and differences in rate capabilities are related to the peculiarity of the distribution of micropores and only occur at low scanning rates.
The Coulombic efficiency of all materials is nearly 100%, implying excellent electrical conductivity of these electrodes, and no side electrochemical reactions were observed.
The Ragone plot is depicted in Figure 7a, showing the energy and power densities of the electrodes. The highest energy density of 6 Wh/kg at the power density of 59 W/kg demonstrated RH_KOH electrode. At the same power density, the RH_CO2_2h electrode indicated 1 Wh/kg, whereas the WS_KOH and WS_CO2_2h electrodes showed 4.5 and 2.9 Wh/kg, respectively. Figure 7b provides the results of cycling stability tests conducted by charging/discharging in the potential range of 0–0.9 V at a constant current density of 2 A/g. The specific capacitances of all samples decrease slightly after 2000 cycles and maintain over 97% of initial meaning during another 2000 cycles of charging and discharging.
Electrochemical impedance spectroscopy (EIS) tests were conducted to investigate the resistive behavior of the materials. The EIS curves of the electrodes were fitted according to the Randle circuit (shown in the inset of Figure 8a) in EC–Lab software provided by BioLogic. The CPE is a constant phase element representing the capacitance of a double layer, and W corresponds to Warburg diffusion [36,37]. Figure 8 depicts the Nyquist and Bode plots derived from the EIS tests. In Figure 8a, it can be observed that both samples, RH_KOH and RH_CO2_2h, have roughly the same contact resistance value (Rs~0.3 Ohm), likely due to the consistent method of electrode construction (active material, electrolyte, separator). However, the magnitude of charge transfer resistance (Rct), represented by the diameter of the semicircle, of the RH_CO2_2h (Rct~0.6 Ohm) is several times larger than that of the RH_KOH (Rct~0.15 Ohm), leading to slower kinetics of charge transfer. This can also be corroborated by comparing relaxation times (see Figure 8b,c): 266 ms for the CO2–activated sample and 863 ms for the KOH–activated sample. Interestingly, the tail of the spectra in the case of RH_CO2_2h (phase angle is 85 degrees, Figure 8b) is steeper, and the diffusion–controlled process is less dominant than that of RH_KOH (phase angle is 82 degrees, Figure 8c). This indicates improved ion diffusion and a better surface area and porosity structure design.
Like RH, WS_CO2_2h and WS_KOH samples exhibit nearly identical contact resistances (Rs~0.36 Ohm). However, the charge transfer resistance of the electrode material derived from the CO2–activation process (Rct~0.1 Ohm) is smaller than that derived from the KOH–activation process (Rct~0.24 Ohm). Although both electrodes have dominant diffusion–controlled processes in the low–frequency region, ion diffusion is faster in WS_CO2_2h (relaxation time is 583 ms, Figure 8e) than in WS_KOH (relaxation time is 1277 ms, Figure 8f).
Electrochemical tests have demonstrated a clear correlation between the porous structure and the specific capacitance of the obtained electrodes. The WS_KOH sample, with its predominantly microporous structure, showed a higher specific capacitance and energy density than the other samples. These results underline the critical role of microporous structures for specific capacitance since a large surface area affects the increase in the degree of adsorption of ions from the electrolyte.
Nevertheless, at higher scanning rates (from about 200 mVs−1), the values of the specific capacitance became equal for the samples WS_KOH, WS_CO2_2h, and RH_KOH due to a decrease in the diffusion activity of ions and the permeability in micropores for the RH_KOH and WS–KOH samples. Since at faster scanning rates, mesopores serve as the main storage of ions, which are well formed in the WS_CO2_2h sample after physical activation, demonstrating the best power density.
The RH_CO2_2h sample has a low specific capacity, which is also consistent with the results of BET analysis, which is associated with a high ash content of the feedstock and the presence of other inorganic elements in the composition that do not react with the activation gas and do not contribute to the additional formation of micro– and mesoporous structures. Therefore, the importance of selecting raw materials with a certain chemical composition is a priority for effective physical activation with CO2.

4. Conclusions

This study shows that via a careful analysis of different biomass sources and activation methodology, it is possible to produce AC with the desired characteristics for energy storage systems. Physical activation with carbon dioxide (CO2) has been proven to be a potentially safer, more economical, and environmentally friendly method. It should be noted that samples activated with CO2 have a lower specific surface area due to the low number of micropores compared to samples activated with KOH. Nevertheless, the potential for use in supercapacitors is very high since mesopores are predominantly referred to as the main charge storage reservoir.
A relationship has been established between activation methods and initial material characteristics. AC samples produced by KOH have problems with pore bridging and diffusion at higher charge–discharge rates. On the other hand, CO2–activated materials showed better rate capabilities, which is due to their unique mesopore network connectivity and improved surface morphology.
It should also be emphasized that when applying physical activation with CO2, the specific properties of the biomass precursors, such as chemical composition and morphology, are of decisive importance. In conclusion, this study provides valuable insights into the development and production of high–performance electrode materials for supercapacitors based on a comparison of two top–performing biomasses using an environmentally friendly and cost–effective activation method.

Supplementary Materials

The following supporting information can be downloaded at: https://www.mdpi.com/article/10.3390/jcs7100444/s1, Figure S1: Comparison of all results on specific capacitance by scan and current rate; Table S1: References considered in Figure 1; Table S2: Comparison of the electrochemical performance of the electrodes of the present work and previous.

Author Contributions

All authors contributed to the study conception and design. Material preparation, data collection, and analysis were performed by A.T., A.A., M.A., M.Y., C.D., K.A., B.K., Z.M., J.C.-G., A.C., V.F. and T.A. The first draft of the manuscript was written by T.A., and all authors commented on previous versions of the manuscript. All authors have read and agreed to the published version of the manuscript.

Funding

This study is funded by the Science Committee of the Ministry of Science and Higher Education of the Republic of Kazakhstan (grant. No. AP09057909).

Data Availability Statement

The data presented in this study are available within the article.

Conflicts of Interest

The authors declare no conflict of interest.

References

  1. Zhao, C.; Ge, L.; Zuo, M.; Mai, L.; Chen, S.; Li, X.; Li, Q.; Wang, Y.; Xu, C. Study on the Mechanical Strength and Iodine Adsorption Behavior of Coal-Based Activated Carbon Based on Orthogonal Experiments. Energy 2023, 282, 128450. [Google Scholar] [CrossRef]
  2. Jacobs, J.H.; Chou, N.; Lesage, K.L.; Xiao, Y.; Hill, J.M.; Marriott, R.A. Investigating Activated Carbons for SO2 Adsorption in Wet Flue Gas. Fuel 2023, 353, 129239. [Google Scholar] [CrossRef]
  3. Lee, J.H.; Kang, Y.-M.; Roh, K.C. Enhancing Gravimetric and Volumetric Capacitance in Supercapacitors with Nanostructured Partially Graphitic Activated Carbon. Electrochem. Commun. 2023, 154, 107560. [Google Scholar] [CrossRef]
  4. Erdogan, F.O.; Celik, C.; Turkmen, A.C.; Sadak, A.E.; Cücü, E. Hydrogen Storage Behavior of Zeolite/Graphene, Zeolite/Multiwalled Carbon Nanotube and Zeolite/Green Plum Stones-Based Activated Carbon Composites. J. Energy Storage 2023, 72, 108471. [Google Scholar] [CrossRef]
  5. Kuspanov, Z.; Bakbolat, B.; Baimenov, A.; Issadykov, A.; Yeleuov, M.; Daulbayev, C. Photocatalysts for a sustainable future: Innovations in large-scale environmental and energy applications. Sci. Total Environ 2023, 885, 163914. [Google Scholar] [CrossRef] [PubMed]
  6. Ilyin, Y.V.; Kudaibergenov, K.K.; Sharipkhanov, S.D.; Mansurov, Z.A.; Zhaulybayev, A.A.; Atamanov, M.K. Surface Modifications of CuO Doped Carbonaceous Nanosorbents and Their CO2 Sorption Properties. Eurasian Chem.-Technol. J. 2023, 25, 33–38. [Google Scholar] [CrossRef]
  7. Atamanov, M.K.; Amrousse, R.; Hori, K.; Kolesnikov, B.Y.; Mansurov, Z.A. Influence of Activated Carbon on the Thermal Decomposition of Hydroxylammonium Nitrate. Combust. Explos. Shock Waves 2018, 54, 316–324. [Google Scholar] [CrossRef]
  8. Hermawan, A.; Destyorini, F.; Hardiansyah, A.; Alviani, V.N.; Mayangsari, W.; Wibisono; Septiani, N.L.W.; Yudianti, R.; Yuliarto, B. High Energy Density Asymmetric Supercapacitors Enabled by La-Induced Defective MnO2 and Biomass-Derived Activated Carbon. Mater. Lett. 2023, 351, 135031. [Google Scholar] [CrossRef]
  9. Cui, X.; Jiang, Y.; He, Z.; Liu, Z.; Yang, X.; Wan, J.; Liu, Y.; Ma, F. Preparation of Tank-like Resin-Derived Porous Carbon Sphere for Supercapacitor: The Influence of KOH Activator and Activation Temperature on Structure and Performance. Diam. Relat. Mater. 2023, 136, 110054. [Google Scholar] [CrossRef]
  10. Bkangmo Kontchouo, F.M.; Jiang, Y.; Liang, J.; Fan, M.; Shao, Y.; Zhang, L.; Zhang, S.; Hu, X. Activation of Biomass (Cola Nut Shell) with KOH and K2C2O4: The Distinct Influence on Evolution of Volatiles and Pore Structures of Activated Carbon. J. Energy Inst. 2023, 109, 101288. [Google Scholar] [CrossRef]
  11. Alharbi, H.A.; Hameed, B.H.; Alotaibi, K.D.; Al-Oud, S.S.; Al-Modaihsh, A.S. Recent Methods in the Production of Activated Carbon from Date Palm Residues for the Adsorption of Textile Dyes: A Review. Front. Environ. Sci. 2022, 10, 996953. [Google Scholar] [CrossRef]
  12. Zhang, X.; Ge, Y.; Zhu, G.; Tang, J.; Xing, X.; Li, N. Effect of Acid and Hydrothermal Treatments on the Multilayer Adsorption of Cr(VI) and Dyes on Biomass-Derived Nano/Mesoporous Carbon. JMR 2019, 34, 3020–3029. [Google Scholar] [CrossRef]
  13. Quan, G.; Wang, H.; Zhu, F.; Yan, J. Porous Biomass Carbon Coated with SiO2 as High Performance Electrodes for Capacitive Deionization. Bio. Resources 2018, 13, 437–449. [Google Scholar] [CrossRef]
  14. Goel, C.; Mohan, S.; Dinesha, P. CO2 Capture by Adsorption on Biomass-Derived Activated Char: A Review. Sci. Total Environ. 2021, 798, 149296. [Google Scholar] [CrossRef] [PubMed]
  15. Castro-Gutiérrez, J.; Canevesi, R.L.S.; Emo, M.; Izquierdo, M.T.; Celzard, A.; Fierro, V. CO2 Outperforms KOH as an Activator for High-Rate Supercapacitors in Aqueous Electrolyte. Renew. Sust. Energ. Rev. 2022, 167, 112716. [Google Scholar] [CrossRef]
  16. Soares Rodrigues, C.I.; Jackson, J.J.; Montross, M.D. A Molar Basis Comparison of Calcium Hydroxide, Sodium Hydroxide, and Potassium Hydroxide on the Pretreatment of Switchgrass and Miscanthus under High Solids Conditions. Ind. Crops Prod. 2016, 92, 165–173. [Google Scholar] [CrossRef]
  17. Guo, F.; Peng, K.; Liang, S.; Jia, X.; Jiang, X.; Qian, L. Evaluation of the Catalytic Performance of Different Activated Biochar Catalysts for Removal of Tar from Biomass Pyrolysis. Fuel 2019, 258, 116204. [Google Scholar] [CrossRef]
  18. Qiu, W.; Dou, K.; Zhou, Y.; Huang, H.; Chen, Y.; Lu, H. Hierarchical Pore Structure of Activated Carbon Fabricated by CO2/Microwave for Volatile Organic Compounds Adsorption. Chin. J. Chem. Eng. 2018, 26, 81–88. [Google Scholar] [CrossRef]
  19. Okayama, R.; Amano, Y.; Machida, M. Effect of Nitrogen Species on an Activated Carbon Surface on the Adsorption of Cu(II) Ions from Aqueous Solution. Carbon 2010, 10, 3000. [Google Scholar] [CrossRef]
  20. Guo, S.; Peng, J.; Li, W.; Yang, K.; Zhang, L.; Zhang, S.; Xia, H. Effects of CO2 Activation on Porous Structures of Coconut Shell-Based Activated Carbons. Appl. Surf. Sci. 2009, 255, 8443–8449. [Google Scholar] [CrossRef]
  21. Serafin, J.; Dziejarski, B.; Cruz Junior, O.F.; Sreńscek-Nazzal, J. Design of Highly Microporous Activated Carbons Based on Walnut Shell Biomass for H2 and CO2 Storage. Carbon 2023, 201, 633–647. [Google Scholar] [CrossRef]
  22. Yang, X.; Xie, D.; Wang, W.; Li, S.; Tang, Z.; Dai, S. An Activated Carbon from Walnut Shell for Dynamic Capture of High Concentration Gaseous Iodine. J. Chem. Eng. 2023, 454, 140365. [Google Scholar] [CrossRef]
  23. Chen, J.; Liu, J.; Wu, D.; Bai, X.; Lin, Y.; Wu, T.; Zhang, C.; Chen, D.; Li, H. Improving the Supercapacitor Performance of Activated Carbon Materials Derived from Pretreated Rice Husk. J. Energy Storage 2021, 44, 103432. [Google Scholar] [CrossRef]
  24. Zhang, Z.J.; Xie, D.H.; Cui, P.; Chen, X.Y. Conversion of a zinc salicylate complex into porous carbons through a template carbonization process as a superior electrode material for supercapacitors. RSC Adv. 2014, 4, 6664–6671. [Google Scholar] [CrossRef]
  25. Ferrari, A.C.; Meyer, J.C.; Scardaci, V.; Casiraghi, C.; Lazzeri, M.; Mauri, F.; Piscanec, S.; Jiang, D.; Novoselov, K.S.; Roth, S.; et al. Raman Spectrum of Graphene and Graphene Layers. Phys. Rev. Lett. 2006, 97, 187401. [Google Scholar] [CrossRef] [PubMed]
  26. Memon, N.K.; Tse, S.D.; Al-Sharab, J.F.; Yamaguchi, H.; Goncalves, A.-M.B.; Kear, B.H.; Jaluria, Y.; Andrei, E.Y.; Chhowalla, M. Flame Synthesis of Graphene Films in Open Environments. Carbon 2011, 49, 5064–5070. [Google Scholar] [CrossRef]
  27. Wu, W.; Zhu, Z.; Liu, Z.; Xie, Y.; Zhang, J.; Hu, T. Preparation of Carbon-Encapsulated Iron Carbide Nanoparticles by an Explosion Method. Carbon 2003, 41, 317–321. [Google Scholar] [CrossRef]
  28. de Oliveira Pereira, L.; Marques Sales, I.; Pereira Zampiere, L.; Silveira Vieira, S.; do Rosário Guimarães, I.; Magalhães, F. Preparation of Magnetic Photocatalysts from TiO2, Activated Carbon and Iron Nitrate for Environmental Remediation. J. Photochem. Photobiol. A Chem. 2019, 382, 111907. [Google Scholar] [CrossRef]
  29. Pandey, A.P.; Shaz, M.A.; Sekkar, V.; Tiwari, R.S. Synergistic Effect of CNT Bridge Formation and Spillover Mechanism on Enhanced Hydrogen Storage by Iron Doped Carbon Aerogel. Int. J. Hydrogen Energy 2023, 48, 21395–21403. [Google Scholar] [CrossRef]
  30. Ketov, A.; Rudakova, L.; Vaisman, I.; Ketov, I.; Haritonovs, V.; Sahmenko, G. Recycling of Rice Husks Ash for the Preparation of Resistant, Lightweight and Environment-Friendly Fired Bricks. Constr. Build. Mater. 2021, 302, 124385. [Google Scholar] [CrossRef]
  31. Muthayya, S.; Sugimoto, J.D.; Montgomery, S.; Maberly, G.F. An Overview of Global Rice Production, Supply, Trade, and Consumption. Ann. N. Y. Acad. Sci. 2014, 1324, 7–14. [Google Scholar] [CrossRef] [PubMed]
  32. Askaruly, K.; Korobeinyk, A.V.; Azat, S.; Yeleuov, M.; Taurbekov, A.; Toshtay, K.; Tauanov, Z.; Su, X. The Electrochemical Behavior of Silica and Activated Carbon Materials Derived from the Rice Husk Waste for Li-Ion Cells. Diam. Relat. Mater. 2023, 133, 109759. [Google Scholar] [CrossRef]
  33. de Hoyos-Martínez, P.L.; Erdocia, X.; Charrier-El Bouhtoury, F.; Prado, R.; Labidi, J. Multistage Treatment of Almonds Waste Biomass: Characterization and Assessment of the Potential Applications of Raw Material and Products. Waste Manag. Res. 2018, 80, 40–50. [Google Scholar] [CrossRef]
  34. Jahanban-Esfahlan, A.; Amarowicz, R. Walnut (Juglans regia L.) Shell Pyroligneous Acid: Chemical Constituents and Functional Applications. RSC Adv. 2018, 8, 22376–22391. [Google Scholar] [CrossRef] [PubMed]
  35. Albatrni, H.; Qiblawey, H.; Al-Marri, M.J. Walnut Shell Based Adsorbents: A Review Study on Preparation, Mechanism, and Application. JWPE 2022, 45, 102527. [Google Scholar] [CrossRef]
  36. Conway, B.E.; Birss, V.; Wojtowicz, J. The role and utilization of pseudocapacitance for energy storage by supercapacitors. J. Power Sources 1997, 66, 0378–7753. [Google Scholar] [CrossRef]
  37. Prikhodko, N.; Yeleuov, M.; Abdisattar, A.; Askaruly, K.; Taurbekov, A.; Tolynbekov, A.; Rakhymzhan, N.; Daulbayev, C. Enhancing supercapacitor performance through graphene flame synthesis on nickel current collectors and active carbon material from plant biomass. J. Energy Storage 2023, 73, 108853. [Google Scholar] [CrossRef]
Figure 1. A comparison of the SBET and activating agents of the reported literature towards chemical activation of different biomass. The corresponding references are shown in Table S1.
Jcs 07 00444 g001
Figure 2. Theoretical (a) and practical (b) illustration of the preparation of AC based on different biomass and activation agents (chemical vs. physical).
Jcs 07 00444 g002
Figure 3. Nitrogen adsorption–desorption isotherms (a), differential PSDs (b), and specific surface area (c).
Jcs 07 00444 g003
Figure 4. Raman (a) XRD (b), SEM, and EDAX analysis of prepared AC samples.
Jcs 07 00444 g004
Figure 5. Thermal decomposition of WS and RH under nitrogen gas flow (100 cm3 L−1) at 5 K min−1 heating rate (a) TG analysis, (b) DSC analysis, and (c) heat release.
Jcs 07 00444 g005
Figure 6. Electrochemical performance of KOH–activated and CO2–activated AC derived from RH and WS. CV curves at 10 mV s−1 and 100 mV s−1 for (a) RH–derived AC and (d) WS–derived AC. GCD curves at 1 A g−1 and 2 A g−1 for (b) RH–derived AC and (e) WS–derived AC. Scan rate (c) and current rate (f) capabilities of KOH–activated and CO2–activated AC derived from RH and WS.
Jcs 07 00444 g006
Figure 7. (a) Ragone plot for the rice husk and walnut shell–based electrodes. (b) Cycling GCD test at 2 A g−1.
Jcs 07 00444 g007
Figure 8. Electrochemical performance of KOH–activated and CO2–activated AC derived from rice husk and walnut shell. (a) Nyquist plot recorded in the frequency range of 100 kHz to 0.01 Hz for rice husk–based electrodes and (d) for walnut shell–based electrodes. (b,c) Bode plot for rice husk–based electrodes and (e,f) for walnut shell–based electrodes.
Jcs 07 00444 g008
Disclaimer/Publisher’s Note: The statements, opinions and data contained in all publications are solely those of the individual author(s) and contributor(s) and not of MDPI and/or the editor(s). MDPI and/or the editor(s) disclaim responsibility for any injury to people or property resulting from any ideas, methods, instructions or products referred to in the content.

