Article

Dependence of the Dynamic Mechanical Properties and Structure of Polyurethane-Clay Nanocomposites on the Weight Fraction of Clay

Department of Mechanical and Materials Engineering, University of Cincinnati, Cincinnati, OH 45221-0072, USA
*
Author to whom correspondence should be addressed.
J. Compos. Sci. 2022, 6(6), 173; https://doi.org/10.3390/jcs6060173
Submission received: 22 April 2022 / Revised: 25 May 2022 / Accepted: 7 June 2022 / Published: 14 June 2022
(This article belongs to the Special Issue Feature Papers in Journal of Composites Science in 2022)

Abstract

:
The effect of clay and chemical cross-linking on the dynamic mechanical properties of polyurethane reinforced with different concentrations of organically modified montmorillonite clay is investigated in this study. The polyurethane matrix is constituted of polytetrahydrofuran soft segment and 4,4′-methylenebis(phenyl isocyanate) hard segment. Glycerin was used as the chemical crosslinking agent, while Cloisite 30B clay was the reinforcing filler. The nanocomposites containing up to 1 wt.% clay showed a uniform dispersion of clay; however, the nanocomposites containing higher concentrations of clay showed the presence of heterogeneities. Dynamic mechanical spectroscopy, DMS revealed that the nanocomposites containing between 2 and 10 wt.% clay had two glass transition temperatures, Tg,1 and Tg,2. The higher-temperature glass transition temperature, Tg,2 increased with increasing clay concentration, while the low-temperature glass transition temperature, Tg,1 decreased with increasing clay concentration. The nanocomposites containing low clay concentrations up to 1 wt.% showed only one glass transition temperature with a narrow glass transition region. The crosslink density for the nanocomposites increased with increasing wt.% clay.

1. Introduction

Polymer–clay nanocomposites have been extensively studied because of the superiority of their material properties in comparison to those of conventional polymers. These properties include improved chemical resistance, reduced gas permeability, and thermal stability [1]. Prior studies have investigated polymer–clay systems based on epoxy [2], polyamide [3], polystyrene [4], polyethylene [5], polycarbonate [6], and polyurethane (PU) [7].
PUs are widely used materials exhibiting a wide range of physical and chemical properties [8]. Their versatile nature allows the easy diversification of their structure to achieve formulations that meet the demands of various applications, such as coatings, adhesives, and foams [9]. However, PUs have some disadvantages, which can be overcome by reinforcement with montmorillonite (MMT) clay [10,11,12,13,14].
Montmorillonite (MMT) clay, consists of 1-nanometer-thick aluminosilicate sheets that are stacked upon one another and held together by Van der Waal forces. Because of the weak interactions between clay platelets, the layers from the aggregate easily delaminate [15,16]. To increase the dispersibility of the layers in a polymeric matrix, clays are often treated with organic complexes that exchange sodium metal cations with organic alkyl ammonium ions [17,18].
Pioneering work on PU–clay nanocomposites was first reported by Wang and Pinnavaia [19], who demonstrated that polyols were compatible with organically modified clay; the addition of clay led to significant improvements in strength, toughness, and strain-at-break. Recently, Joulazadeh and Navarchian [20] discussed the compatibility between Cloisite 30B (a MMT clay modified with alkyl ammonium cation bearing two hydroxyl groups) and crosslinked PU and the resulting changes in the elastic modulus.
In the present study, the focus of our paper is on establishing the correlation between the dynamic mechanical properties of crosslinked polyurethane reinforced with montmorillonite clay and the weight fraction of clay.

2. Experimental Procedure

2.1. Materials

Polytetrahydrofuran (PTHF, Mn~1000 g/mole) (Sigma-Aldrich Co. (Milwaukee, WI, USA)), 4,4′-methylenebis (phenyl isocyanate) (MDI) (Sigma-Aldrich), N,N-Dimethylformamide (DMF) (Sigma Aldrich) and certified A.C.S. grade glycerin (Fisher Scientific (Waltham, MA, USA)) were used as received. Organically modified natural montmorillonite, CloisiteTM 30B clay (C30B) (Southern Clay Products), was dried at 100 °C for 24 h prior to use.

2.2. Synthesis of Crosslinked Polyurethane (Neat XPU)

Neat XPU was formed through a two-step route under mechanical stirring. A PU prepolymer was first formed by reacting 10 g of PTHF and 5 g of MDI in DMF for 1 h at 60 °C under N2 atmosphere. Glycerin (0.55 g) was added dropwise to the mixture to react with excess –NCO groups for 10 min at 60 °C, followed by an additional 30 min at ambient temperature. The whole solution was poured into a Teflon mold and solvent-evaporated at 70 °C for 24 h to obtain films of thickness between 0.5 mm and 0.7 mm.

2.3. In Situ Preparation of XPU–Clay Nanocomposites

PTHF was dissolved in DMF and specified amounts of clay (0.25 wt.% (XPU-C025), 0.5 wt.% (XPU-C05), 1 wt.% (XPU-C1), 2 wt.% (XPU-C2), 5 wt.% (XPU-C5), and 10 wt.% (XPU-C10)) were dispersed into the solution with mechanical stirring for 2 h, followed by sonication for 1 h. The whole mixture was heated to 60 °C and the same polymerization procedure as described previously for neat XPU was carried out.

2.4. Characterization

Fourier transform infrared spectroscopy (FTIR) was performed by using a Thermo Scientific Nicolet 6700 spectrometer to elucidate chemical structure. A total of 32 scans were collected in the wavenumber range of 4000 cm−1 to 400 cm−1. FTIR was also used to determine the mechanism of crosslinking reaction. X-ray diffraction (XRD) was performed by using a PANalytical X’Pert Pro Diffractometer to study clay dispersion. The instrument operated with Cu-K alpha radiation wavelength of 0.154 nm between 2° and 7° 2θ angles. XRD results provided evidence about the dispersion of clay in the chemically crosslinked polyurethane matrix. Dynamic mechanical spectroscopy, DMS was performed in tensile mode using Seiko Instruments SII EXSTAR 6000 Spectrometer to evaluate elastic behavior of nanocomposites. Films were tested at a length of 20 mm, width ranging between 8 mm and 9 mm, and thickness between 0.5 mm and 0.8 mm. Specimens were analyzed between −100 °C and 50 °C at a heating rate of 5 °C/min and frequency at 1 Hz. Data from the dynamic mechanical spectroscopy provided a useful insight into the morphology, damping behavior and the elastic properties of the nanocomposites.

3. Results and Discussion

3.1. Chemical Characterization

Figure 1 represents the IR spectra of the monomers, neat XPU, and XPU-C10 nanocomposite. In the spectra of the monomers, the reactive isocyanate group belonging to the MDI can be observed at 2280 cm−1 and the reactive hydroxyl groups from the PTHF and glycerin can be observed at 3346 cm−1 and 3457 cm−1, respectively. In the neat XPU and XPU-C10, the isocyanate and hydroxyl peaks disappeared, indicating that the monomers reacted to completion during curing. The presence of new peaks occurring at 3309 cm−1, 1730 cm−1, and 1223 cm−1, corresponding to the N-H, C=O, and C-O stretches, respectively, shows that urethane groups were formed. This demonstrated that clay did not limit the formation of polyurethane. Furthermore, the addition of clay led to the appearance of new peaks at 522 cm−1 and 461 cm−1, which are related to the inorganic moieties present in the clay structure.

3.2. Analysis of Chemical Crosslinking Process

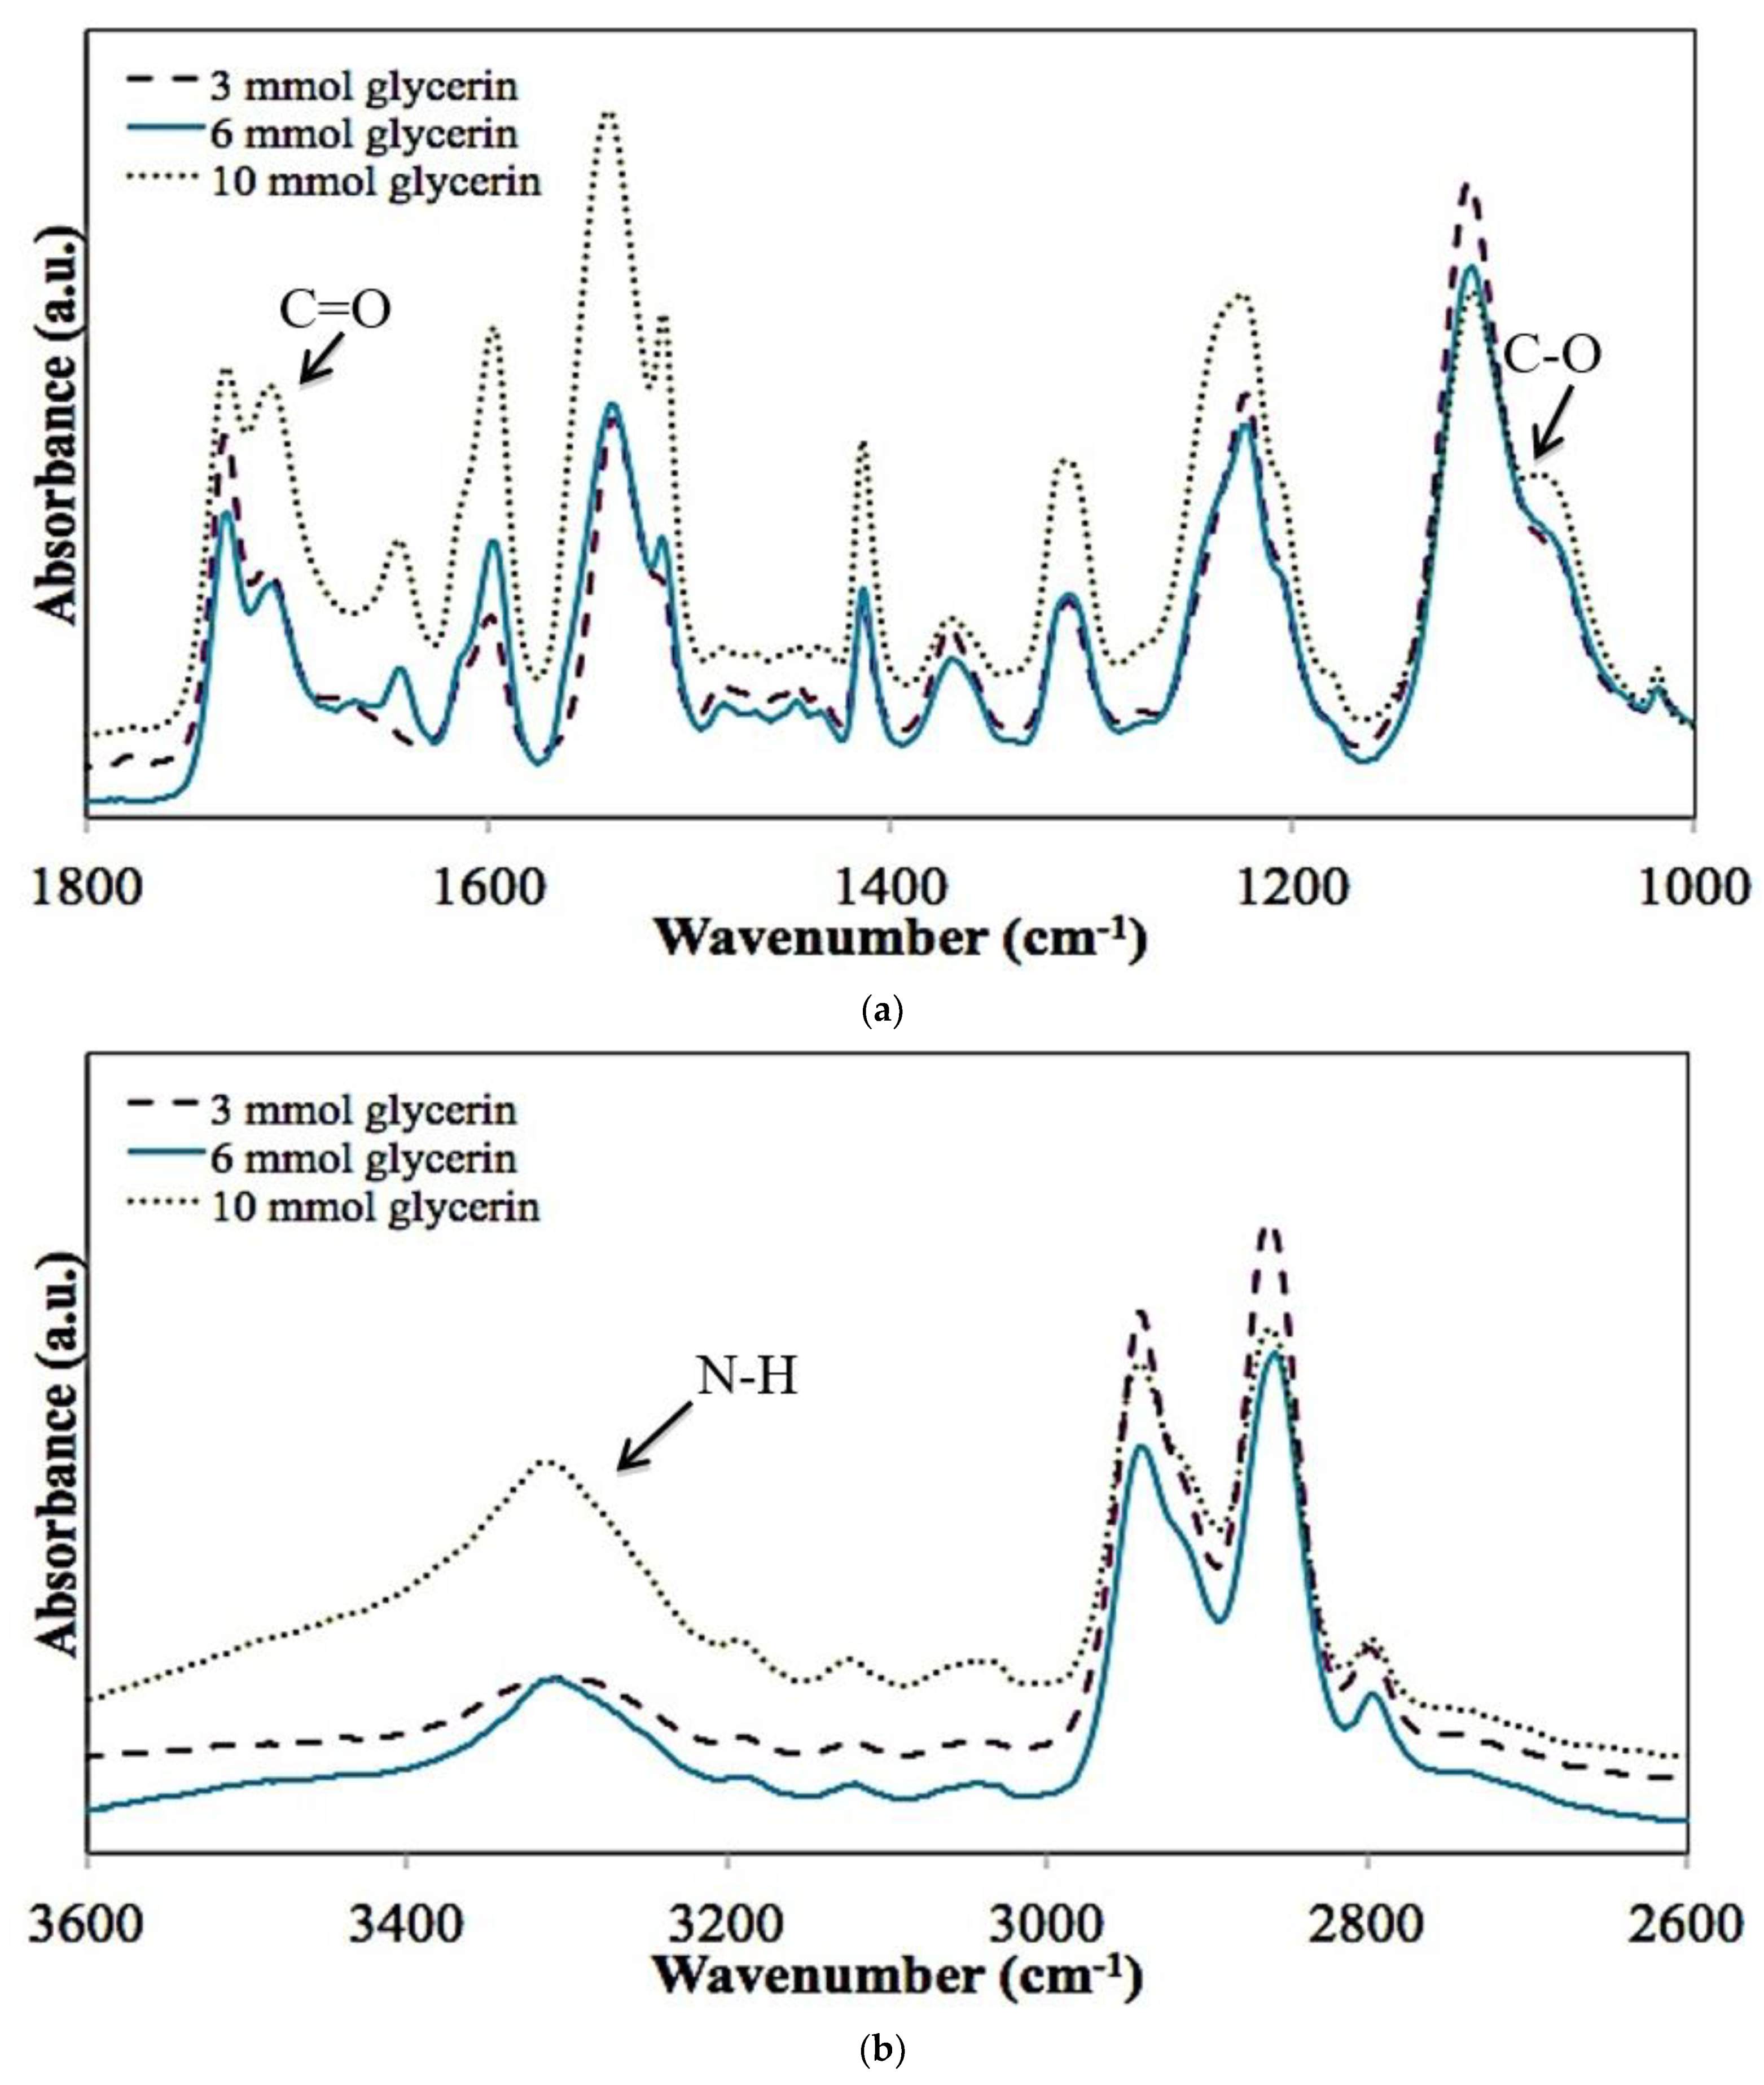
The reaction of trifunctional glycerin (glycerol) with isocyanate-terminated prepolymer formed from the reaction between polytetrahydrofuran, PTHF, 4,4′methylenebis (phenyl isocyanate), MDI gives a chemically crosslinked polyurethane, XPU [21]. Figure 2a,b show the FTIR spectra of XPU as a function of glycerin concentration. The variation in glycerin concentration from 3 to 10 mmol resulted in a corresponding increase in the intensity of the C-O-C ether stretch at 1072 cm−1 (Figure 2a), as well as a proportionate increase in the secondary amine N-H absorption at 3309 cm−1 (Figure 2b). The ratio of the absorption peak intensity for the hydrogen-bonded carbonyl C=O peak at 1710 to free C=O absorption peak at 1730 cm−1 (Figure 2c) increased with the increasing glycerin concentration. The occurrence of the hydrogen bonding interaction is shown in the carbonyl absorption peak at a lower wavenumber, around 1710 cm−1. It is shown that the hydrogen bonding interaction was greatest at higher glycerin concentrations. An analysis of the intensity of the 3309 cm−1 absorption peak (Figure 2b) also shows that higher glycerin concentrations resulted in the formation of proportionate N-H bonds. In all the spectra shown, there is little or no hydroxyl-OH absorption peak at 3400 cm−1, since both the PTHF and the glycerin reacted to completion, resulting in the formation of a crosslinked network structure.

3.3. Clay Dispersion

Figure 3 shows the diffractograms of the neat XPU, XPU-C1, XPU-C2, and C30B. The pristine C30B shows a broad diffraction peak at 2θ angle of 4.78°, which corresponds to a d-spacing of 18.5 Å. The reinforcement of the XPU with Cloisite 30B clay of up to 1 wt.% showed no peak in the diffractogram, indicating that the clay was well dispersed in the XPU matrix and that the clay may be exfoliated. Figure 3 also indicates that the clay platelets were well dispersed within the XPU matrix. Furthermore, the reinforcement of XPU with 2 wt.% clay showed a weak diffraction peak at 2θ angle of 4.55°, corresponding to a d-spacing of 19.4 Å. It was shown that at a high weight fraction of clay 2 < wt.% clay < 10, an intercalated structure of clay predominated [22,23].
The results of the transmission electron microscopy (TEM), as well as of the wide angle X-ray diffraction, WAXD studies of the polymer–clay nanocomposites, were reported by Wang et al. [16], Zhu et al., and Peng et al., [22,23]. It was shown that the d-spacing of nanoclay can be increased from 31.5 to 40 and that the nanocomposites contained well-dispersed clay stacks, each with about 2–3 layers [16] for the polyimide matrix nanocomposites reinforced by Cloisite 15A montmorillonite clay.

3.4. Storage Modulus

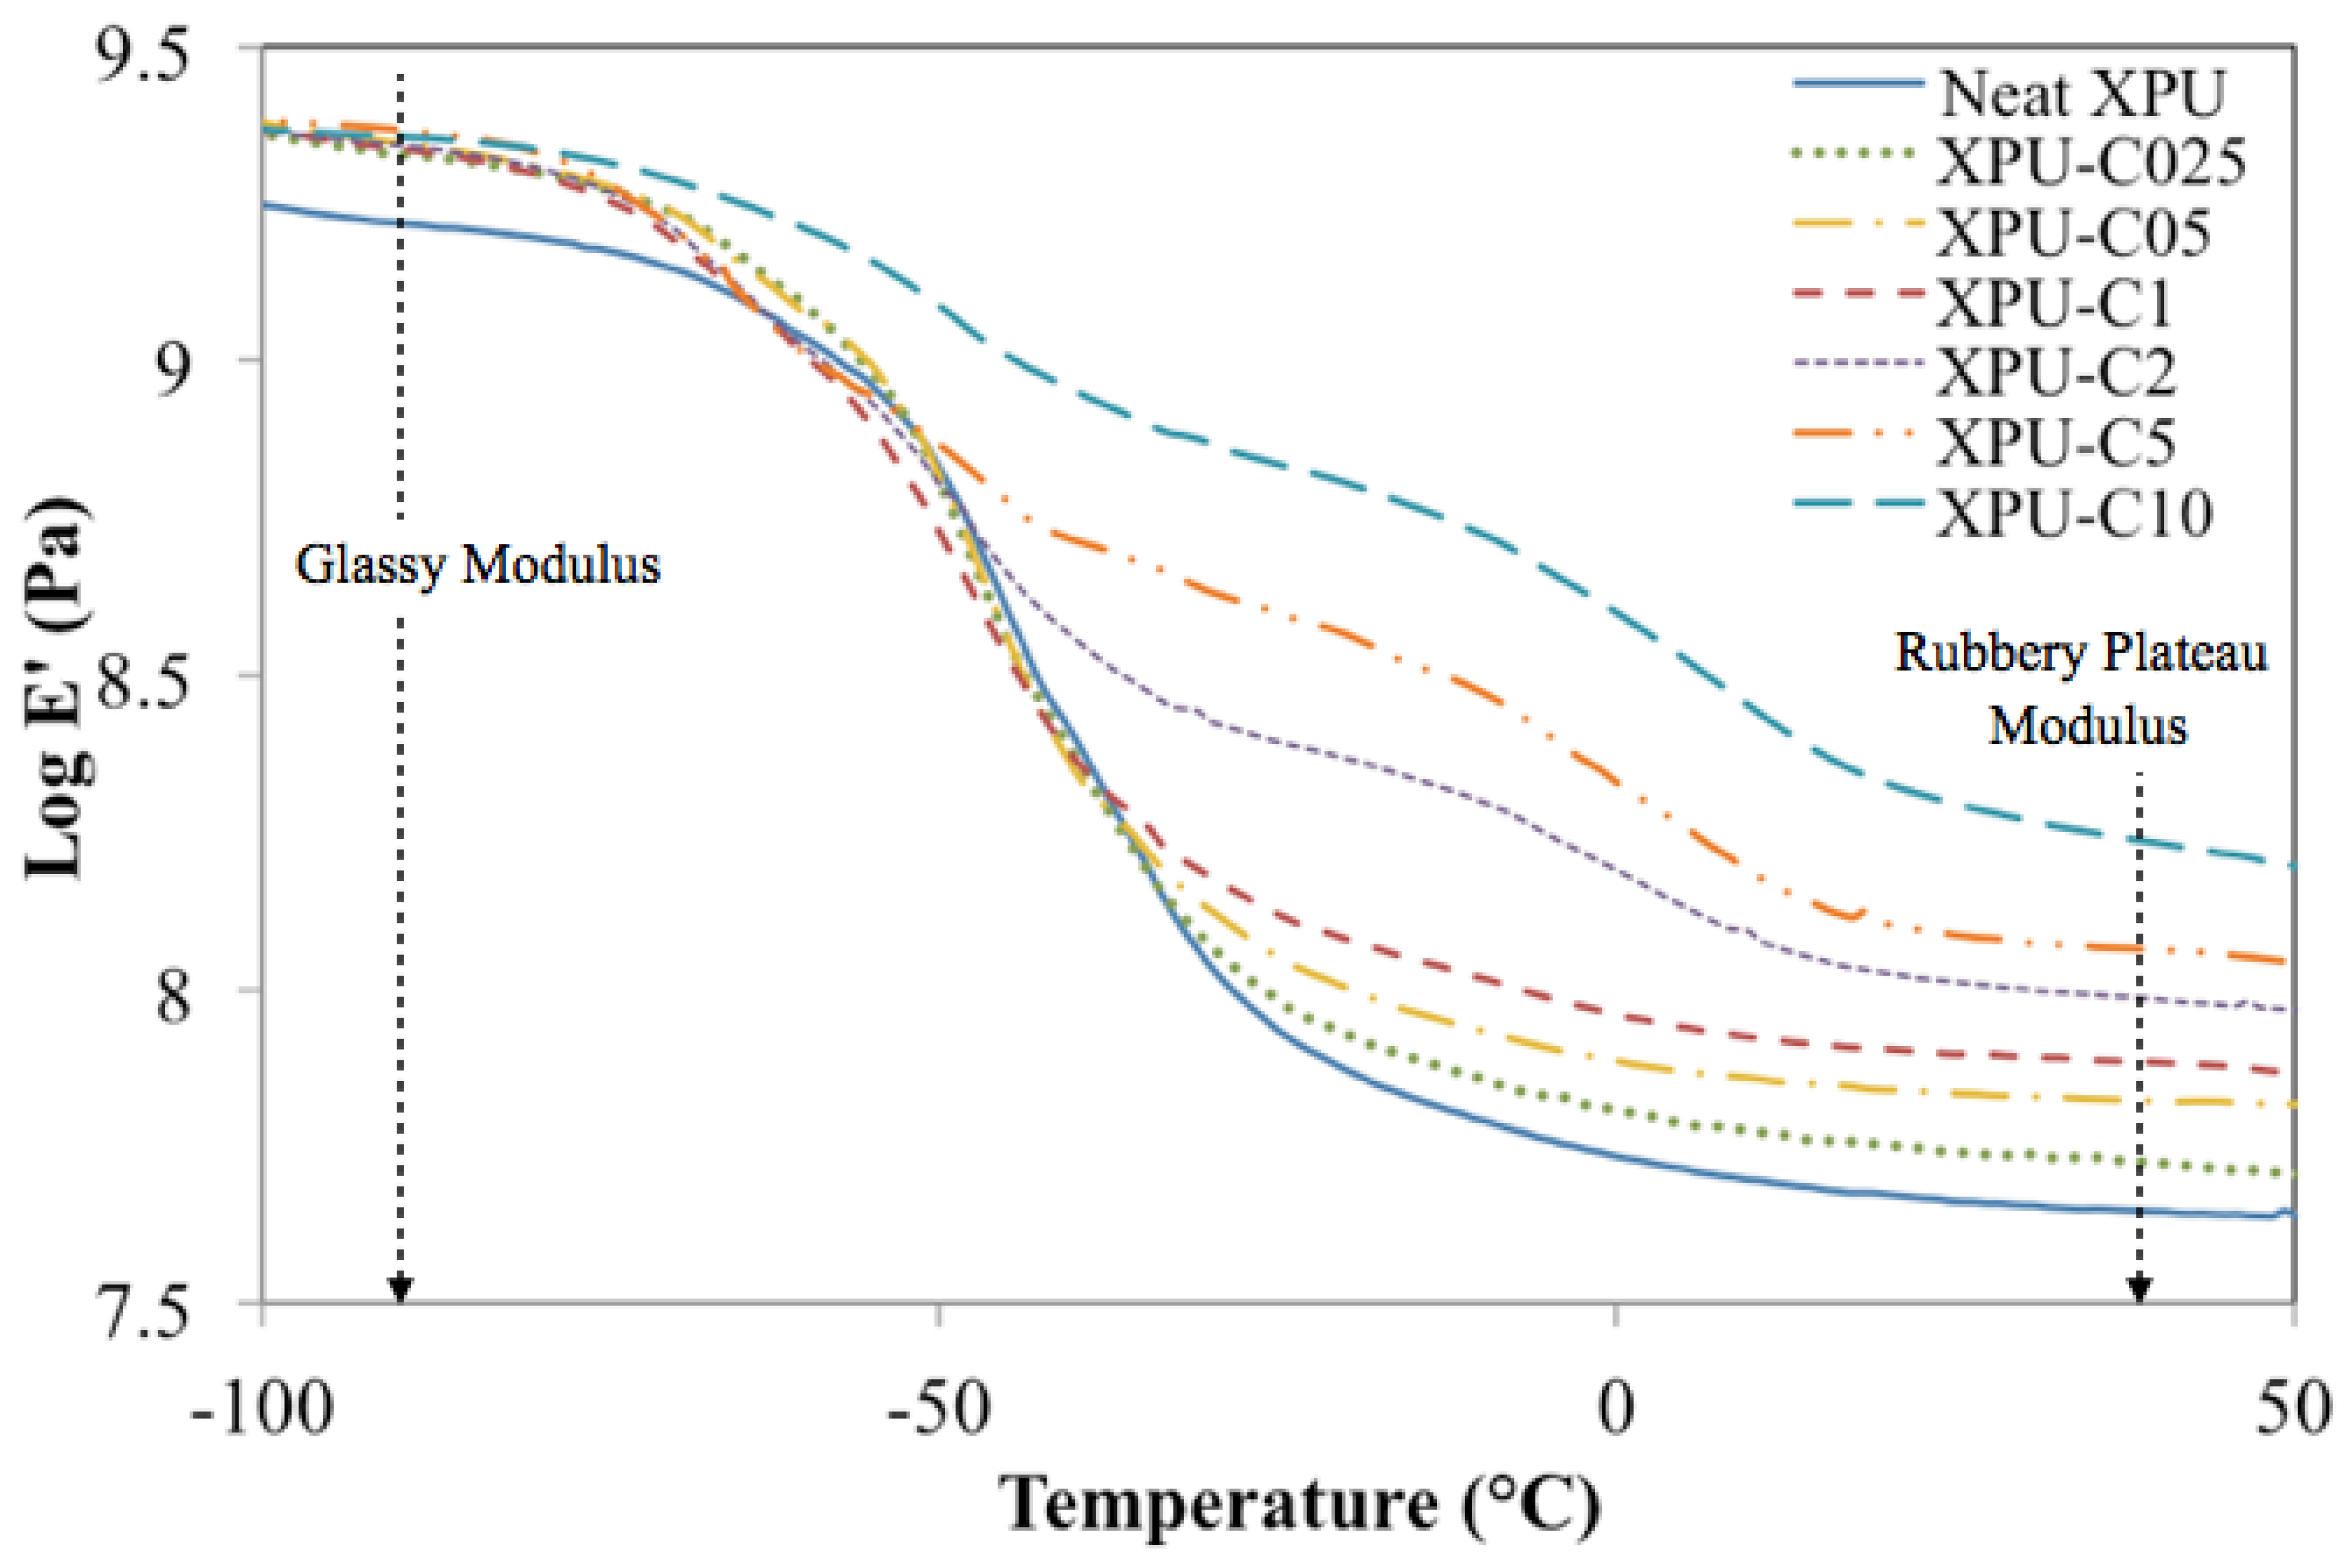
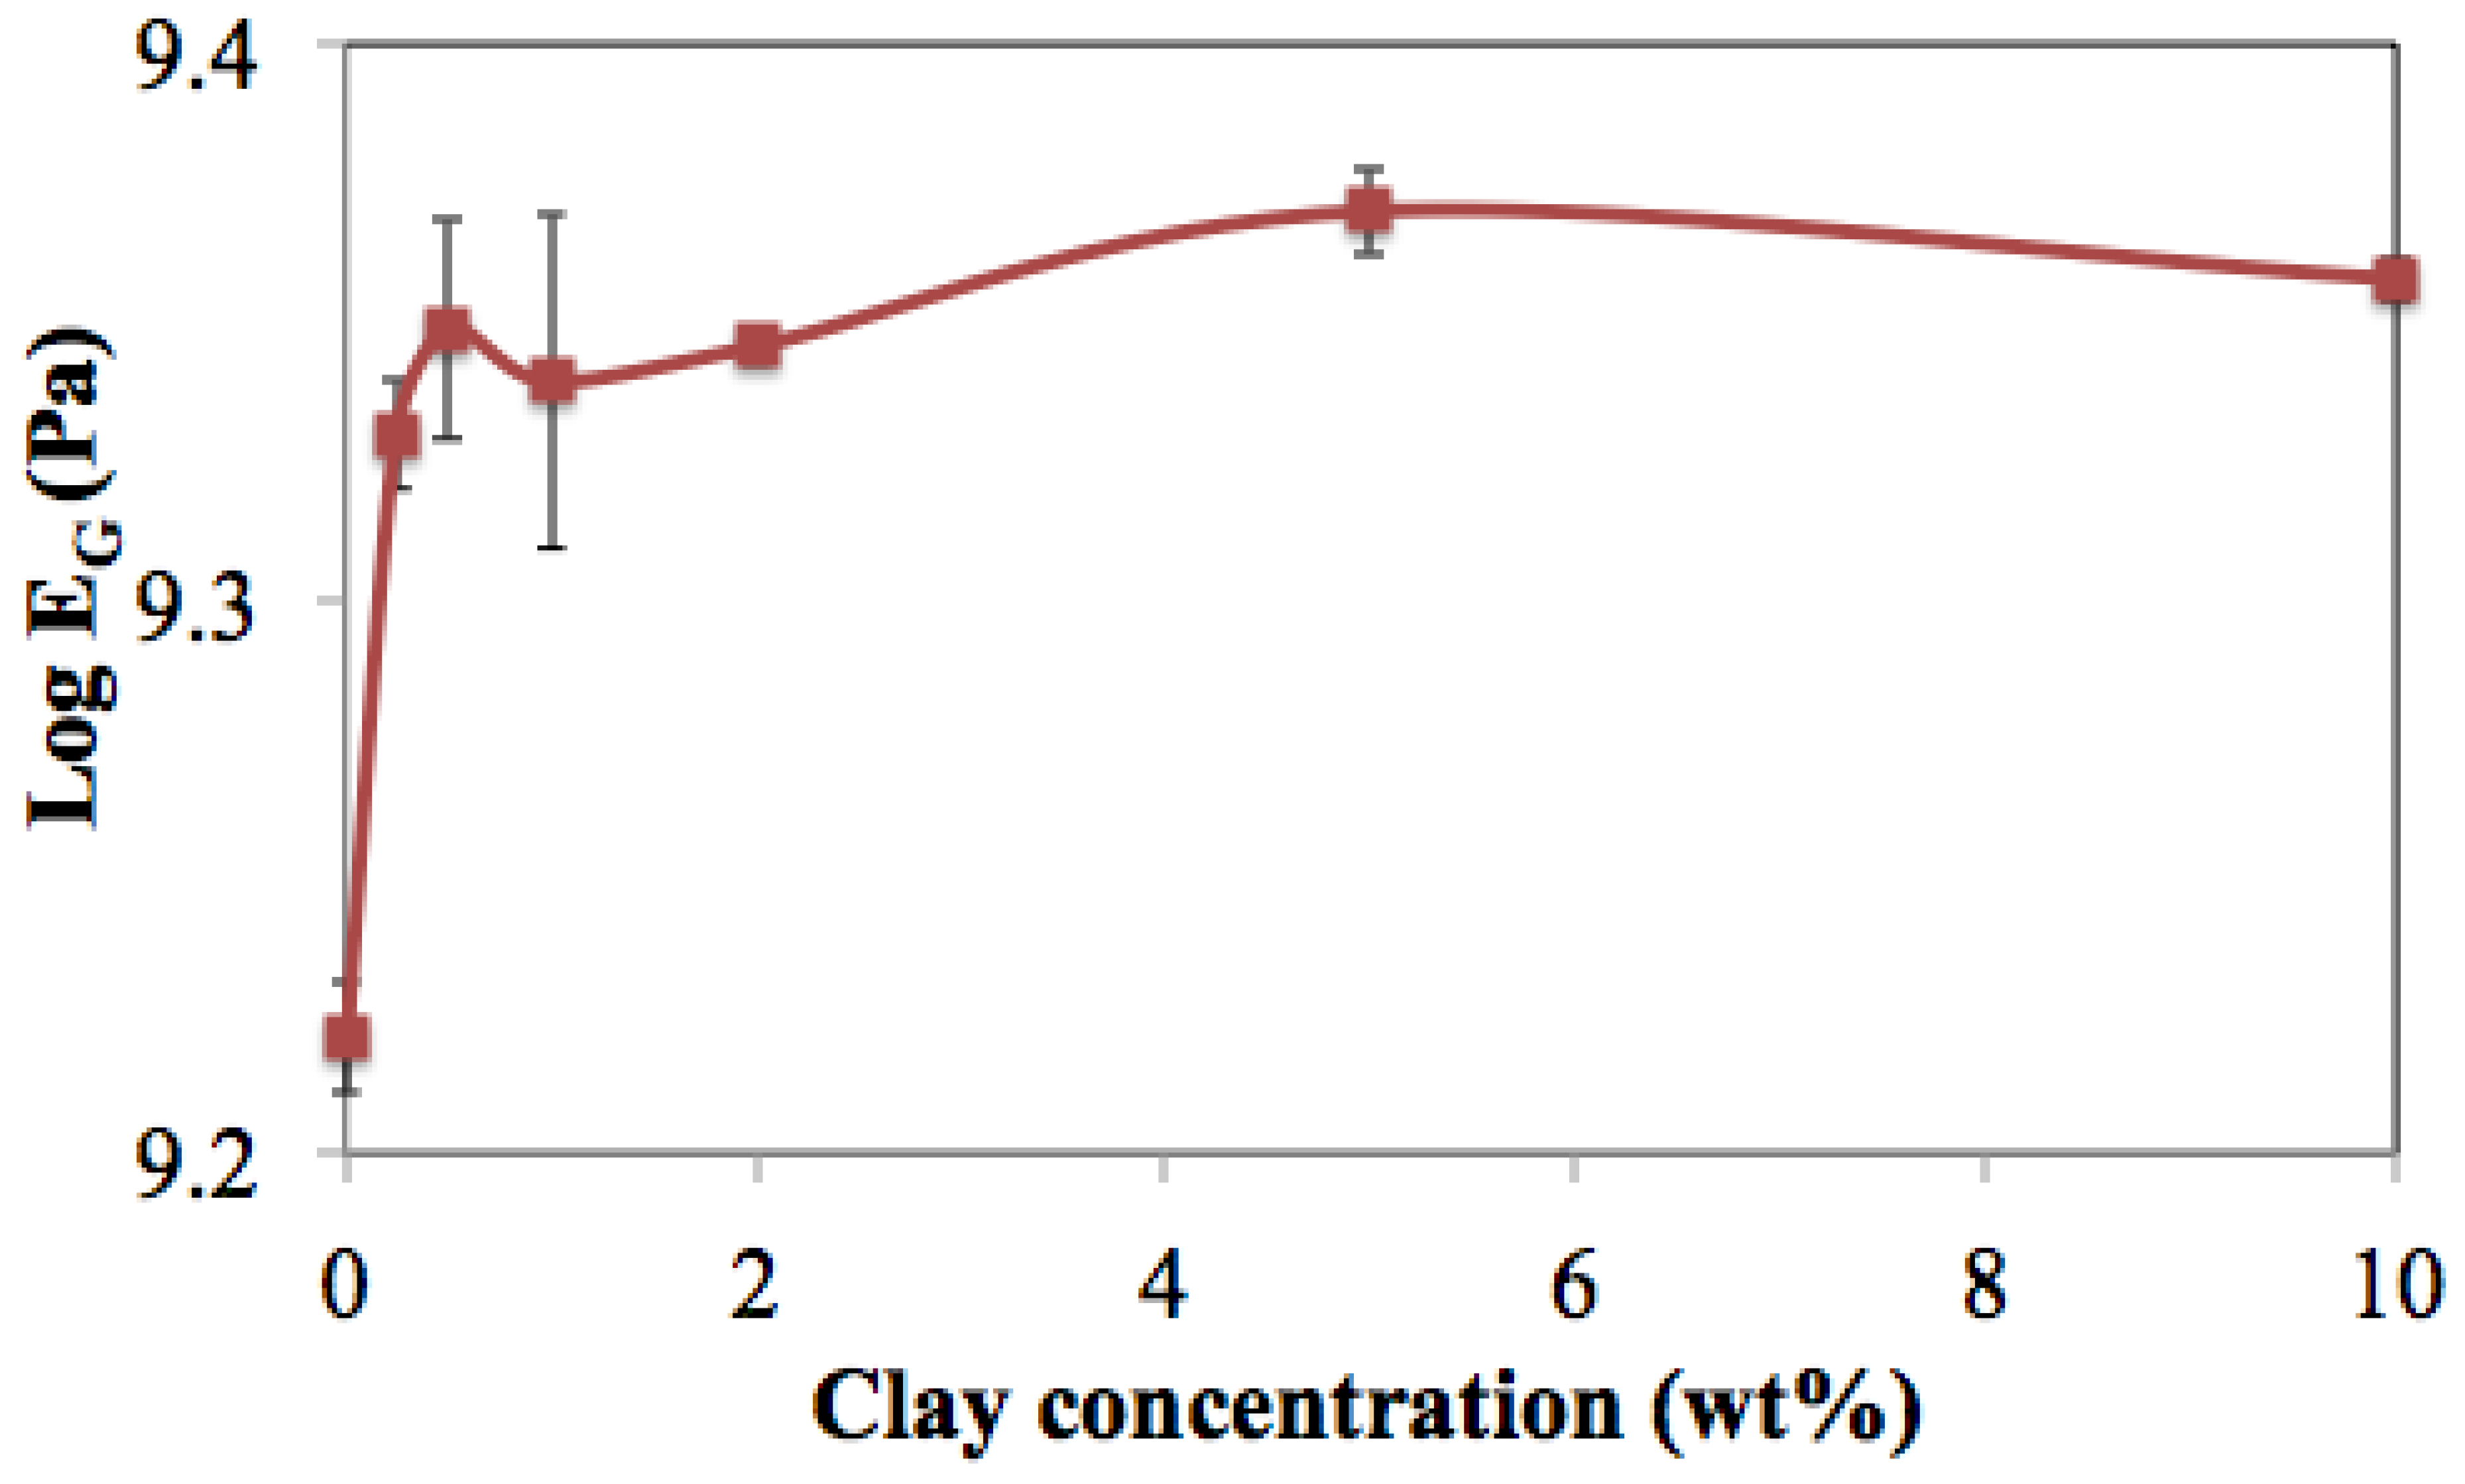
Figure 4 shows the storage modulus of the neat XPU and XPU nanocomposites as a function of temperature. The first feature of the storage modulus is the glassy region, which characterizes the stiffness of a material. To further observe this area, the change in the glassy region modulus (EG) as a function of the clay concentration is shown in Figure 5. At low concentrations of clay of <1 wt.% clay, a sharp increase in EG was observed, demonstrating that good physical interactions took place between the surface of the clay and the PU matrix, which is partly due to the formation of hydrogen bonding. Additionally, this type of interaction can alter chain mobility and enhance the stiffness of the nanocomposite substantially. As the clay concentration approached 10 wt.%, a slight decrease in EG was observed. It is likely that this behavior is due to the inability of the clay to fully disperse throughout the matrix and agglomerate as a consequence. The reduction in the clay and PU interactions would therefore yield a lower modulus.

3.5. Glass-Transition Region

The glass-transition region refers to the temperature range within which the onset of long-range molecular motion in polymer chains occurs. At clay concentrations between 0.25 wt.% and 1 wt.%, a narrow glass-transition region was observed, which is similar to what was shown for the neat XPU. This suggested that a homogenous nanocomposite was achieved, such that molecular motion occurred at approximately the same temperature as for the matrix. It is assumed that the homogeneity was due to the good dispersal of the clay layers and their high compatibility with the PU. However, at clay loading between 2 and 10 wt.%, a broad transition region was observed, indicating that a heterogeneous nanocomposite was produced. Additionally, this result shows that due to the phase separation within the nanocomposite, there was incompatibility between the two components. This behavior is potentially due to the high concentration of rigid clay filler, facilitating micro-phase separation by means of increasing the hard segment content in the polyurethane [24]. Additionally, the disparity in the behavior of the soft and hard segments is believed to have arisen from the clays ability to chemically react with the free isocyanato groups through the organic modifier’s hydroxyl end groups, as well as to physically interact with the urethane groups through hydrogen bonding (Figure 6).

3.6. Rubbery Plateau Modulus

The rubbery plateau modulus (ER) is the third region of the storage-modulus-temperature curve, which characterizes the elasticity of polymeric materials. The change in ER as a function of the clay’s concentration can be observed in Figure 7. The observed increase in the modulus in this region can be attributed to the rigidity of the silicate layers, which restricted the chain motion and promoted physical crosslinking between the filler and the matrix.
Two micromechanical models were used to predict the elastic properties of the composites. The first model is the rule of the mixture (Equation (1)) with which the upper bound of this model was calculated [25]:
E c = E f ϕ f + E m ϕ m
where Ec, Ef, and Em are the modulus of the composite, filler, and unfilled matrix, and ϕf and ϕm are the volume fractions of the clay and matrix.
Additionally, the lower bound was calculated by using the iso-stress model or the inverse rule-of-mixture Equation (2) [25]:
1 E c = ϕ f E f + ϕ m E m          
The second model is the Halpin–Tsai (H–T), equation (Equation (3)) which diverges from the rule-of-mixture by taking into consideration the geometry of the filler.
To calculate the values for this theoretical model, a modified H–T equation was used, in Equations (3)–(5) [26].
E C = E m [ 1 + ξ η ϕ f 1 η ϕ f ]  
η = [ ( E f E m ) 1 ( E f E m ) + ξ ]  
ξ = 2 [ l t ]    
where Ec, Em, and Ef are the composite modulus, matrix modulus, and filler modulus, respectively, ϕf is the volume fraction of the clay filler, and [l/t] is the aspect ratio of the filler (in this case ~100) [26,27].
Figure 8 compares the experimental modulus with the modulus calculated from the micromechanical models. The rule-of-mixture model did not fit the experimental modulus as well as the H–T model; this could have been due to the model not taking into account the morphology of the composite material [25]. At low volume fractions of clay, the H–T model closely fits the experimental data; however, at higher volume fractions (ϕf > 1), the model began to deviate significantly. Because the H–T model is generally used for fillers that are exfoliated, this demonstrates that at loading up to 1 wt.%, the clay platelets were possibly exfoliated and may have achieved uniform dispersion [28]. This assertion would support the results observed in the XRD test such that the nanocomposite containing ≤1 wt.% of clay did not show any clay peaks. At higher concentrations, it is suspected that the clay platelets were non-exfoliated aggregates and that filler–filler interactions occurred as a result.

3.7. Tan δ Curve

The location of the tan δ peak is a convenient way to obtain the glass-transition temperature (Tg), and the tan δ peak height is associated with the damping ability of a polymer. Figure 9 shows the temperature dependence of tan δ peaks for the nanocomposites at different clay concentrations. For up to 1 wt.% clay, a narrow peak displaying one Tg (denoted as Tg,1) was observed. Exceeding this clay wt.% led to peak broadening and the appearance of a second Tg (denoted as Tg,2). The variation of Tg with composition for the nanocomposites can be observed in Figure 10. The neat XPU containing 0 wt.% clay shows a single Tg,1 at −39 °C. As the clay content increased, a shift in Tg,1 to lower temperatures was observed. This phenomenon could be attributed to the limitation of the curing of the nanocomposites by the clay, which may have resulted in lower amounts of chemical networks being formed in the matrix. For the nanocomposites containing 2 to 10 wt.% clay, a second Tg was observed (Tg,2), which shifted to a higher temperature as the clay concentration increased. It is assumed that the latter Tg could be attributed to the restriction of the movement in the clay–urethane interface or the motion occurring in the clay due to the platelets twisting or rotating.
Damping properties can provide information on how well materials can absorb and dissipate energy upon impact. The damping abilities can be obtained by integrating the area under the tan δ curve. Figure 11 shows the variation in the tan δ peak height and the damping peak area, with the composition of the nanocomposites. The neat XPU exhibited the highest damping ability and the addition of the clay dramatically decreased the damping by up to 43% for the composite containing 10 wt.% clay, XPU-C10. Additionally, the height of the tan δ peaks decreased with the increased clay concentration indicating that the flexibility of the chains was reduced. The rigidity of the fillers and the molecular interactions in the matrix can contribute to a decrease in tan δ height.

3.8. Crosslink Density

For coating applications, the crosslink density is an important factor, since denser materials are more prone to becoming brittle [29]. An approximation of the crosslink density in polymers can be correlated with the rubbery plateau modulus, as observed in Equations (6) and (7) [30].
C r o s s l i n k   D e n s i t y   ( mols / m 3 ) = E 3 R T  
n   ( mols ) = c r o s s l i n k   d e n s i t y × V
where E′ represents the elastic storage modulus above Tg, T is the absolute temperature at the selected modulus, R is the universal gas constant, n is the moles of the crosslink, and V is the volume of the polymer sample measured by using dynamic mechanical spectroscopy.
In Figure 12, it can be observed that the moles of the crosslinks increased as the clay concentration increased. At lower crosslink densities, the molecular weight between the crosslinks was high and the polymer experienced more chain mobility. Because the moles of the crosslink increased after the addition of clay, a denser network was formed within the material and, therefore, the chain mobility was limited. Furthermore, clay can impose restrictions on the motion of polymers as a result of the reduced free volume in a system. Moreover, intermolecular forces, such as physical crosslinking and chain entanglements, can act within nanocomposites, thereby increasing the stiffness of the matrix. The crosslink density at 0 wt.% clay is due to chemical crosslinking and the contribution from the molecular weight of the polymer.

4. Conclusions

Nanocomposites based on crosslinked polyurethane and organoclay were studied by investigating the variation in the storage modulus and tan δ with changing compositions and test temperatures. The addition of clay at low concentrations enhanced the storage modulus of the nanocomposite and produced only one glass-transition temperature, demonstrating that good interfacial interactions took place between the clay and the polyurethane. The addition of clay increased the rigidity of the nanocomposites, thereby decreasing their damping ability and increasing their stiffness. Furthermore, it was observed that the concentration and dispersion of the clay directly affected the homogeneity of the nanocomposite, such that exceeding 1 wt.% clay led to micro-phase separation within the nanocomposites. This study can perhaps provide a foundation for future studies to utilize dynamic mechanical spectroscopy to characterize the compatibility between the filler and the matrix in other nanocomposite systems.
At a low clay weight fraction of <1.0 wt.%, the Halpin–Tsai (H–T) model fitted the experimental storage modulus accurately. It was noted that this range of concentration of clay was characterized by only one major α-transition peak, suggesting a homogenous nanocomposite with uniform filler distribution.

Author Contributions

S.P., Data curation and analysis, original draft; J.O.I., Conceptualization, resources, original concept, administration. All authors have read and agreed to the published version of the manuscript.

Funding

This research received no external funding.

Institutional Review Board Statement

Not applicable.

Informed Consent Statement

Not applicable.

Data Availability Statement

Not applicable.

Conflicts of Interest

The authors declare no conflict of interest.

References

  1. Joshi, M.; Banerjee, K.; Prasanth, R.; Thakare, V. Polymer/clay nanocomposite based coatings for enhanced gas barrier property. Indian J. Fibre Text. Res. 2006, 31, 202. [Google Scholar]
  2. Kornmann, X.; Lindberg, H.; Berglund, L.A. Synthesis of epoxy–clay nanocomposites: Influence of the nature of the clay on structure. Polymer 2001, 42, 1303–1310. [Google Scholar] [CrossRef]
  3. Shelley, J.S.; Mather, P.T.; DeVries, K.L. Reinforcement and environmental degradation of nylon-6/clay nanocomposites. Polymer 2001, 42, 5849–5858. [Google Scholar] [CrossRef] [Green Version]
  4. Fu, X.; Qutubuddin, S. Synthesis of polystyrene–clay nanocomposites. Mater. Lett. 2000, 42, 12–15. [Google Scholar] [CrossRef]
  5. Kato, M.; Okamoto, H.; Hasegawa, N.; Tsukigase, A.; Usuki, A. Preparation and properties of polyethylene-clay hybrids. Polym. Eng. Sci. 2004, 43, 1312. [Google Scholar] [CrossRef]
  6. Suin, S.; Maiti, S.; Shrivastava, N.K.; Khatua, B.B. Mechanically improved and optically transparent polycarbonate/clay nanocomposites using phosphonium modified organoclay. Mater. Des. 2014, 54, 553–563. [Google Scholar] [CrossRef]
  7. Hu, Y.; Song, L.; Xu, J.; Yang, L.; Chen, Z.; Fan, W. Synthesis of polyurethane/clay intercalated nanocomposites. Colloid Polym. Sci. 2001, 279, 819–822. [Google Scholar] [CrossRef]
  8. Motawie, A.M.; Madani, M.; Esmail, E.A.; Dacrorry, A.Z.; Othman, H.M.; Badr, M.M.; Abulyazied, D.E. Electrophysical characteristics of polyurethane/organo-bentonite nanocomposites. Egypt. J. Petrol. 2014, 23, 379–387. [Google Scholar] [CrossRef] [Green Version]
  9. Pradhan, K.C.; Nayak, P.L. Synthesis and characterization of polyurethane nanocomposite from castor oil-hexamethylene diisocyanate (HMDI). Adv. Appl. Sci. Res. 2012, 3, 3045–3052. [Google Scholar]
  10. Stranskowski, M.; Strankowska, J.; Gazda, M.; Pisczyk, L.; Nowaczyk, G.; Jurga, S. Thermoplastic polyurethane/(organically modified montmorillonite) nanocomposites produced by in situ polymerization. Express Polym. Lett. 2012, 6, 610. [Google Scholar] [CrossRef]
  11. Rehab, A.; Salahuddin, N. Nanocomposite materials based on polyurethane intercalated into montmorillonite clay. Mater. Sci. Eng. A 2005, 399, 368–376. [Google Scholar] [CrossRef]
  12. Solarski, S.; Benali, S.; Rochery, M.; Devaux, E.; Alexandre, M.; Monteverde, F.; Dubois, P. Synthesis of a polyurethane/clay nanocomposite used as coating: Interactions between the counterions of clay and the isocyanate and incidence on the nanocomposite structure. J. Appl. Polym. Sci. 2005, 95, 238–244. [Google Scholar] [CrossRef]
  13. Yao, K.J.; Song, M.; Hourston, D.J.; Luo, D.Z. Polymer/layered clay nanocomposites: 2 polyurethane nanocomposites. Polymer 2002, 43, 1017–1020. [Google Scholar] [CrossRef]
  14. Verma, G.; Kaushik, A.; Ghosh, A.K. Preparation, characterization and properties of organoclay reinforced polyurethane nanocomposite coatings. J. Plast. Film Sheeting 2012, 29, 3. [Google Scholar] [CrossRef]
  15. Sengwa, R.J.; Choudhary, S. Structural characterization of hydrophilic polymer blends/montmorillonite clay nanocomposites. J. Appl. Polym. Sci. 2014, 131, 40617. [Google Scholar] [CrossRef]
  16. Wang, J.; Iroh, J.O.; Long, A. Controlling the structure and rheology of polyimide/nanoclay composites by condensation polymerization. J. Appl. Polym. Sci. 2012, 125, E486–E494. [Google Scholar] [CrossRef]
  17. Cervantes-Uc, J.M.; Cauich-Rodriguez, J.V.; Vazquez-Torres, H.; Garfias-Mesias, L.F.; Paul, D.R. Thermal degradation of commercially available organoclays studied by TGA–FTIR. Thermochim. Acta 2007, 457, 92–102. [Google Scholar] [CrossRef]
  18. Morgan, A.B.; Gilman, J.W. Characterization of polymer-layered silicate (clay) nanocomposites by transmission electron microscopy and X-ray diffraction: A comparative study. J. Appl. Polym. Sci. 2003, 87, 1329–1338. [Google Scholar] [CrossRef]
  19. Wang, Z.; Pinnavaia, T.J. Nanolayer reinforcement of elastomeric polyurethane. Chem. Mater. 1998, 10, 3769–3771. [Google Scholar] [CrossRef]
  20. Joulazadeh, M.; Navarchian, A.H. Study on elastic modulus of crosslinked polyurethane/organoclay nanocomposites. Polym. Adv. Technol. 2011, 22, 2022–2031. [Google Scholar] [CrossRef]
  21. Giroto, A.S.; doValle, S.F.; Ribeira, T.; Ribeira, C.; Mattoso, L.H.C. Towards Urea and Glycerol Utilization as Building Block for Polyurethane Production: A Detailed Study about Reactivity, and Structure for Environmentally Friendly Polymer Synthesis. React. Funct. Polym. 2020, 153, 104629. [Google Scholar] [CrossRef]
  22. Zhu, Y.; Iroh, J.O.; Rajagopolan, R.; Aykanat, A.; Vaia, R. Optimizing the synthesis and thermal properties of conducting polymer–montmorillonite clay nanocomposites. Energies 2022, 15, 1291. [Google Scholar] [CrossRef]
  23. Peng, S.; Iroh, J.O. Synthesis and characterization of crosslinked polyurethane/clay nanocomposites. J. Appl. Polym. Sci. 2016, 133, 43346. [Google Scholar] [CrossRef] [Green Version]
  24. Barick, A.K.; Tripathy, D.K. Effect of organically modified layered silicate nanoclay on the dynamic viscoelastic properties of thermoplastic polyurethane nanocomposites. Appl. Clay Sci. 2011, 52, 312–321. [Google Scholar] [CrossRef]
  25. Behera, A.K.; Avancha, S.; Manna, S.; Sen, R.; Adhikari, B. Effect of nanoclay on physical, mechanical, and microbial degradation of jute-reinforced, soy milk-based nano-biocomposites. Polym. Eng. Sci. 2014, 54, 345–354. [Google Scholar] [CrossRef]
  26. Samaniuk, J.; Litchfield, D.; Baird, D. Improving the exfoliation of layered silicate in a poly (ethylene terephthalate) matrix using supercritical carbon dioxide. Polym. Eng. Sci. 2009, 49, 2329–2341. [Google Scholar] [CrossRef] [Green Version]
  27. Iroh, J.O.; Longun, J. Viscoelastic properties of montmorillonite clay/polyimide composite membranes and thin films. J. Inorg. Organomet. Polym. 2012, 22, 653–661. [Google Scholar] [CrossRef]
  28. Rooj, S.; Das, A.; Stockelhuber, K.W.; Wang, D.-Y.; Galiatsatos, V.; Heinrich, G. Understanding the reinforcing behavior of expanded clay particles in natural rubber compounds. Soft Matter 2013, 9, 3798–3808. [Google Scholar] [CrossRef]
  29. Chattopadhyay, D.K.; Panda, S.S.; Raju, K.V.S.N. Properties of diamine chain extended polyurethane-urea coatings. J. Jpn. Soc. Colour Mater. 2004, 77, 540–547. [Google Scholar] [CrossRef] [Green Version]
  30. Hill, L.W. Calculation of crosslink density in short chain networks. Prog. Org. Coat. 1997, 31, 235–243. [Google Scholar] [CrossRef]
Figure 1. FTIR spectra of the monomers (MDI, glycerin, and PTHF), neat XPU and XPU-C10.
Jcs 06 00173 g001
Figure 2. (a): FTIR spectra of PU crosslinked with varying concentrations of glycerin at low wavenumbers, showing variation in the ether, C-O-C and carbonyl, and C=O absorption peak with glycerin concentration. (b): FTIR spectra of PU crosslinked with varying concentrations of glycerin at high wavenumbers, showing variation in the secondary amine and N-H absorption peak with glycerin concentration. (c): Effect of glycerin concentration on the ratio of hydrogen-bonded carbonyl absorption at 1710 cm−1 to free carbonyl absorption peak at 1730 cm−1.
Jcs 06 00173 g002aJcs 06 00173 g002b
Figure 3. Diffractograms of Cloisite 30B and nanocomposites at varying clay concentrations.
Jcs 06 00173 g003
Figure 4. Variation in the storage modulus of the nanocomposites with temperature and composition.
Jcs 06 00173 g004
Figure 5. The glassy region storage modulus of the nanocomposites at −90 °C as a function of clay concentration. Showing a slight decrease in EG at 10 wt.% clay due in part to clay agglomeration and poor dispersion.
Jcs 06 00173 g005
Figure 6. Representation of the interactions between quaternary ammonium-treated clay and polyurethane.
Jcs 06 00173 g006
Figure 7. Effect of clay wt.% on the rubbery plateau modulus at 40 °C. The rubbery plateau modulus, ER increases with increasing clay wt.% due to increasing concentration of entanglement and physical crosslinks which increases chain rigidity and stiffness.
Jcs 06 00173 g007
Figure 8. Comparison of the experimental storage modulus with those calculated by using the rule-of-mixture and Halpin–Tsai theoretical model, respectively.
Jcs 06 00173 g008
Figure 9. The variation of tan δ peak height with temperature and composition. Blue dashed line—XPU-C10.
Jcs 06 00173 g009
Figure 10. Dependence of the glass-transition temperature of nanocomposites on the wt.% clay, showing the variation of the two Tgs with composition. At lower clay wt.% of <2. Tg,1 predominates and it is attributed to the neat matrix and matrix containing well dispersed clay. At higher wt.% clay, ≥2, both Tg,1 and Tg,2 are present. Tg,2 is attributed to nanocomposite aggregates and clay-matrix interfacial phenomenon.
Jcs 06 00173 g010
Figure 11. Effect of clay wt.% on the damping ability (tan δ peak area) of the nanocomposites.
Jcs 06 00173 g011
Figure 12. Dependence of the moles of crosslinks in XPU and XPUC on wt.% clay. Increasing wt.% clay increases the physical crosslink density denoted as the moles of crosslinks. At the y-axis intercept (0 wt.% clay), the contribution to the total crosslink density from chemical crosslinking due to the reaction of glycerin with isocyanate, MDI is determined to be about 2 × 10⁻³ moles. This model predicts the magnitude of both chemical and physical crosslinking in a chemically crosslinked polyurethane-clay nanocomposites.
Jcs 06 00173 g012
Publisher’s Note: MDPI stays neutral with regard to jurisdictional claims in published maps and institutional affiliations.