
Molecular Dynamics Study of Melting Behavior of Planar Stacked Ti–Al Core–Shell Nanoparticles


Abstract
:1. Introduction
2. Simulation Details
2.1. Simulator and Force Field
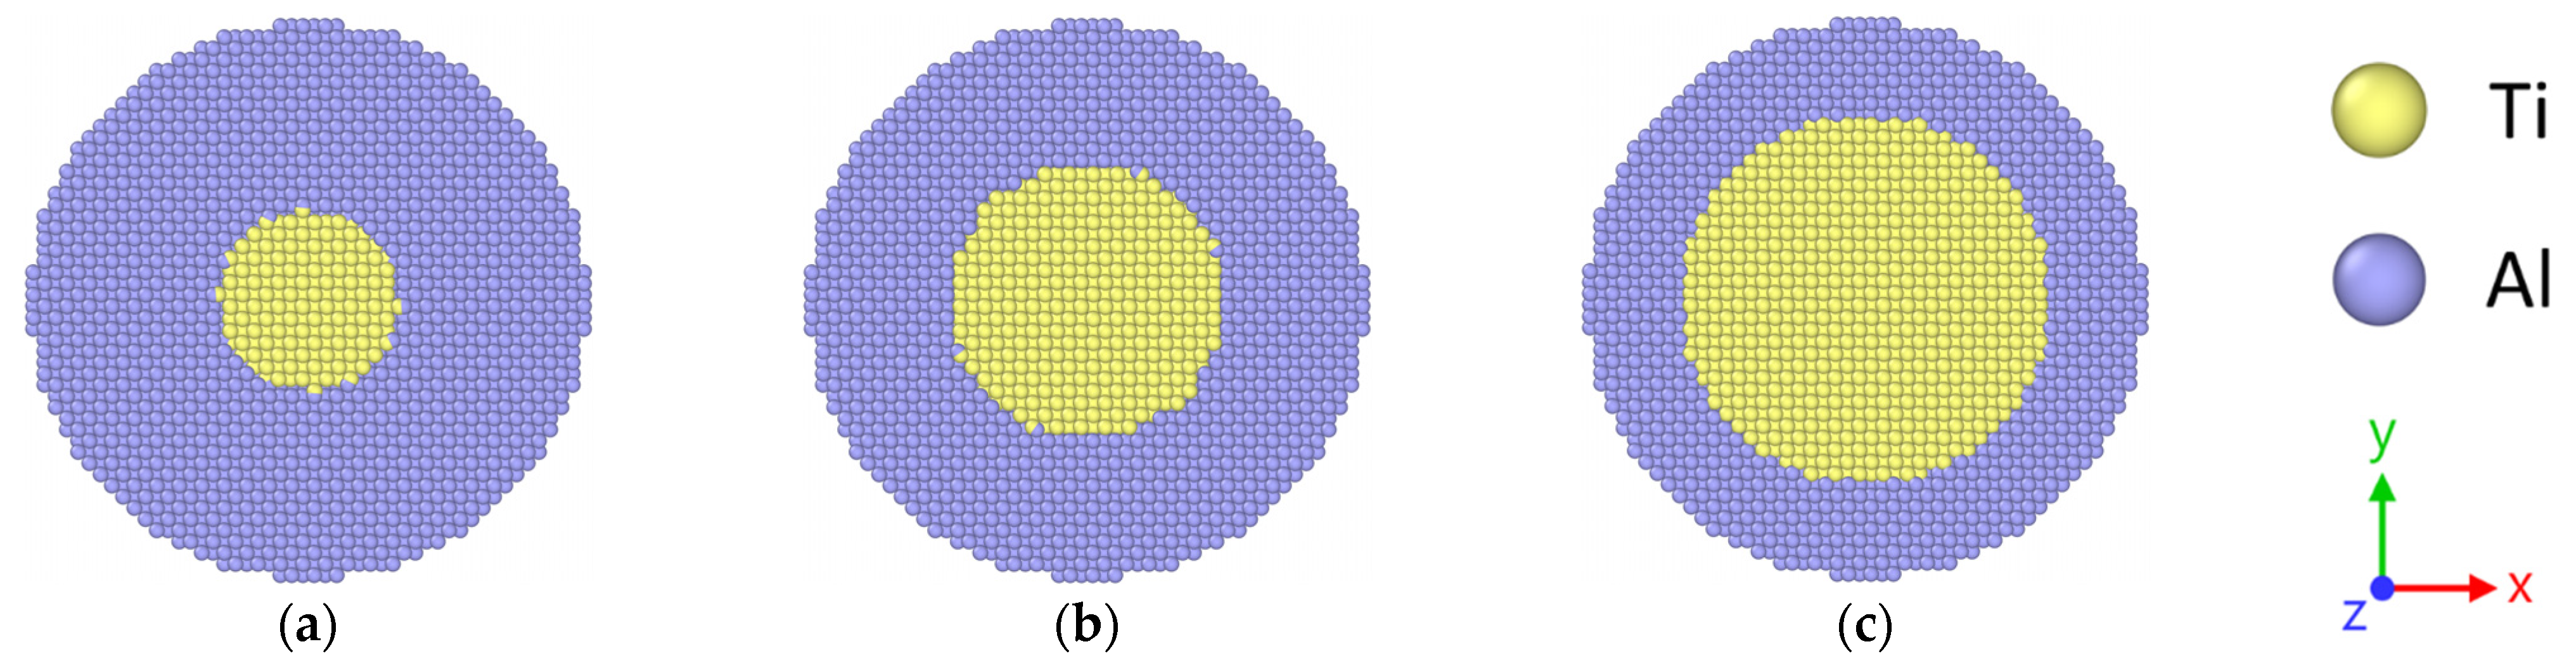
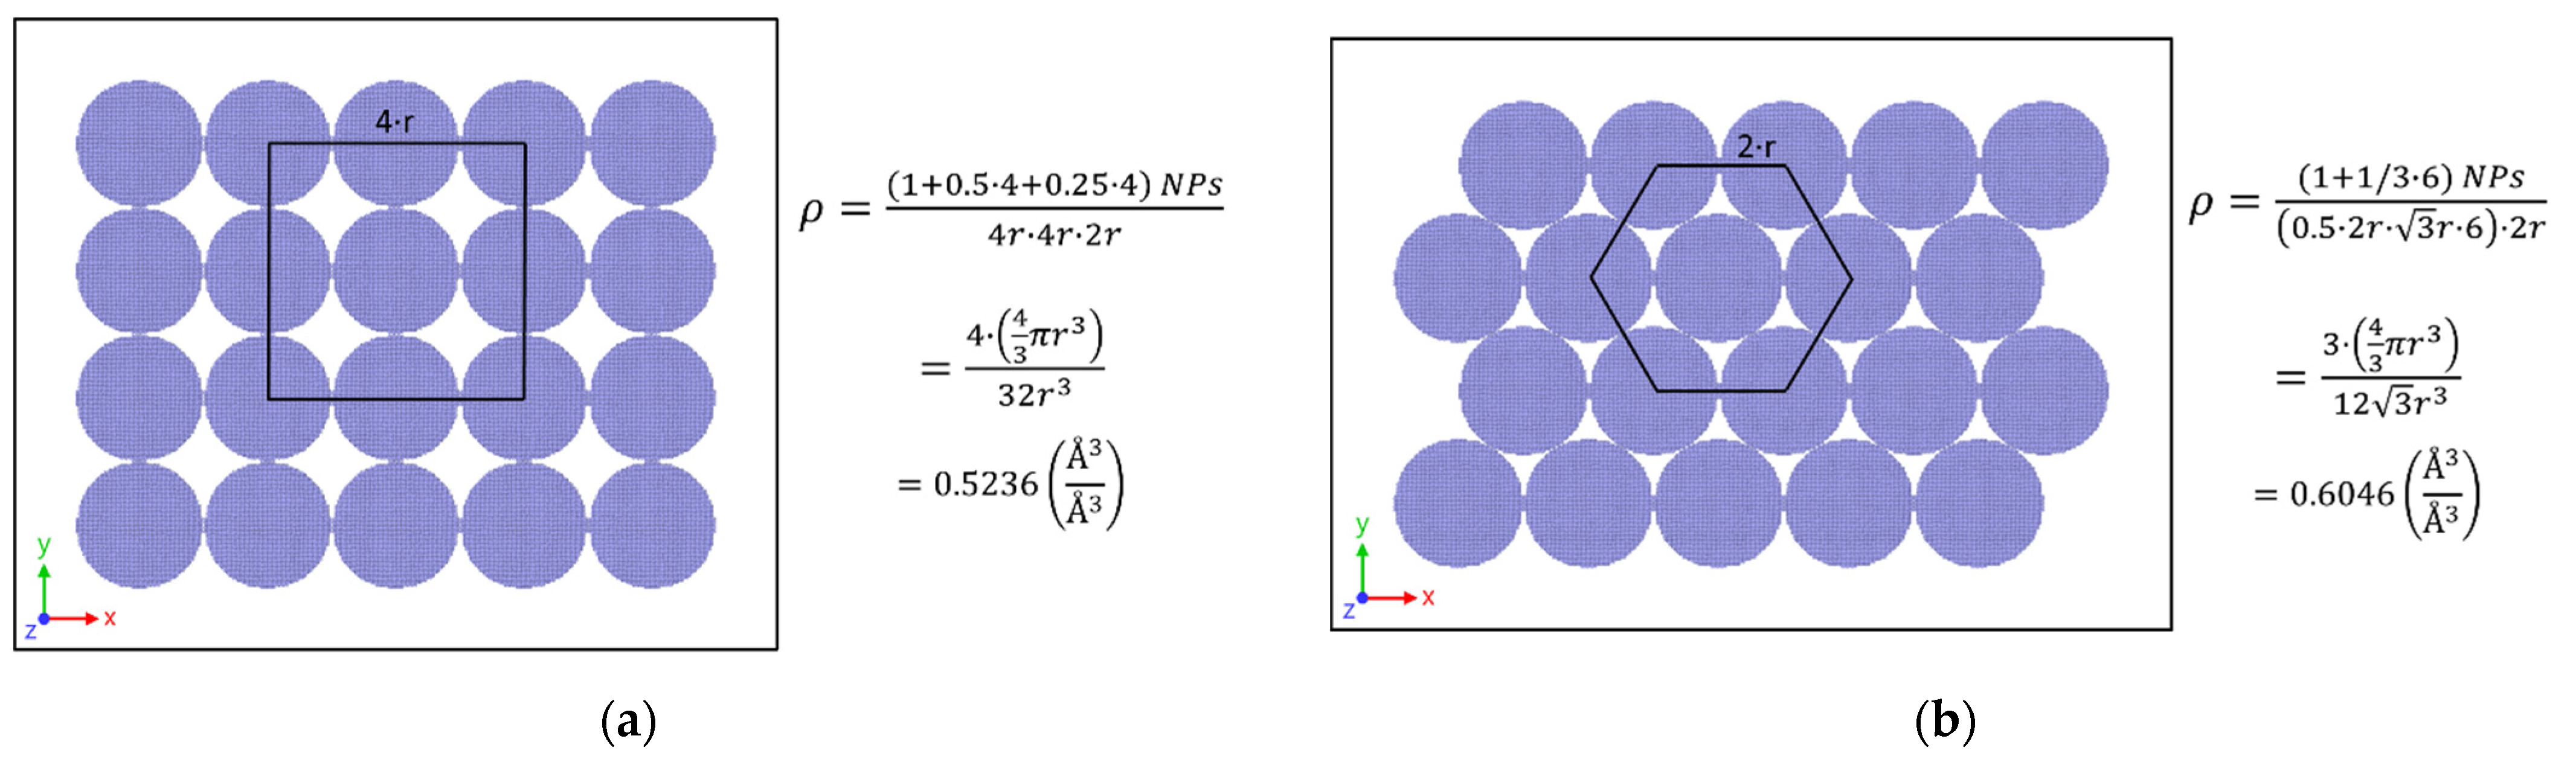
2.2. Modeling of Stacked Core–Shell NPs
2.3. Simulation Process
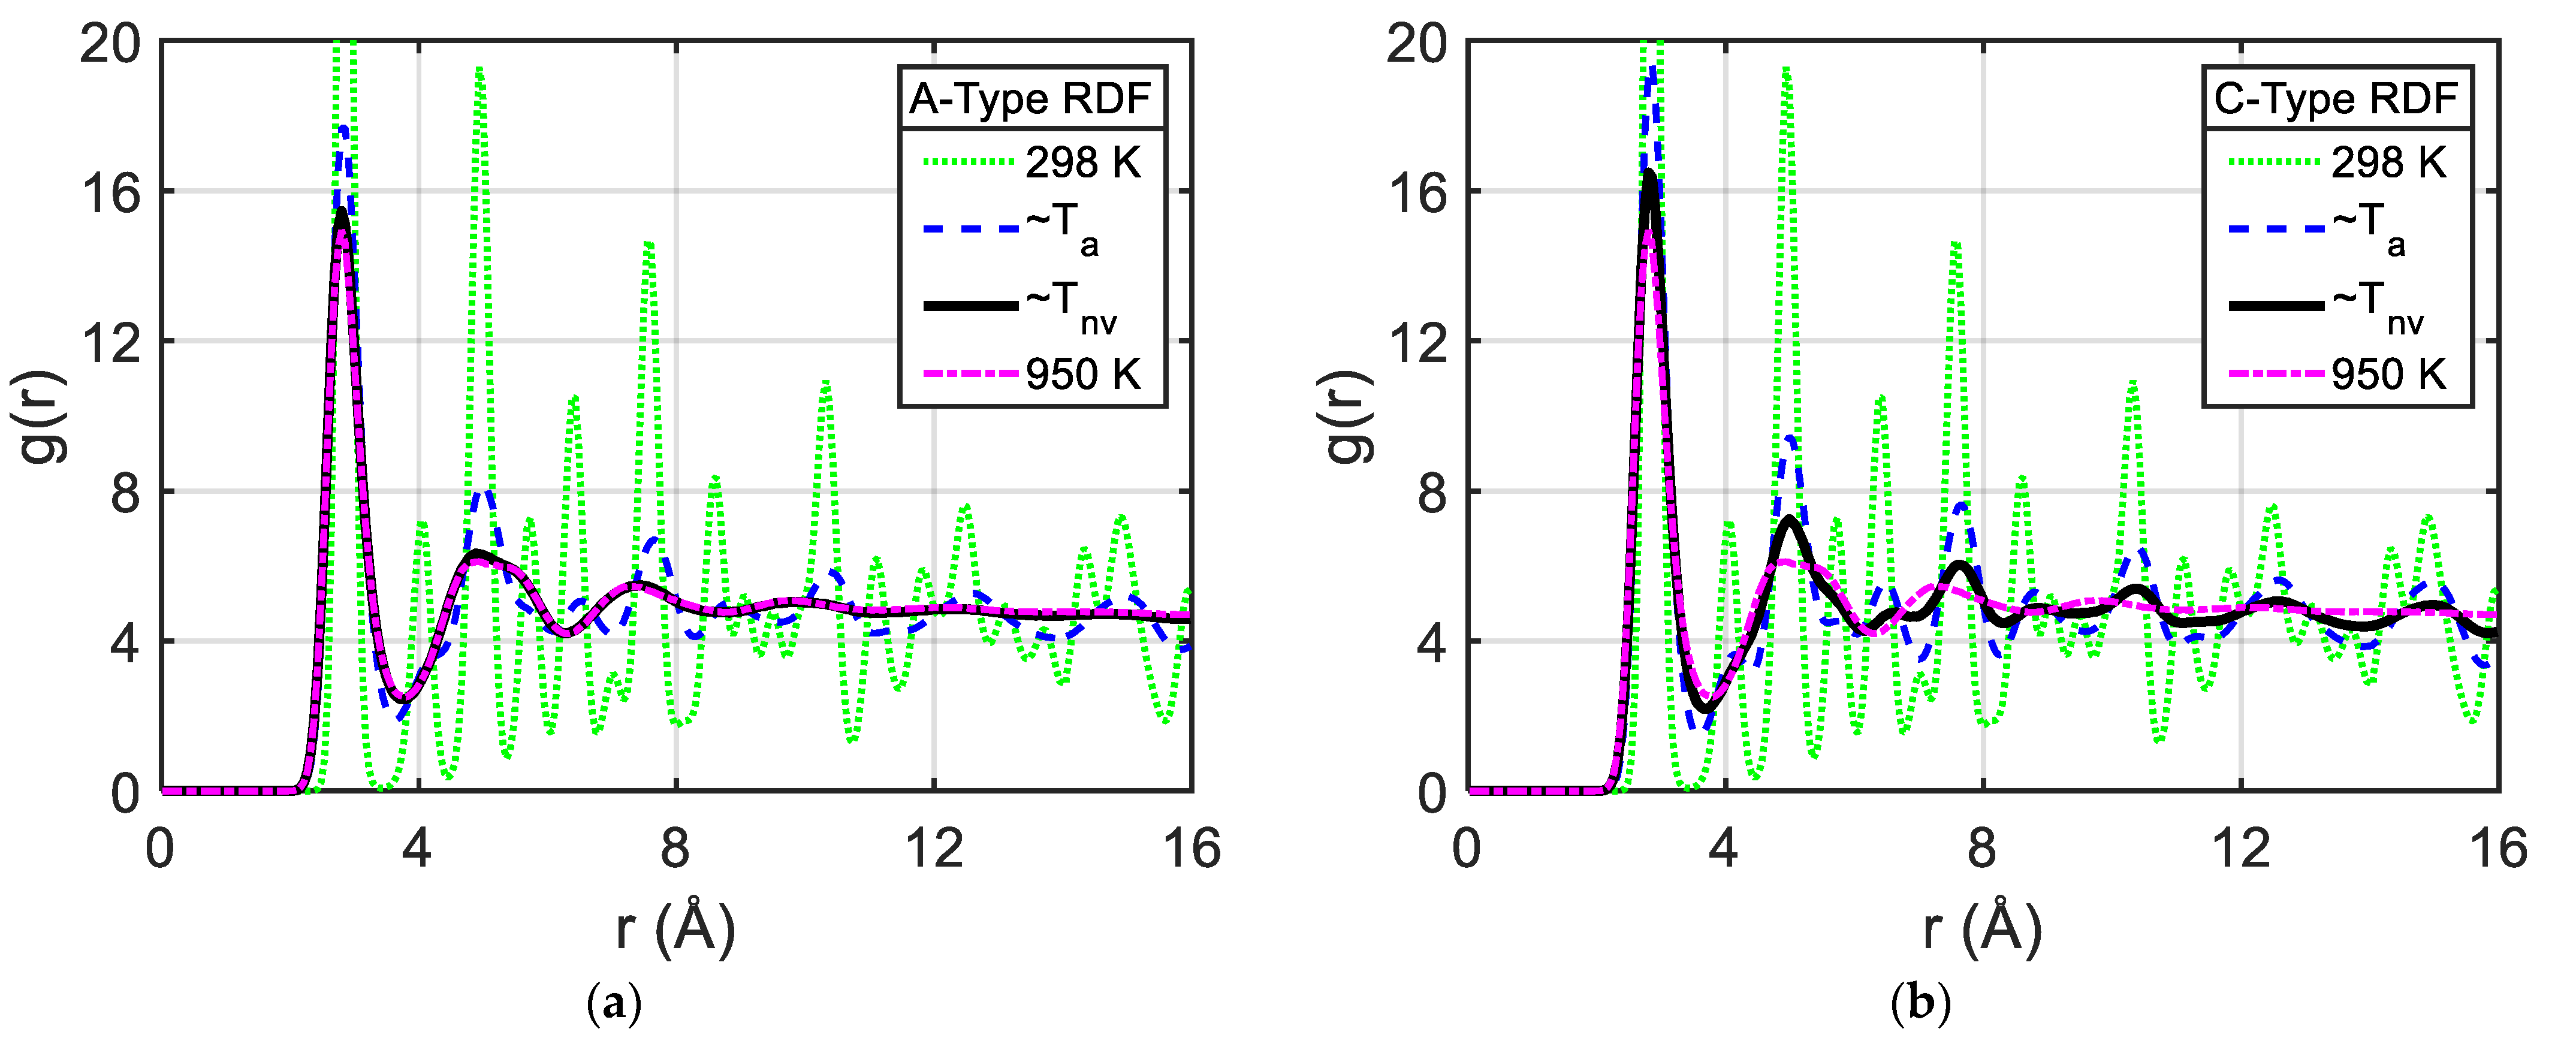
2.4. Analysis Methods
3. Results and Discussions
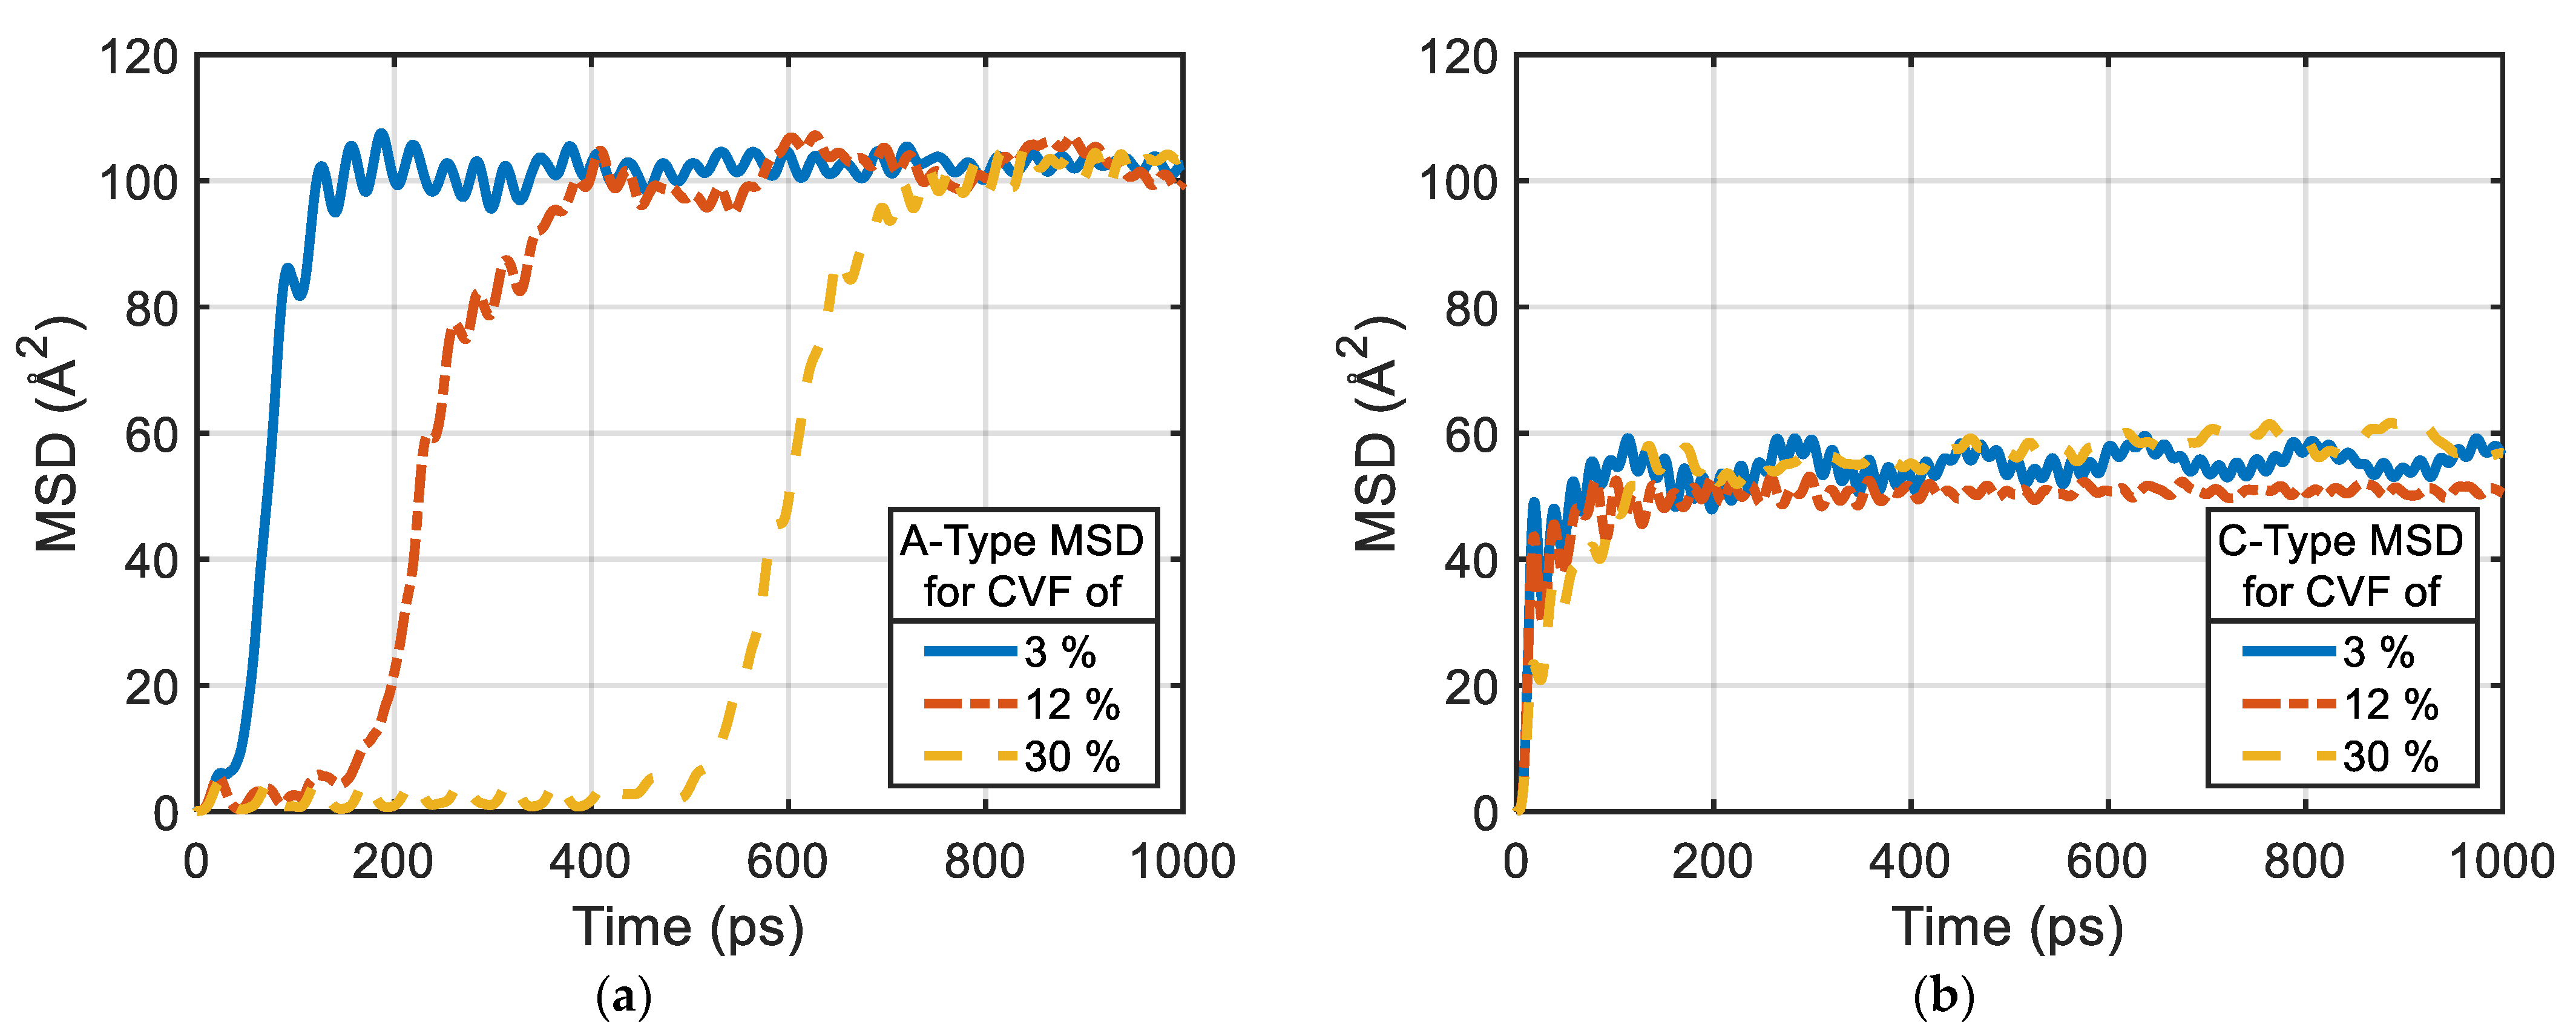
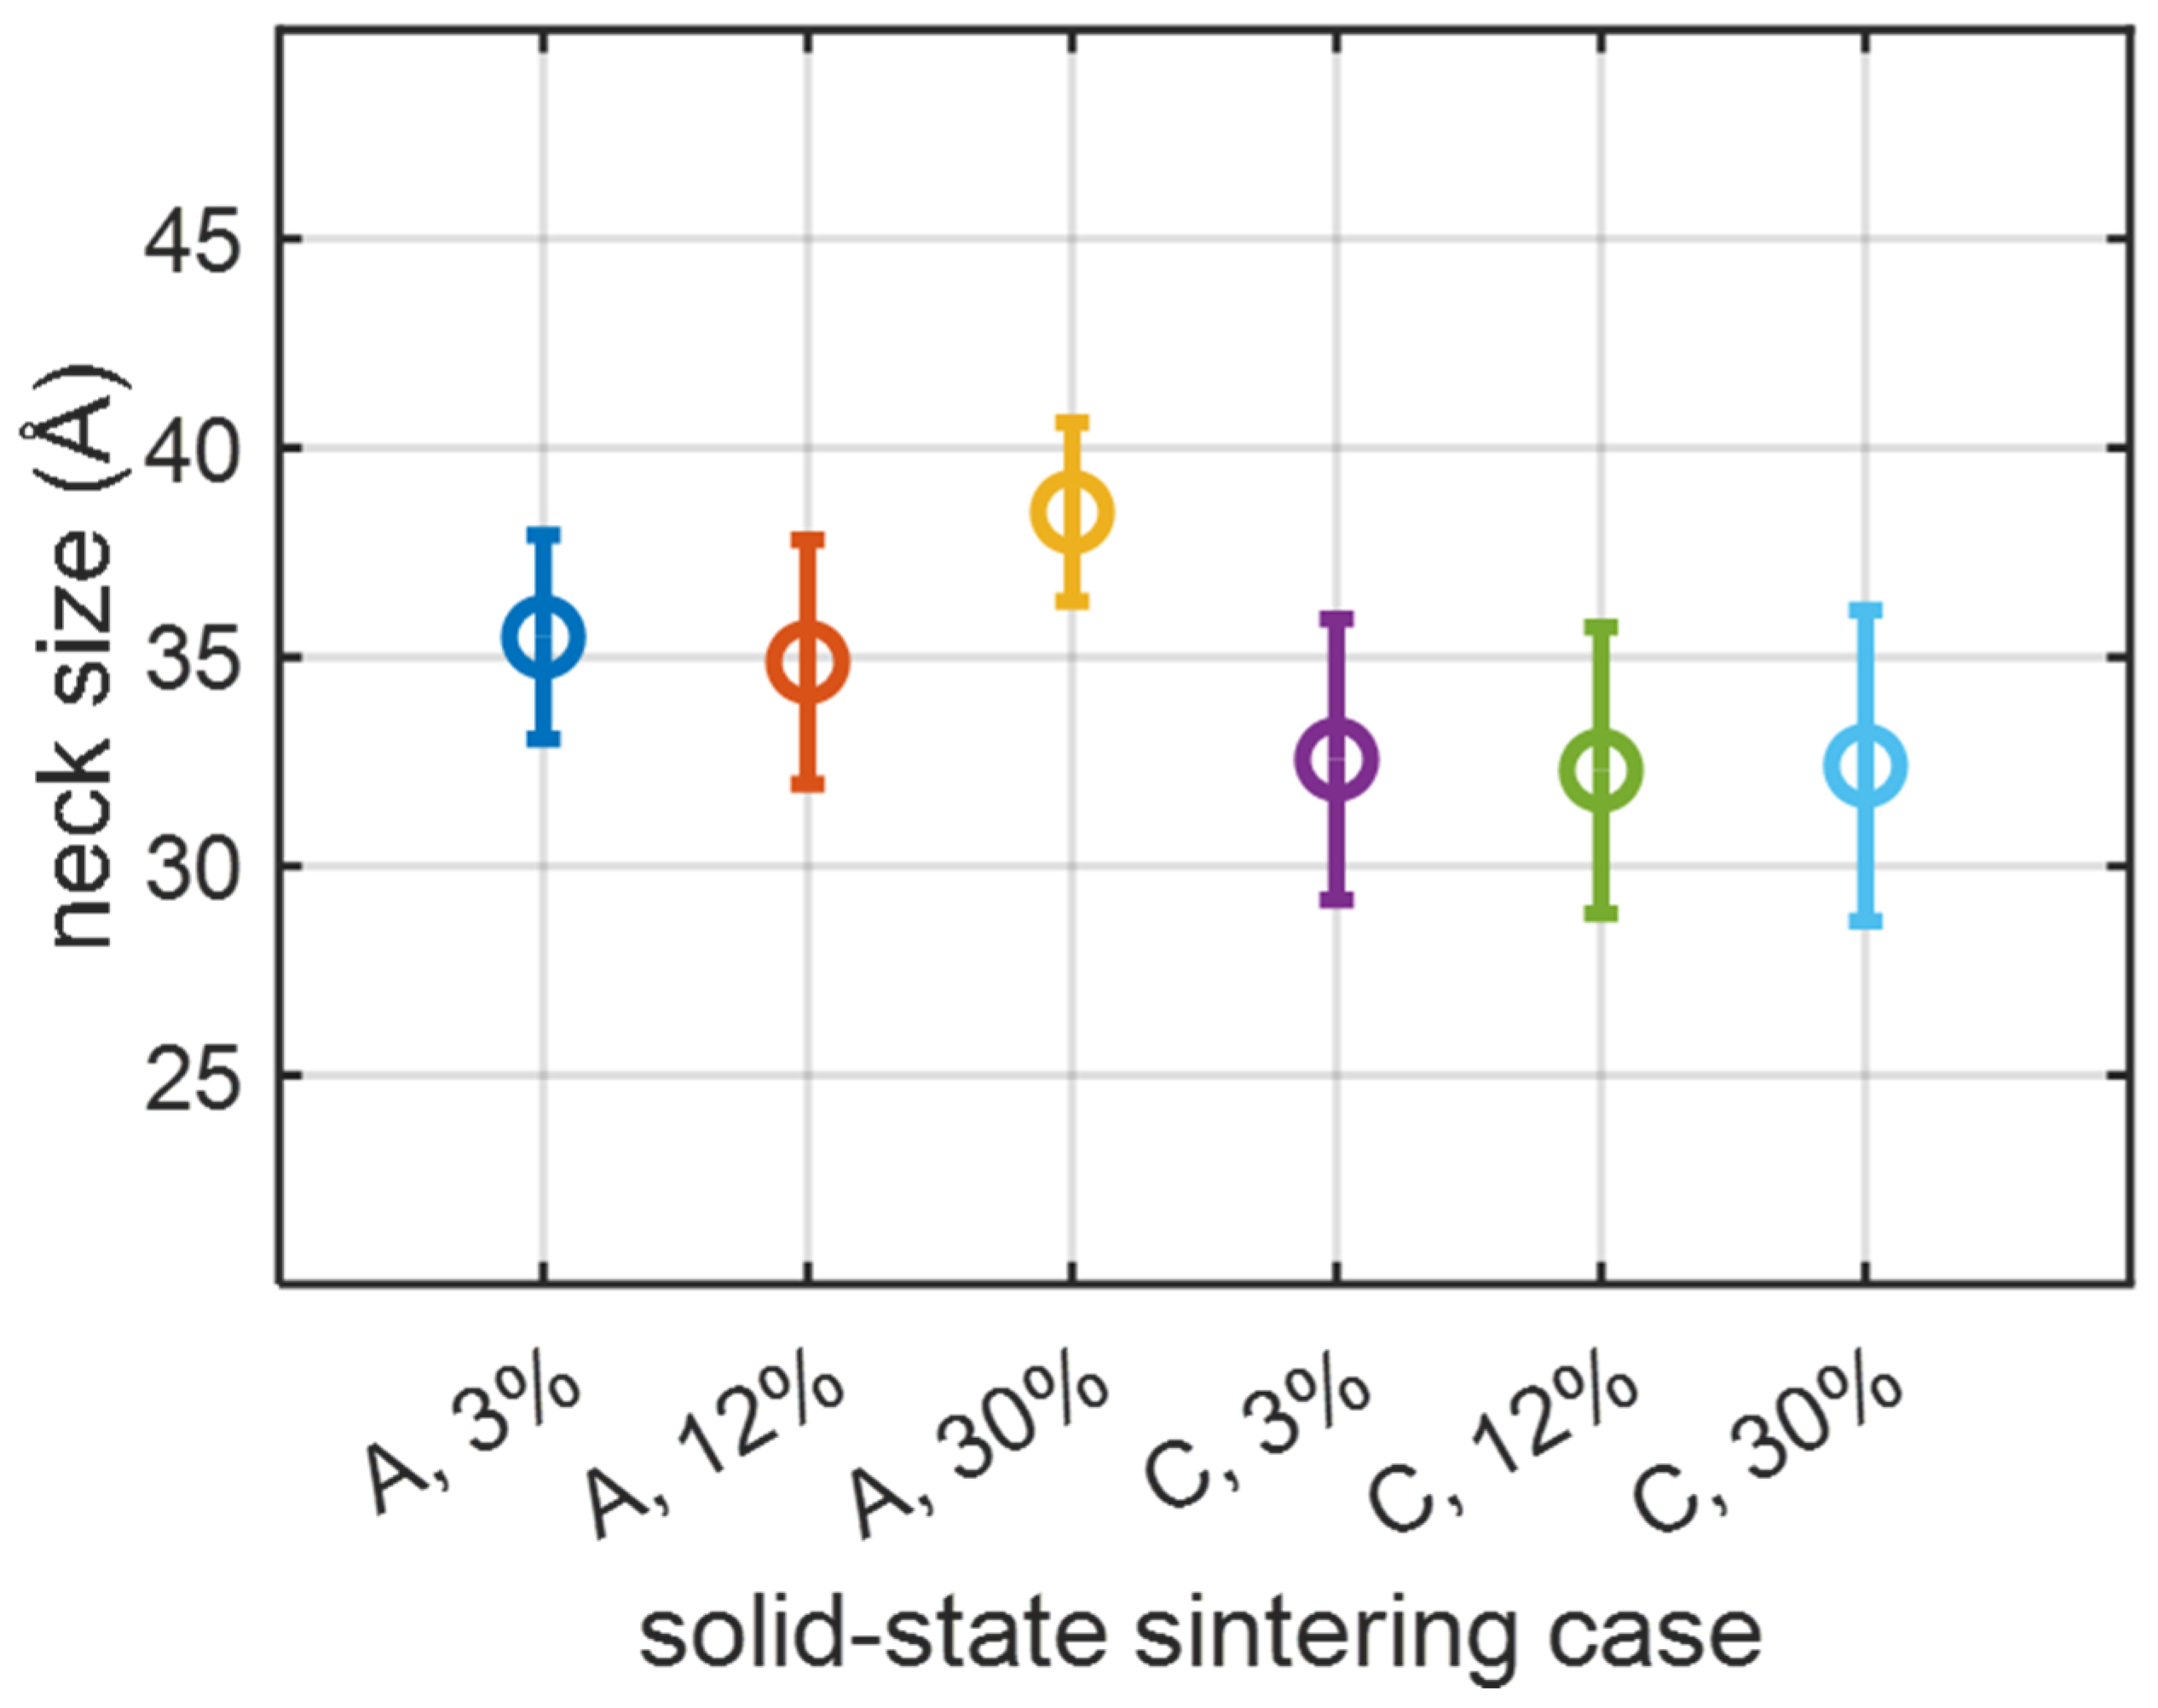
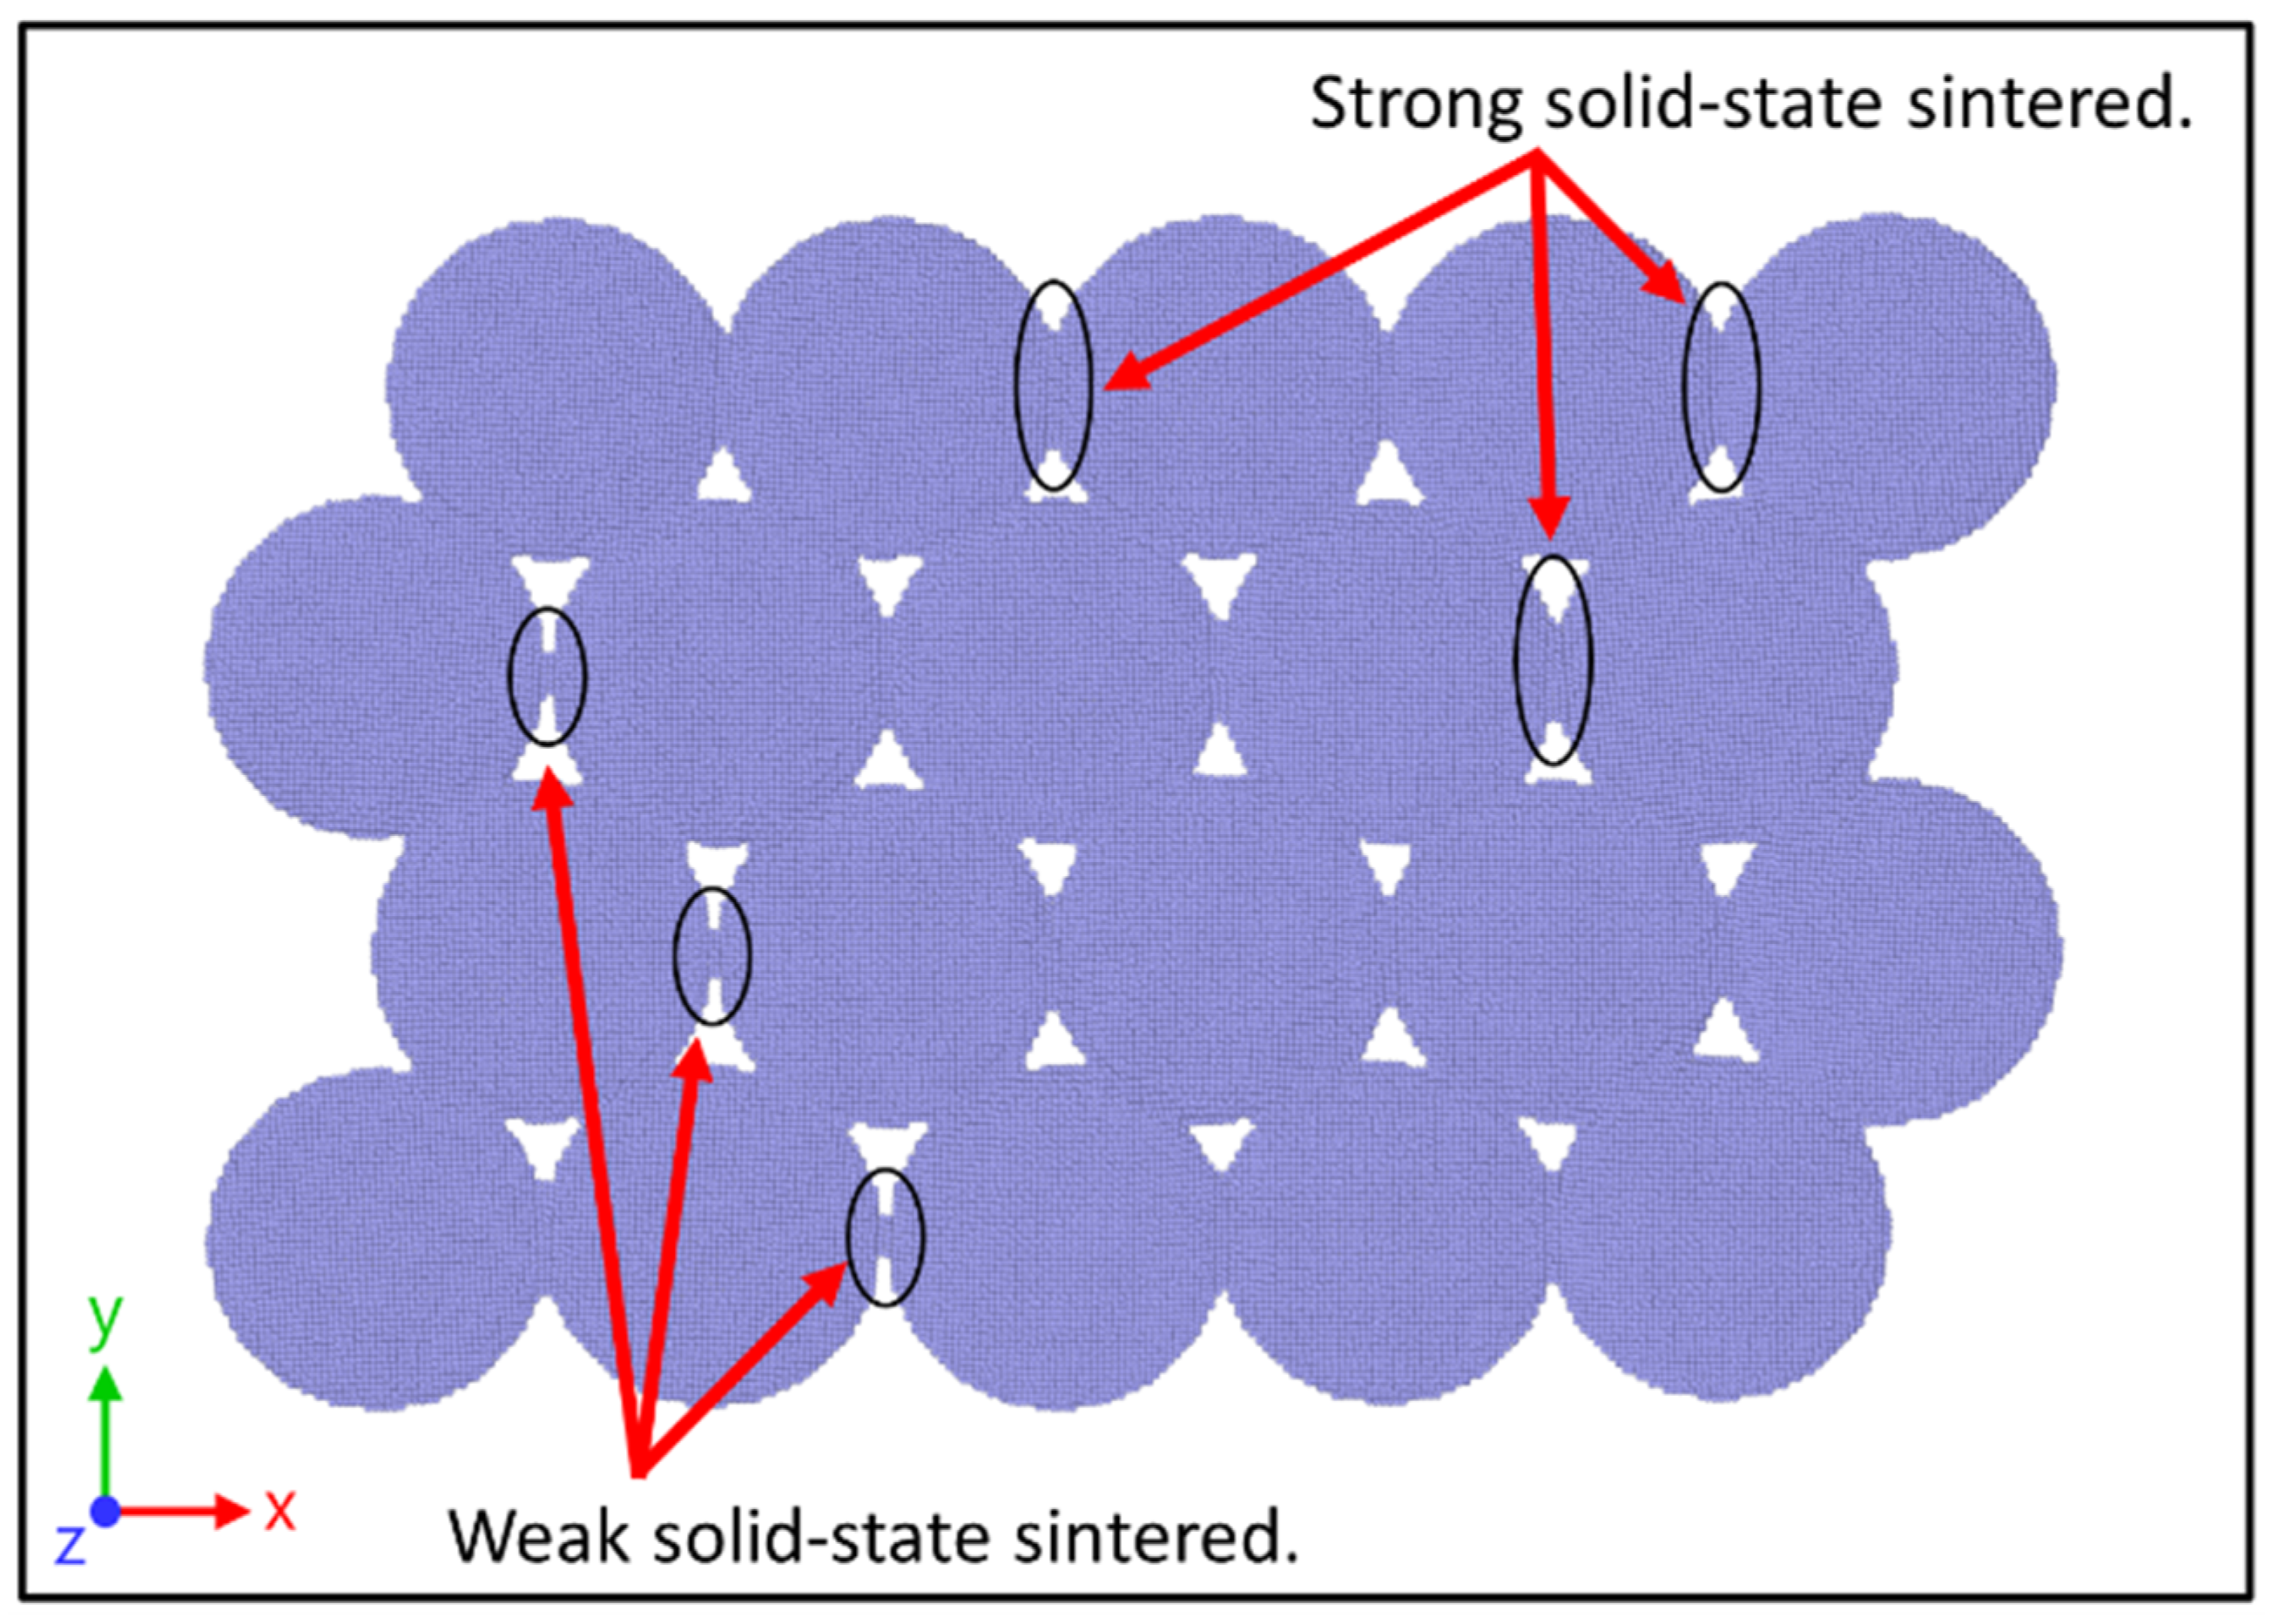
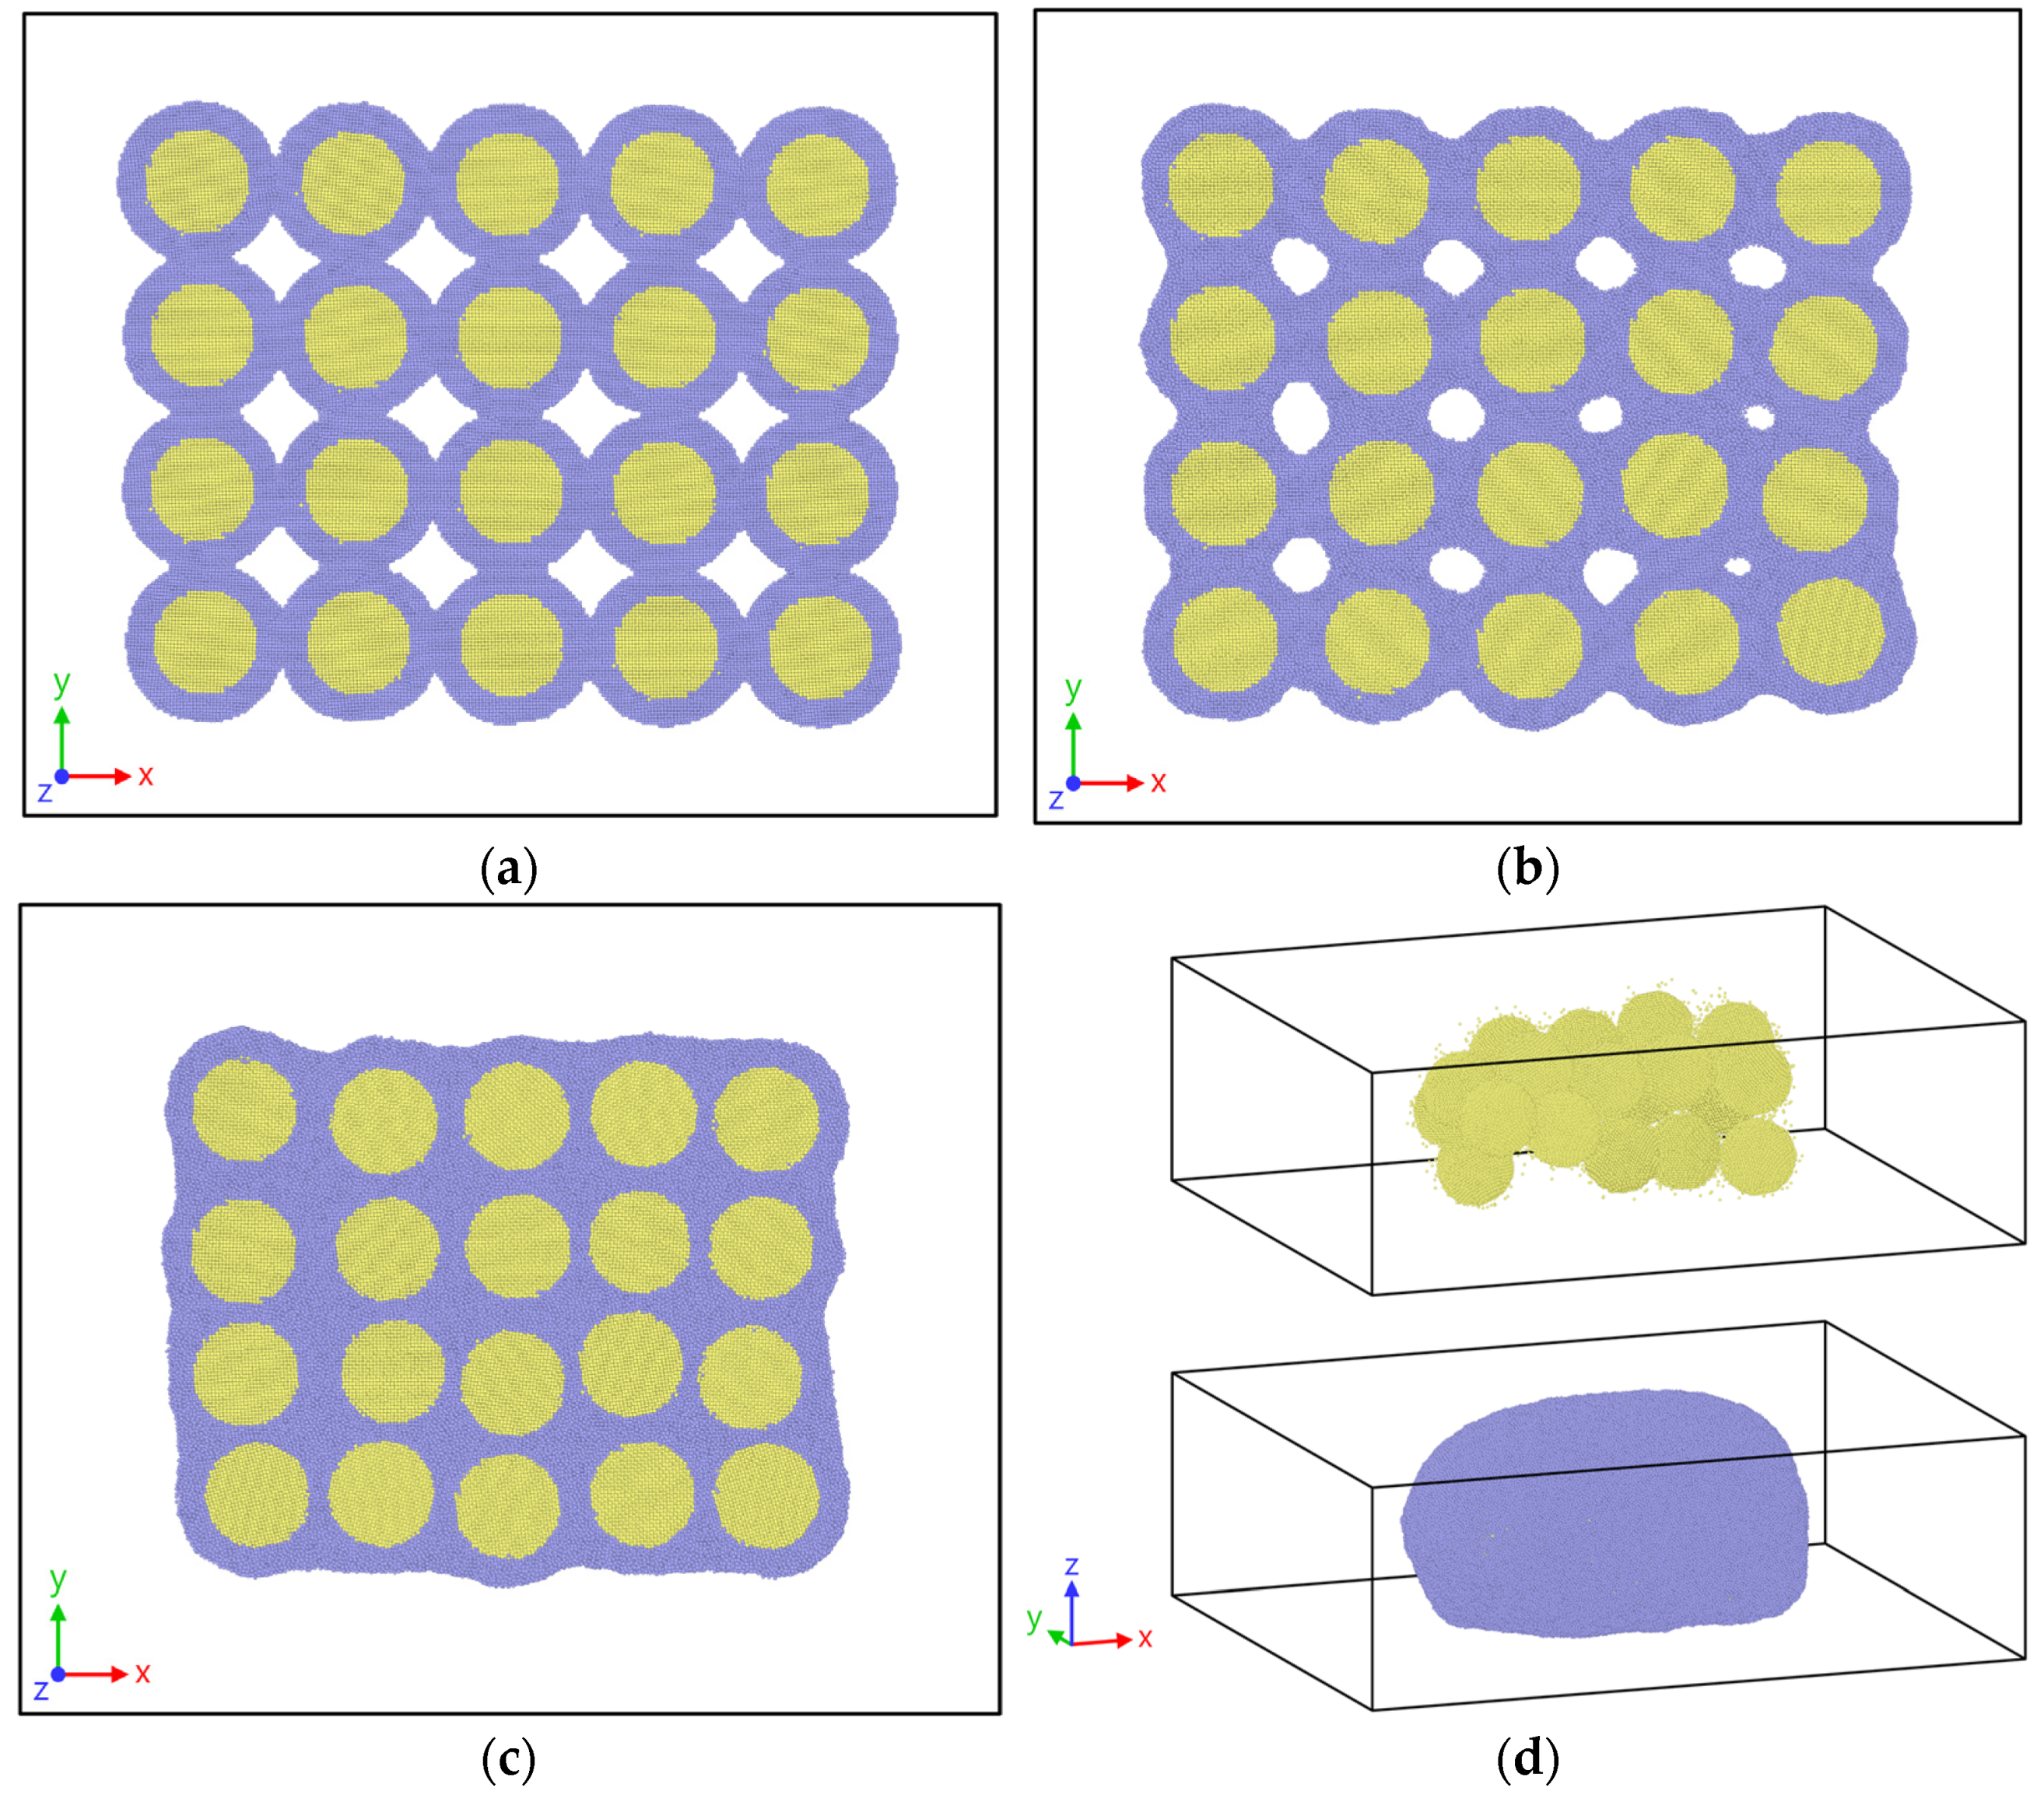
3.1. Solid-State Sintering Process
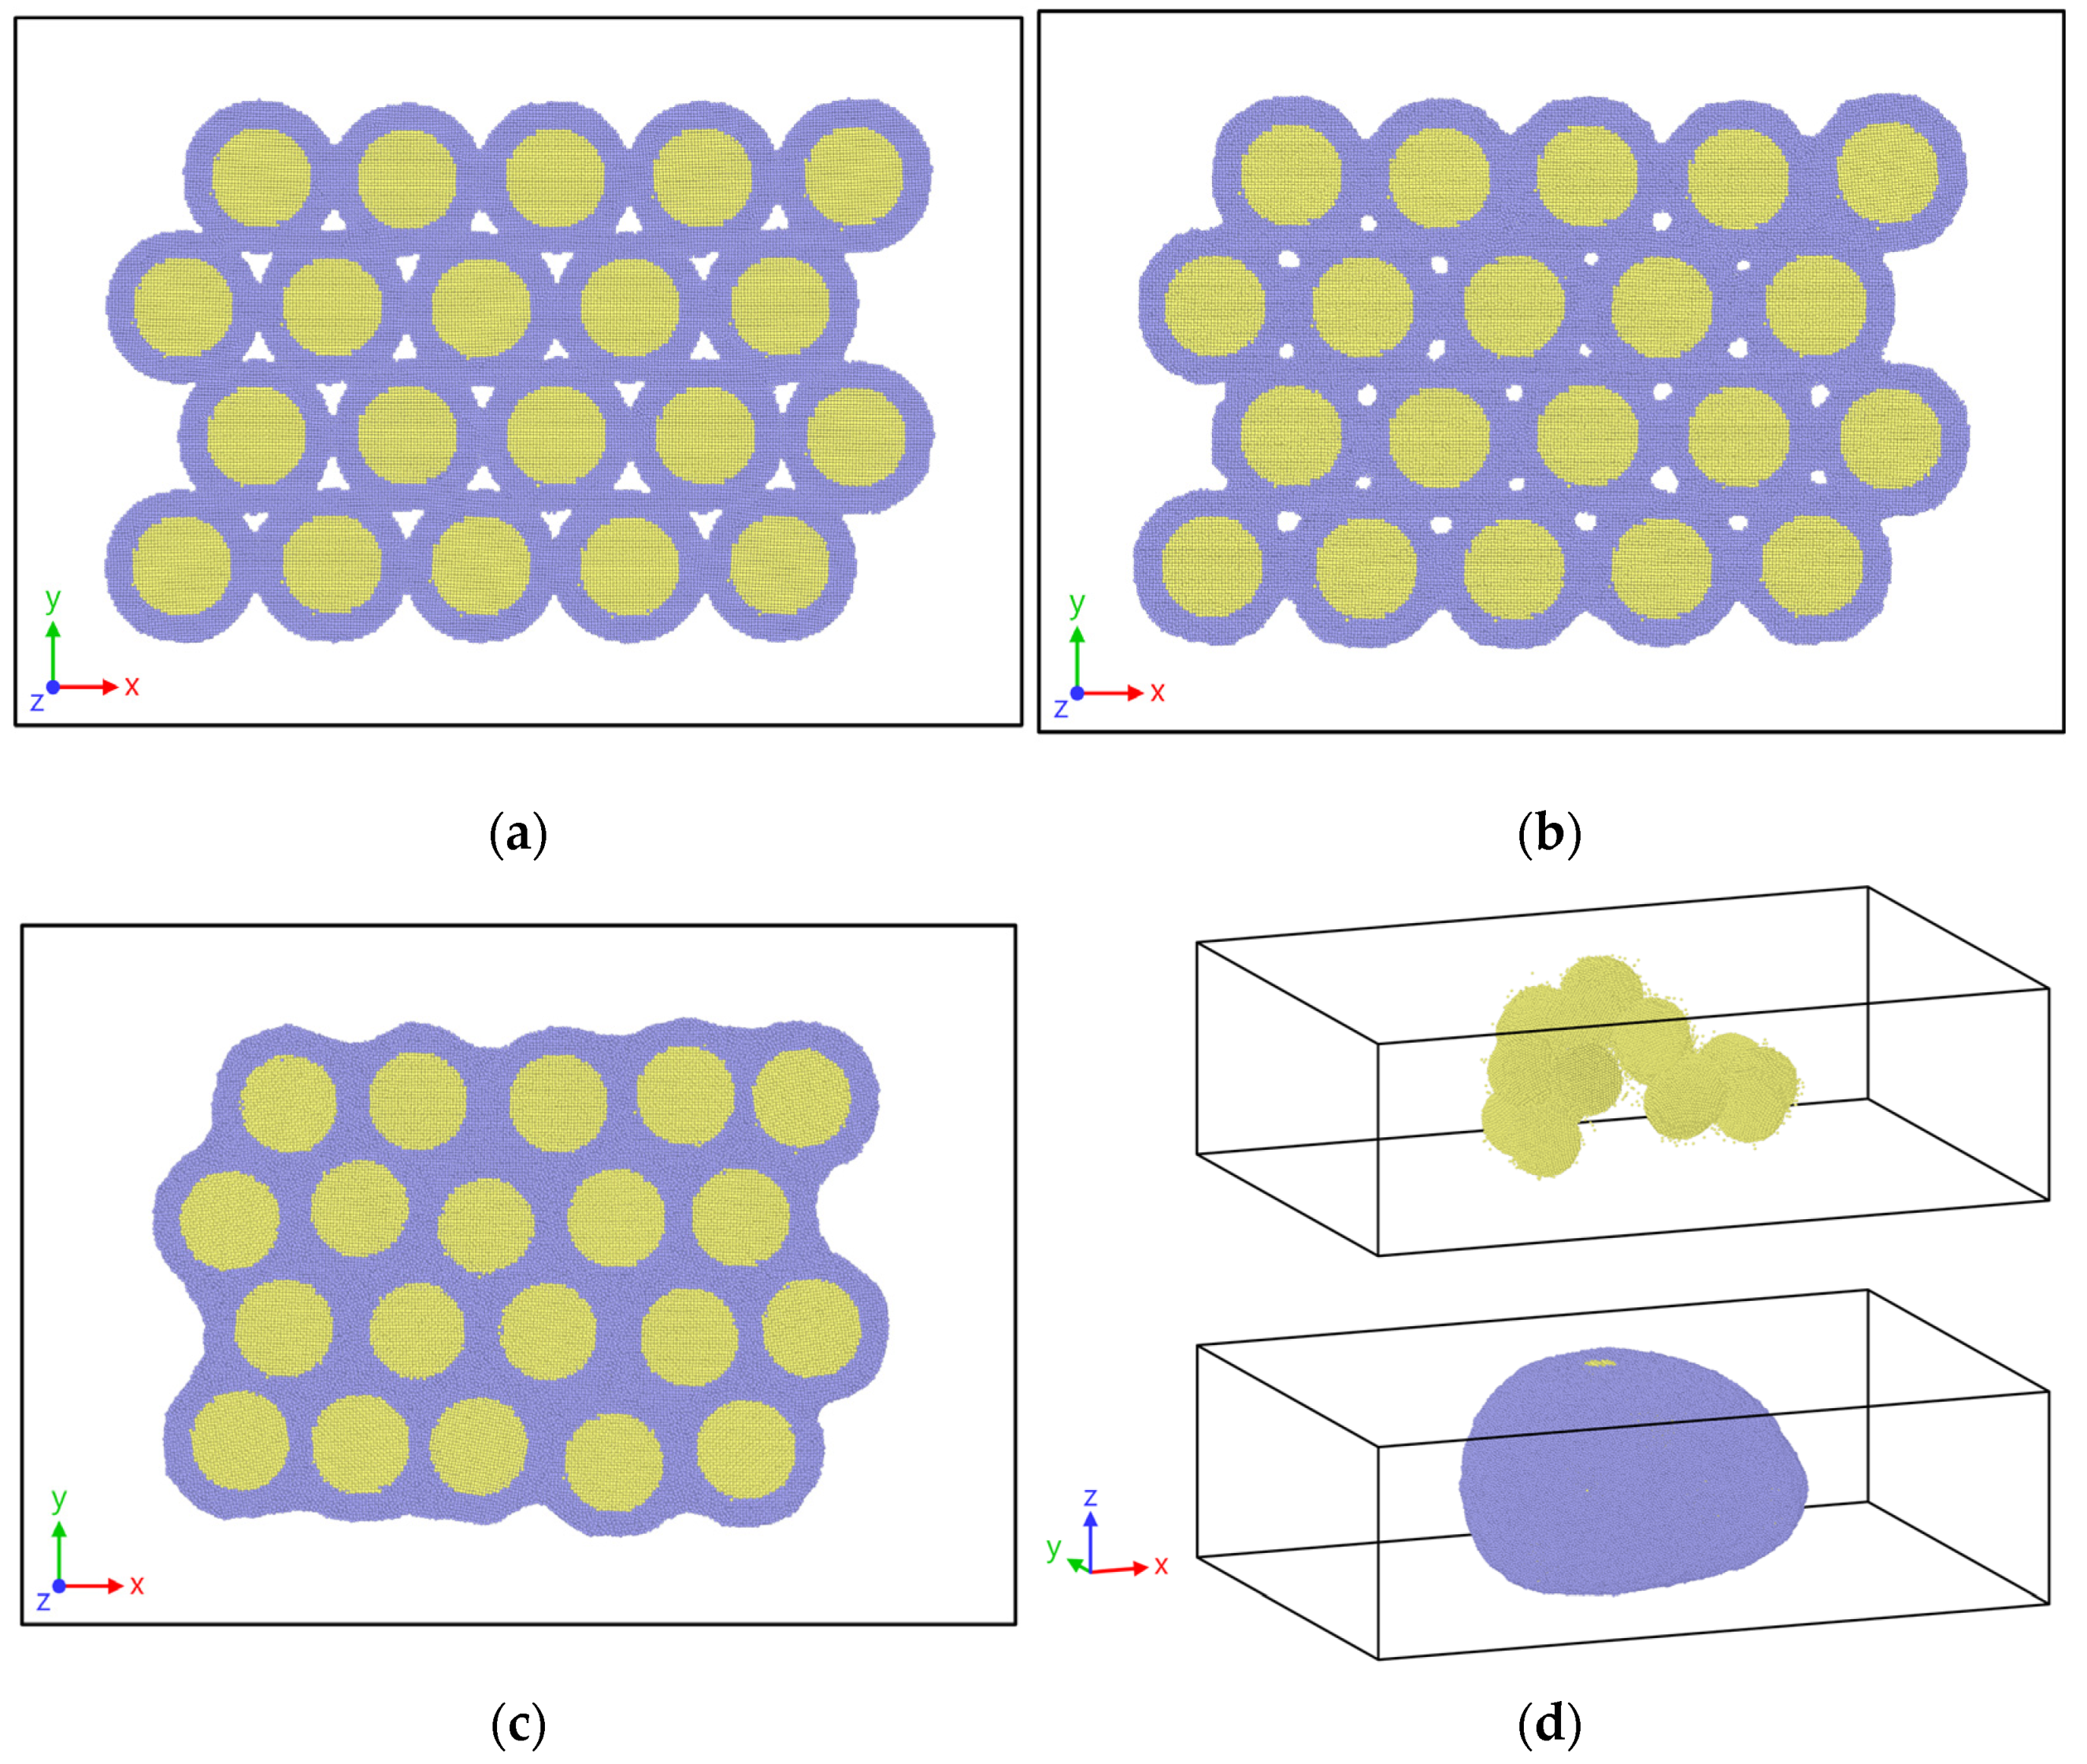
3.2. Heat Sintering Process
4. Concluding Remarks
Author Contributions
Funding
Institutional Review Board Statement
Informed Consent Statement
Data Availability Statement
Acknowledgments
Conflicts of Interest
References
- Herzog, D.; Seyda, V.; Wycisk, E.; Emmelmann, C. Additive Manufacturing of Metals. Acta Mater. 2016, 117, 371–392. [Google Scholar] [CrossRef]
- National Aeronautics and Space Administration Additive Manufacturing of Lightweight Metallic Structures. Available online: https://www.sbir.gov/node/801079 (accessed on 15 January 2022).
- Paul, C.P.; Jinoop, A.N.; Kumar, A.; Bindra, K.S. Laser-Based Metal Additive Manufacturing: Technology, Global Scenario and Our Experiences. Trans. Indian Natl. Acad. Eng. 2021, 6, 895–908. [Google Scholar] [CrossRef]
- Sudbrack, C.; Ellis, D.; Hijonos, A.; Stanford, M.; Carter, B.; Lerch, B.; Smith, T. Select Additive Manufacturing Projects at NASA Glenn Research Center. In Proceedings of the CMU Visit, Carnegie Mellon University, Pittsburgh, PA, USA, 22 April 2016. [Google Scholar]
- Lores, A.; Azurmendi, N.; Agote, I.; Zuza, E. A Review on Recent Developments in Binder Jetting Metal Additive Manufacturing: Materials and Process Characteristics. Powder Metall. 2019, 62, 267–296. [Google Scholar] [CrossRef]
- Slotwinski, J.A.; Garboczi, E.J.; Stutzman, P.E.; Ferraris, C.F.; Watson, S.S.; Peltz, M.A. Characterization of Metal Powders Used for Additive Manufacturing. J. Res. Natl. Inst. Stand. Technol. 2014, 119, 460. [Google Scholar] [CrossRef] [PubMed]
- Joshi, S.C.; Sheikh, A.A. 3D Printing in Aerospace and Its Long-Term Sustainability. Virtual Phys. Prototyp. 2015, 10, 175–185. [Google Scholar] [CrossRef]
- Greer, J.R.; Street, R.A. Thermal Cure Effects on Electrical Performance of Nanoparticle Silver Inks. Acta Mater. 2007, 55, 6345–6349. [Google Scholar] [CrossRef]
- Rapallo, A.; Olmos-Asar, J.A.; Oviedo, O.A.; Ludueña, M.; Ferrando, R.; Mariscal, M.M. Thermal Properties of Co/Au Nanoalloys and Comparison of Different Computer Simulation Techniques. J. Phys. Chem. C 2012, 116, 17210–17218. [Google Scholar] [CrossRef]
- Zhang, J.-P.; Zhang, Y.-Y.; Wang, E.-P.; Tang, C.-M.; Cheng, X.-L.; Zhang, Q.-H. Size Effect in the Melting and Freezing Behaviors of Al/Ti Core-Shell Nanoparticles Using Molecular Dynamics Simulations. Chin. Phys. B 2016, 25, 036102. [Google Scholar] [CrossRef]
- Rahmani, F.; Jeon, J.; Jiang, S.; Nouranian, S. Melting and Solidification Behavior of Cu/Al and Ti/Al Bimetallic Core/Shell Nanoparticles during Additive Manufacturing by Molecular Dynamics Simulation. J. Nanopart. Res. 2018, 20, 133. [Google Scholar] [CrossRef]
- Jeon, J.; Jiang, S.; Rahmani, F.; Nouranian, S. Molecular Dynamics Study of Temperature and Heating Rate–Dependent Sintering of Titanium Nanoparticles and Its Influence on the Sequent Tension Tests of the Formed Particle-Chain Products. J. Nanopart. Res. 2020, 22, 26. [Google Scholar] [CrossRef]
- Ghosh Chaudhuri, R.; Paria, S. Core/Shell Nanoparticles: Classes, Properties, Synthesis Mechanisms, Characterization, and Applications. Chem. Rev. 2012, 112, 2373–2433. [Google Scholar] [CrossRef]
- Gawande, M.B.; Goswami, A.; Asefa, T.; Guo, H.; Biradar, A.V.; Peng, D.-L.; Zboril, R.; Varma, R.S. Core–Shell Nanoparticles: Synthesis and Applications in Catalysis and Electrocatalysis. Chem. Soc. Rev. 2015, 44, 7540–7590. [Google Scholar] [CrossRef] [PubMed]
- Mélinon, P.; Begin-Colin, S.; Duvail, J.L.; Gauffre, F.; Boime, N.H.; Ledoux, G.; Plain, J.; Reiss, P.; Silly, F.; Warot-Fonrose, B. Engineered Inorganic Core/Shell Nanoparticles. Phys. Rep. 2014, 543, 163–197. [Google Scholar] [CrossRef] [Green Version]
- Andrzejak, T.; Shafirovich, E.; Varma, A. Ignition Mechanism of Nickel-Coated Aluminum Particles. Combust. Flame 2007, 150, 60–70. [Google Scholar] [CrossRef]
- Bai, J.; Wang, J.-P. High-Magnetic-Moment Core-Shell-Type FeCo–Au/Ag Nanoparticles. Appl. Phys. Lett. 2005, 87, 152502. [Google Scholar] [CrossRef]
- Hennes, M.; Lotnyk, A.; Mayr, S.G. Plasma-Assisted Synthesis and High-Resolution Characterization of Anisotropic Elemental and Bimetallic Core–Shell Magnetic Nanoparticles. Beilstein. J. Nanotechnol. 2014, 5, 466–475. [Google Scholar] [CrossRef] [PubMed] [Green Version]
- Thaler, P.; Volk, A.; Lackner, F.; Steurer, J.; Knez, D.; Grogger, W.; Hofer, F.; Ernst, W.E. Formation of Bimetallic Core-Shell Nanowires along Vortices in Superfluid He Nanodroplets. Phys. Rev. B 2014, 90, 155442. [Google Scholar] [CrossRef]
- Haberfehlner, G.; Thaler, P.; Knez, D.; Volk, A.; Hofer, F.; Ernst, W.E.; Kothleitner, G. Formation of Bimetallic Clusters in Superfluid Helium Nanodroplets Analysed by Atomic Resolution Electron Tomography. Nat. Commun. 2015, 6, 8779. [Google Scholar] [CrossRef] [Green Version]
- Hanuš, J.; Vaidulych, M.; Kylián, O.; Choukourov, A.; Kousal, J.; Khalakhan, I.; Cieslar, M.; Solař, P.; Biederman, H. Fabrication of Ni@Ti Core–Shell Nanoparticles by Modified Gas Aggregation Source. J. Phys. D Appl. Phys. 2017, 50, 475307. [Google Scholar] [CrossRef] [Green Version]
- Zhong, C.J.; Maye, M.M. Core–Shell Assembled Nanoparticles as Catalysts. Adv. Mater. 2001, 13, 1507–1511. [Google Scholar] [CrossRef]
- Zhao, S.; Germann, T.C.; Strachan, A. Molecular Dynamics Characterization of the Response of Ni/Al Nanolaminates Under Dynamic Loading. J. Propuls. Power 2007, 23, 693–697. [Google Scholar] [CrossRef]
- Lim, I.-I.S.; Njoki, P.N.; Park, H.-Y.; Wang, X.; Wang, L.; Mott, D.; Zhong, C.-J. Gold and Magnetic Oxide/Gold Core/Shell Nanoparticles as Bio-Functional Nanoprobes. Nanotechnology 2008, 19, 305102. [Google Scholar] [CrossRef] [PubMed]
- Reiss, P.; Protière, M.; Li, L. Core/Shell Semiconductor Nanocrystals. Small 2009, 5, 154–168. [Google Scholar] [CrossRef] [PubMed]
- Yang, Z.; Yang, X.; Xu, Z. Molecular Dynamics Simulation of the Melting Behavior of Pt−Au Nanoparticles with Core−Shell Structure. J. Phys. Chem. C 2008, 112, 4937–4947. [Google Scholar] [CrossRef]
- Song, P.; Wen, D. Molecular Dynamics Simulation of a Core−Shell Structured Metallic Nanoparticle. J. Phys. Chem. C 2010, 114, 8688–8696. [Google Scholar] [CrossRef]
- Huang, R.; Wen, Y.-H.; Shao, G.-F.; Sun, S.-G. Insight into the Melting Behavior of Au–Pt Core–Shell Nanoparticles from Atomistic Simulations. J. Phys. Chem. C 2013, 117, 4278–4286. [Google Scholar] [CrossRef]
- Wang, J.; Shin, S.; Hu, A. Geometrical Effects on Sintering Dynamics of Cu–Ag Core–Shell Nanoparticles. J. Phys. Chem. C 2016, 120, 17791–17800. [Google Scholar] [CrossRef]
- Wang, J.; Shin, S. Sintering of Multiple Cu–Ag Core–Shell Nanoparticles and Properties of Nanoparticle-Sintered Structures. RSC Adv. 2017, 7, 21607–21617. [Google Scholar] [CrossRef] [Green Version]
- Li, S.; Liu, Y.; Sun, F.; Fang, H. Multi-Particle Molecular Dynamics Simulation: Shell Thickness Effects on Sintering Process of Cu-Ag Core-Shell Nanoparticles. J. Nanopart. Res. 2021, 23, 6. [Google Scholar] [CrossRef]
- Zhang, H.; Jeon, J.; Rahmani, F.; Nouranian, S.; Jiang, S. Sintered Ti/Al Core/Shell Nanoparticles: Computational Investigation of the Effects of Core Volume Fraction, Heating Rate, and Room-Temperature Relaxation on Tensile Properties. J. Phys. D Appl. Phys. 2022, 55, 025302. [Google Scholar] [CrossRef]
- Meng, F.; Huang, J. Evolution Mechanism of Photonically Sintered Nano-Silver Conductive Patterns. Nanomaterials 2019, 9, 258. [Google Scholar] [CrossRef] [PubMed] [Green Version]
- Plimpton, S. Fast Parallel Algorithms for Short-Range Molecular Dynamics. J. Comput. Phys. 1995, 117, 1–19. [Google Scholar] [CrossRef] [Green Version]
- Daw, M.S.; Baskes, M.I. Embedded-Atom Method: Derivation and Application to Impurities, Surfaces, and Other Defects in Metals. Phys. Rev. B 1984, 29, 6443–6453. [Google Scholar] [CrossRef] [Green Version]
- Daw, M.S.; Foiles, S.M.; Baskes, M.I. The Embedded-Atom Method: A Review of Theory and Applications. Mater. Sci. Rep. 1993, 9, 251–310. [Google Scholar] [CrossRef] [Green Version]
- Connerade, J.-P. Quasi-Atoms and Super-Atoms. Phys. Scr. 2003, 68, C25–C32. [Google Scholar] [CrossRef]
- Zope, R.R.; Mishin, Y. Interatomic Potentials for Atomistic Simulations of the Ti-Al System. Phys. Rev. B 2003, 68, 024102. [Google Scholar] [CrossRef] [Green Version]
- Hirel, P. Atomsk: A Tool for Manipulating and Converting Atomic Data Files. Comput. Phys. Commun. 2015, 197, 212–219. [Google Scholar] [CrossRef]
- Xiong, S.; Qi, W.; Huang, B.; Wang, M.; Li, Y.; Li, Z.; Liang, S. Size- and Temperature-Induced Phase Transformations of Titanium Nanoparticles. EPL 2011, 93, 66002. [Google Scholar] [CrossRef]
- Yang, J.X.; Zhao, H.L.; Gong, H.R.; Song, M.; Ren, Q.Q. Proposed Mechanism of HCP → FCC Phase Transition in Titianium through First Principles Calculation and Experiments. Sci. Rep. 2018, 8, 1992. [Google Scholar] [CrossRef] [Green Version]
- Han, G.; Lu, X.; Xia, Q.; Lei, B.; Yan, Y.; Shang, C.J. Face-Centered-Cubic Titanium—A New Crystal Structure of Ti in a Ti-8Mo-6Fe Alloy. J. Alloy. Compd. 2018, 748, 943–952. [Google Scholar] [CrossRef]
- Bai, F.; Yin, L.; Zhao, W.; Zhou, H.; Song, M.; Liu, Y.; Liu, X. Deformational Behavior of Face-Centered Cubic (FCC) Phase in High-Pure Titanium. Mater. Sci. Eng. A 2021, 800, 140287. [Google Scholar] [CrossRef]
- Nosé, S. A Unified Formulation of the Constant Temperature Molecular Dynamics Methods. J. Chem. Phys. 1984, 81, 511–519. [Google Scholar] [CrossRef] [Green Version]
- Hoover, W.G. Canonical Dynamics: Equilibrium Phase-Space Distributions. Phys. Rev. A 1985, 31, 1695–1697. [Google Scholar] [CrossRef] [Green Version]
- Gan, Y.; Jiang, S. Ultrafast Laser-Induced Premelting and Structural Transformation of Gold Nanorod. J. Appl. Phys. 2013, 113, 073507. [Google Scholar] [CrossRef]
- Jiang, S.; Gan, Y. Atomic-Level Modeling of Ultrafast Laser Interaction with Semiconductor. In Femtosecond Lasers: New Research; Zhang, Y., Ed.; Nova Science Publishers, Inc.: Hauppauge, NY, USA, 2013; pp. 103–136. ISBN 978-1-62948-059-6. [Google Scholar]
- Pronko, P.P.; VanRompay, P.A.; Horvath, C.; Loesel, F.; Juhasz, T.; Liu, X.; Mourou, G. Avalanche Ionization and Dielectric Breakdown in Silicon with Ultrafast Laser Pulses. Phys. Rev. B 1998, 58, 2387–2390. [Google Scholar] [CrossRef]
- Stukowski, A. Visualization and Analysis of Atomistic Simulation Data with OVITO–the Open Visualization Tool. Model. Simul. Mater. Sci. Eng. 2010, 18, 015012. [Google Scholar] [CrossRef]
- Faken, D.; Jónsson, H. Systematic Analysis of Local Atomic Structure Combined with 3D Computer Graphics. Comput. Mater. Sci. 1994, 2, 279–286. [Google Scholar] [CrossRef]
- Jiang, S.; Zhang, Y.; Gan, Y.; Chen, Z.; Peng, H. Molecular Dynamics Study of Neck Growth in Laser Sintering of Hollow Silver Nanoparticles with Different Heating Rates. J. Phys. D Appl. Phys. 2013, 46, 335302. [Google Scholar] [CrossRef]


| A-Type | C-Type | ||||
|---|---|---|---|---|---|
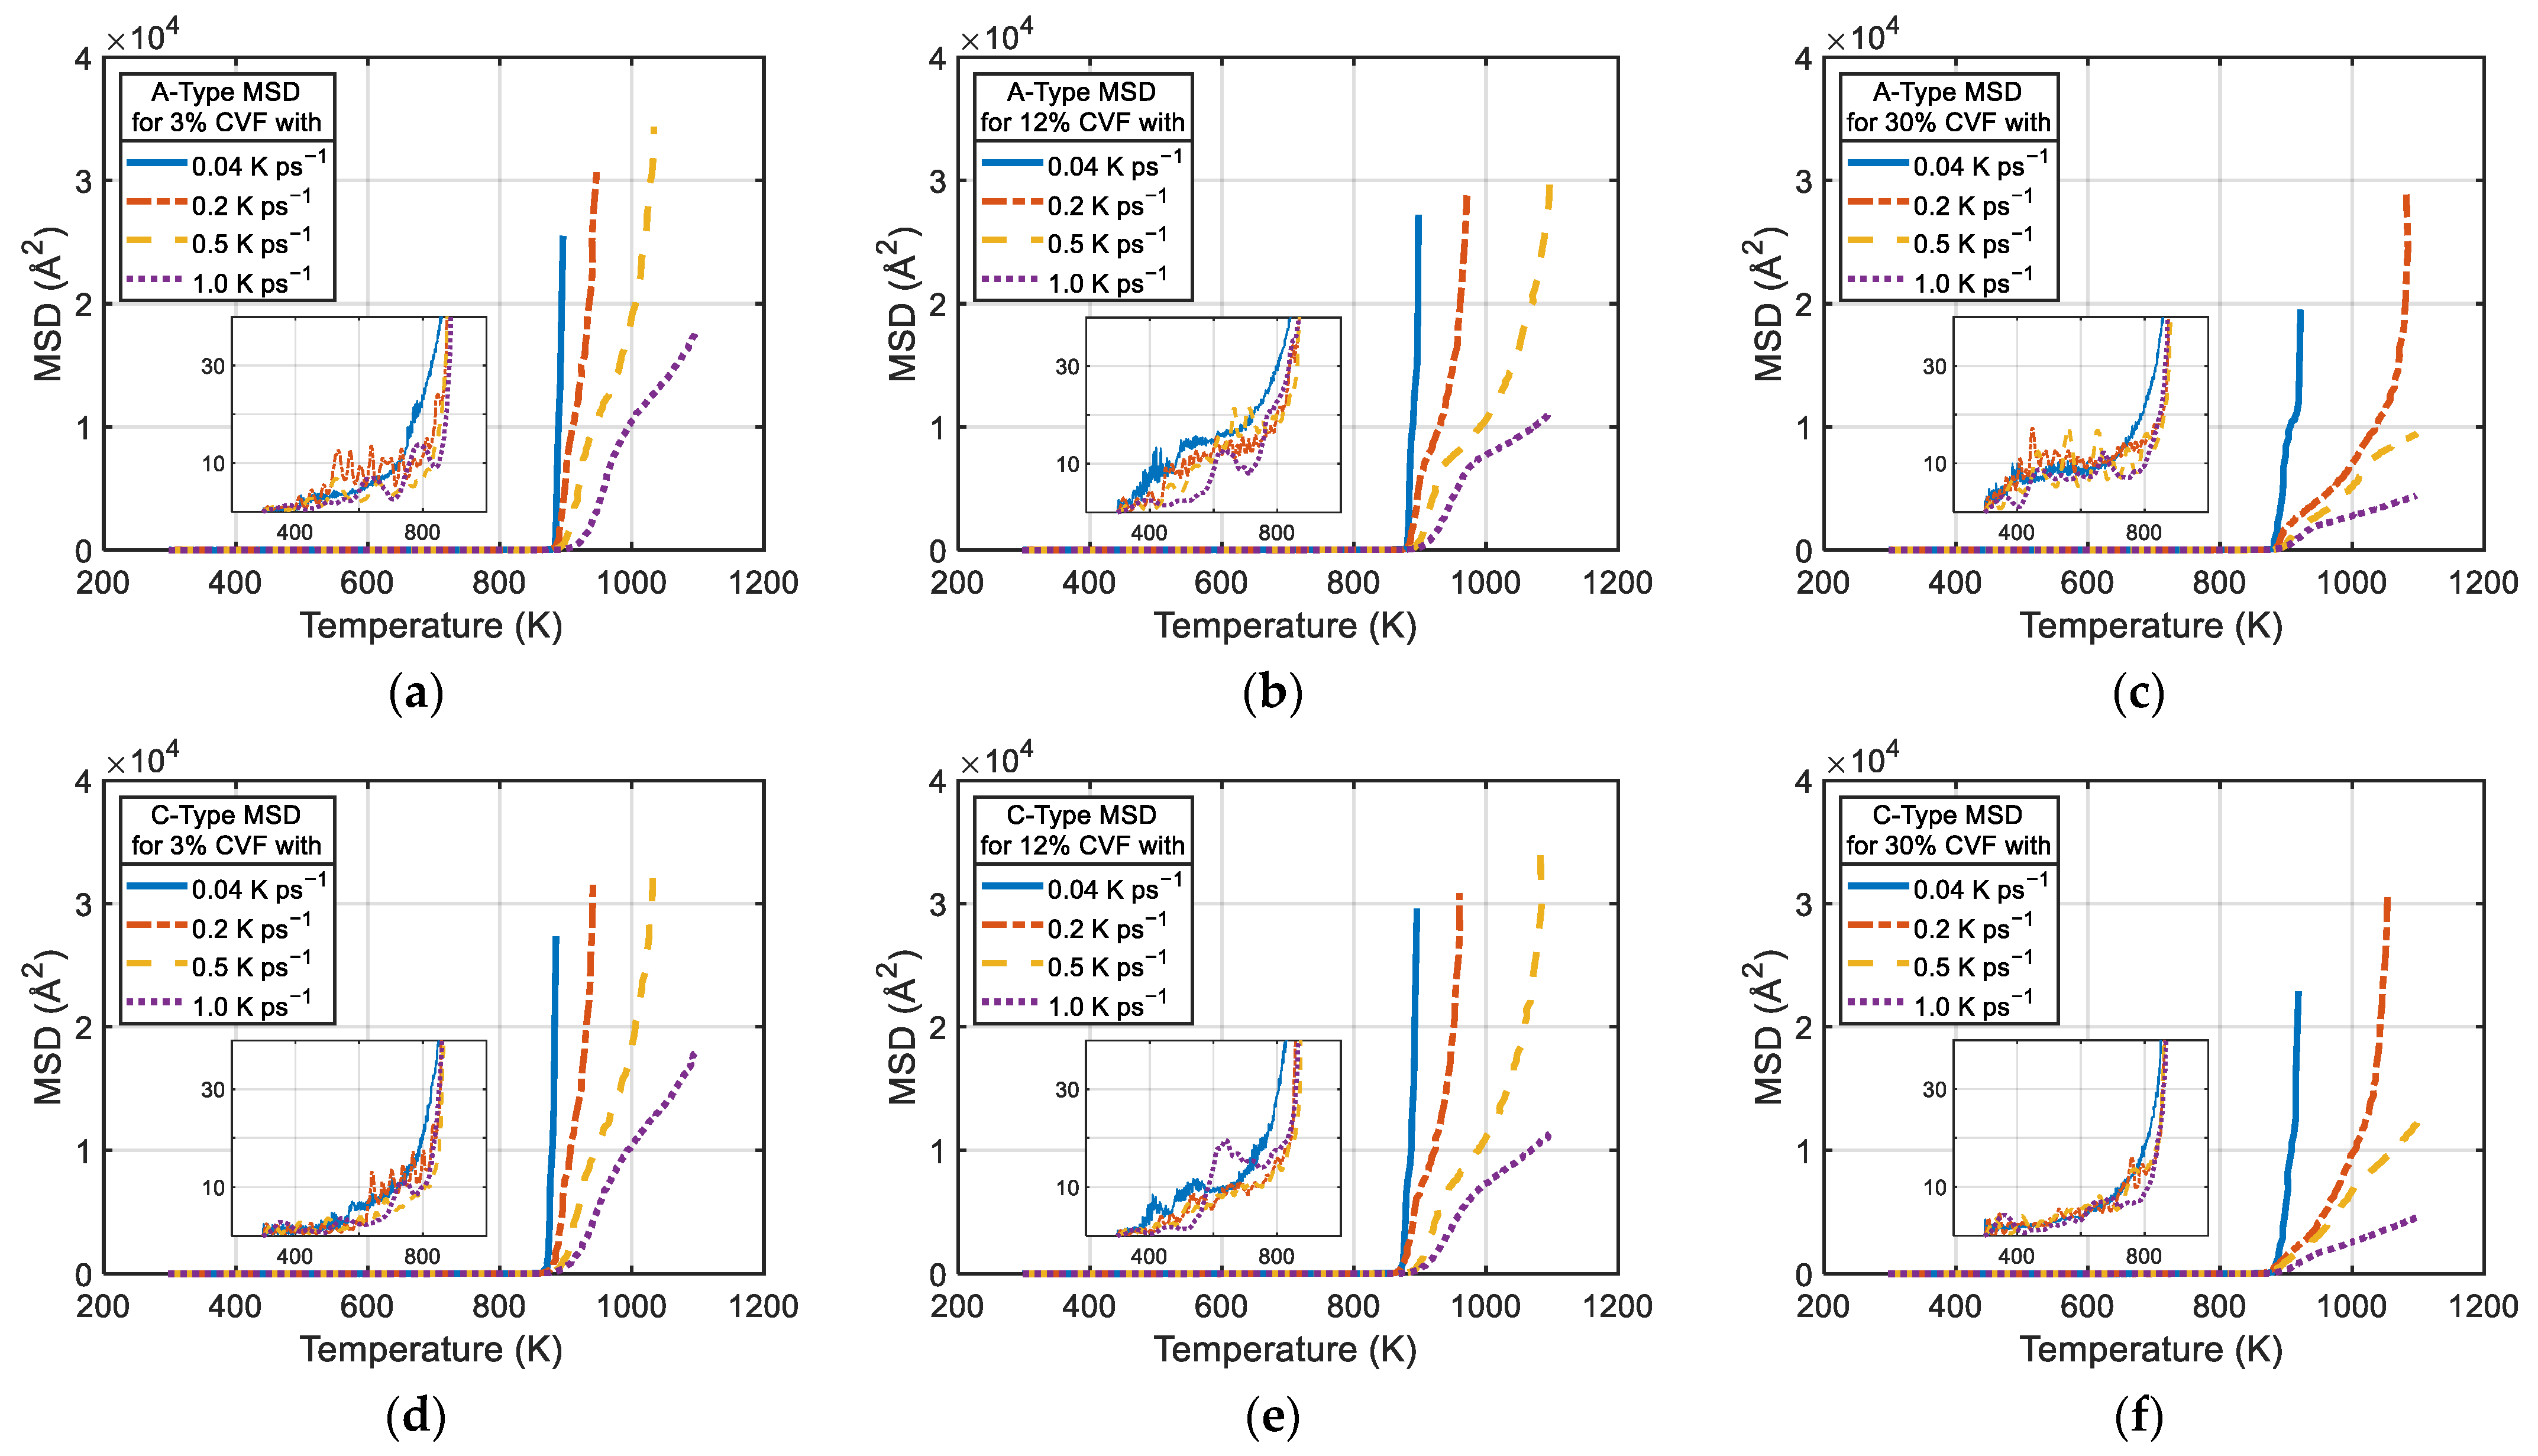
| HR (K ps−1) | CFV | Ta (K) | Tnv (K) | Ta (K) | Tnv (K) |
| 0.04 | 3% | 882 | 886 | 810 | 862 |
| 12% | 874 | 882 | 812 | 860 | |
| 30% | 880 | 886 | 812 | 860 | |
| 0.2 | 3% | 876 | 892 | 830 | 876 |
| 12% | 882 | 890 | 834 | 886 | |
| 30% | 878 | 892 | 836 | 882 | |
| 0.5 | 3% | 886 | 904 | 846 | 884 |
| 12% | 886 | 906 | 848 | 884 | |
| 30% | 888 | 910 | 850 | 888 | |
| 1.0 | 3% | 900 | 918 | 852 | 890 |
| 12% | 902 | 922 | 856 | 892 | |
| 30% | 892 | 920 | 856 | 894 | |
| A-Type | C-Type | ||
|---|---|---|---|
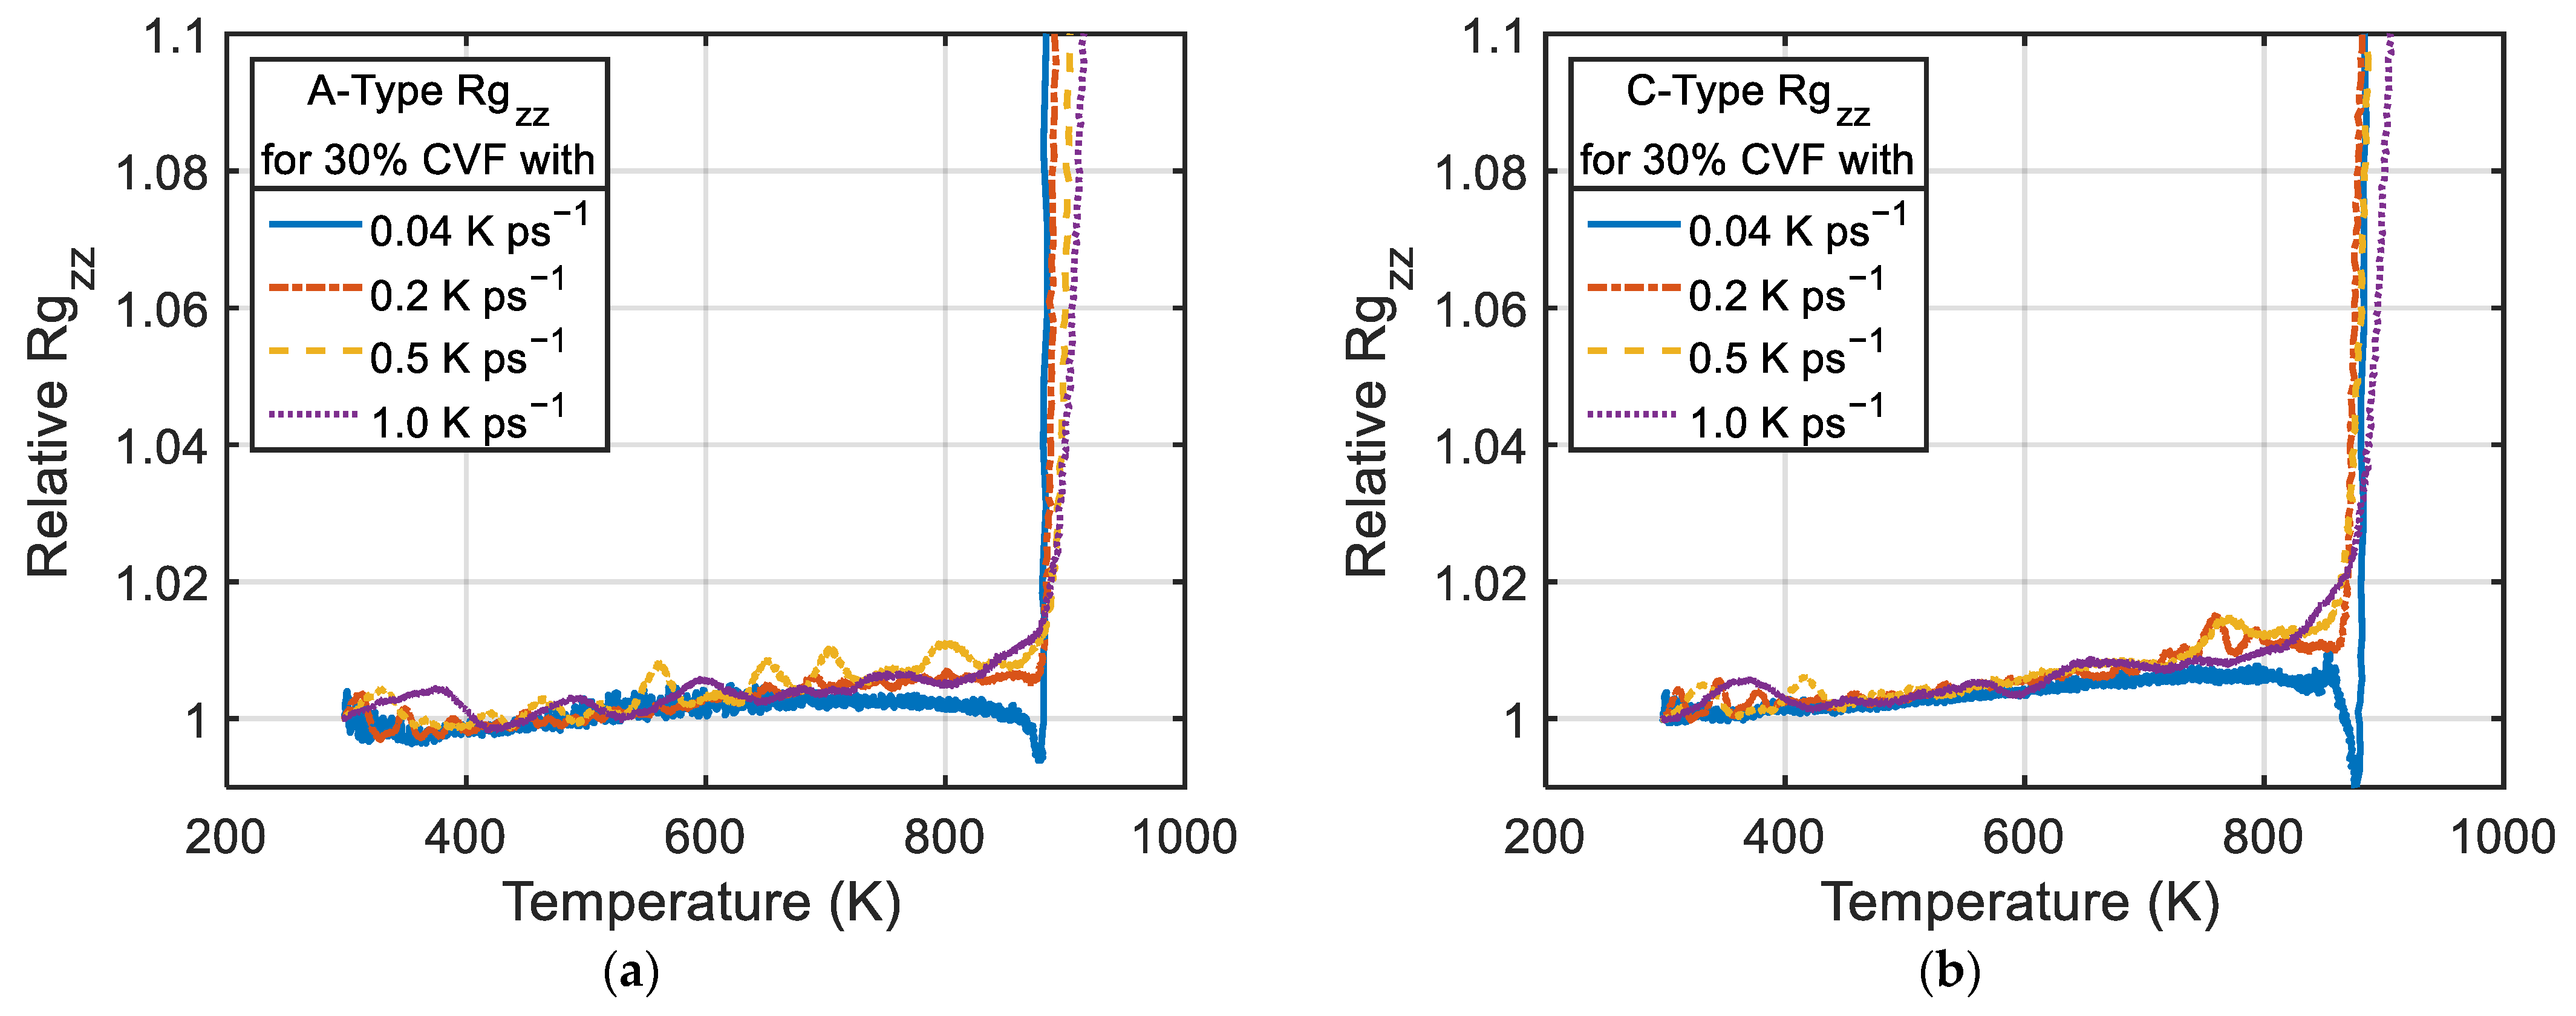
| HR (K ps−1) | CFV | TRg (K) | |
| 0.04 | 3% | 886 | 867 |
| 12% | 880 | 871 | |
| 30% | 884 | 870 | |
| 0.2 | 3% | 890 | 879 |
| 12% | 889 | 881 | |
| 30% | 892 | 884 | |
| 0.5 | 3% | 902 | 889 |
| 12% | 899 | 894 | |
| 30% | 904 | 888 | |
| 1.0 | 3% | 922 | 896 |
| 12% | 923 | 898 | |
| 30% | 915 | 897 | |
Publisher’s Note: MDPI stays neutral with regard to jurisdictional claims in published maps and institutional affiliations. |
© 2022 by the authors. Licensee MDPI, Basel, Switzerland. This article is an open access article distributed under the terms and conditions of the Creative Commons Attribution (CC BY) license (https://creativecommons.org/licenses/by/4.0/).
Share and Cite
Zhang, H.; Su, Y.-C.; Han, Y.; Jiang, S. Molecular Dynamics Study of Melting Behavior of Planar Stacked Ti–Al Core–Shell Nanoparticles. J. Compos. Sci. 2022, 6, 126. https://doi.org/10.3390/jcs6050126
Zhang H, Su Y-C, Han Y, Jiang S. Molecular Dynamics Study of Melting Behavior of Planar Stacked Ti–Al Core–Shell Nanoparticles. Journal of Composites Science. 2022; 6(5):126. https://doi.org/10.3390/jcs6050126
Chicago/Turabian StyleZhang, Huadian, Yu-Chen Su, Yiwei Han, and Shan Jiang. 2022. "Molecular Dynamics Study of Melting Behavior of Planar Stacked Ti–Al Core–Shell Nanoparticles" Journal of Composites Science 6, no. 5: 126. https://doi.org/10.3390/jcs6050126
APA StyleZhang, H., Su, Y.-C., Han, Y., & Jiang, S. (2022). Molecular Dynamics Study of Melting Behavior of Planar Stacked Ti–Al Core–Shell Nanoparticles. Journal of Composites Science, 6(5), 126. https://doi.org/10.3390/jcs6050126