Article

Molecular Dynamics Study of Melting Behavior of Planar Stacked Ti–Al Core–Shell Nanoparticles

1
Department of Mechanical Engineering, University of Mississippi, University, MS 38677, USA
2
Department of Civil Engineering, Chung Yuan Christian University, Taoyuan City 320314, Taiwan
*
Author to whom correspondence should be addressed.
J. Compos. Sci. 2022, 6(5), 126; https://doi.org/10.3390/jcs6050126
Submission received: 31 March 2022 / Revised: 19 April 2022 / Accepted: 22 April 2022 / Published: 26 April 2022
(This article belongs to the Special Issue Metal Composites)

Abstract

:
Selective laser sintering (SLS) is one of the most commonly used methods in additive manufacturing, due to its high prototyping speed and applicability to various materials. In the present work, molecular dynamics (MD) simulations were performed to study the thermodynamic behaviors of the planar stacked nanoparticles (NPs) model and explore the potential capability of the SLS process with nano-sized metal powders in the zero-gravity space environment. A multi-particle model of titanium–aluminum (Ti–Al) core–shell NP with a particle radius of 50 Å was constructed to investigate the characteristics of the melted pattern during sintering. Two patterns with different spatial densities were considered to study the influence of particle stacking on the melting process. Various core volume fractions and heating rates were examined to investigate their effects on the quality of the final sintered product. The stacked-NPs models with core volume fractions (CVFs) of 3%, 12%, and 30% were linearly heated up to 1100 K from room temperature (298 K) with heating rates of 0.04, 0.2, 0.5, and 1.0 K ps−1. The initial fusion temperature and final sintering temperature for each stacking pattern were obtained via the validation from the radial distribution function, mean squared displacement, and the radius of the gyration analysis. The 30% CVF yields the largest neck size before the melting point, while beyond the melting point, a larger core helps delay the formation of the fully-melted products. It is observed that using the close-packed stacked-NPs model under a slow heating rate (long melting duration) would help form a stable, completely sintered product with a relatively low final sintering temperature.

1. Introduction

Metal additive manufacturing (MAM) is capable of building complex 3D components layer by layer, and it has attracted lots of attention for decades [1]. Compared with traditional manufacturing, MAM can directly fabricate net or near-net shape components with minimal post-processing, less lead time, less manufacturing costs, and less material waste [2]. Different MAM technologies (e.g., laser-based MAM, electron beam melting, and binder jetting) have been developed [3,4,5]. Among them, laser-based MAM (e.g., selective laser sintering/melting (SLS/SLM)) with fine metal powders has attracted more research efforts due to the guaranteed production quality, reasonable cost, and outstanding performance of the final product [6]. For example, NASA has spent tremendous efforts fabricating advanced metallic aerospace components with SLS/SLM [7]. Research on the nanoparticle (NP) sintering in the SLS process has been conducted [8], and efforts toward developing sintering theories and performing computational simulations of the NP sintering process have been pursued in the past few decades [9,10,11,12]. In recent years, bimetallic NP alloys have been intensively studied because they often yield interesting microstructures after being processed into final products. One of the interesting structures of bimetallic NP is the core–shell morphology. It usually comes in different shapes and can be synthesized using either “chemical” [13,14,15,16] or “physical” [17,18,19,20,21] approaches. These NPs are formed with two or more distinct materials, comprising a “core” as the inner material and a coated “shell” as the outer material. The core and shell components have their unique roles, which will improve the functionality of this hybrid structure; the creation of ideal core–shell particles is critical for many industrial applications [22,23,24,25]. With the tremendous growth of computer power, much research on nanoscale structures has relied on computational simulations, in addition to practical experiments, in the past 20 years. By taking advantage of the molecular dynamics (MD) simulation technique with reliable interatomic force fields, many published works are available which study the thermodynamic and mechanical properties during the melting process of the core–shell NPs. For example, Yang et al. investigated the two-stage melting behavior of Pt/Au icosahedral NPs with different concentrations, resulting in the melting point rising as the concentration of Pt increases [26]. Song et al. studied the thermodynamic properties and structure evolution during continuous heating and cooling processes by various analysis methods [27]. Huang et al. examined the effect of core size on the melting mechanism and thermal stability of single Au/Pt NP during continuous heating [28]. Wang et al. explored the geometrical effects on the sintering dynamics of two equally sized Cu/Ag NPs and observed that the mobility of the shell material can be enhanced by the core material [29]. They also considered multiple Cu/Ag NPs that were periodically arranged in 3D to study the size and temperature dependency of the sintering process, including the porosity and multiple particle effects [30]. Li et al. provided an extended view of the exact Cu/Ag NPs modeling and introduced the shell thickness effect [31].
Alloys such as titanium–aluminide compounds usually have high-melting points, excellent mechanical responses, and low density, which are ideal materials in the automotive and aerospace industries. Zhang et al. explored the core size effect on the thermodynamic properties of single Ti–Al (HCP/FCC) core–shell NP during heating and freezing [10]. In our previous work, the melting and solidification behavior of the Ti–Al core–shell NPs-chain were studied, and the mechanical responses of the sintered chain product at room temperature were also tested [32]. The final sintering temperature was set to 800 K, which proved to be an ideal temperature for the NPs chain model with an Al shell. For such NPs chain models, the effects of the core volume fraction and thermal history were examined as the critical aspects of the final sintered product [32]. Furthermore, the advantage of using Ti as a core material is that the FCC Ti structure covered by the entire shell is assumed not to be easy to transit to HCP, compared with Ti as a shell material. Another published work investigated the conductive patterns of a multi-particle model of silver NP arranged by different stacking patterns [33]. Relatively large scale MD simulations on core–shell NPs in a 2D planar arrangement with non-periodic boundary conditions are well suited to study the single-layer nanoscale metal powder fabrication in the computational simulation. However, there is a lack of related research and only a few works have focused on the sintering of multiple NPs (e.g., the 3D arrangement of multiple Cu/Ag NPs [30]). It conveniently helps to explore the effect of the metal powder sintering problem on the spatial density (possession density denoted by the volume ratio of NPs). Without the loss of generality, the observations of the planar stacked-NPs model in 2D can be extended into a 3D space. Hence, in this work, the planar stacked-NPs model with two stacking patterns was constructed to represent one layer of a Ti–Al core–shell nanoscale powder sample. Such a stacked-NPs model with different core sizes was used to investigate the SLS characteristics by using MD simulations.

2. Simulation Details

2.1. Simulator and Force Field

The well-known Large-scale Atomic/Molecular Massively Parallel Simulator (LAMMPS) software package [34] was used to perform the MD simulations. An appropriate interatomic potential function is essential to ensure the reliability of the MD simulation. Thus, the embedded atom method (EAM) force field [35,36], derived from the quasi-atom concept [37], was employed to solve the atomic interactions during the simulations. In the EAM, each atom is assumed to be immersed in a locally uniform electron “gas,” and the embedding energy is defined by the energy of the atom in that uniform electron “gas” relative to the atom separated from the electron “gas.” A function of the electron density approximates the energy per atom at the impurity site plus an electrostatic interaction. Therefore, the total energy is a sum of all individuals [35],
E t o t a l = i F i [ ρ i ( R i ) ] + 1 2 i , j ( = 1 ) φ ( R i j )
where F i is the embedding energy, ρ i is the density of the background at the position R i but without atom i , and φ is a short-range electrostatic pair potential. This paper took the EAM parameters used for Ti and Al from Zope’s work [38].

2.2. Modeling of Stacked Core–Shell NPs

Several single Ti (core)/Al (shell) NP models with a radius of 50 Å were created, inherited from our previous work [32] using ATOMSK [39]. Initially, both Ti and Al have face-centered cubic (FCC) crystal structures with a lattice constant of 4.340 and 4.046 Å, respectively. It is noted that the FCC Ti structure has been proven to exist via the Gibbs free energy, the first principal calculation, and the transmission electron microscopy experiment in some specific environments [40,41,42,43]. Such a structure has been successfully implemented in our previous studies [11,32] and is reasonable to be applied for the core–shell NP models. Three different Ti core volume fractions (3%, 12%, and 30%), as shown in Figure 1, were selected to investigate the effects of the core volume fractions on the thermodynamic properties during the sintering process. Conjugate gradient methods were performed to minimize the potential energy that includes the core–shell interface energy of a group of atoms in the NPs in the initial single NP models [12]. A time step of 0.002 ps and a zero external pressure were used throughout this work. The Nosé–Hoover thermostat [44,45] was used to control the system temperature for this work. The energy-minimized NPs were then thermally equilibrated at room temperature (298 K) using an NVT (constant number of particles N, constant volume of the system V, and constant temperature T) ensemble in a relatively large, non-periodic simulation box for 1000 ps. At 298 K, the initial atomic velocities were assigned by Gaussian distribution. The minimization and equilibration processes aim to reduce the frozen-in stresses on the free surface and the core–shell interface.
The equilibrated NPs with core volume fractions of 3%, 12%, and 30% were then duplicated within the XY-plane to form planar stacked-NPs in two ways of stacking, leading to a different number of connections around every single NP [33]. The resulting stacked-NPs models are displayed in Figure 2. The square-aligned (A-type) stacking pattern is a typical NP arrangement, and it forms a neat “network” pattern. The close-packed (C-type) stacking pattern is a particular arrangement that makes every three NPs an equilateral triangle. Therefore, each NP of the A-type has four connection positions, while the C-type has six. The initial surface gap between the adjacent NPs was set to 2 Å for both types to ensure NP coalescence in the following process. The main difference between the A-type and C-type is the initial spatial density, defined by the volume possessed by the NPs. The initial stacked-NPs model contained NPs and pre-existing voids (space surrounded by NPs). The thickness of one NP diameter was used to calculate the spatial density, as only one NP layer was along the z-direction. The detailed calculations for the spatial density are shown in Figure 2. The result indicates that the calculated spatial density of the C-type (0.6046) is about 15% larger than that of the A-type (0.5236). In this study, the stacked-NPs pattern was 5 by 4 along the x-axis and y-axis, respectively. The simulation box boundary was set to a half radius of one NP away from the stacked structure in each dimension. Due to the alignment order, the A-type stacking has a lower spatial density than the C-type.

2.3. Simulation Process

The stacked-NPs structure has a great possibility of experiencing solid-state fusion in a room-temperature environment. Hence, an equilibration at 298 K using an NVT ensemble for a time duration of 1000 ps was first performed on the stacked-NPs models to roughly simulate the solid-state sintering process. The stacked-NPs were observed to be well equilibrated via the steady potential energy history after ~800 ps, indicating that the 1000 ps duration was sufficient for these NPs to be solid-state sintered. Figure 2 illustrates that the NPs were independently distributed before sintering, and a stable connection was formed between each adjacent NP once the equilibration was complete. Then, the system temperature was ramped up linearly to imitate the laser sintering process, roughly mimicking the temperature rise during the SLS of the metal powders. Two heating rates of 0.04 and 0.2 K ps−1 were selected to linearly ramp the system temperature up to the final temperature of 1100 K, which was far higher than the melting point of the Al material (in order to see the characteristics of melted Al shell). Our previous work demonstrated that the linear temperature increments of 0.04 and 0.2 K ps−1 with EAM potential are reasonable and applicable [11,12,32] to roughly mimic the reported temperature rise during the SLS. In addition, previous research showed that the temperature rise of the entire metallic NPs due to laser irradiation is approximately linear in the two-temperature model (TTM) [46,47]. It should be noted that the time for the entire system temperature to rise to the desired final heating temperature is usually longer than 20 ps [48]. However, depending on the laser fluence, laser pulse number, and duration of a nanosecond laser or other common laser irradiation, the time can range from 1–20 ns. Thus, the 17.5 and 3.5 ns time durations (298 to 1000 K) for 0.04 and 0.2 K ps−1 are within this range and could be used to “roughly” simulate the laser heating process. Additionally, in this work, another two heating rates of 0.5 and 1.0 K ps−1 were also introduced, to investigate the effect of the relatively fast heating rates (ultrafast nanosecond laser). The heating process can be used to estimate the thermal properties (e.g., melting point) and predict the sintering behavior.

2.4. Analysis Methods

The MSD data are commonly used to measure the average distance, which refers to the initial position of each atom. It has the form of,
M S D = 1 N i = 1 N [ r i ( t ) r i ( 0 ) ] 2
where N is the total number of atoms, t is the time instant, and r is the current position of each atom. In this work, MSD data are computed based on the initial coordinates of atoms at the beginning of each sintering process.
The radius of the gyration (Rg) data are often used to represent the shrinkage of an object because it is calculated as the mean square distance based on the center-of-mass position of the group of atoms,
R g 2 = 1 M i = 1 N m i ( r i r c m ) 2
where M is the total mass of a group, r is the position of each atom, r c m is the center of mass position, and subscript i runs over all atoms in the group.
OVITO [49], a widely used visualization software, was used to monitor the atomic configuration and compute thermal the properties from the dumped data for output steps in the LAMMPS simulation runs. It can provide many options to analyze the results. In this work, local atomic structures were classified by applying the common neighbor analysis (CNA) method [50]. In addition, coordination analysis by radial distribution function (RDF) was conducted at specific temperatures to determine the melting point and validate the actual state of the Al shell.

3. Results and Discussions

A series of MD simulations were conducted to study the sintering behaviors of the stacked-NPs models. As stated in the previous section, each case includes two processes: solid-state sintering and heat sintering/melting. Therefore, the corresponding observations associated with these two processes will be presented in this section.

3.1. Solid-State Sintering Process

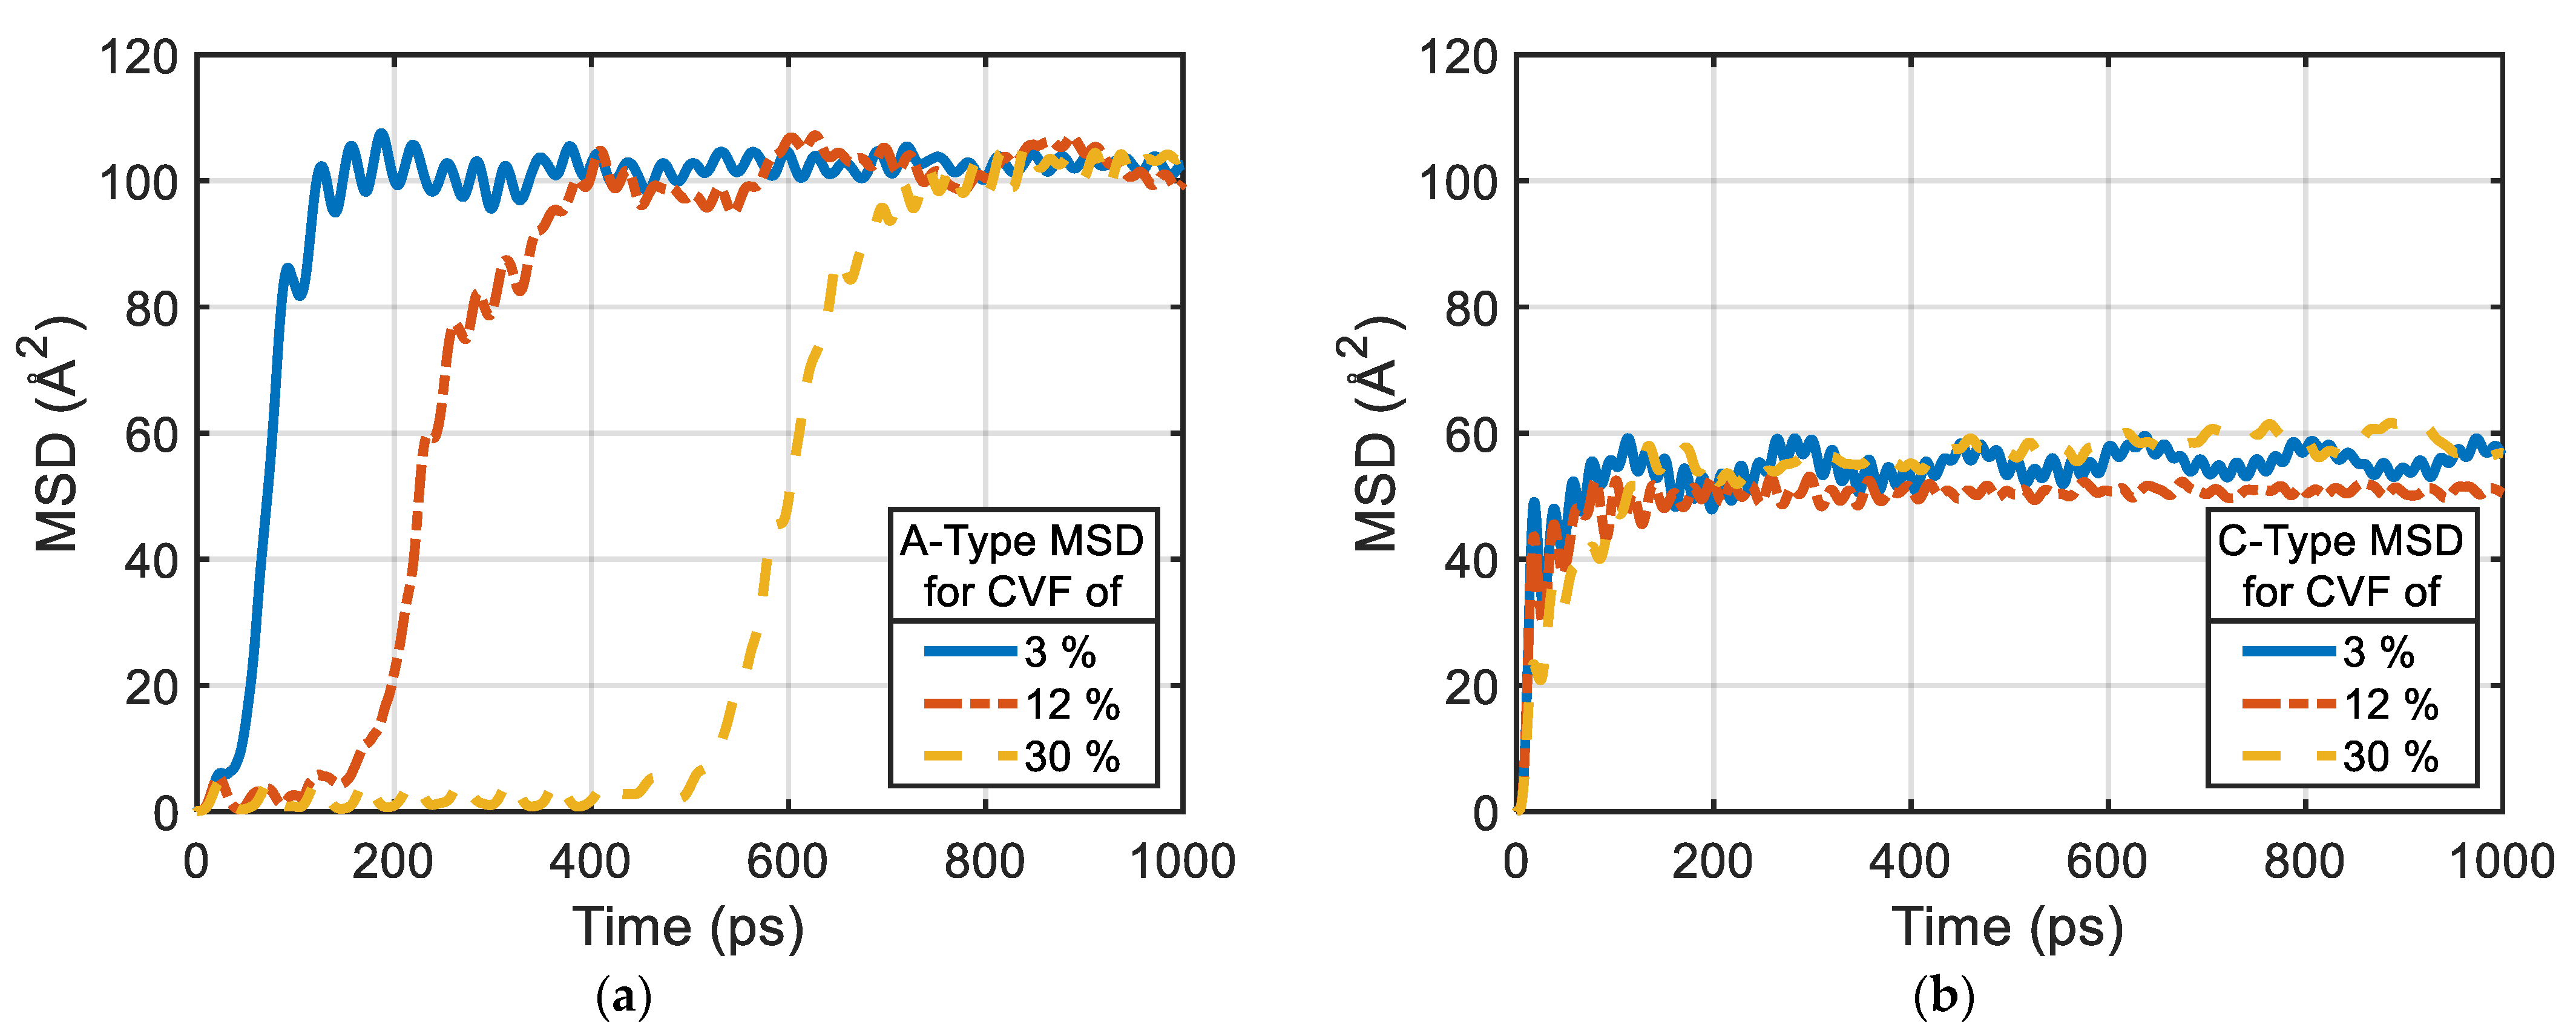
In this simulation, both the A-type and C-type stacked-NPs models were equilibrated at a room temperature of 298 K. During the equilibration process, each NP will move to contact its adjacent ones because of the free surface energy attraction [51]. The stacked-NPs models equilibrated after 1000 ps once the potential energy reached its minimum level. The MSD histories for the stacked-NPs were recorded during the solid-state sintering process to investigate the effects of the stacking pattern and core volume fraction. As shown in Figure 3, the solid-state sintered MSD values for the A-type are higher than those of the C-type, as expected, due to the lower initial spatial density and higher shrinkage ability. This indicates that there is not enough room for the NP to move in the C-type stacking pattern. In addition to the moving space, the constraints for each NP also play an essential role in the solid-state sintering process. The greater the number of constraints (six adjacent constraints in the C-type model), the smaller the MSD values. This finding also supports the logic that an increased number of constraints does not allow for enough space for the movement of the NPs. An intriguing discovery is that the MSD of the NPs with a higher core volume fraction takes longer to reach a steady averaged value. This can be explained by the fact that the effect of the core volume fraction influences the coalescence timing, particularly for the A-type with the substantial void space. The interface energy between the core and the shell may have an effect on the mobility and diffusion of the shell atoms. However, even for the same model, the timing of the coalescence changes across the simulation runs. Moreover, there is no difference in the C-type. Because all stacked-NPs of each type have the same averaged value of MSD, the coalescence timing factor can be neglected. The stacked-NPs structure quickly equilibrates after the NPs have merged and is ready for the subsequent procedures.
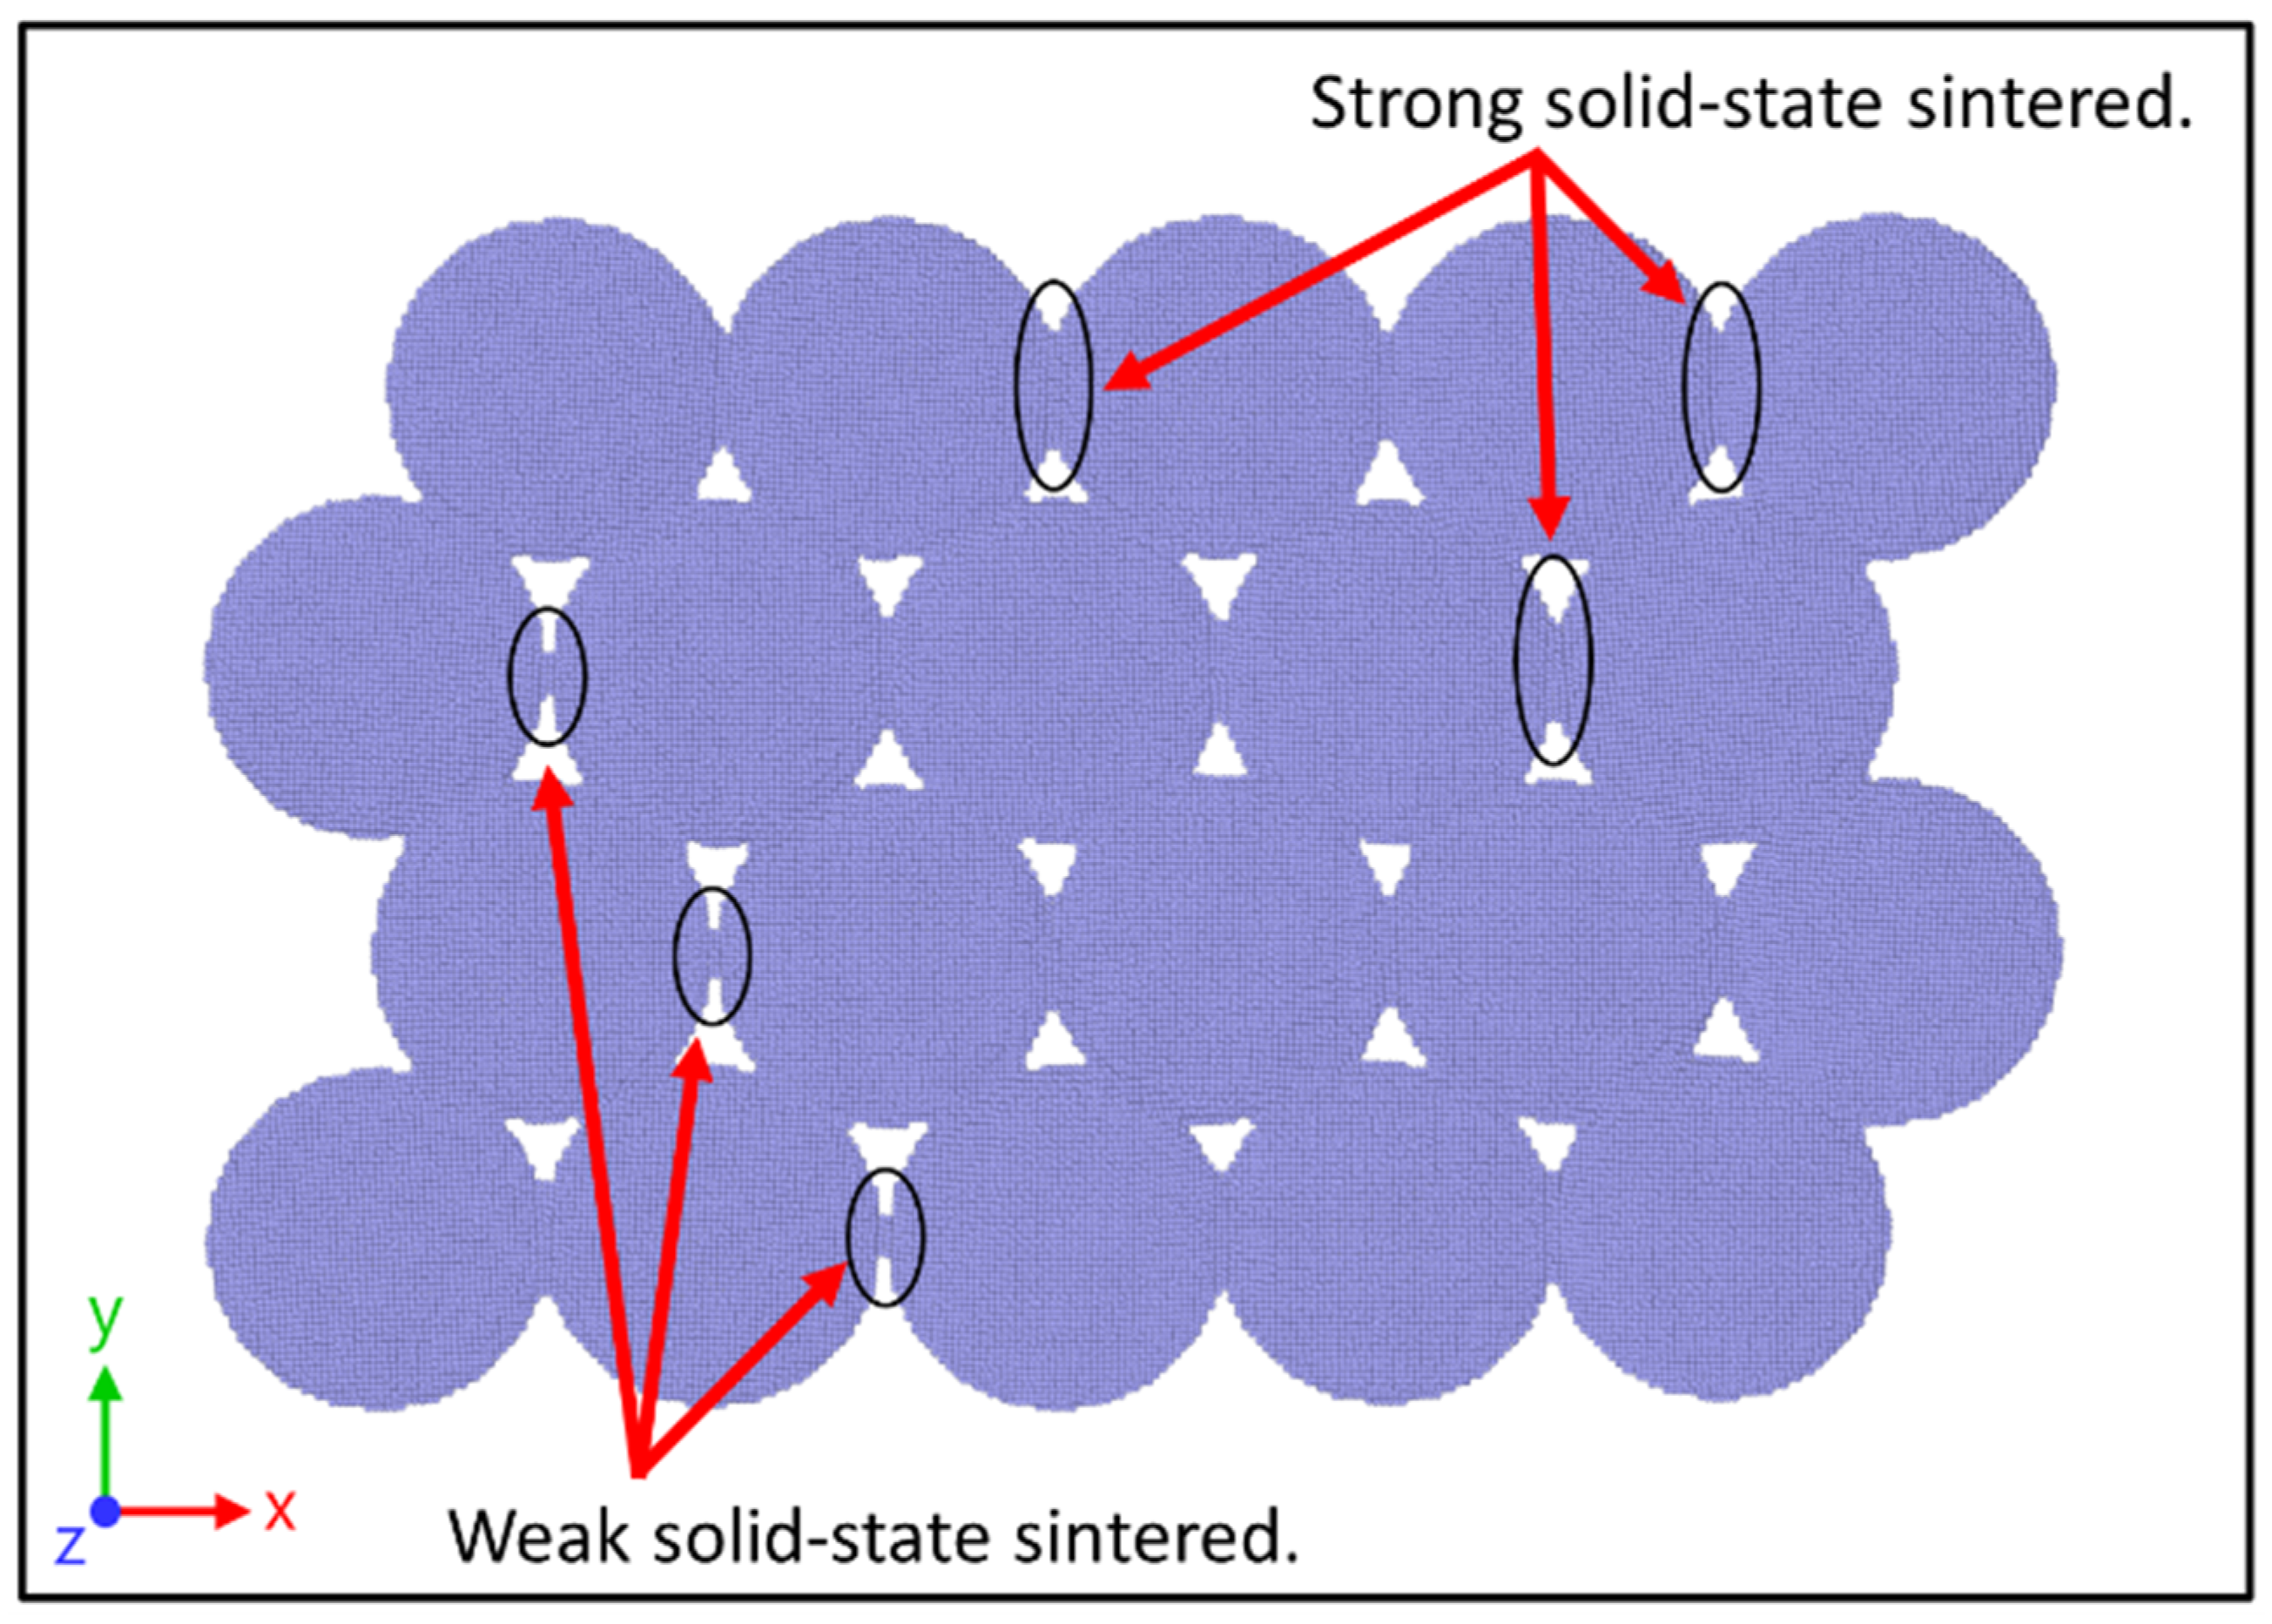
In fact, the sintered NPs coalesced into the neck connections (necks) when the two spherical surfaces merged. It is necessary to measure the neck size during the solid-state sintering process because the neck size is a crucial factor in determining the sintering quality of the NPs. Figure 4 shows the neck size measurement for each case after the solid-state sintering process. In general, it is observed that the neck size of the A-type is larger than that of the C-type. The fewer necks and constraints for the A-type could be attributed to this phenomenon, implying that higher shrinkage ability leads to larger necks. This phenomenon can also be found in the atomic configuration. As shown in Figure 5, some NPs in the C-type stacked model have weak necks compared to one of their adjacent NPs, indicating that more constraints would lead to weaker (or smaller) neck sizes.

3.2. Heat Sintering Process

After the solid-state sintering process, the stacked-NPs models were heated up to 1100 K to mimic the heat sintering process. In this section, a series of atomic configurations, simulated temperatures, and several related values will be presented to illustrate the heat sintering behaviors. The stacked-NPs models with a 30% core volume fraction in both types are taken as examples without loss of generality. Figure 6 and Figure 7 illustrate the atomic configurations for the A-type and C-type stacked models during this heat sintering process, respectively. Each inset in Figure 6 and Figure 7 corresponds to a specific instant (or temperature). This work mainly aims to provide a view from the MD simulation to determine the ideal fusion temperature range of the NPs and to avoid overheating situations that may cause energy loss. Hence, in this work, the sintering of these nanoscale stacked-NPs is regarded as complete once all the pre-existing voids have vanished. It should be noted that this definition was based on the atomic configuration of the simulated models at each moment and may not be applicable to the laser sintering of a microscale metal powder. At this completely sintered state, the shell does not need to be completely melted to liquid (Figure 6c and Figure 7c). Another landmark event was recorded during the heat sintering process (also referred to as the melting process). This event is denoted as “quick aggregation,” in which the NPs started to aggregate together tightly, as shown in Figure 6b and Figure 7b. In the present paper, the temperatures that correspond to these two states are called aggregation temperature and “no-void” temperature (denoted as Ta and Tnv, respectively). Table 1 lists the Ta and Tnv for all simulated cases.
From Table 1, the Ta and Tnv are obtained at rising values with increasing heating rates, implying that slower heating rates lead to sufficient atomic interactions within a relatively longer simulation duration. For the A-type stacked-NPs model, sufficient atomic interactions with a 0.04 K ps−1 heating rate result in less than a 10 K difference between Ta and Tnv. In contrast, the difference enlarges to more than 20 K with a 1.0 K ps−1 heating rate. This demonstrates that higher heating rates lead to shorter durations for forcing the atoms to fill the void. Therefore, the extra energy that can be considered as a higher temperature is required. For the C-type stacked-NPs model, the Ta and Tnv for all the simulation cases are less than those of the A-type, roughly about 40 K, because the denser stacking pattern has six necks and a much smaller void size (Figure 7a). It makes the atoms of the Al shell more easily fill the voids and causes the stacked-NPs to become completely sintered earlier. Additionally, the spatial density and void size of the C-type model also make the atoms require more thermal energy for fusion. Therefore, the difference between Ta and Tnv for all the cases is about 50 K, which is larger than that of the A-type model. Another interesting finding is that the Ta and Tnv for the C-type with a 0.04 K ps−1 heating rate are particularly low, which shows that a denser C-type model and sufficient duration for atomic interactions would tremendously reduce the final sintering temperature. Finally, it can be noted that all the temperatures listed in Table 1 are lower than the melting point for the Al material at the macroscale (933 K). This can be attributed to the presence of large free surface energy in the MD simulations at the nanoscale. Furthermore, the core volume percentage appears to have a slight effect on Ta and Tnv because the Ti cores were not directly involved in the melting process of the Al shell at 1000 K.
The radial distributed function (RDF) is commonly used to describe the pair density distribution as a function of the distance of an atom from another atom, for every pair of atoms. Therefore, it is also adopted in this research to investigate the heat sintering behaviors, such as the spatial density variation and the sintered state, for the stacked-NPs models. The corresponding RDF data of the A-type and C-type stacked-NPs models with 30% core volume fraction and 0.5 K ps−1 heating rate are shown in Figure 8a,b, respectively. Initially, at a room temperature of 298 K, the stacked-NPs models experienced a solid-state sintering process, and the RDF curve, which is plotted with a green dotted line in the figure, is a typical shape for a solid. Then, the peaks at mid- to long-range distances will be smeared out gradually with the temperature rising (i.e., the heat sintering process). As mentioned in previous paragraphs, parts of the NPs start to merge rapidly with their adjacent NPs, and the configuration in the entire stacked-NPs model will shrink in-plane when the temperature reaches Ta. Therefore, the peaks at mid- to long-range distances of the RDF data curves decrease dramatically, as shown in the blue dashed lines in Figure 8a,b. It means that the Al shell can still be regarded as solid at Ta, but the fluidity is generally higher than that at room temperature. In addition, the other RDF curves with different temperatures, such as Tnv and 950 K, also demonstrate that the higher the temperatures, the fewer the peaks in the RDF curves.
The values of Ta and Tnv in the RDF curves shown in Figure 8 are denoted in bold font in Table 1. According to Figure 8a, the RDF curve of Tnv (910 K) is nearly identical to that of 950 K, and no long-range peaks occur on these two RDF curves. Therefore, it can be said that the melting point for the Al shell in the A-type with 0.5 K ps−1 is about 910 K. This temperature causes the Al shell to fully melt. However, the Tnv for the A-type with 1.0 K ps−1 has exceeded this melting point, and some voids still exist, despite the Al shell being melted, which implies that a relatively higher heating rate may not generate a well-sintered stacked-NPs product. Contrary to the previous A-type stacked model results, the C-type RDF curve at Tnv (Figure 8b) still has some peaks and noticeable differences with the one at 950 K. This phenomenon can be explained by the fact that the Tnv is not close to the melting point in this condition. Additionally, this difference between the results of A-type and C-type models coincides with the measured Tnv value for both types in Table 1. The C-type (~860 to ~890 K) can form “no-void” atomic configurations with a relatively lower temperature than the A-type (~880 to ~920 K), which indicates that the surrounding NPs of the C-type stacking model have more constraints, so that the aggregation ability of the C-type is less than that of the A-type. It also indicates that the advantage of the C-type is that it can be fully sintered without pre-existing voids and can maintain a solid-state to avoid the out-of-plane deformation of the stacked-NPs, such as bending or twisting.
The relative Rg is also an excellent index to monitor the shrinkage of the stacked-NPs, to ensure the geometric quality of the final sintered product, especially in the z-direction, as a drastic rising of relative Rgzz value is observed at a specific temperature range (870 to 880 K in Figure 9). For the planar stacked-NPs, the ideal final sintered product would still be an in-plane, “pie-like” shape (Figure 6c and Figure 7c), rather than being melted into a colossal, oval-like body (Figure 6d and Figure 7d). The thickness of the fully sintered “pie-like” shape product should be slightly larger than that of the initial or solid-state sintered model; thus, a 10% shrinkage limit threshold, which can be considered as the out-of-plane expansion limit, is set for the z-direction. Based on this relative Rg threshold, the corresponding temperature (TRg) was measured and listed in Table 2 for each case. It is found that the TRg is generally quite close to the Tnv for each case, proving that the completely sintered products are of a good quality, without exceeding the expansion threshold in the z-direction. Moreover, some cases with Rgzz exceeding the 10% threshold, such as ~20%, can still have the “pie-like” shape structure. Similar to the observations in Table 1, the core volume fraction has no effect on TRg.
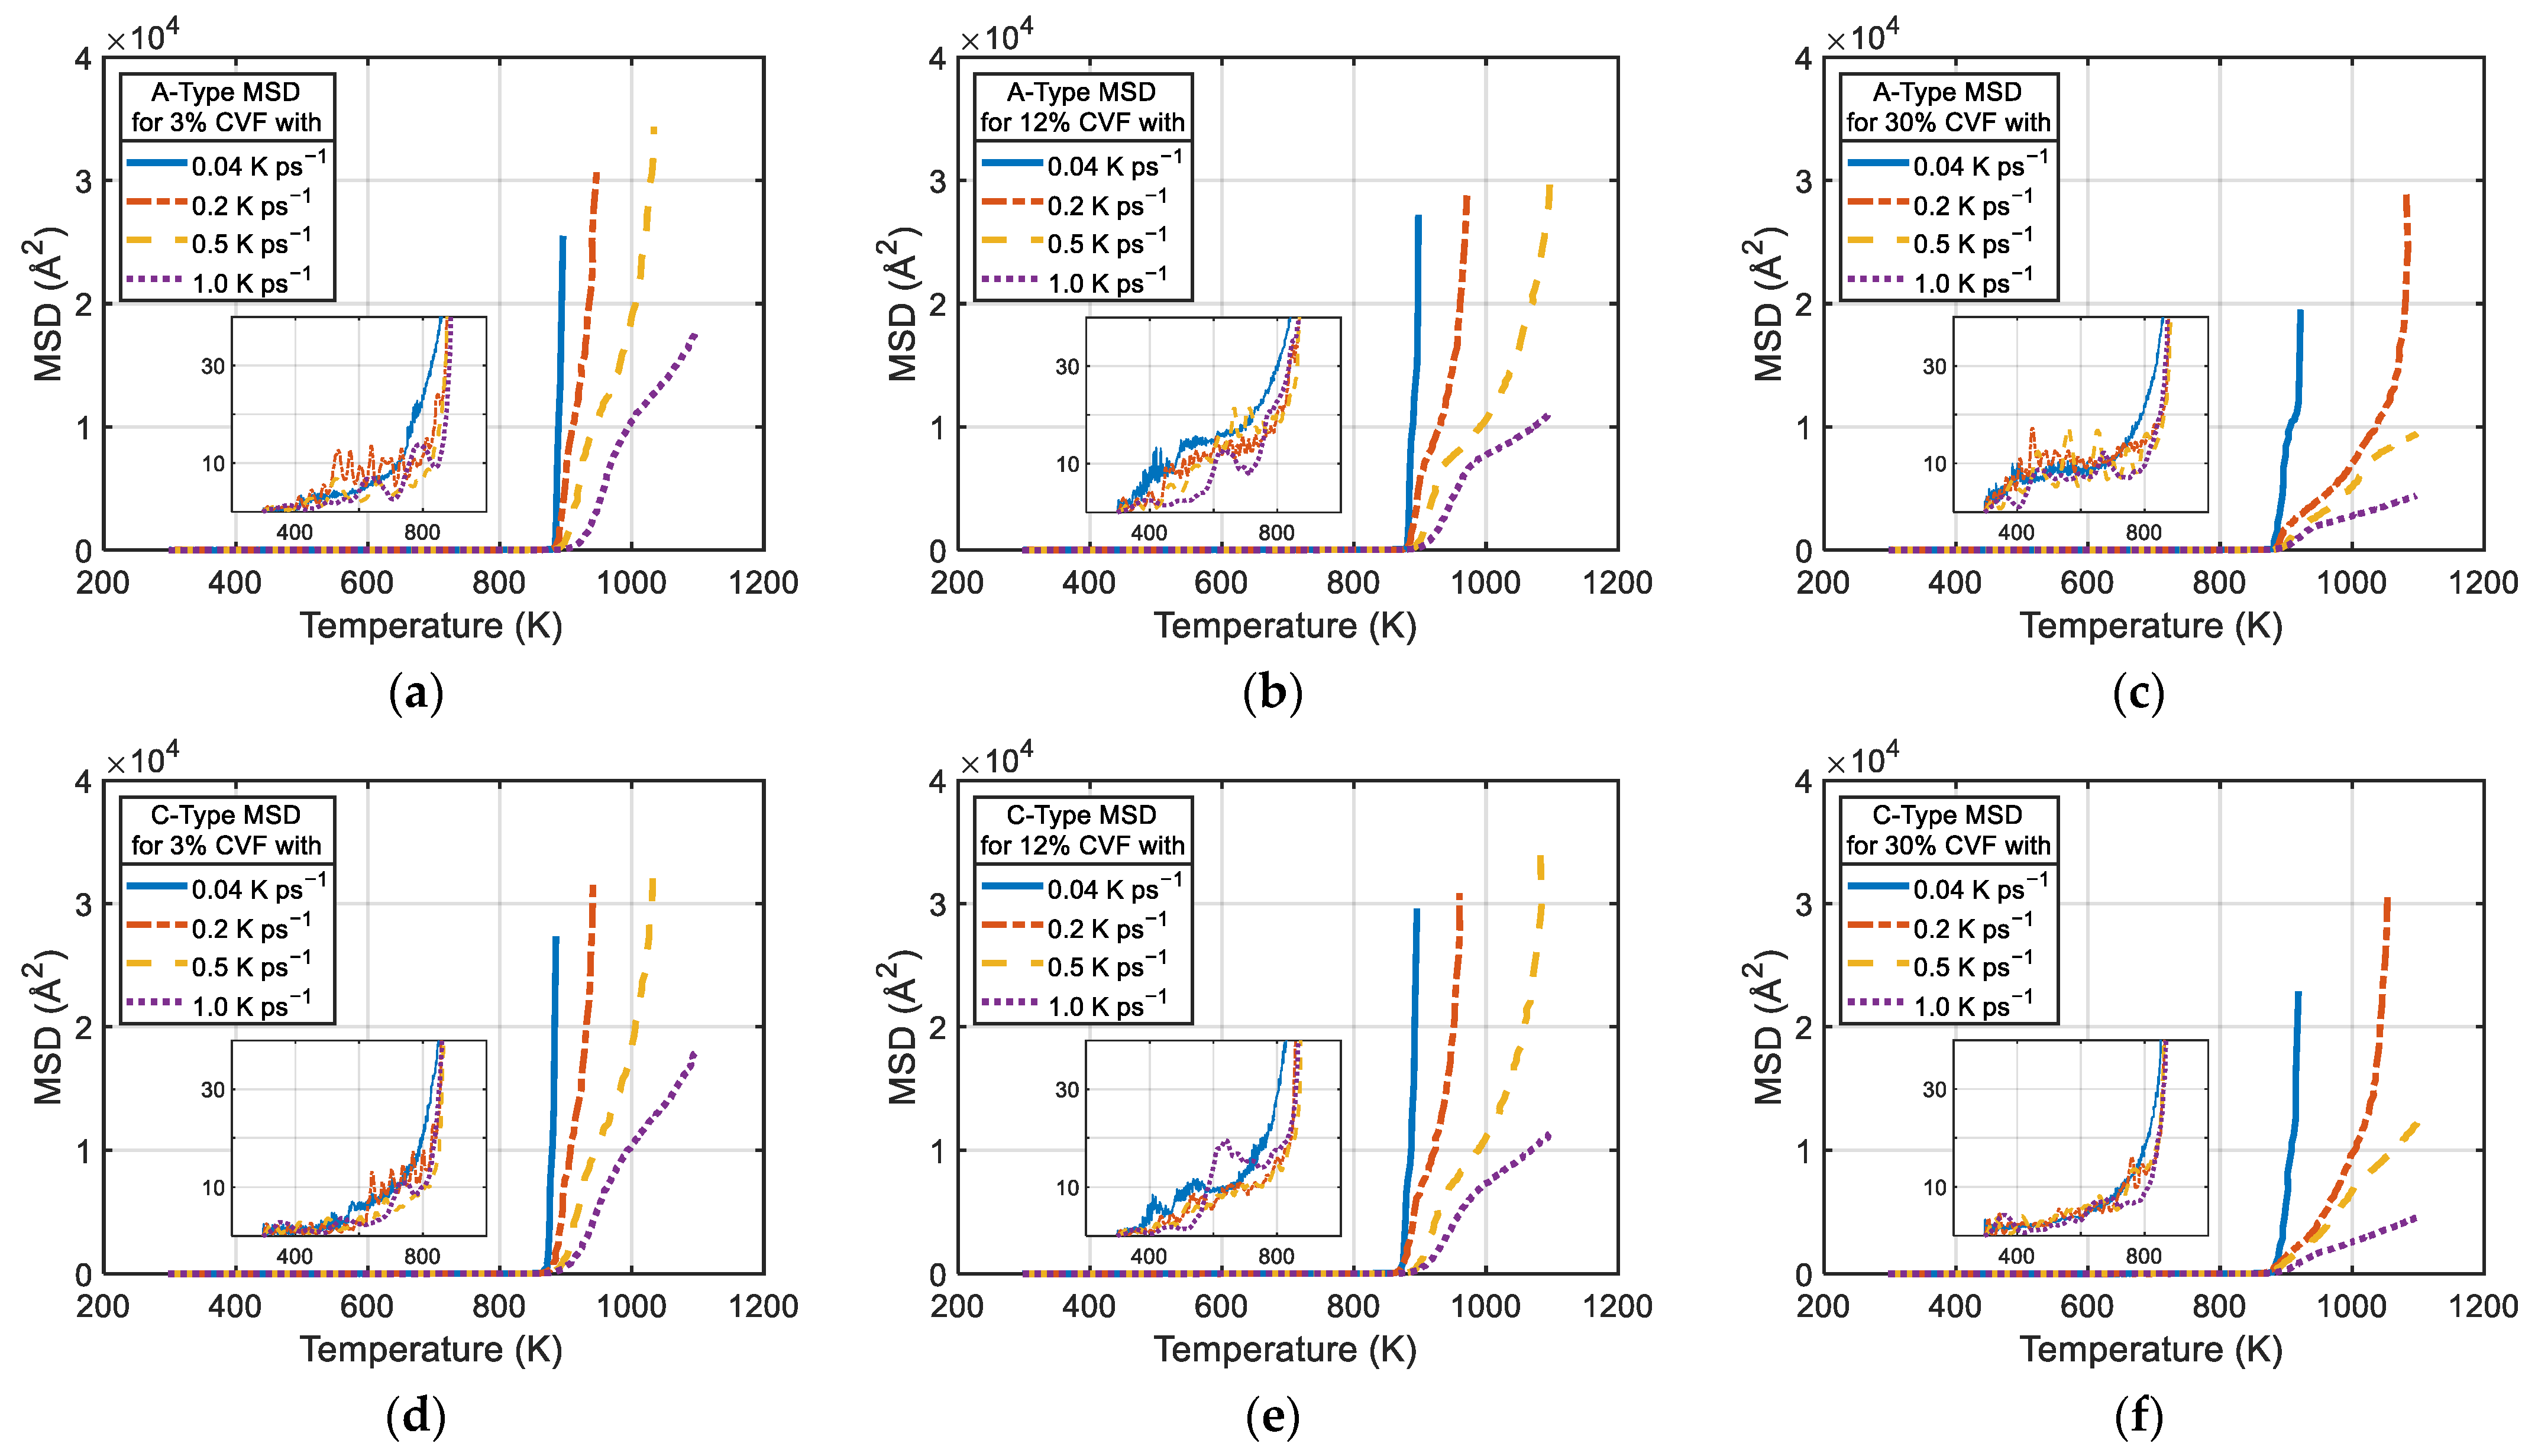
Similar to the solid-state sintering process, the MSD profiles are also used to check the average movement of all the atoms in each case. The MSD profiles with respect to the temperature for all the stacked-NPs models are plotted in Figure 10. For each simulation case, the heating rate makes the MSD profiles different when the heating temperature reaches a specific temperature. In this paper, this specific temperature is denoted as Tcirt and is defined as the temperature associated with an abrupt increase in MSD values. From Figure 10, the higher heating rates delay the MSD value ascent for all the stacked-NPs models after the Tcrit (~880 K for the A-type and ~840 K for the C-type). Moreover, a higher heating rate may prevent the NPs from being over-fused at a narrow temperature range and make the stacked-NPs prone to becoming thicker, “pie-like” structures. Furthermore, the results with a 0.04 K ps−1 heating rate for both the A-type and C-type stacked models demonstrate an almost vertical rise of the MSD profile, which indicates that the Al shell starts to melt, and NPs quickly aggregate in a narrower temperature range. This result is mainly due to the fact that lower heating rates correspond to longer durations for the interaction of the surface atoms. Additionally, there seems to be no stacking pattern effect on the stacked-NPs models with the same core volume fraction and heating rate. As can be seen from Figure 10a–f, the shapes of the curves are almost the same for each heating rate. With the same stacked model, heating rate, and heating temperature higher than Tcrit, a higher core volume fraction leads to smaller MSD values. This means that the larger core does indeed help to stabilize the planar stacked structures to delay the formation of the large liquid oval.
To further investigate the melting behaviors of the stacked-NPs model, the cross-sectional views in the XY-plane of the crystal structure for the A-type and C-type models with a 30% core volume fraction were selected and summarized in Figure 11. This crystal structure was obtained by using the CNA method. Several stacking faults can be seen in Figure 10a,e during the solid-state sintering process at the interface between the Ti core and the Al shell near the neck. However, stacking faults do not occur at the final stage of the melting process, as shown in Figure 10d,h. This can be explained by the fact that the melting point for the Al material is much lower than that of the Ti material, and the FCC Al atoms become disordered when the temperature increases. Figure 10c,g show that the FCC Ti core retains its structure at a relatively low temperature, even as the Al shell melts. This phenomenon demonstrates the protective ability of the shell material in such a synthesized core–shell NP. This ability will prevent the FCC crystal structure of the precious Ti core from transforming to HCP while increasing the temperature.

4. Concluding Remarks

A series of MD simulations that mimicked the selective laser sintering (SLS) process were conducted to explore the thermodynamic sintering behaviors of the Ti–Al core–shell planar stacked nanoparticles (NPs) model. Two stacking patterns (i.e., A-type and C-type) were implemented to study the effect of spatial density on the NPs sintering process. The A-type stacking pattern arranges the NPs into a neat, squared “network,” while the C-type stacking pattern makes every three NPs an equilateral triangle. Initially, there are pre-existing voids among the adjacent NPs. The void size determines the spatial density of each specific stacked-NPs model. These two models roughly represent the two limits of the spatial density range of the planar stacked-NPs (supposing no gap between the adjacent ones). Ti is the core material with three core volume fractions of the NP coated by an Al shell. The initial crystal structure is FCC for both Ti and Al. Several melting processes with heating rates of 0.04, 0.2, 0.5, and 1.0 K ps−1 were performed to investigate the effect of the heating rate on the heat sintering behaviors and characteristics of the final sintered products. All simulations were performed in a vacuum environment.
During the solid-state sintering process at room temperature, mean squared displacement (MSD) curves were plotted to demonstrate the coalescence of the NPs with a negligible initial gap. Such simulations reflect the equilibration of stacked-NPs at room temperature and imitate the nanoscale metal powder stored in a room temperature environment. As expected, the NPs coalesce with their adjacent ones to form four or six necks in the A-type and C-type stacked-NPs models, respectively. Due to the denser NPs in the space, the MSD value for solid-state sintered NPs of the C-type stacked model is less than that of the A-type. Because more constraint was added by the extra two necks, the mobility of the NPs in the C-type is limited, and some necks were weakly formed during such a low-temperature environment. The neck size and the number of necks contribute to the stability of the sintered NP network, and they are two influential aspects in the subsequent melting process. Hence, the measured neck size for the A-type stacked model is generally more prominent than that of the C-type. In addition, the 30% core volume fraction cases have the largest neck size for each type, indicating that the core–shell interface energy will affect the thermodynamic responses of the shell. Specifically, a stronger fusion ability is assumed to be obtained with a larger neck size.
In this simulation, the melting point of the Al shell is 910 K. Heating rates of 0.04, 0.2, 0.5, and 1.0 K ps−1 were implemented to heat the stacked-NPs models to 1100 K in the melting process. When the temperature exceeds the melting point, the planar stacked-NPs models quickly melt into a large liquid oval, which contains solid Ti cores with a higher melting point. Moreover, a larger core helps to stabilize the planar stacked structures by delaying the formation of the liquid oval. When the system temperature reaches the aggregation temperature (Ta), which slightly depends on the core volume fraction, the NPs start to quickly aggregate in several locations and to form a “pie-like” entity. The pre-existing voids disappear when the temperature increases to the “no-void” temperature (Tnv). The corresponding Ta and Tnv are obtained at higher values with an increased heating rate, because higher heating rates will cause shorter durations for atomic interactions. The stacked-NPs model would require extra energy (reflected in the higher temperatures) to force the atoms to fill the voids with higher heating rates. Both Ta and Tnv are ~40 K less in the C-type models due to the denser stacking pattern with six necks and a relatively small void size, which the Al shell atoms can quickly fill, thus reducing the total time for a complete sintering process. Moreover, the lower Ta and Tnv values in the C-type indicate the requirement of more thermal energy to fuse the Al shell material, resulting in a consistent difference between Ta and Tnv of ~50 K compared to that of ~20 K in the A-type. The radial distribution function data for the C-type models reveal that the Al shell could still be in a solid state when the NPs are completely sintered, even under a faster heating rate. On the contrary, the A-type model initially looks clean and tidy, but it will be challenging to maintain the desired “pie-like” structure of the final sintered product when the temperature reaches the melting point of the shell material.
In the real-world SLS process, a large amount of nanoscale metal powders is distributed randomly in the 3D space. Although the present work demonstrates the sintering behaviors only for the 2D planar stacked-NP model, the results could be extended to a 3D environment, for the further prediction of the laser sintering process at the nanoscale. In a limited space, the NPs will stack up to form a close-packed structure with great possibility. The MD simulation results suggest that the C-type stacked-NPs model with a slower heating rate and a longer melting duration would help to fabricate a stable, fully sintered product at a relatively low final sintering temperature.

Author Contributions

Conceptualization, S.J.; data curation, H.Z.; investigation, H.Z.; methodology, H.Z.; supervision, S.J.; validation, Y.-C.S. and Y.H.; writing—original draft preparation, H.Z.; writing—review and editing, Y.-C.S., Y.H. and S.J. All authors have read and agreed to the published version of the manuscript.

Funding

Part of this work was funded via fundamental scientific research grants by National Aeronautics and Space Administration, grant number 80NSSC19M0053.

Institutional Review Board Statement

Not applicable.

Informed Consent Statement

Not applicable.

Data Availability Statement

All the pertinent data are presented in the manuscript and associated figures.

Acknowledgments

S.J. acknowledges the support from the National Aeronautics and Space Administration (80NSSC19M0053).

Conflicts of Interest

The authors declare that they have no known competing financial interests or personal relationships that could have appeared to influence the work reported in this paper.

References

  1. Herzog, D.; Seyda, V.; Wycisk, E.; Emmelmann, C. Additive Manufacturing of Metals. Acta Mater. 2016, 117, 371–392. [Google Scholar] [CrossRef]
  2. National Aeronautics and Space Administration Additive Manufacturing of Lightweight Metallic Structures. Available online: https://www.sbir.gov/node/801079 (accessed on 15 January 2022).
  3. Paul, C.P.; Jinoop, A.N.; Kumar, A.; Bindra, K.S. Laser-Based Metal Additive Manufacturing: Technology, Global Scenario and Our Experiences. Trans. Indian Natl. Acad. Eng. 2021, 6, 895–908. [Google Scholar] [CrossRef]
  4. Sudbrack, C.; Ellis, D.; Hijonos, A.; Stanford, M.; Carter, B.; Lerch, B.; Smith, T. Select Additive Manufacturing Projects at NASA Glenn Research Center. In Proceedings of the CMU Visit, Carnegie Mellon University, Pittsburgh, PA, USA, 22 April 2016. [Google Scholar]
  5. Lores, A.; Azurmendi, N.; Agote, I.; Zuza, E. A Review on Recent Developments in Binder Jetting Metal Additive Manufacturing: Materials and Process Characteristics. Powder Metall. 2019, 62, 267–296. [Google Scholar] [CrossRef]
  6. Slotwinski, J.A.; Garboczi, E.J.; Stutzman, P.E.; Ferraris, C.F.; Watson, S.S.; Peltz, M.A. Characterization of Metal Powders Used for Additive Manufacturing. J. Res. Natl. Inst. Stand. Technol. 2014, 119, 460. [Google Scholar] [CrossRef] [PubMed]
  7. Joshi, S.C.; Sheikh, A.A. 3D Printing in Aerospace and Its Long-Term Sustainability. Virtual Phys. Prototyp. 2015, 10, 175–185. [Google Scholar] [CrossRef]
  8. Greer, J.R.; Street, R.A. Thermal Cure Effects on Electrical Performance of Nanoparticle Silver Inks. Acta Mater. 2007, 55, 6345–6349. [Google Scholar] [CrossRef]
  9. Rapallo, A.; Olmos-Asar, J.A.; Oviedo, O.A.; Ludueña, M.; Ferrando, R.; Mariscal, M.M. Thermal Properties of Co/Au Nanoalloys and Comparison of Different Computer Simulation Techniques. J. Phys. Chem. C 2012, 116, 17210–17218. [Google Scholar] [CrossRef]
  10. Zhang, J.-P.; Zhang, Y.-Y.; Wang, E.-P.; Tang, C.-M.; Cheng, X.-L.; Zhang, Q.-H. Size Effect in the Melting and Freezing Behaviors of Al/Ti Core-Shell Nanoparticles Using Molecular Dynamics Simulations. Chin. Phys. B 2016, 25, 036102. [Google Scholar] [CrossRef]
  11. Rahmani, F.; Jeon, J.; Jiang, S.; Nouranian, S. Melting and Solidification Behavior of Cu/Al and Ti/Al Bimetallic Core/Shell Nanoparticles during Additive Manufacturing by Molecular Dynamics Simulation. J. Nanopart. Res. 2018, 20, 133. [Google Scholar] [CrossRef]
  12. Jeon, J.; Jiang, S.; Rahmani, F.; Nouranian, S. Molecular Dynamics Study of Temperature and Heating Rate–Dependent Sintering of Titanium Nanoparticles and Its Influence on the Sequent Tension Tests of the Formed Particle-Chain Products. J. Nanopart. Res. 2020, 22, 26. [Google Scholar] [CrossRef]
  13. Ghosh Chaudhuri, R.; Paria, S. Core/Shell Nanoparticles: Classes, Properties, Synthesis Mechanisms, Characterization, and Applications. Chem. Rev. 2012, 112, 2373–2433. [Google Scholar] [CrossRef]
  14. Gawande, M.B.; Goswami, A.; Asefa, T.; Guo, H.; Biradar, A.V.; Peng, D.-L.; Zboril, R.; Varma, R.S. Core–Shell Nanoparticles: Synthesis and Applications in Catalysis and Electrocatalysis. Chem. Soc. Rev. 2015, 44, 7540–7590. [Google Scholar] [CrossRef] [PubMed]
  15. Mélinon, P.; Begin-Colin, S.; Duvail, J.L.; Gauffre, F.; Boime, N.H.; Ledoux, G.; Plain, J.; Reiss, P.; Silly, F.; Warot-Fonrose, B. Engineered Inorganic Core/Shell Nanoparticles. Phys. Rep. 2014, 543, 163–197. [Google Scholar] [CrossRef] [Green Version]
  16. Andrzejak, T.; Shafirovich, E.; Varma, A. Ignition Mechanism of Nickel-Coated Aluminum Particles. Combust. Flame 2007, 150, 60–70. [Google Scholar] [CrossRef]
  17. Bai, J.; Wang, J.-P. High-Magnetic-Moment Core-Shell-Type FeCo–Au/Ag Nanoparticles. Appl. Phys. Lett. 2005, 87, 152502. [Google Scholar] [CrossRef]
  18. Hennes, M.; Lotnyk, A.; Mayr, S.G. Plasma-Assisted Synthesis and High-Resolution Characterization of Anisotropic Elemental and Bimetallic Core–Shell Magnetic Nanoparticles. Beilstein. J. Nanotechnol. 2014, 5, 466–475. [Google Scholar] [CrossRef] [PubMed] [Green Version]
  19. Thaler, P.; Volk, A.; Lackner, F.; Steurer, J.; Knez, D.; Grogger, W.; Hofer, F.; Ernst, W.E. Formation of Bimetallic Core-Shell Nanowires along Vortices in Superfluid He Nanodroplets. Phys. Rev. B 2014, 90, 155442. [Google Scholar] [CrossRef]
  20. Haberfehlner, G.; Thaler, P.; Knez, D.; Volk, A.; Hofer, F.; Ernst, W.E.; Kothleitner, G. Formation of Bimetallic Clusters in Superfluid Helium Nanodroplets Analysed by Atomic Resolution Electron Tomography. Nat. Commun. 2015, 6, 8779. [Google Scholar] [CrossRef] [Green Version]
  21. Hanuš, J.; Vaidulych, M.; Kylián, O.; Choukourov, A.; Kousal, J.; Khalakhan, I.; Cieslar, M.; Solař, P.; Biederman, H. Fabrication of Ni@Ti Core–Shell Nanoparticles by Modified Gas Aggregation Source. J. Phys. D Appl. Phys. 2017, 50, 475307. [Google Scholar] [CrossRef] [Green Version]
  22. Zhong, C.J.; Maye, M.M. Core–Shell Assembled Nanoparticles as Catalysts. Adv. Mater. 2001, 13, 1507–1511. [Google Scholar] [CrossRef]
  23. Zhao, S.; Germann, T.C.; Strachan, A. Molecular Dynamics Characterization of the Response of Ni/Al Nanolaminates Under Dynamic Loading. J. Propuls. Power 2007, 23, 693–697. [Google Scholar] [CrossRef]
  24. Lim, I.-I.S.; Njoki, P.N.; Park, H.-Y.; Wang, X.; Wang, L.; Mott, D.; Zhong, C.-J. Gold and Magnetic Oxide/Gold Core/Shell Nanoparticles as Bio-Functional Nanoprobes. Nanotechnology 2008, 19, 305102. [Google Scholar] [CrossRef] [PubMed]
  25. Reiss, P.; Protière, M.; Li, L. Core/Shell Semiconductor Nanocrystals. Small 2009, 5, 154–168. [Google Scholar] [CrossRef] [PubMed]
  26. Yang, Z.; Yang, X.; Xu, Z. Molecular Dynamics Simulation of the Melting Behavior of Pt−Au Nanoparticles with Core−Shell Structure. J. Phys. Chem. C 2008, 112, 4937–4947. [Google Scholar] [CrossRef]
  27. Song, P.; Wen, D. Molecular Dynamics Simulation of a Core−Shell Structured Metallic Nanoparticle. J. Phys. Chem. C 2010, 114, 8688–8696. [Google Scholar] [CrossRef]
  28. Huang, R.; Wen, Y.-H.; Shao, G.-F.; Sun, S.-G. Insight into the Melting Behavior of Au–Pt Core–Shell Nanoparticles from Atomistic Simulations. J. Phys. Chem. C 2013, 117, 4278–4286. [Google Scholar] [CrossRef]
  29. Wang, J.; Shin, S.; Hu, A. Geometrical Effects on Sintering Dynamics of Cu–Ag Core–Shell Nanoparticles. J. Phys. Chem. C 2016, 120, 17791–17800. [Google Scholar] [CrossRef]
  30. Wang, J.; Shin, S. Sintering of Multiple Cu–Ag Core–Shell Nanoparticles and Properties of Nanoparticle-Sintered Structures. RSC Adv. 2017, 7, 21607–21617. [Google Scholar] [CrossRef] [Green Version]
  31. Li, S.; Liu, Y.; Sun, F.; Fang, H. Multi-Particle Molecular Dynamics Simulation: Shell Thickness Effects on Sintering Process of Cu-Ag Core-Shell Nanoparticles. J. Nanopart. Res. 2021, 23, 6. [Google Scholar] [CrossRef]
  32. Zhang, H.; Jeon, J.; Rahmani, F.; Nouranian, S.; Jiang, S. Sintered Ti/Al Core/Shell Nanoparticles: Computational Investigation of the Effects of Core Volume Fraction, Heating Rate, and Room-Temperature Relaxation on Tensile Properties. J. Phys. D Appl. Phys. 2022, 55, 025302. [Google Scholar] [CrossRef]
  33. Meng, F.; Huang, J. Evolution Mechanism of Photonically Sintered Nano-Silver Conductive Patterns. Nanomaterials 2019, 9, 258. [Google Scholar] [CrossRef] [PubMed] [Green Version]
  34. Plimpton, S. Fast Parallel Algorithms for Short-Range Molecular Dynamics. J. Comput. Phys. 1995, 117, 1–19. [Google Scholar] [CrossRef] [Green Version]
  35. Daw, M.S.; Baskes, M.I. Embedded-Atom Method: Derivation and Application to Impurities, Surfaces, and Other Defects in Metals. Phys. Rev. B 1984, 29, 6443–6453. [Google Scholar] [CrossRef] [Green Version]
  36. Daw, M.S.; Foiles, S.M.; Baskes, M.I. The Embedded-Atom Method: A Review of Theory and Applications. Mater. Sci. Rep. 1993, 9, 251–310. [Google Scholar] [CrossRef] [Green Version]
  37. Connerade, J.-P. Quasi-Atoms and Super-Atoms. Phys. Scr. 2003, 68, C25–C32. [Google Scholar] [CrossRef]
  38. Zope, R.R.; Mishin, Y. Interatomic Potentials for Atomistic Simulations of the Ti-Al System. Phys. Rev. B 2003, 68, 024102. [Google Scholar] [CrossRef] [Green Version]
  39. Hirel, P. Atomsk: A Tool for Manipulating and Converting Atomic Data Files. Comput. Phys. Commun. 2015, 197, 212–219. [Google Scholar] [CrossRef]
  40. Xiong, S.; Qi, W.; Huang, B.; Wang, M.; Li, Y.; Li, Z.; Liang, S. Size- and Temperature-Induced Phase Transformations of Titanium Nanoparticles. EPL 2011, 93, 66002. [Google Scholar] [CrossRef]
  41. Yang, J.X.; Zhao, H.L.; Gong, H.R.; Song, M.; Ren, Q.Q. Proposed Mechanism of HCP → FCC Phase Transition in Titianium through First Principles Calculation and Experiments. Sci. Rep. 2018, 8, 1992. [Google Scholar] [CrossRef] [Green Version]
  42. Han, G.; Lu, X.; Xia, Q.; Lei, B.; Yan, Y.; Shang, C.J. Face-Centered-Cubic Titanium—A New Crystal Structure of Ti in a Ti-8Mo-6Fe Alloy. J. Alloy. Compd. 2018, 748, 943–952. [Google Scholar] [CrossRef]
  43. Bai, F.; Yin, L.; Zhao, W.; Zhou, H.; Song, M.; Liu, Y.; Liu, X. Deformational Behavior of Face-Centered Cubic (FCC) Phase in High-Pure Titanium. Mater. Sci. Eng. A 2021, 800, 140287. [Google Scholar] [CrossRef]
  44. Nosé, S. A Unified Formulation of the Constant Temperature Molecular Dynamics Methods. J. Chem. Phys. 1984, 81, 511–519. [Google Scholar] [CrossRef] [Green Version]
  45. Hoover, W.G. Canonical Dynamics: Equilibrium Phase-Space Distributions. Phys. Rev. A 1985, 31, 1695–1697. [Google Scholar] [CrossRef] [Green Version]
  46. Gan, Y.; Jiang, S. Ultrafast Laser-Induced Premelting and Structural Transformation of Gold Nanorod. J. Appl. Phys. 2013, 113, 073507. [Google Scholar] [CrossRef]
  47. Jiang, S.; Gan, Y. Atomic-Level Modeling of Ultrafast Laser Interaction with Semiconductor. In Femtosecond Lasers: New Research; Zhang, Y., Ed.; Nova Science Publishers, Inc.: Hauppauge, NY, USA, 2013; pp. 103–136. ISBN 978-1-62948-059-6. [Google Scholar]
  48. Pronko, P.P.; VanRompay, P.A.; Horvath, C.; Loesel, F.; Juhasz, T.; Liu, X.; Mourou, G. Avalanche Ionization and Dielectric Breakdown in Silicon with Ultrafast Laser Pulses. Phys. Rev. B 1998, 58, 2387–2390. [Google Scholar] [CrossRef]
  49. Stukowski, A. Visualization and Analysis of Atomistic Simulation Data with OVITO–the Open Visualization Tool. Model. Simul. Mater. Sci. Eng. 2010, 18, 015012. [Google Scholar] [CrossRef]
  50. Faken, D.; Jónsson, H. Systematic Analysis of Local Atomic Structure Combined with 3D Computer Graphics. Comput. Mater. Sci. 1994, 2, 279–286. [Google Scholar] [CrossRef]
  51. Jiang, S.; Zhang, Y.; Gan, Y.; Chen, Z.; Peng, H. Molecular Dynamics Study of Neck Growth in Laser Sintering of Hollow Silver Nanoparticles with Different Heating Rates. J. Phys. D Appl. Phys. 2013, 46, 335302. [Google Scholar] [CrossRef]
Figure 1. Initial modeling of Ti–Al core–shell NPs with a core volume fraction of (a) 3%, (b) 12%, and (c) 30%. The Ti core and the Al shell are colored yellow and blue, respectively.
Jcs 06 00126 g001
Figure 2. (a) The A-type and (b) the C-type stacked-NPs model in a simulation box with their initial spatial density definition.
Jcs 06 00126 g002
Figure 3. MSD vs. time history for the solid-state sintering of stacked-NPs model with different core volume fractions (CVF) for (a) the A-type and (b) the C-type stacking patterns.
Jcs 06 00126 g003
Figure 4. Neck size measurement for every neck connection of each simulated model after the solid-state sintering process.
Jcs 06 00126 g004
Figure 5. The C-type stacked-NPs model with a core volume fraction of 12% after solid-state sintering contains some connection positions that are weakly solid-state sintered.
Jcs 06 00126 g005
Figure 6. Example cross-sectional view of atomic configurations of the A-type stacked-NPs model with 30% core volume fraction in different instants (temperatures): (a) at 298 K, (b) at Ta, (c) at Tnv, and (d) at a relatively high temperature of 1050 K; panel (d) reveals the state of Ti cores in a large liquid oval with a melted Al shell in 3D view.
Jcs 06 00126 g006
Figure 7. Example cross-sectional view of atomic configurations of the C-type stacked-NPs model with 30% core volume fraction in different instants (temperatures): (a) at 298 K, (b) at Ta, (c) at Tnv, and (d) at a relatively high temperature of 1050 K; panel (d) reveals the state of Ti cores in a large liquid oval with a melted Al shell in 3D view.
Jcs 06 00126 g007
Figure 8. Radial distribution function (RDF) curves of the Al shell at four different temperatures for cases with a 30% core volume fraction and a 0.5 Kps−1 heating rate in (a) the A-type and (b) the C-type: 298 K, ~Ta, ~Tnv, and 950 K (exceeds the melting point); all cases have relatively the same RDF curves at their own Ta but not at Tnv.
Jcs 06 00126 g008
Figure 9. Relative Rg along z-direction (Rgzz) curves for 30% core volume fraction (CVF) cases with all heating rates in (a) the A-type and (b) the C-type.
Jcs 06 00126 g009
Figure 10. Effect of heating rate on the mean squared displacement (MSD) for different core volume fractions (CVF) in both stacking types; (a) A-type, 3% CVF; (b) A-type, 12% CVF; (c) A-type, 30% CVF; (d) C-type, 3% CVF; (e) C-type, 12% CVF; (f) C-type, 30% CVF.
Jcs 06 00126 g010
Figure 11. Example atomic configurations of stacked-NPs model with 30% core volume fraction in both types at different instants (temperatures): (a,e) at 298 K, (b,f) at 700 K, (c,g) at Ta, and (d,h) at Tnv.
Jcs 06 00126 g011
Table 1. Aggregation temperature (Ta) and “no-void” temperature (Tnv) for both types with 3%, 12%, and 30% core volume fraction (CVF) NPs under 0.04, 0.2, 0.5, and 1.0 K ps−1 heating rate (HR) melting processes.
A-TypeC-Type
HR (K ps−1)CFVTa (K)Tnv (K)Ta (K)Tnv (K)
0.043%882886810862
12%874882812860
30%880886812860
0.23%876892830876
12%882890834886
30%878892836882
0.53%886904846884
12%886906848884
30%888910850888
1.03%900918852890
12%902922856892
30%892920856894
Table 2. Corresponding temperature at 10% expansion threshold in z-direction (TRg) for both types with 3%, 12%, and 30% core volume fraction (CVF) NPs under 0.04, 0.2, 0.5, and 1.0 K ps−1 heating rate (HR) melting processes.
A-TypeC-Type
HR (K ps−1)CFVTRg (K)
0.043%886867
12%880871
30%884870
0.23%890879
12%889881
30%892884
0.53%902889
12%899894
30%904888
1.03%922896
12%923898
30%915897
Publisher’s Note: MDPI stays neutral with regard to jurisdictional claims in published maps and institutional affiliations.