Article

Comparison of Experimental and Calculated Tensile Properties of Flax Fibres

by
Niphaphun Soatthiyanon
1,
Alan Crosky
1,* and
Michael T. Heitzmann
2
1
School of Materials Science and Engineering, UNSW Sydney, Kensington, NSW 2052, Australia
2
School of Mechanical and Mining Engineering, The University of Queensland, Brisbane, QLD 4072, Australia
*
Author to whom correspondence should be addressed.
J. Compos. Sci. 2022, 6(4), 100; https://doi.org/10.3390/jcs6040100
Submission received: 31 January 2022 / Revised: 11 March 2022 / Accepted: 17 March 2022 / Published: 22 March 2022
(This article belongs to the Special Issue Polymeric Composites Reinforced with Natural Fibers and Nanofillers)

Abstract

:
The tensile properties of natural plant fibres are commonly determined by single fibre testing. The cross-sectional area used to determine the modulus and strength is usually obtained by measuring the fibre width and using this as the fibre diameter on the assumption that the fibres are circular in section. The assumption of circularity is reasonably true for synthetic fibres but is not correct for natural fibres, and this can lead to a substantial error when determining the tensile properties of the fibres. The incorporation of a fibre area correction factor, which takes into account the non-circularity of natural fibres, has been proposed by earlier workers, who used it successfully to predict the mechanical properties of jute fibre composites. The aim of the present study was to evaluate the wider applicability of this methodology by applying it to flax fibre composites. The work involved determination of the tensile properties of 113 flax technical fibres using an experimentally determined fibre area correction factor to account for the non-circularity of the fibres. The data were then compared with those obtained from back-calculation of the results obtained from longitudinal tensile testing of flax/vinyl ester unidirectional composites manufactured utilising identical fibres to those used in the single fibre tests. Account was taken of the effect of fibre length on strength. The experimentally determined fibre area correction factor was found to be 2.70. Taking this into account for the single fibre tests, the back-calculated modulus of the flax fibres was within 6% of that obtained from the single fibre tests, while the strength was within 7%.

1. Introduction

Natural plant fibres, such as flax, are being used increasingly as the reinforcement in polymer matrix composites, particularly as a substitute for glass fibres. The use is driven by their good environmental credentials coupled with their low cost, low density, good specific properties and low energy consumption [1]. Being naturally occurring, they are a renewable resource and are also biodegradable, the latter being of importance for end-of-life disposal. Their use can also lead to the development of non-food agricultural economies which can be beneficial to rural communities [2]. The fibres also have significant occupational health benefits [3] compared to manmade fibres.
Applications of natural fibre composites are quite diverse. These include a wide range of interior components in automobiles, interior panelling in aircraft, sports equipment, toys, funeral articles, marine structures and cases for electronic devices such as laptops and mobile phones [1]. More traditional uses of natural fibres include paper and textiles.
One drawback of natural fibres is that, even for a particular species, the tensile properties vary considerably [1]. This is due to a variety of factors, including differences in the growth conditions, differences in age and differences in the harvesting or separation techniques. This means that the tensile properties need to be determined individually for fibres from different sources.
Conventionally, the tensile properties of the fibres have been determined assuming the fibre cross-sections to be circular. The assumption of circularity is reasonably true for synthetic fibres. However, as noted by Virk et al. [4,5], it causes substantial error for natural fibres since the fibre cross-sections are not generally circular. As a result, the tensile strength and modulus of the fibres determined in this way are underestimated. To account for this, a fibre area correction factor must be applied [4,5,6,7].
Virk et al. [5] experimentally determined the fibre area correction factor for jute fibres and used this in their determination of strength and modulus of the fibres. They then used this data to predict the mechanical properties of jute–epoxy composites and obtained good agreement between the predicted properties and those determined experimentally from jute–epoxy composites made from the same batch of fibres.
The present study was undertaken to evaluate the more general applicability of the methodology proposed by Virk et al. by applying it to flax fibre composites. Flax fibres were chosen for the study since they are one of the most commonly used fibres in natural fibre composites. This is because flax is amongst the stiffest and strongest of the natural plant fibres [1], while also being readily available. The use of a fibre area correction factor has not been evaluated previously for predicting the mechanical properties of flax fibre composites.
The work first determines the area correction factor for flax fibres extracted from a unidirectional flax fabric. The tensile properties of the flax fibres are then determined using the single fibre test method and the area correction factor applied. The results obtained are compared with fibre properties determined by back calculating the data obtained from tensile testing of unidirectional flax fibre/vinyl ester composites made from the same flax fabric. The procedure is shown schematically in Figure 1.

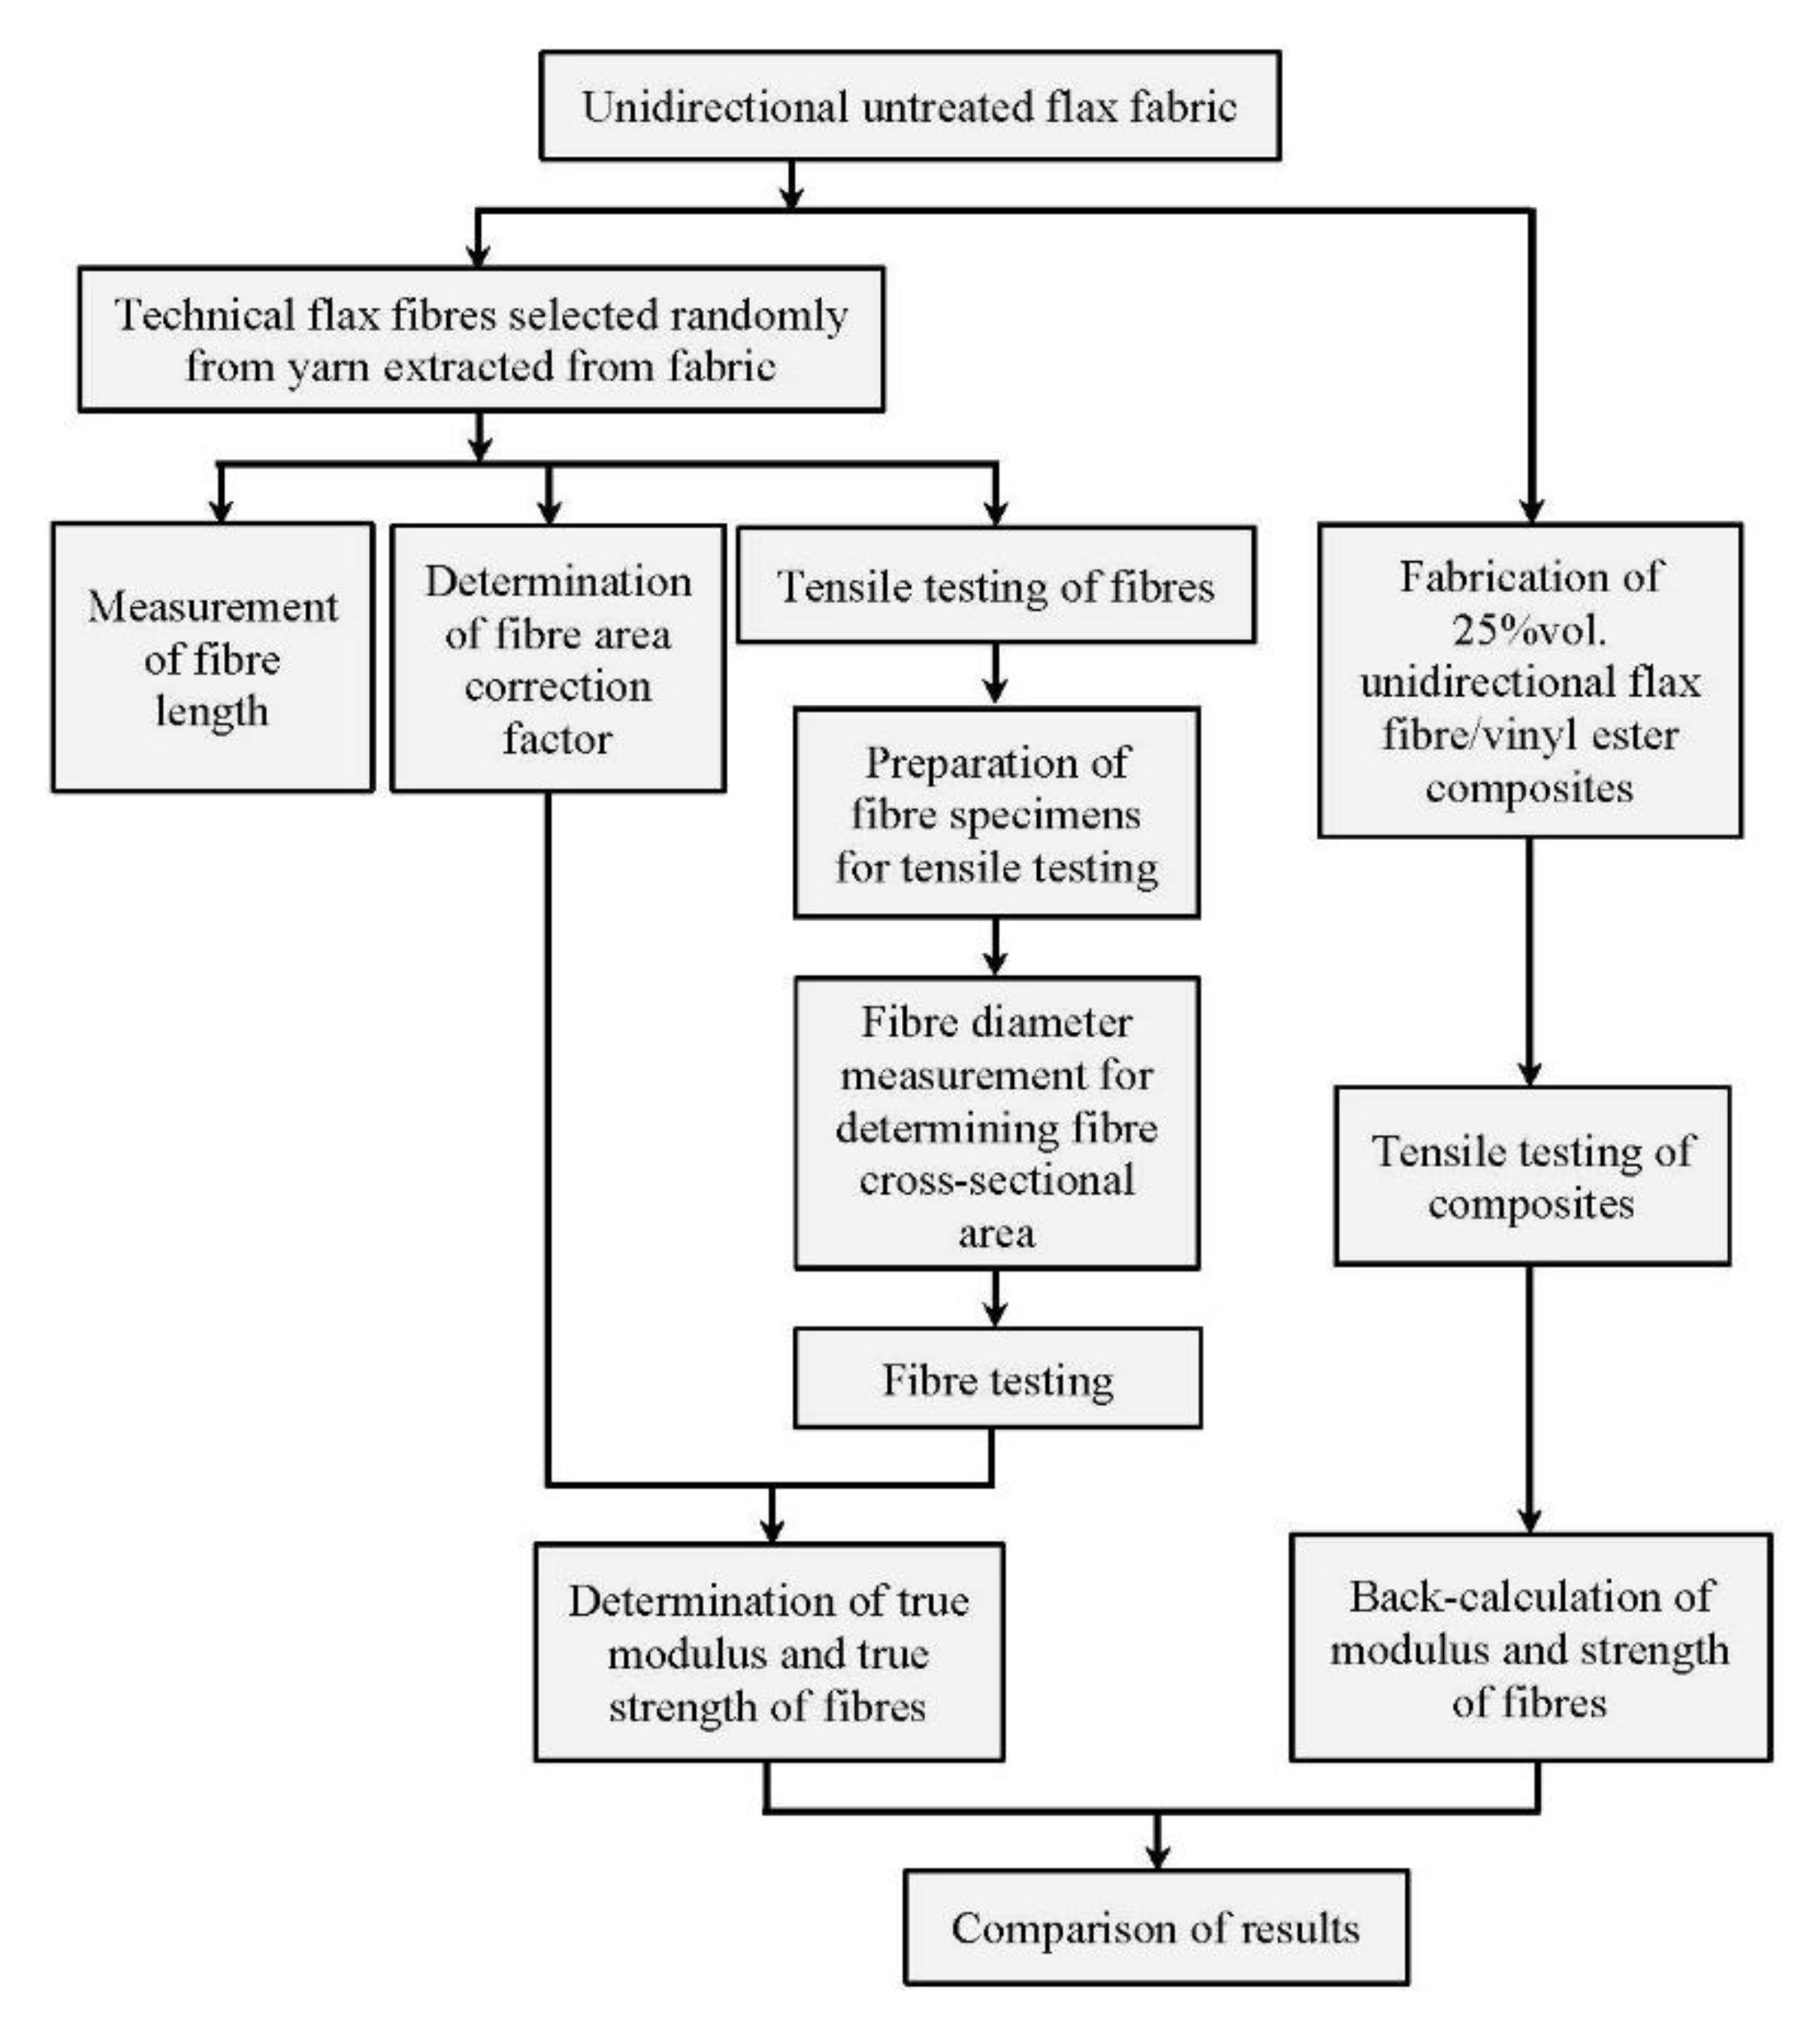
2. Materials and Methods
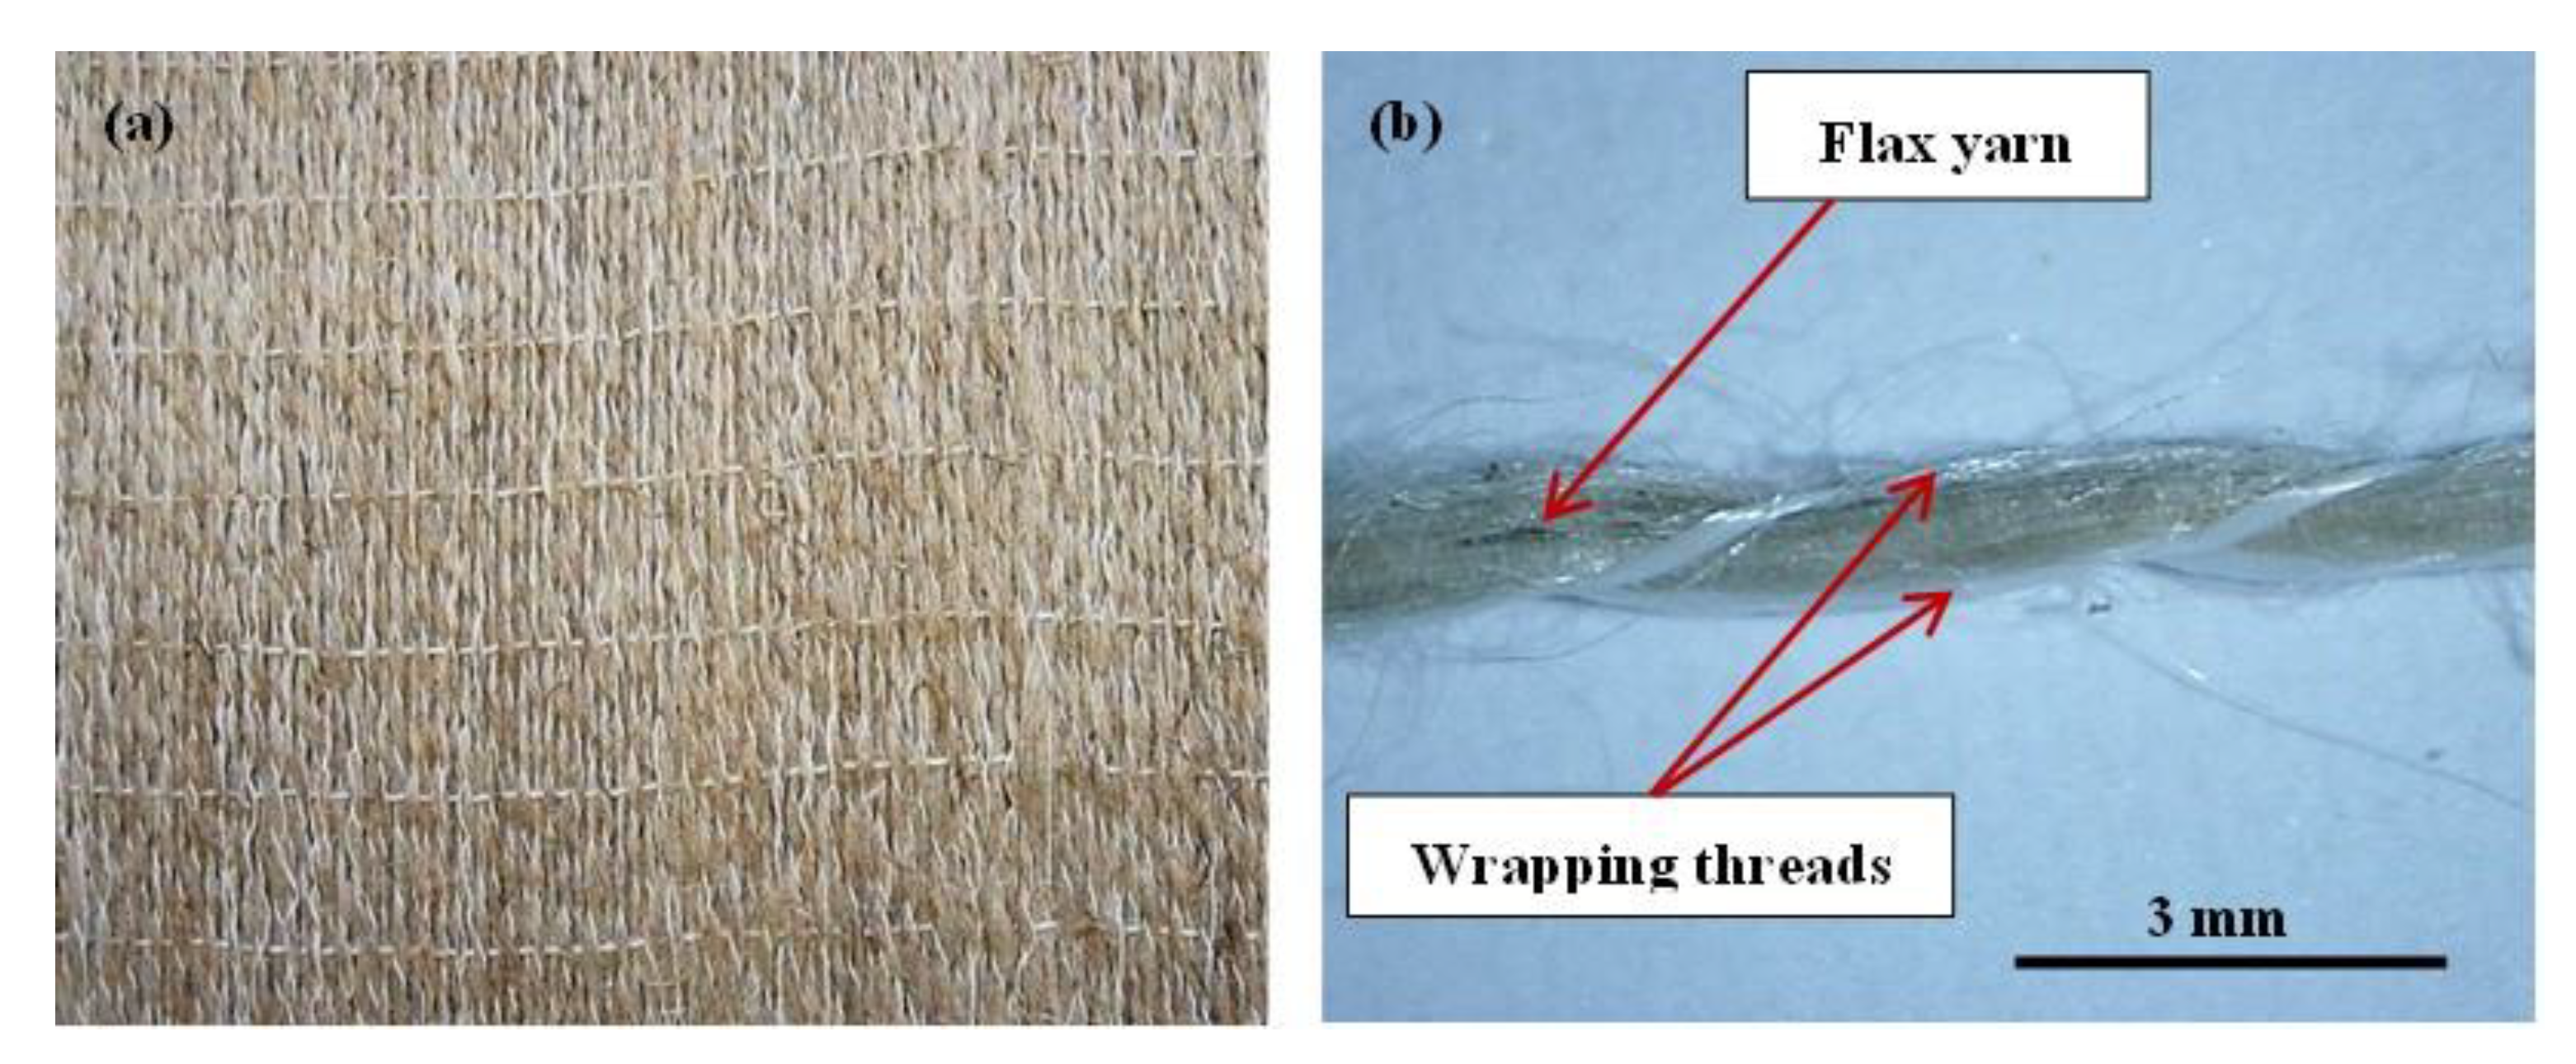
2.1. Materials

The flax fibres were obtained in the form of Biotex unidirectional untreated flax fabric supplied by Composites Evolution Ltd., Chesterfield, UK. The fabric had an areal weight of 275 g/m2 and was made from yarns of untwisted fibres held together by two spiral wrapping threads made from viscose rayon. Although nominally untwisted, the fibres were found to have a slight twist with a spiral angle of ~15°. The first wrapping thread had a spiral angle of ~30° while the second one had a spiral angle of ~15°. The yarns were held in place in the fabric by transverse threads applied every 10 mm (Figure 2). ArmorStar IVSXH210 vinyl ester infusion resin with Arkema Luperox DHD-9 catalyst, supplied by CCP Composites USA, was used as the matrix resin when making the composites.

2.2. Fibre Length Measurement

The fibre length was determined for 100 technical fibres randomly selected from a yarn extracted from the unidirectional fabric. The fibre length was measured to an accuracy of 1 mm using a ruler.

2.3. Tensile Testing of Single (Technical) Fibres

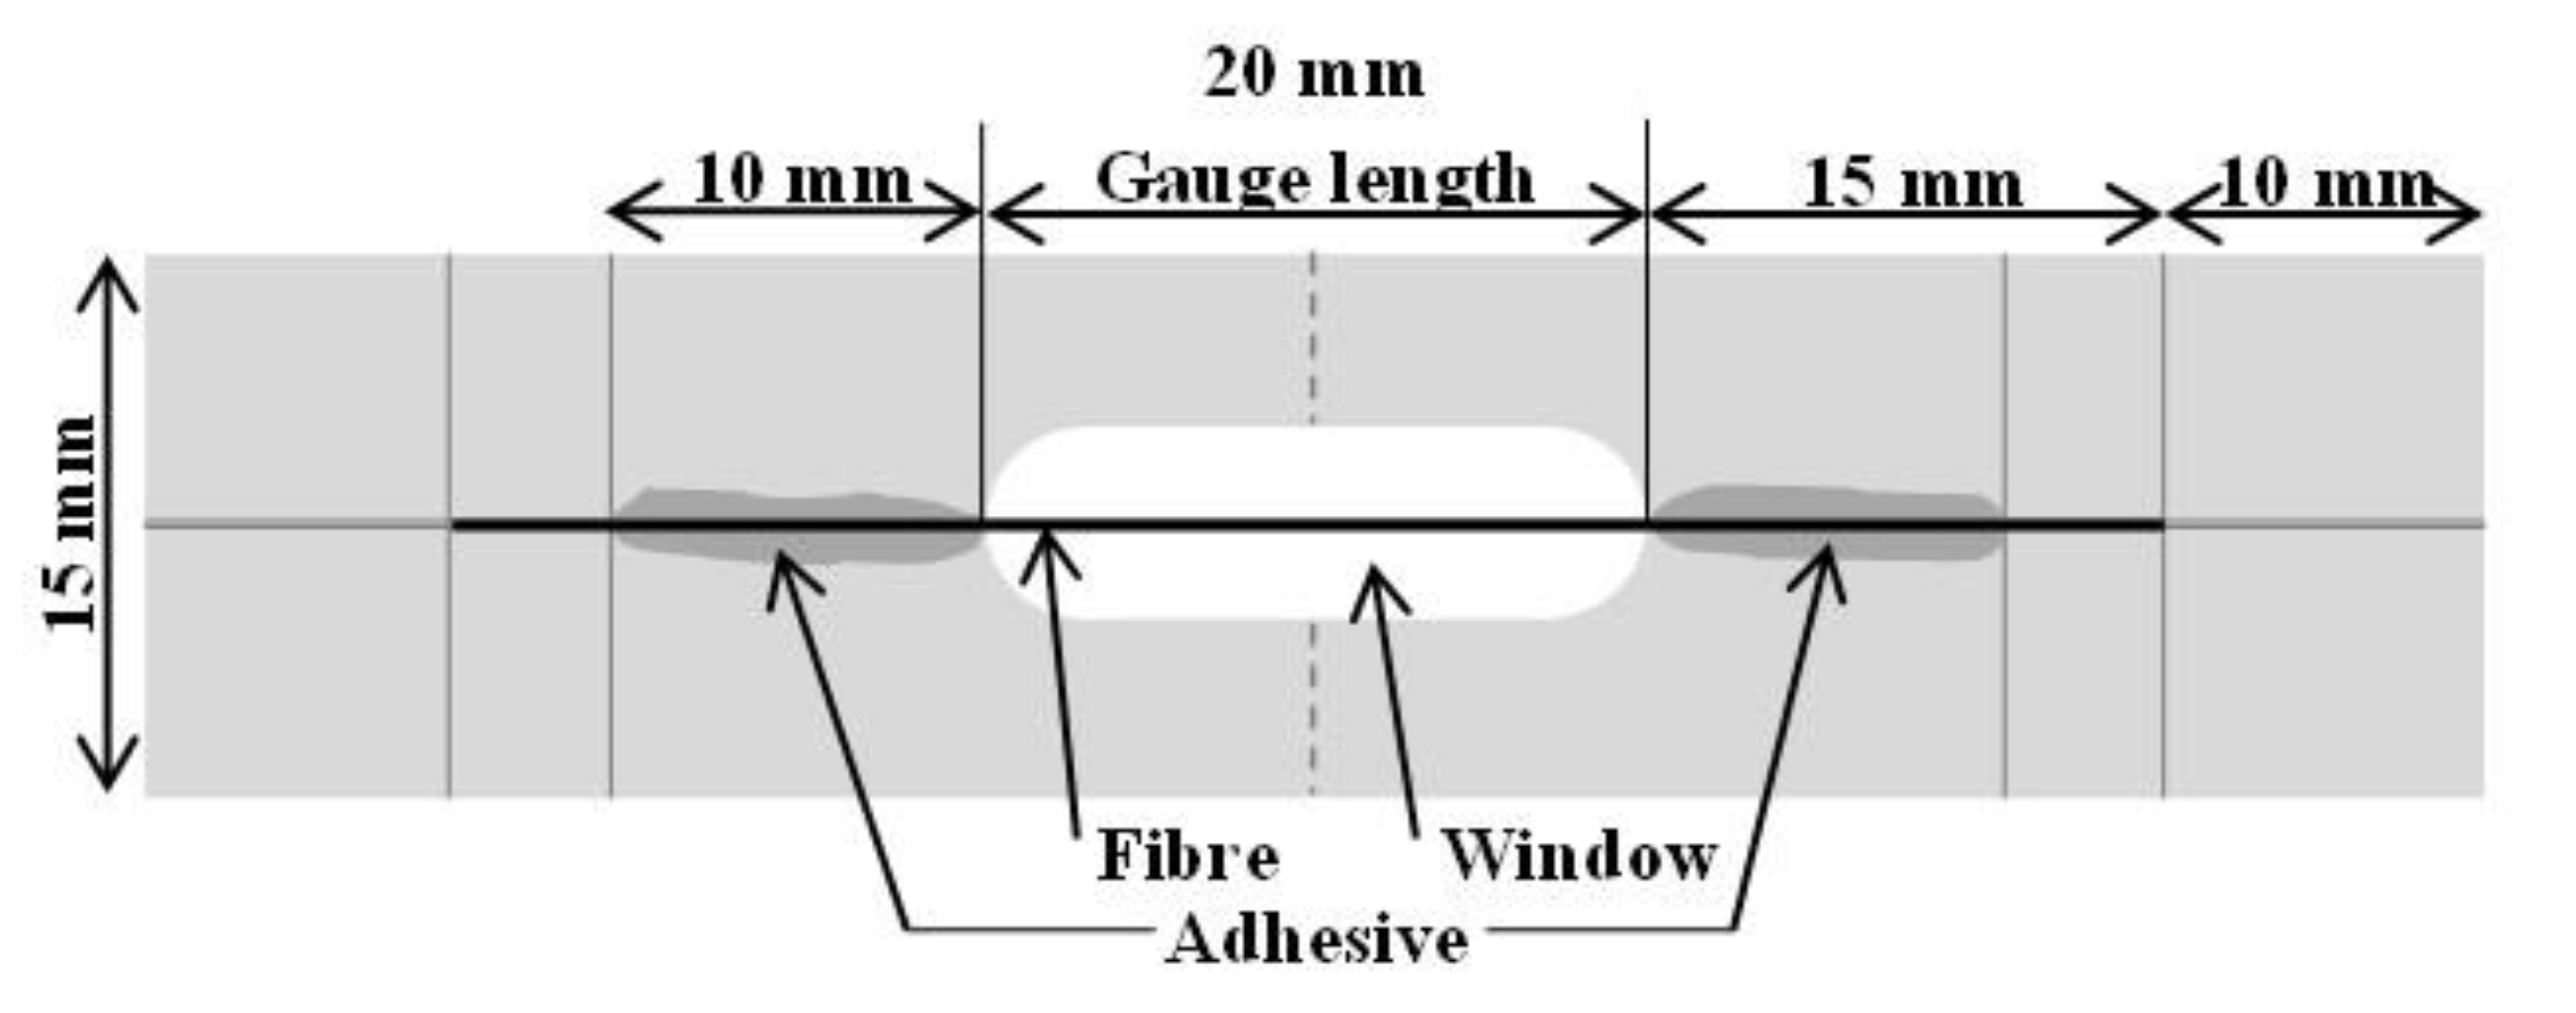
2.3.1. Specimen Preparation

Single fibre tensile testing was carried out on 113 technical fibres, which had been extracted from the unidirectional fabric. Each fibre was glued to a 0.6 mm thick paper tab, as shown in Figure 3, using cyanoacrylate adhesive. The specimens were then conditioned in a humidity chamber at 23 °C and 50% relative humidity for a minimum of 24 h.

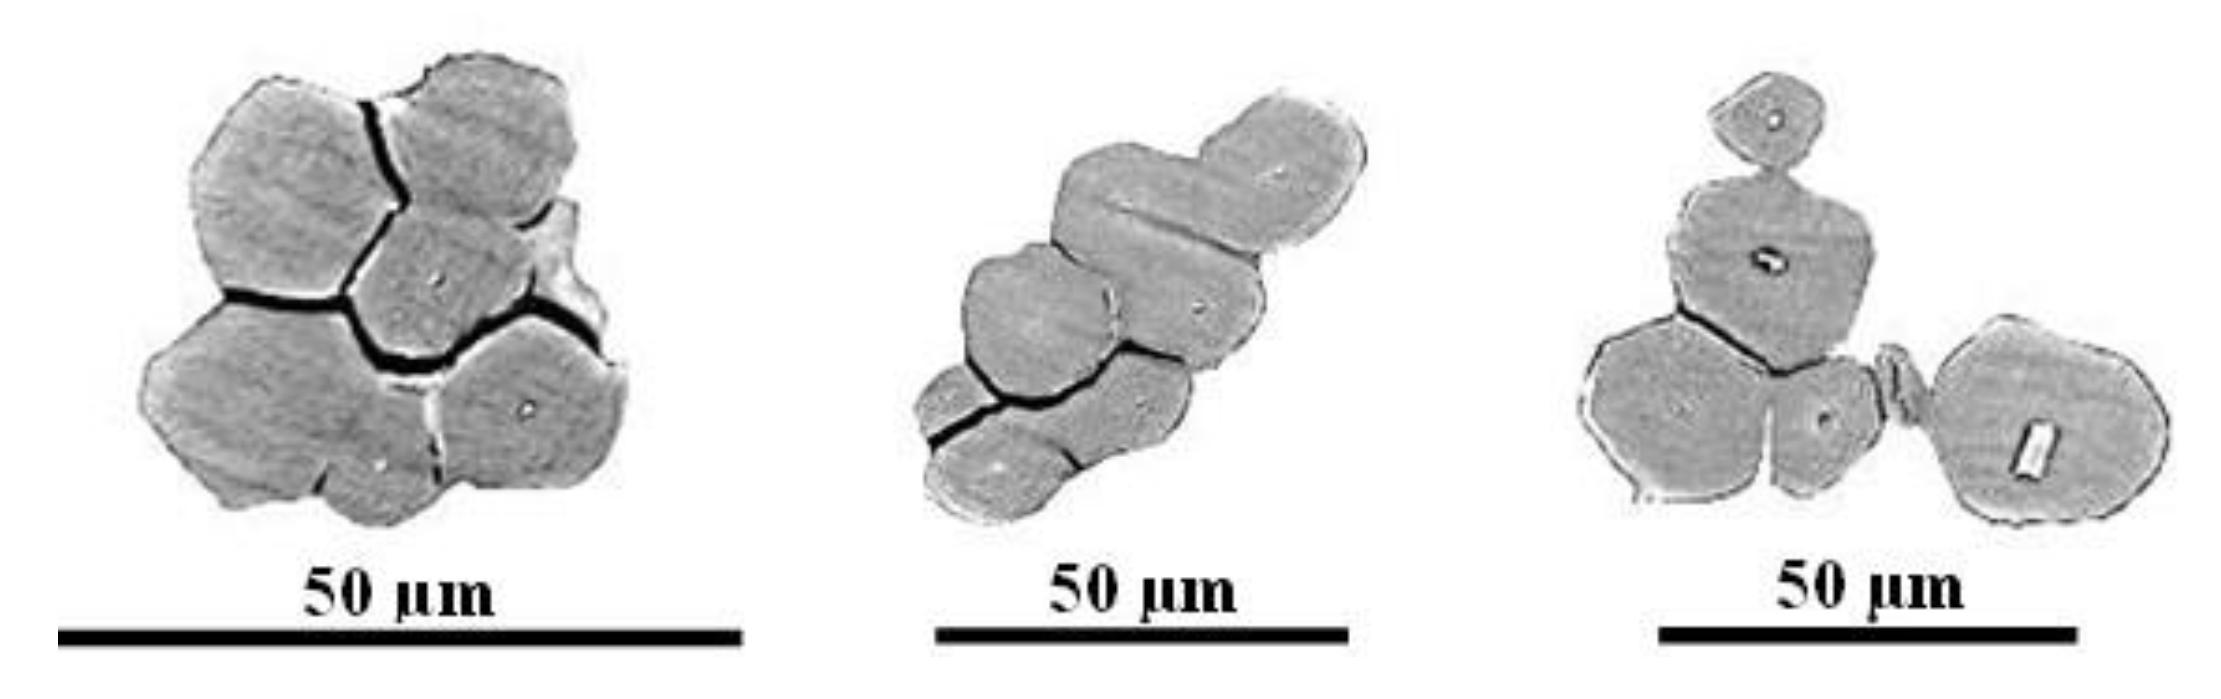
2.3.2. Determination of Fibre Cross-Sectional Area

The diameter of each of the technical fibres was measured, after conditioning, in two orthogonal planes, using a Nikon Eclipse ME600 optical microscope. The measurements were made at 18 approximately equally spaced locations along the length of the slot (20 mm) of the mounted specimen. The fibre diameters were measured using UTHSCSA Image Tool, and the average fibre diameter D for each specimen was then calculated. The measured fibre cross-sectional area A D , assumed to be circular in shape, was determined as π D 2 / 4 .

2.3.3. Fibre Testing

Prior to testing, the fibres were conditioned once again in the humidity chamber at 23 °C and 50% relative humidity for at least 24 h. Tensile testing was then conducted under ambient conditions of temperature and humidity using a method adapted from ASTM Standard C 1557-03. The tests were carried out using an Instron 5543 universal testing machine, with a 50 N load cell, at a crosshead speed of 0.2 mm/min, using pneumatic grips. The specimens were mounted with the grips extending right up to the end of the slot in the paper tab. The paper tab was then cut on either side of the slot and the test commenced. The tensile modulus of the fibres was determined at the strain ranges given in Table 1. The tensile strength was determined as the maximum stress from the stress–strain curve, while the strain to failure was determined as the strain at break.

2.3.4. Determination of Fibre Area Correction Factor

To determine the fibre area correction factor, 113 technical fibres were extracted from the unidirectional fabric yarns and mounted in a transverse cross-section in epoxy resin. The specimens were then metallographically ground and polished. The polished fibre surfaces were subsequently sputter coated with gold using an Emitech K550x gold sputter coater. They were then examined using a Hitachi S3400-X scanning electron microscope (SEM) operated in high vacuum mode at an accelerating voltage of 15 kV. Imaging was conducted using backscattered electrons to enhance the contrast. The true fibre cross-sectional areas A T were determined from the images using ImageJ.
The fibre area correction factor K is given by:
K = A D / A T
where A D and A T are the measured and true fibre cross-sectional areas, respectively. The area correction factor was determined using the method developed by Virk et al. [5,8]. This gives an average estimate of the ratio of the measured and true fibre cross-sectional areas. In this method, the fibre area correction factor is calculated from the ratio of the geometric means of the location parameter of the log-normal distributions of A D and A T . The log-normal probability density function (PDF) is given by:
f ( A ) = ( 1 / ( λ 2 π ) )   e x p [ ( 1 / 2 ) ( ( A μ ) / λ ) 2 ]
where A = l n ( A ) and A is the fibre area. μ is the location parameter, which is the arithmetic mean of the natural logarithms of the fibre areas (the average of A ). λ is the scale parameter, which is the standard deviation of the natural logarithms of the fibre areas (the standard deviation of A ). The geometric mean and geometric standard deviation for the fibre area A are then determined from e x p ( μ ) and e x p ( λ A ) , respectively. The fibre area correction factor is then given by:
K = e x p ( μ D ) / e x p ( μ T ) = μ D / μ T  
where μ D and μ T are the arithmetic means of the natural logarithms of A D and A T , respectively, and μ D and μ T are the geometric means for A D and A T , respectively [8].

2.3.5. Determination of True Modulus and True Strength

Both the elastic modulus and tensile strength are inverse functions of the cross-sectional area. From Equation (1), the true area is determined as the measured area divided by the area correction factor. Thus, the true values of the modulus E and strength σ are determined as their measured values multiplied by the area correction factor.

2.4. Unidirectional Composites

2.4.1. Fabrication of Composites

A unidirectional flax fibre/vinyl ester composite panel was fabricated by the Composites Innovation Centre (CIC), Canada, using rigid cavity vacuum resin transfer moulding (VaRTM). The composite panel was post-cured at 82 °C for 1 h. Vinyl ester infusion resin catalysed with 1.5 wt% ketone peroxide catalyst was used as the matrix resin, and the Biotex unidirectional flax fabric was used as the reinforcement. The composite panel was fabricated to have a fibre volume fraction of 31% based on the mass fractions of the resin and the fabric. It is noted that the spiral wrapping threads on the yarns and the transverse support threads in the fabric were included in the fibre mass fraction. The volume fraction of the flax fibres alone (i.e., excluding the wrapping threads) was 25%, while that of the wrapping threads alone was 6%.
A panel of the neat vinyl ester resin post-cured at 82 °C for 1 h was also prepared by the CIC for determination of the properties of the neat resin.

2.4.2. Tensile Testing of Composites

Tensile testing of the cured vinyl ester resin and the 25 volume % unidirectional composites was carried out by the Industrial Technology Centre (ITC), Canada, under ambient laboratory conditions (22 °C and ~40% relative humidity) using an MTS Landmark load-frame with a Tovey load cell and MTS controller/acquisition software. A mechanical extensometer with a 25.4 mm gauge length was used to measure strain. However, the strain at failure was not recorded. This is because the extensometer was removed from the specimens after a strain of ~0.6% to avoid extensometer damage.
Testing was carried out in accordance with ASTM D638 using dog-bone-shaped specimens having the Type I dimensions. For the composite samples, the longitudinal axis was parallel to the fibre direction. Five replicate specimens were tested. The tensile modulus was determined as the chord modulus at a strain range of 0.1–0.3%, and the ultimate tensile strength was determined as the maximum stress from the stress–strain curve.

3. Results

3.1. Flax Technical Fibres
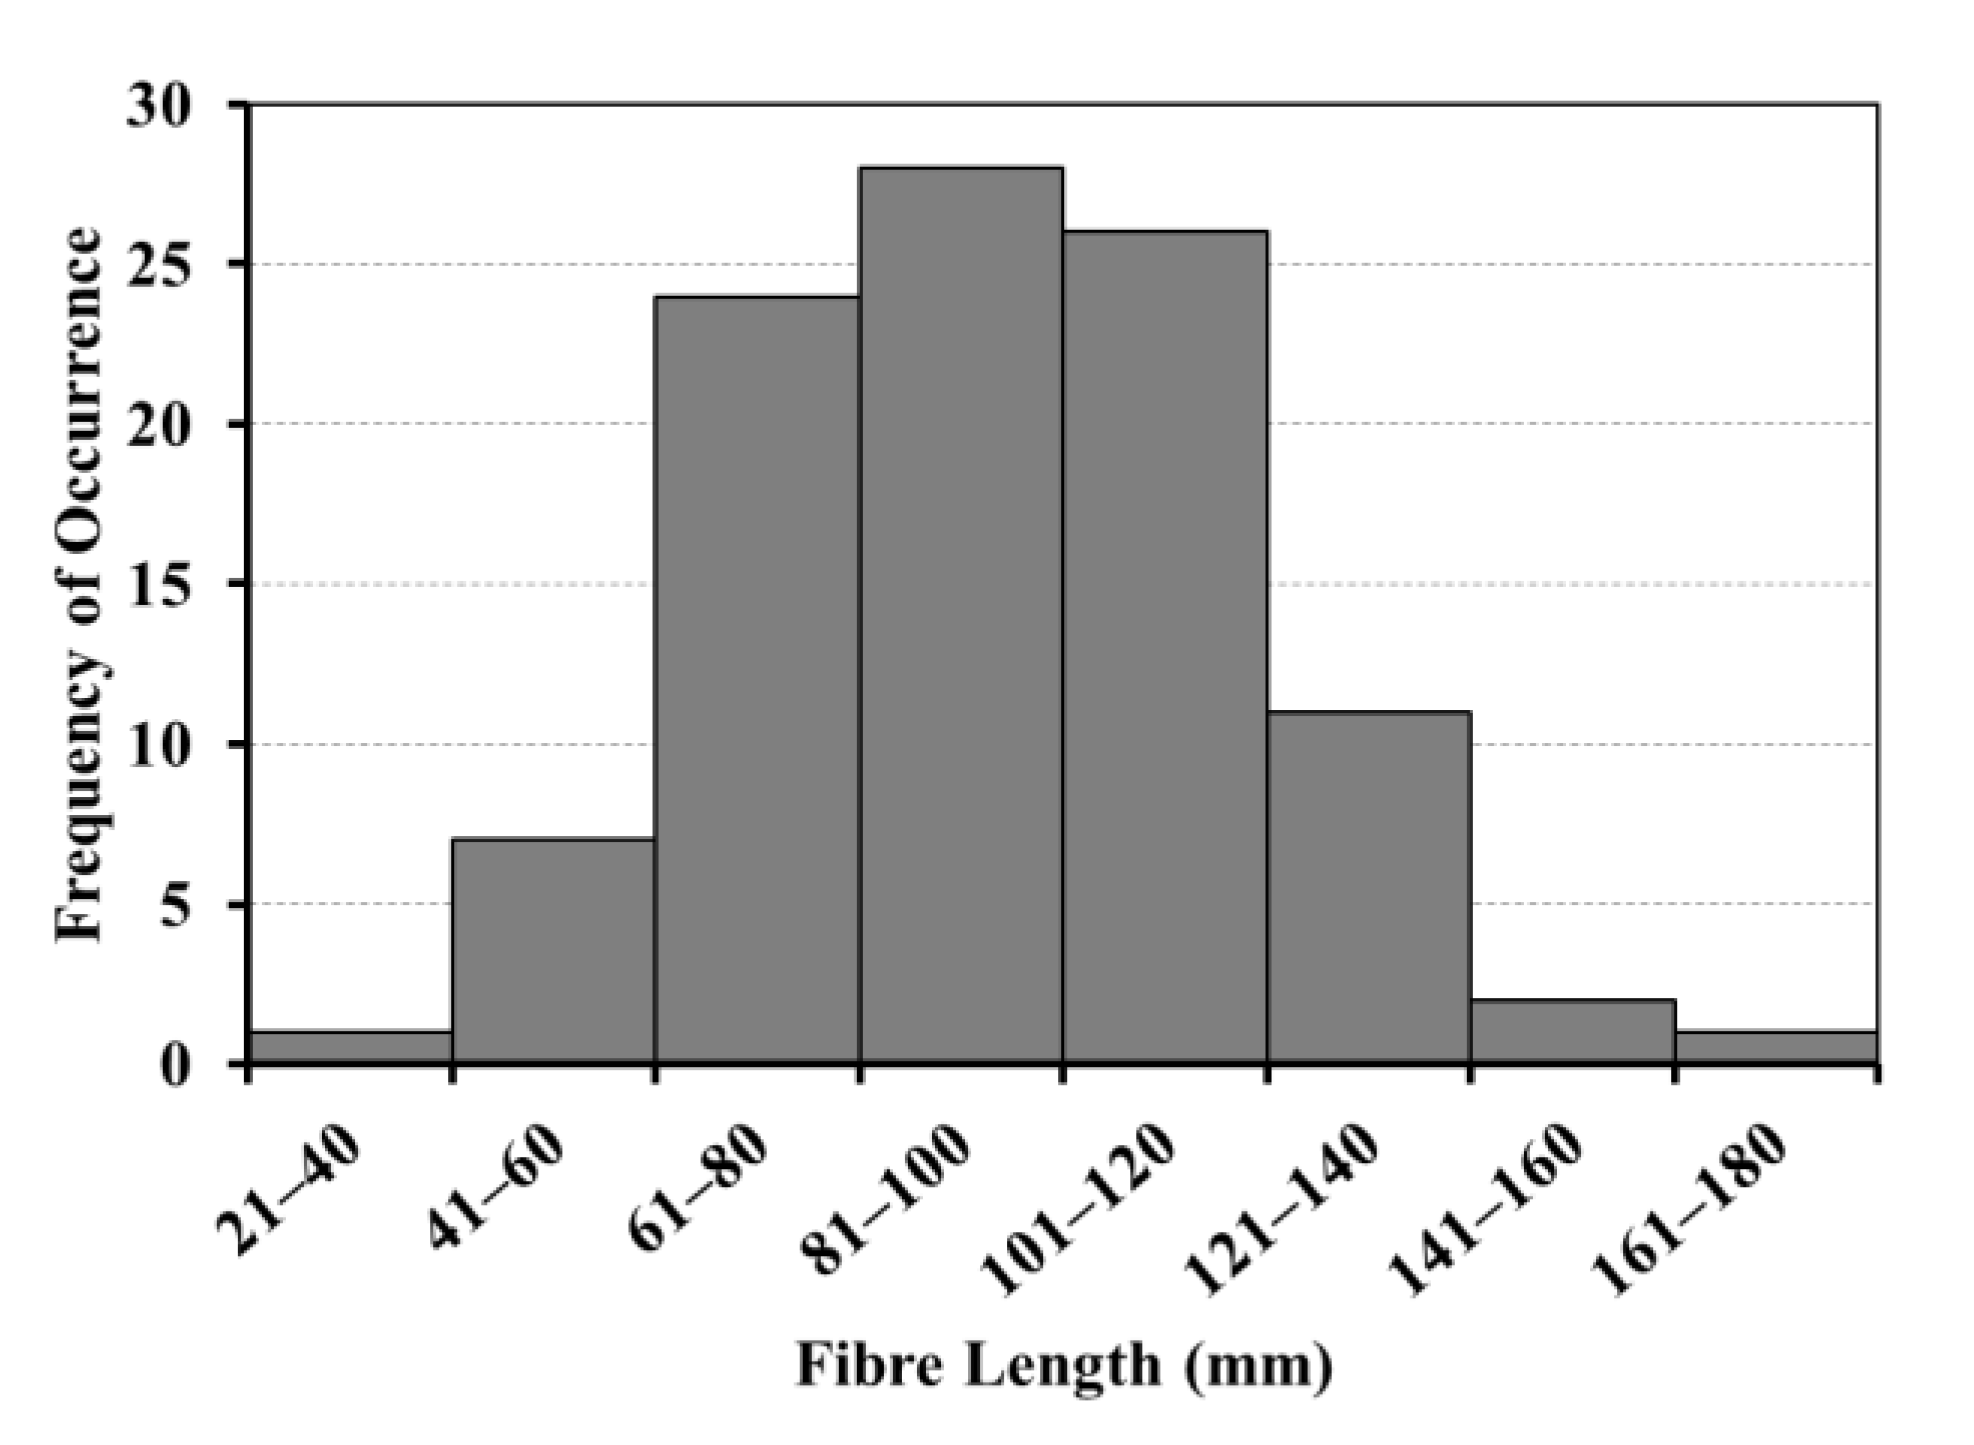
3.1.1. Fibre Length

A histogram showing the measured length of the fibres is given in Figure 4. The fibre length ranged from 39 to 170 mm (accuracy ± 1 mm) with the average length being 93 mm with a standard deviation of 25 mm (27%).

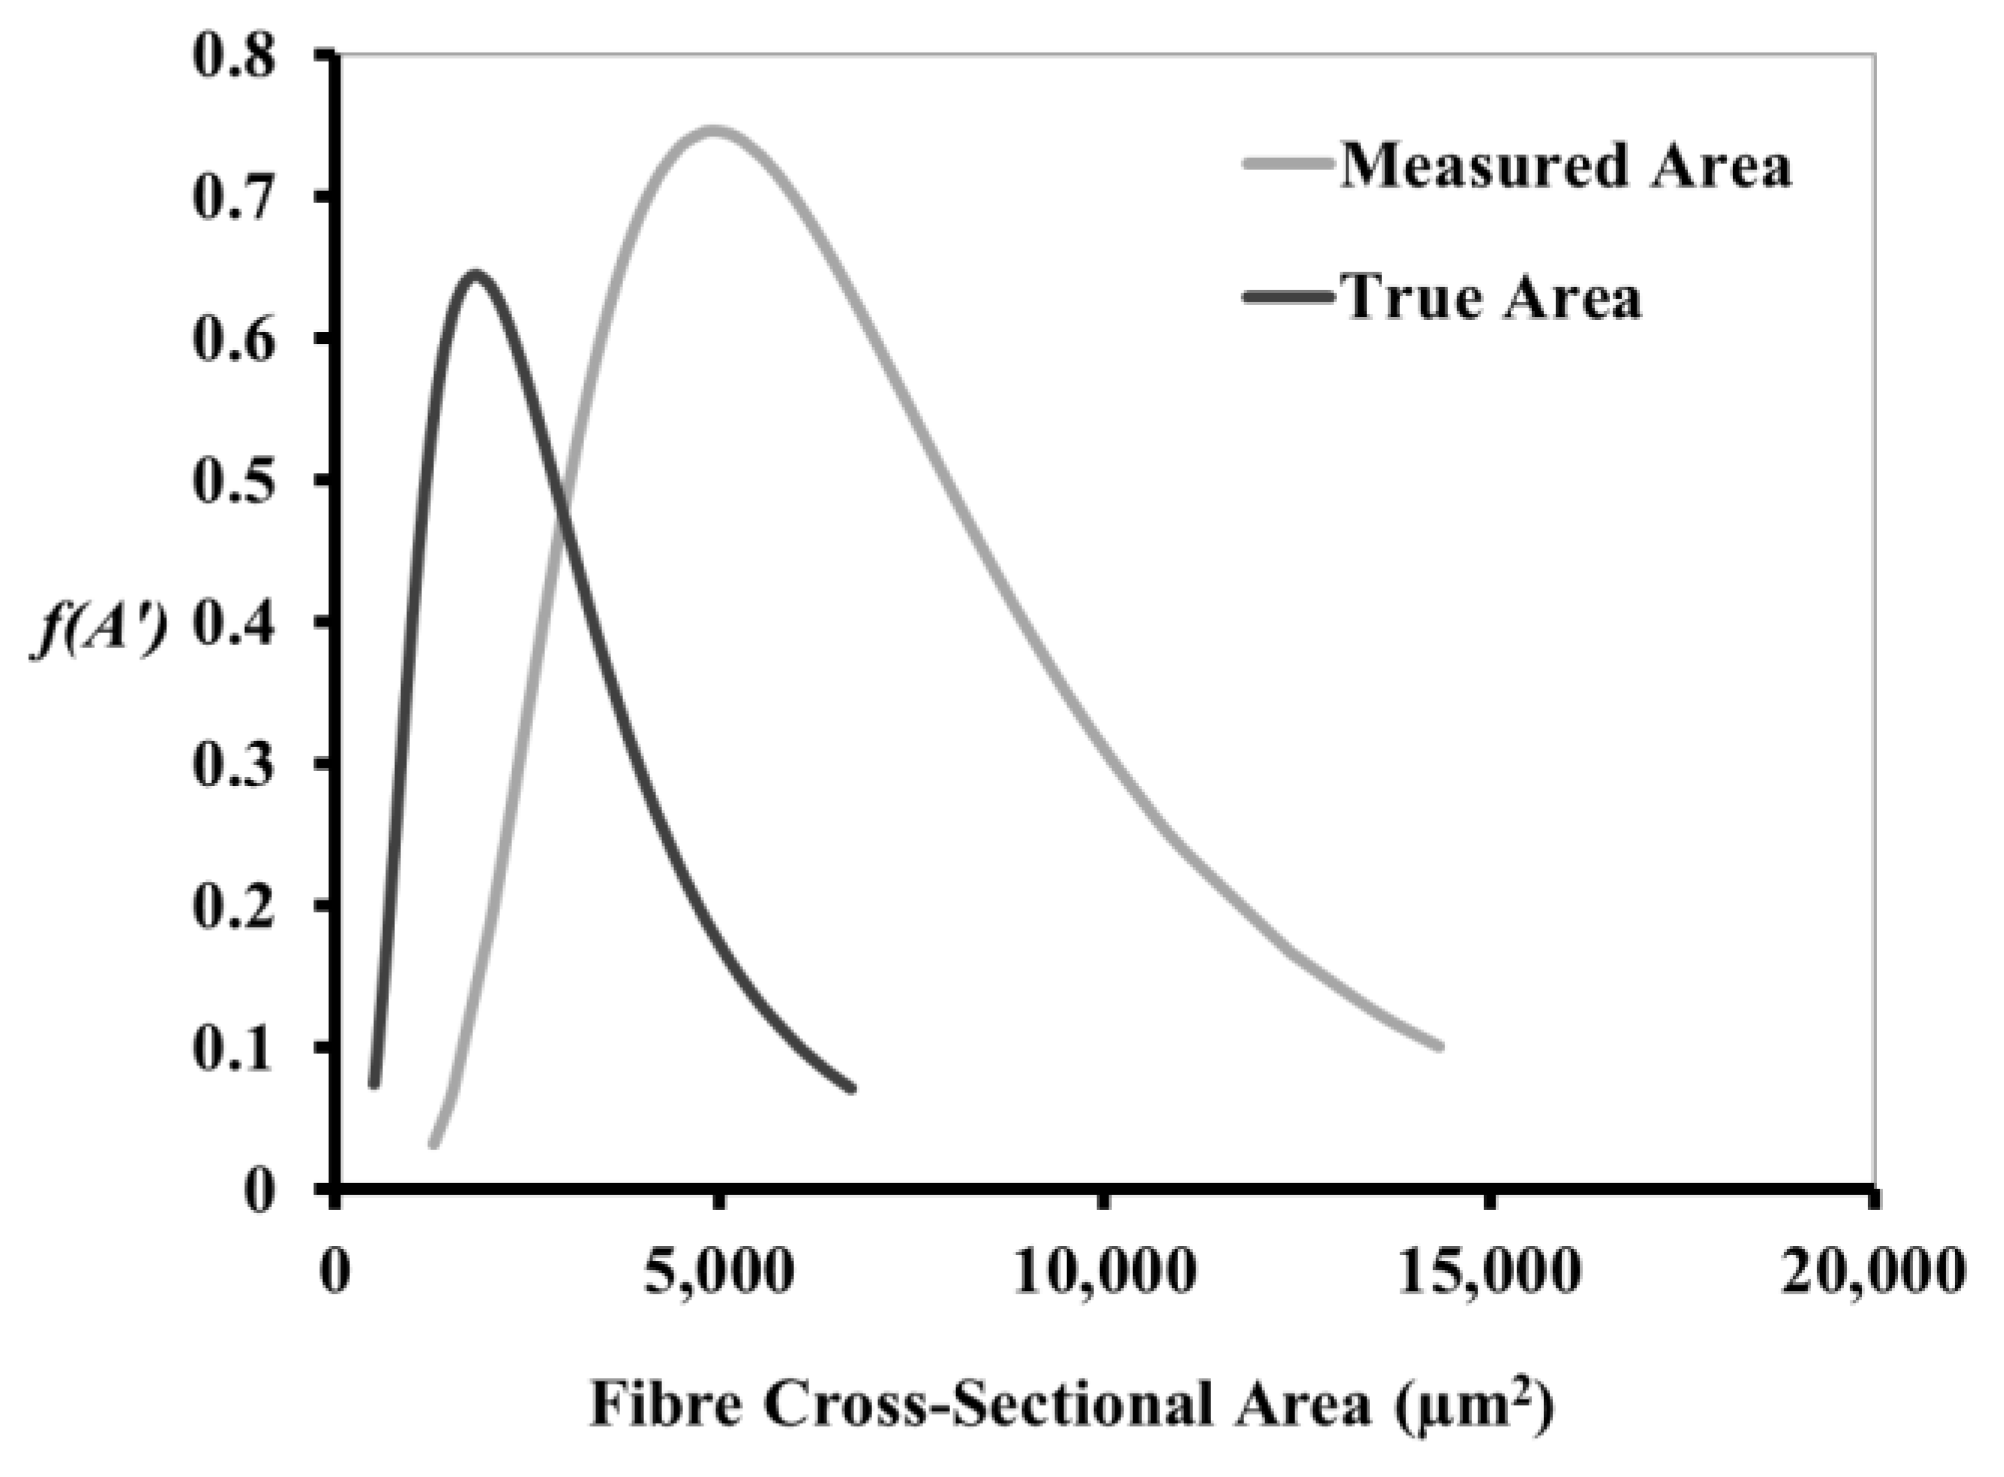
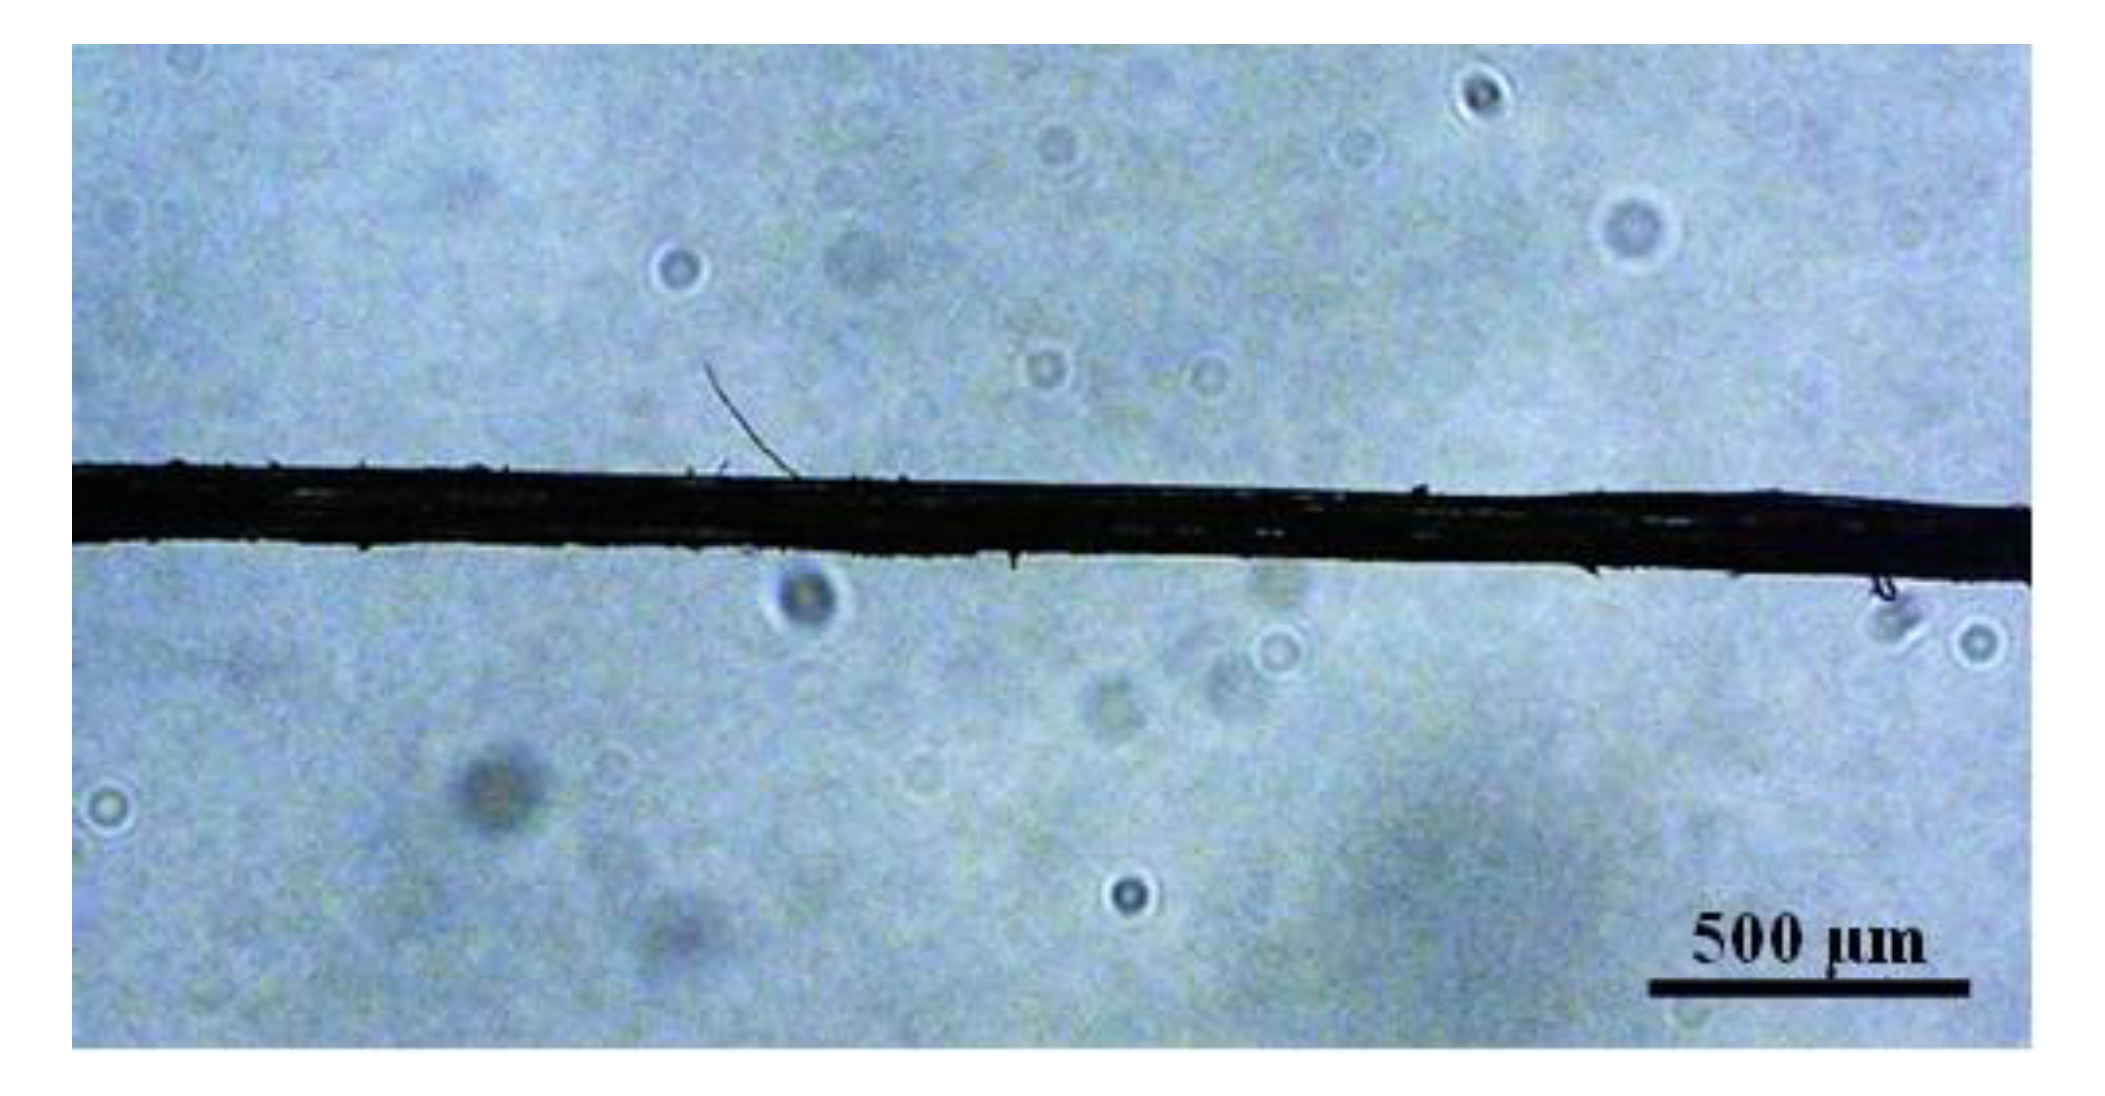
3.1.2. Diameter and Cross-Sectional Area of Technical Fibres

A typical optical microscope image used to measure the fibre diameters is shown in Figure 5.
There was considerable variability in the fibre diameters from 41 to 135 µm. The average diameter was 82 µm with a standard deviation of 21 µm.
The minimum and maximum measured cross-sectional areas of the fibres were 1290 and 14,356 µm2, respectively, with the average area being 5631 µm2 with a standard deviation of 2851 µm2.

3.1.3. Fibre Area Correction Factor

Examples of the fibre cross-sectional shape are shown in Figure 6.
The minimum and maximum true cross-sectional areas of the fibres were 506 and 6690 µm2, with the average area being 2205 µm2 with a standard deviation of 1413 µm2.
Log-normal distributions of the measured and true cross-sectional areas calculated using Equation (2) are shown in Figure 7. The location parameter, scale parameter, geometric mean and geometric standard deviation of the log-normal distributions are given in Table 2. The fibre area correction factor K determined using Equation (3) was 2.70.

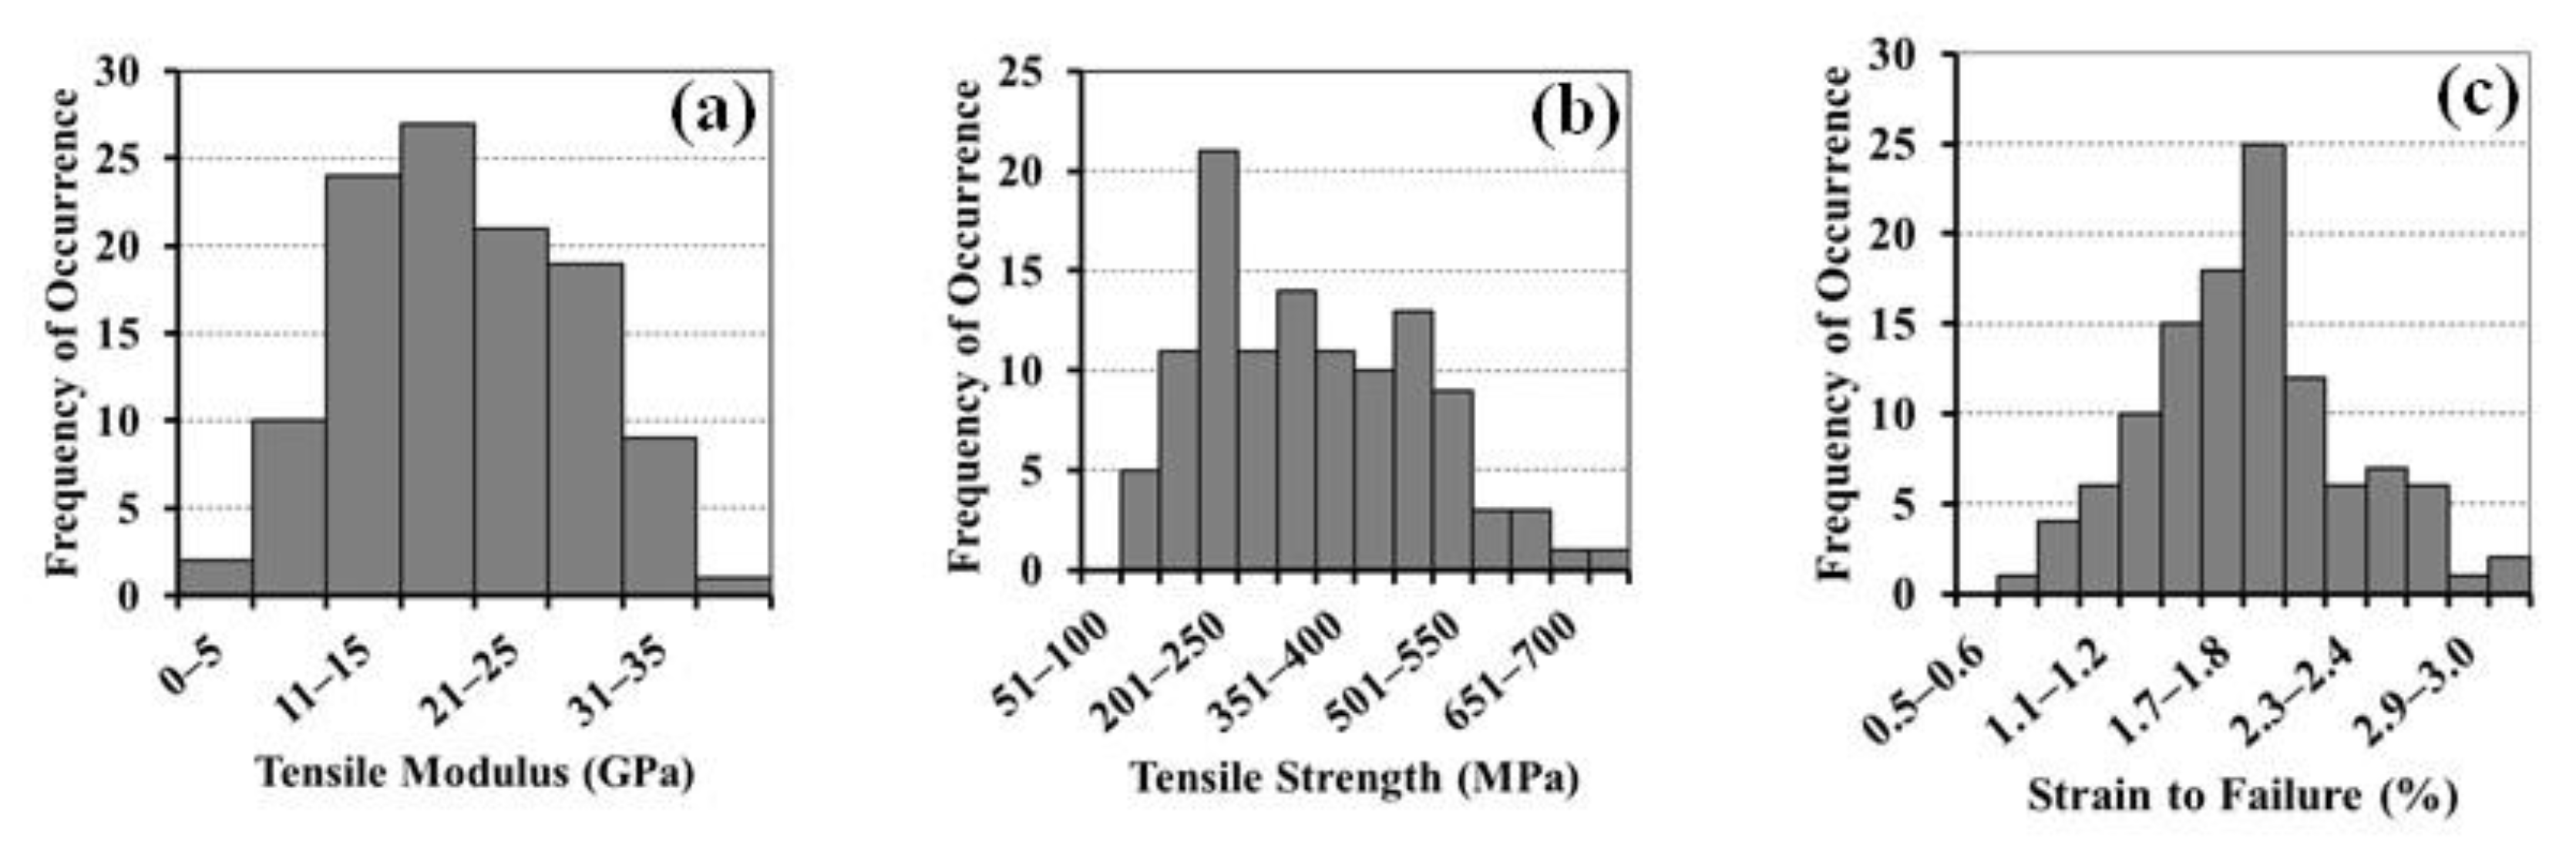
3.1.4. Tensile Properties of Technical Fibres

Histograms of the tensile modulus, tensile strength and strain to failure are given in Figure 8a–c, respectively. The modulus and strength have been calculated using the measured cross-sectional area of the fibres.
The minimum, maximum and average values and the standard deviations are also given in Table 3. The data show wide scatter, as is evident from the range of values and also from the standard deviations.
The true tensile properties, determined using the area correction factor K of 2.70, are given in Table 3. Strain to failure is independent of cross-sectional area. Thus, the measured and true strains to failure are the same.

3.2. Tensile Properties of Unidirectional Composites

The tensile stress–strain curves of the unidirectional composites and neat vinyl ester resin are shown in Figure 9a,b, respectively. The strain was recorded only up to 0.6%, after which the extensometer was removed. For the composites, the curves all showed a knee centred at a strain of ~0.2%, after which the slope decreased by ~40%. However, the curves of the neat matrix resin were linear over the 0.6% strain range.
The modulus of the unidirectional composites was 13.2 GPa with a standard deviation of 0.4 GPa (3%) while the strength was 122 MPa with a standard deviation of 5 MPa (4%). The neat matrix resin had a modulus of 3.62 GPa with a standard deviation of 0.02 GPa (0.6%) and a strength of 59.8 MPa with a standard deviation of 4.1 MPa (7%).
Representative images of the fracture surfaces of the unidirectional composites are given in Figure 10. Extensive fibre pullout is evident, consistent with the flax fibres being untreated in the fabric used to make the composites.

4. Discussion

4.1. Technical Fibres

4.1.1. Fibre Area Correction Factor

The fibre area correction factor determined using the method described above was found to be 2.70. This is close to the value of 2.55 obtained by Thomason et al. [9] for flax fibres.

4.1.2. Tensile Properties of Technical Fibres

The tensile strength of natural fibres varies considerably with test gauge length. Therefore, the following discussion is limited to studies using a 20 mm gauge length, as in the present study. The most relevant data for flax are those obtained by Thomason et al. [9]. They present results which were a modulus of 49.8–53.6 GPa, a strength of 611–940 MPa and a strain to failure of 1.23–2.13%. These results are in quite good agreement with the results of the present study.
In their work, Thomason et al. [9] used the cross-sectional area measured on the remnant section of each fibre attached to the paper tab to determine the modulus and strength. Thus, each calculation used the actual cross-sectional shape. The present study used the method developed by Virk [8] which involved multiplying the measured fibre diameter by a constant area correction factor which was determined from other untested fibres from the same batch. This assumes that each fibre differs from being circular by the same factor and does not account for differences from fibre to fibre. Nonetheless, the good agreement with the results obtained by Thomason et al. [9] indicates that this procedure gives reasonably accurate results.

4.2. Tensile Properties of Unidirectional Composites

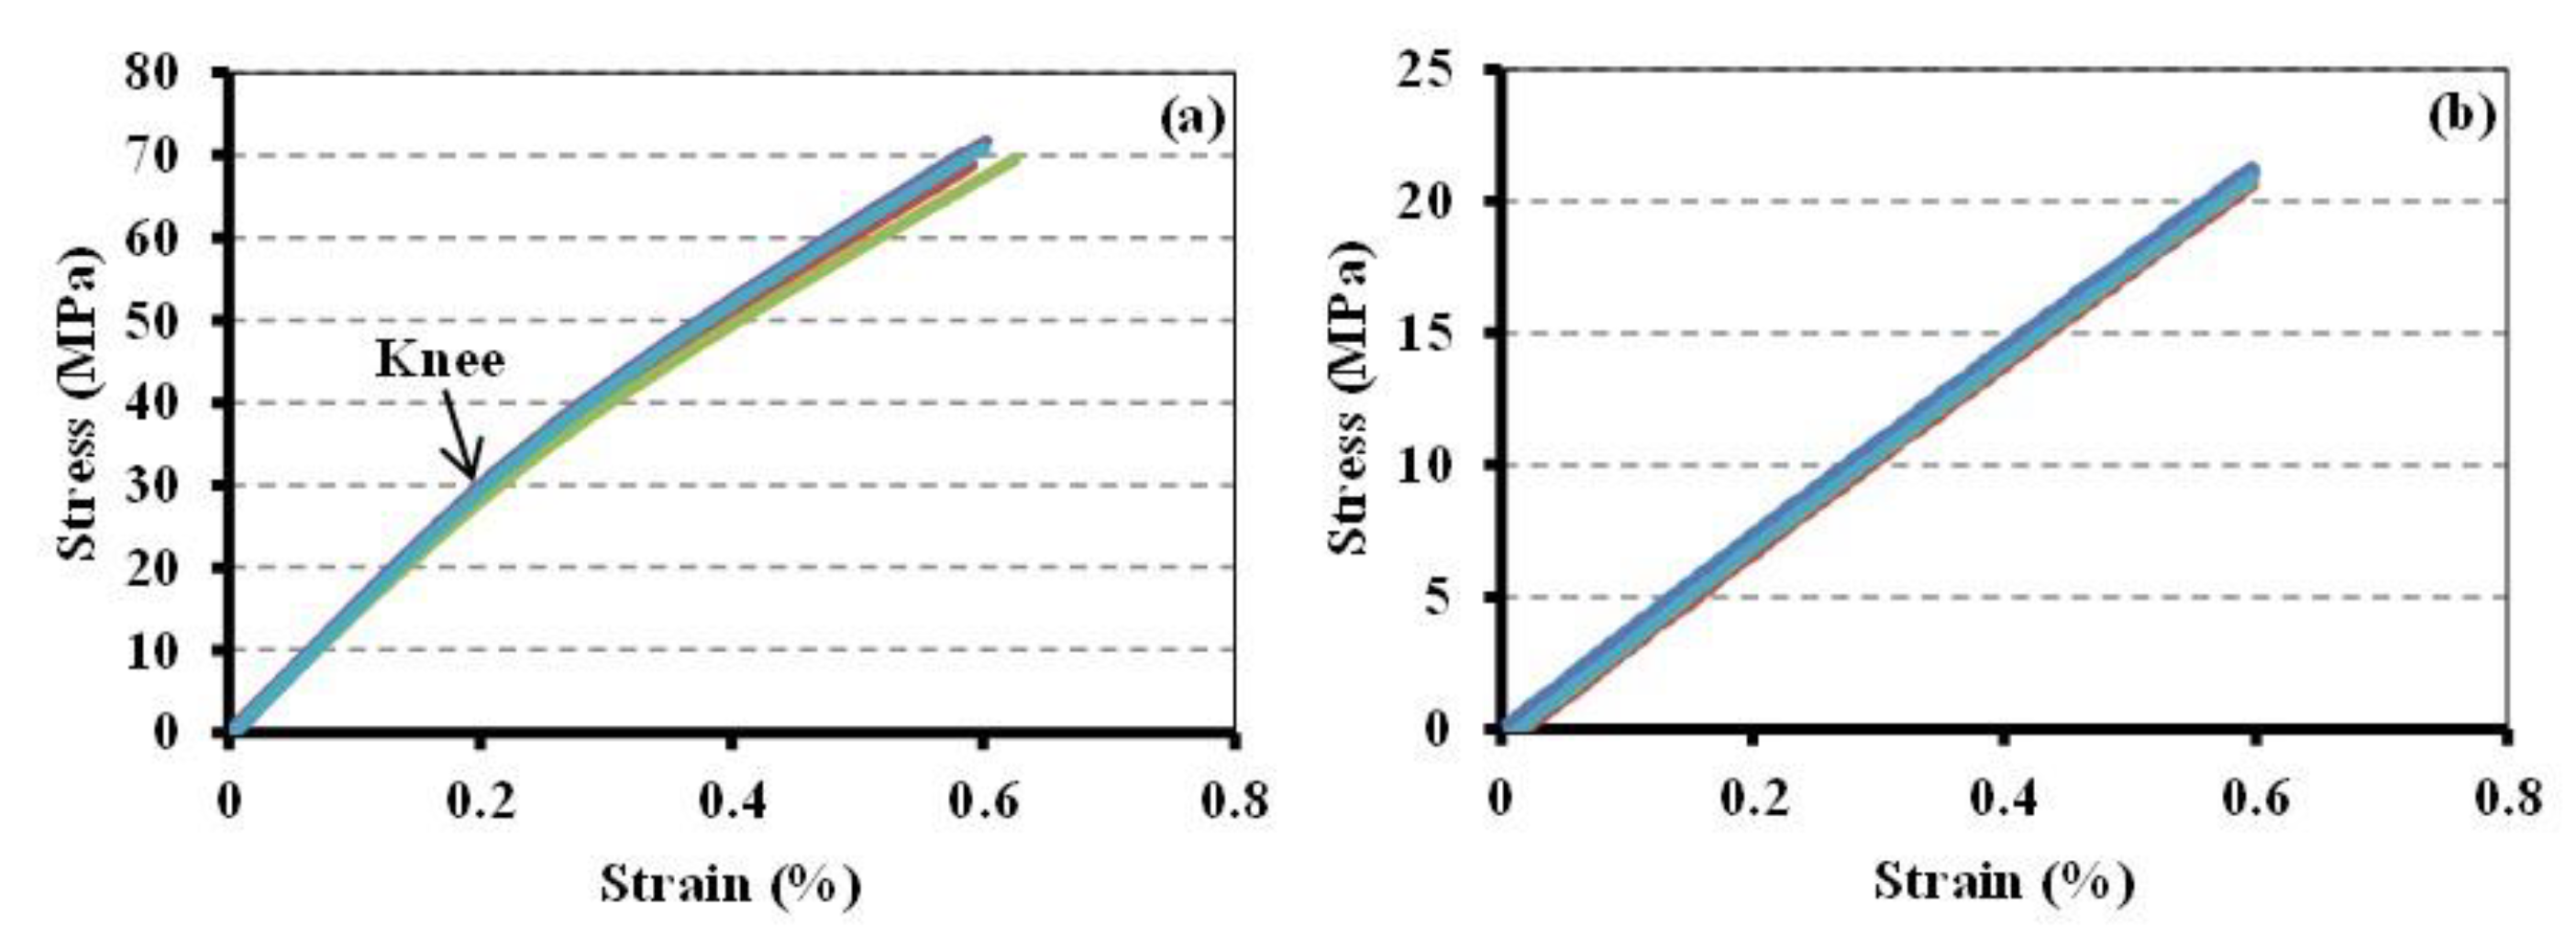
4.2.1. Stress–Strain Behaviour

The stress–strain curves of the unidirectional composites consisted of two essentially linear regions separated by a distinct knee (Figure 9a), which occurred at a strain of ~0.2%. Similar behaviour has been reported previously as shown, for example, by Hughes et al. [10] for flax fibre/polyester composites and by Ruys [11] for flax/epoxy composites.
Hughes et al. [10] undertook loading/unloading experiments on either side of the knee and found that the behaviour of the composite was fully reversible before the knee but that some irreversible behaviour occurred after the knee. They attributed the occurrence of the knee to the behaviour of kink bands present in the fibres during loading. Below the knee, it was considered that the kink bands did not affect the deformation behaviour, but above the knee, they produced microstructural damage to the composite, which reduced its stiffness and produced a component of irreversible behaviour.

4.2.2. Calculation of Fibre Modulus and Strength from Composite Tensile Test Data

The data obtained from tensile testing of the composites were used to calculate the modulus and strength of the fibres, using the rule of mixtures, for comparison with the results obtained from the single fibre tests.
As the fibres had been deformed into a spiral shape by the spiral wrapping threads, the misalignment was taken into account using the Krenchel reinforcing efficiency factor η as used by Virk et al. [5] for prediction of modulus and by Shah et al. [12] for prediction of strength. The Krenchel reinforcing efficiency factor is given by [5,12]:
η = cos 4 θ
where θ is the angle between the fibre direction and the loading direction.
The Krenchel factor was also applied to the wrapping threads.
A value for the modulus of viscose rayon was required for the calculations. Hearle [13] gives a range of 4.8–8.8 N/tex which equates to 7.2–13.1 GPa. The mean value of 10.2 GPa was used in the calculations.
Based on the above and also assuming linear behaviour and isostrain conditions, the rule of mixtures equations give the modulus E and strength σ of the fibres as follows:
E f = [ E c ( E m V m E w 1 V w 1 cos 4 θ w 1 E w 2 V w 2 cos 4 θ w 2 ) ] / V f cos 4 θ f  
σ f = [ σ c ( E m ε f V m E w 1 ε f V w 1 cos 4 θ w 1 E w 2 ε f V w 2 cos 4 θ w 2 ) ] / V f cos 4 θ f  
where V is the volume fraction and the subscripts c, f, m, w1 and w2 refer to the composite, the fibres, the matrix and the wrapping threads, respectively.
The strength and modulus of the fibres calculated using these equations gave a modulus of 47.0 GPa and a strength of 337 MPa. The value of Emεf given in Equation (6) was slightly higher than the measured strength of the matrix, so the latter was used when calculating fibre strength. This anomaly is considered to be due to the assumption of linear behaviour.
The predicted fibre modulus of 47.0 GPa is within 9% of the experimental true value of 52.4 GPa. The calculation was made using the 0.001–0.003 chord modulus from the composite tensile tests since this was the strain range used by Virk et al. [5]. However, this strain range spanned the knee of the stress–strain curves which occurred at a strain of ~0.002 (Figure 9a). It is considered that the knee is a result of damage occurring in the matrix of the composites, as proposed by Hughes et al. [10], rather than being an intrinsic property of the fibres. On this basis, the modulus value of the composite before the knee would appear to be more appropriate for determining the fibre modulus for comparison with the single fibre data. Using the strain range of 0.0001–0.0015 for both the composites and the vinyl ester resin gave a value of 55.6 GPa for the modulus of the fibres. This is within 6% of the value obtained from the single fibre tests.
In contrast to the predicted modulus, the predicted fibre strength of 337 MPa is very much lower than the experimental true value of 936 MPa. However, the experimental value of fibre strength was determined using a 20 mm gauge length, whereas the average fibre length in the flax yarns used to make the composites was 93 mm. As fibre strength decreases considerably with increasing fibre length [14,15], this needs to be taken into account. Romhany et al. [14] used data from testing of flax technical fibres with gauge lengths of 20, 40 and 80 mm, together with additional data for flax technical fibres reported by Stamboulis et al. [16] and Bos et al. [17], and found the following relationship between gauge length g (mm) and fibre strength σ (MPa):
σ = 12.2   e x p [ 883.7 / ( g + 206.4 ) ]
This equation was used to determine the ratio of strength at a 20 mm gauge length to that at 93 mm. This ratio was then used to convert the true fibre strength of 936 MPa obtained in the present study for a 20 mm gauge length to its equivalent strength at 93 mm, giving a value of 361 MPa. The value of 337 MPa calculated from the composite tests is within 7% of this value, and the agreement is again considered to be reasonably good.
The good agreement between the measured and calculated values obtained here is considered to indicate the more general applicability of the methodology proposed by Virk et al. [5].

5. Conclusions

  • The fibres were found to have a distinctly non-circular cross-section having an area that was, on average, 2.7 times smaller than that calculated from the measured diameter assuming the fibres to be round.
  • The fibre modulus and strength determined using fibre diameter measurements were 19.4 GPa and 347 MPa, respectively, while the strain at failure was 1.8%. The true values of modulus and strength obtained by applying the area correction factor of 2.70 were 52.4 GPa and 936 MPa, respectively.
  • The unidirectional composites with a fibre volume fraction of 25% had a modulus of 13.2 GPa and a strength of 122 MPa.
  • The fibre modulus and strength obtained using the rule of mixtures to back-calculate the data from the unidirectional composite tests were within 7% of the true values obtained from the single fibre tests when appropriate account was taken of fibre orientation and fibre length.
  • The results indicate that the methodology used here allows accurate prediction of the mechanical performance of natural fibre composites. This will be of significant benefit to end-users.

Author Contributions

Conceptualization, A.C.; methodology, A.C., N.S.; formal analysis, N.S., A.C.; investigation, N.S.; writing—original draft preparation, N.S.; writing—review and editing, A.C., M.T.H.; supervision, A.C., M.T.H.; project administration, M.T.H. All authors have read and agreed to the published version of the manuscript.

Funding

This research received no external funding.

Institutional Review Board Statement

Not applicable.

Informed Consent Statement

Not applicable.

Data Availability Statement

Publicly available datasets were analyzed in this study. This data can be found here: http://unsworks.unsw.edu.au/fapi/datastream/unsworks:12280/SOURCE02?view=true (accessed on 21 March 2022).

Acknowledgments

This study was undertaken as part of the research program of the Cooperative Research Centre for Advanced Composite Structures Ltd. (CRC-ACS). The authors would also like to acknowledge Composites Evolution Ltd., UK, for providing the flax fabric and the Composites Innovation Centre (CIC), Canada, for fabricating the composite and neat resin panels and for organising the testing of these panels.

Conflicts of Interest

The authors declare no conflict of interest.

References

  1. Pickering, K.L.; Aruan Efendy, M.G.; Le, T.M. A review of recent developments in natural fibre composites and their mechanical performance. Compos. Part A 2016, 83, 98–112. [Google Scholar] [CrossRef] [Green Version]
  2. Sain, M.; Panthapulakkal, S. Green fibre thermoplastic composites. In Green Composites—Polymer Composites and the Environment; Baillie, C., Ed.; CRC Press: Cambridge, UK, 2004; pp. 181–206. [Google Scholar]
  3. Thakur, V.K.; Thakur, M.K.; Gupta, R.K. Review: Raw natural fiber-based polymer composites. Int. J. Polym. Anal. Charact. 2014, 19, 256–271. [Google Scholar] [CrossRef]
  4. Virk, A.; Hall, W.; Summerscales, J. Physical characterization of jute technical fibers: Fiber dimensions. J. Nat. Fibers 2010, 7, 216–228. [Google Scholar] [CrossRef]
  5. Virk, A.; Hall, W.; Summerscales, J. Modulus and strength prediction for natural fibre composites. Mater. Sci. Technol. 2012, 28, 864–871. [Google Scholar] [CrossRef]
  6. Summerscales, J.; Virk, A.; Hall, W. Fibre area correction factors (FACF) for the extended rule-of-mixtures for natural fibre reinforced composites. Mater. Today Proc. 2020, 31, S318–S320. [Google Scholar] [CrossRef]
  7. Javanbakht, Z.; Hall, W.; Virk, A.; Summerscales, J.; Ochsner, A. Finite element analysis of natural fiber composites using a self-updating model. J. Compos. Mater. 2020, 54, 3275–3286. [Google Scholar] [CrossRef]
  8. Virk, A.S. Numerical Models for Natural Fibre Composites with Stochastic Properties. Ph.D. Thesis, University of Plymouth, Plymouth, UK, 2010. [Google Scholar]
  9. Thomason, J.; Carruthers, J.; Kelly, J.; Johnson, G. Fibre cross section determination and variability in sisal and flax and its effects on fibre performance characterisation. Compos. Sci. Technol. 2011, 71, 1008–1015. [Google Scholar] [CrossRef]
  10. Hughes, M.; Carpenter, J.; Hill, C. Deformation and fracture behaviour of flax fibre reinforced thermosetting polymer matrix composites. J. Mater. Sci. 2007, 42, 2499–2511. [Google Scholar] [CrossRef]
  11. Ruys, D. The Influence of Bast Fibre Structure on the Mechanical Properties of Natural Fibre Composites. Ph.D. Thesis, University of New South Wales, Kensington, Australia, 2007. [Google Scholar]
  12. Shah, D.U.; Schubel, P.J.; Licence, P.; Clifford, M.J. Hydroxyethylcellulose surface treatment of natural fibres: The new ‘twist’ in yarn preparation and optimization for composites applicability. J. Mater. Sci. 2012, 47, 2700–2711. [Google Scholar] [CrossRef]
  13. Hearle, J.W.S. Textile Fibers: A comparative overview. In Encyclopedia of Materials: Science and Technology, 2nd ed.; Buschow, K.H.J., Kahn, R.W., Flemings, M.C., Ilschner, B., Kramer, E.J., Mahajan, S., Veyssiere, P., Eds.; Elsevier: Oxford, UK, 2001; pp. 9100–9116. [Google Scholar]
  14. Romhany, G.; Karger-Kocsis, J.; Czigany, T. Tensile fracture and failure behavior of technical flax fibers. J. Appl. Polym. Sci. 2003, 90, 3638–3645. [Google Scholar] [CrossRef]
  15. Virk, A.; Hall, W.; Summerscales, J. Modelling tensile properties of jute fibres. Mater. Sci. Technol. 2011, 27, 458–460. [Google Scholar] [CrossRef]
  16. Stamboulis, A.; Baillie, C.; Garkhail, S.; Van Melick, H.; Peijs, T. Environmental durability of flax fibres and their composites based on polypropylene matrix. Appl. Compos. Mater. 2000, 7, 273–294. [Google Scholar] [CrossRef]
  17. Bos, H.; Van Den Oever, M.J.; Peters, O.C. Tensile and compressive properties of flax fibres for natural fibre reinforced composites. J. Mater. Sci. 2002, 37, 1683–1692. [Google Scholar] [CrossRef]
Figure 1. Flowchart of procedure.
Jcs 06 00100 g001
Figure 2. (a) Biotex unidirectional flax fabric and (b) a yarn from the fabric.
Jcs 06 00100 g002
Figure 3. Schematic diagram of mounting tab for single fibre testing.
Jcs 06 00100 g003
Figure 4. Histogram of measured lengths of flax technical fibres.
Jcs 06 00100 g004
Figure 5. Typical optical microscope image of flax technical fibre.
Jcs 06 00100 g005
Figure 6. Examples of cross-sectional shape of flax technical fibres.
Jcs 06 00100 g006
Figure 7. Log-normal distributions of measured and true cross-sectional areas of flax technical fibres.
Jcs 06 00100 g007
Figure 8. Histograms of measured tensile properties of flax technical fibres: (a) modulus, (b) strength and (c) strain to failure.
Jcs 06 00100 g008
Figure 9. Tensile stress–strain curves of (a) unidirectional composites and (b) neat vinyl ester resin.
Jcs 06 00100 g009
Figure 10. Scanning electron microscope images of fracture surface of unidirectional composites: (a) ×75; (b) ×200.
Jcs 06 00100 g010
Table 1. Strain ranges used for determination of tensile modulus.
Nominal Strain at Break or Percent Elongation at Maximum Load, ɛ (%)Strain Range (%)
1.2 ≤ ɛ0.5–1.0
0.6 ≤ ɛ < 1.20.5–0.7
Table 2. Location parameter, scale parameter, geometric mean and geometric standard deviation of the measured and true cross-sectional areas of flax technical fibres.
Fibre Cross-Sectional Area
Measured   Area   ( A D ) True   Area   ( A T )
Location   parameter   ( μ )8.507.51
Scale   parameter   ( λ )0.530.62
Geometric   mean   ( μ )4929 µm21827 µm2
Geometric   standard   deviation   ( λ ) 1.71 µm2 1.86 µm2
Table 3. Measured and true tensile properties of flax technical fibres.
PropertyAverage ValueStandard DeviationMinimum ValueMaximum Value
Measured modulus (GPa)19.47.43.936.9
True modulus (GPa)52.420.010.599.6
Measured strength (MPa)347136106738
True strength (MPa)9363682861993
Failure Strain (%)1.80.50.73.2
Publisher’s Note: MDPI stays neutral with regard to jurisdictional claims in published maps and institutional affiliations.

