1. Introduction
A variety of methods for the additive manufacturing of continuous fiber-reinforced thermoplastic matrix composites have been described [
1,
2,
3]. Consistent with the variety of methods employed in the literature to additively manufacture continuous fiber-reinforced thermoplastics, there exists a vast spectrum of processed composite material fiber volume fractions and quality described as well. As the relevant literature has yet to come to a substantive conclusion on what constitutes acceptable processed material quality relative to this developing technology, the current work will discuss processed composite material quality, qualitatively and quantitatively, specifically in terms of reinforcement distribution in the thermoplastic matrix, reinforcement content by volume (fiber volume fraction) and void content by volume.
In consideration of the processed material quality common in the relevant literature, it would seem logical that the literature would also exhibit a variety of different quality evaluation techniques employed to target and quantify the effects of quality variation; however, as will be discussed, this is not the case. The literature concerning the additive manufacturing of continuous fiber-reinforced thermoplastics largely relies on tensile loading to failure as a quality evaluation tool [
4,
5,
6,
7,
8,
9,
10,
11,
12]. For example, tensile loading to failure in fiber dominated tensile test configurations is apparent in a variety of works where fiber volume fractions range from as low as 1% to as high as 40%, where discrete bundles of the continuous reinforcement are readily distinguishable and void content by volume is either only qualitatively expressed or disregarded entirely [
4,
6,
7,
11].
Despite the fact that tensile loading to failure may allow for the empirical determination of the ultimate tensile strength for additively manufactured continuous fiber-reinforced thermoplastics, the ultimate tensile strength is a fiber dominated property that is shown to, at least in more traditional carbon fiber/epoxy laminates, be only moderately affected by gross void content in the polymer matrix [
13]. In addition to examining the dependence of tensile and compressive failure loads relative to void content in carbon fiber/epoxy laminates, the dependence of interlaminar properties on gross void content was also examined [
13]. In contrast to the weak tensile and compressive properties dependence on void content that was reported, a significant dependence of the composite interlaminar properties on void content was observed for these relatively brittle epoxy matric composites. A reduction of approximately 25% in short-beam strength with an approximate 6% increase in void content was measured for these thermoset matrix composites [
13]. Thus, it should be clear that tensile loading to failure, in the fiber direction, is inadequate in terms of evaluating the quality, as it pertains to manufacturing defects of additively manufactured continuous fiber-reinforced thermoplastic matrix composites.
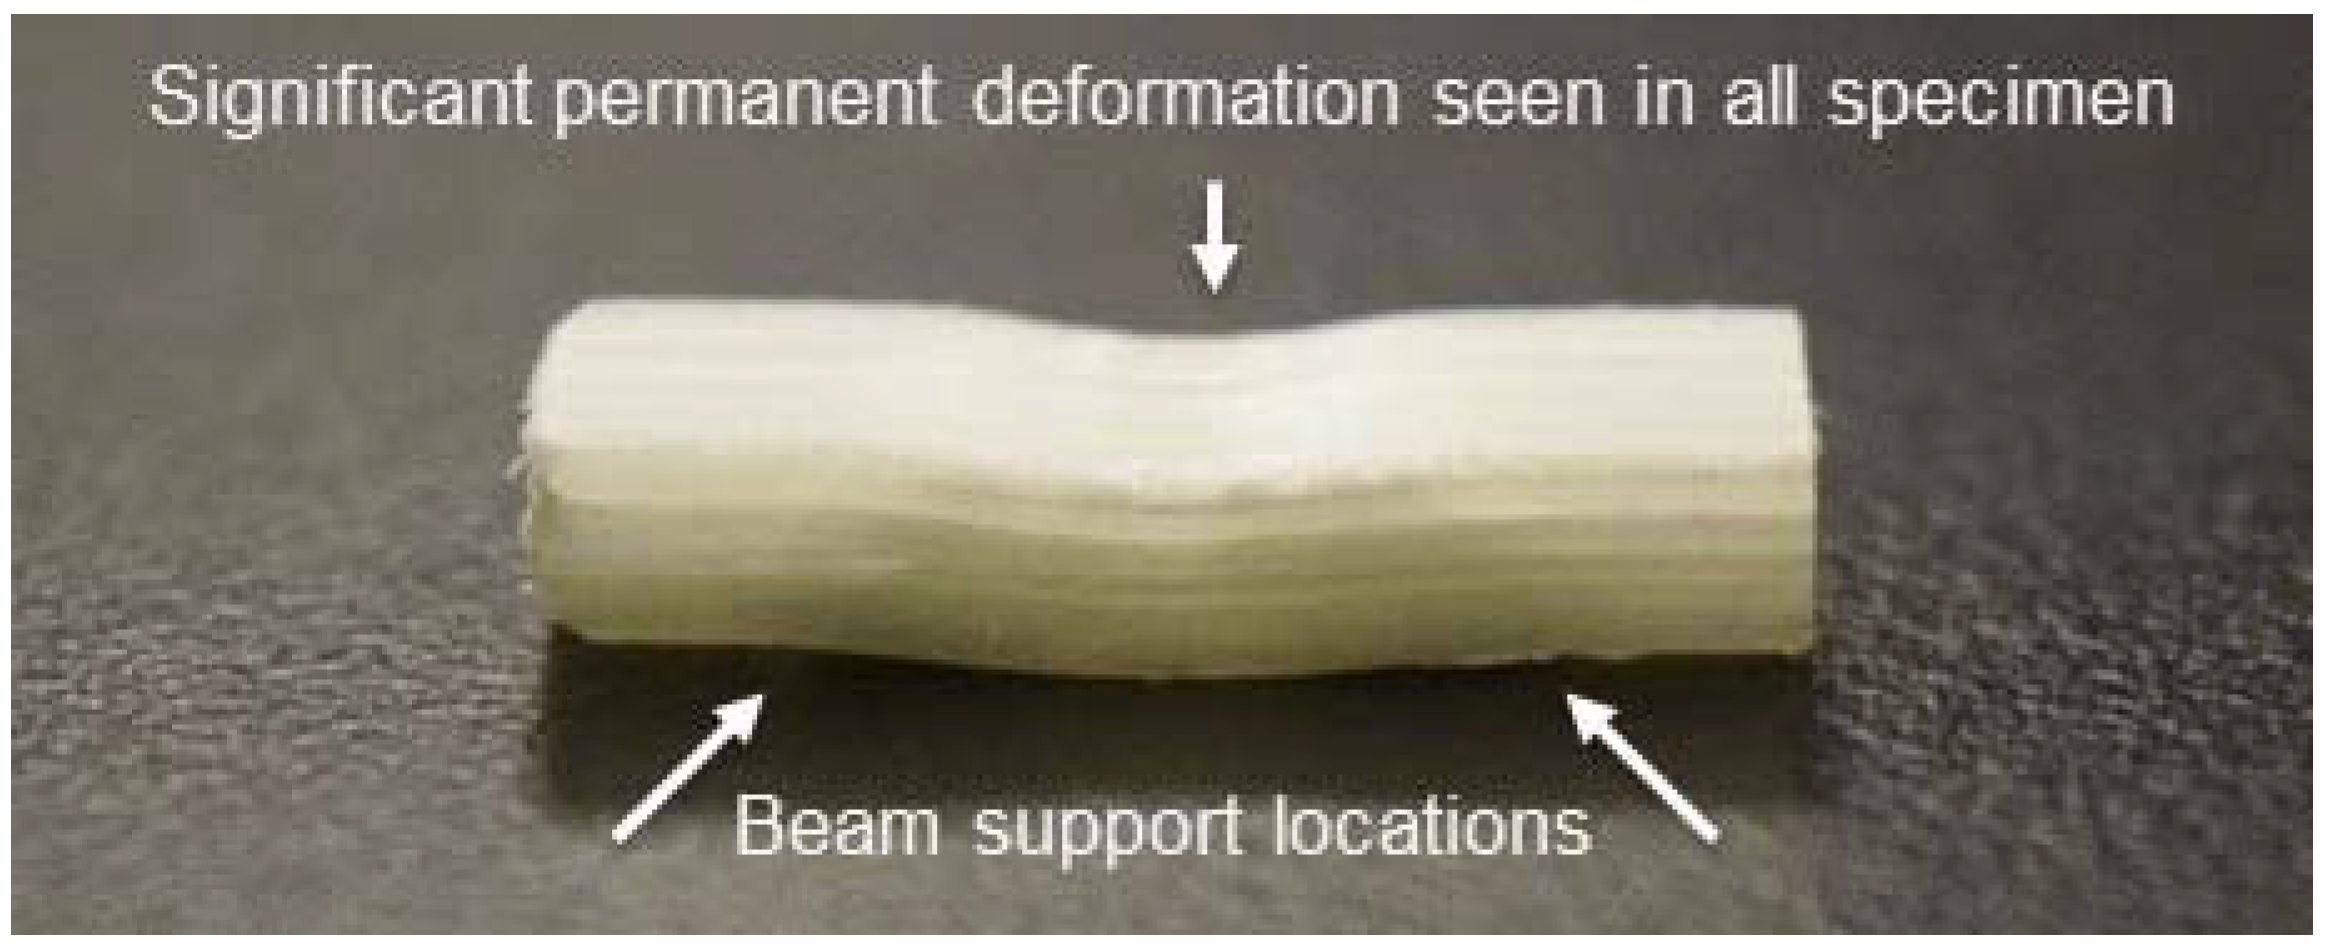
Based on the literature on carbon fiber/epoxy laminates, it would then seem reasonable to investigate consolidation quality and void content in additively manufactured unidirectional continuous fiber-reinforced thermoplastic composite beams using short beam shear (SBS) testing as described in ASTM D2344 [
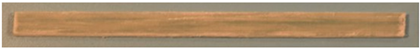
14]. Unfortunately, in previous efforts carried out by the authors, all relevant SBS tests of unidirectionally reinforced thermoplastic matrix composites resulted in inelastic failures, where the specimen permanently deforms, as seen in
Figure 1, but does not show catastrophic interlaminar shear failure. The SBS test results were insensitive to the measured thermoplastic matrix void content, showing no consistent trend in SBS strength over a range of 2–6% void content and, as a result, short-beam strength is an ineffective indicator of composite quality when inelastic failure occurs [
15].
Other means of mechanical performance-based quality evaluation are documented in the literature but to a lesser extent. Interlaminar mechanical evaluation, as well as flexural mechanical evaluation, were employed; however, their use was generally limited to the comparison of relative process parameter effects on the processed composite material or for comparison to neat polymer specimens [
3,
7,
8,
9,
10,
12]. In addition to interlaminar and flexural mechanical evaluation, the literature indicates that other mechanical evaluation methods, including Charpy impact testing, tensile and flexural fatigue to failure measurements and quasi-static indentation, were employed [
9,
10,
12]. Again, it is emphasized that the primary use of these techniques was exclusive of any quantitative commentary on either reinforcement distribution or void content.
In contrast to the quasi-static mechanical testing that is common in the literature, with the exception of [
10], the use of dynamic mechanical analysis (DMA) was seldom employed to investigate consolidation quality, or void content, in thermoplastic matrix composites [
6,
7]. DMA can most readily be described as a thermomechanical analysis technique where a specimen is cyclically loaded, in tension, compression, flexure, shear or torsion, while the viscoelastic response of the specimen is measured, typically over a range of temperatures. DMA was shown to be effective in the evaluation of both neat polymers as well as polymer matrix composites, as it is capable of providing both quantitative and qualitative information about the viscoelastic response of the material. The viscoelastic response that is measured via DMA is most commonly expressed in terms of the storage modulus, E’ (elastic response), the loss modulus, E” (viscous response), the loss tangent or damping factor (the ratio of E” to E’, commonly tan δ) and the glass transition temperature (Tg).
Despite the abundance of viscoelastic material data that can be developed via DMA, it was primarily utilized in the literature for the purpose of quantifying the glass transition temperature of the additively manufactured continuous fiber-reinforced thermoplastics [
6,
7]; however, a notable exception should be acknowledged [
7]. That study focused on assessing the effects of fiber surface modification, specifically to facilitate the development of intimate fiber/matrix contact and strong interface generation, on the mechanical performance of additively manufactured continuous carbon fiber-reinforced polylactic acid (PLA) composites. The effects of the fiber surface modification were reported in terms of specimen storage modulus, loss tangent and glass transition temperature, where substantive differences in the viscoelastic performance of printed composites with the modified fibers were recorded as compared to printed composites with un-modified fibers [
7]. The work attributed these results to the enhanced interfacial bond, and subsequent load transfer, in the printed composites utilizing the modified reinforcement, as well as the lack of interfacial bonding and the likely presence of manufacturing defects, namely voids along the interface, in the composite specimen with untreated reinforcement [
7].
Although DMA was only minimally utilized as a quality evaluation tool with respect to the additive manufacture of continuous fiber-reinforced thermoplastics, the work in the literature on fiber-matrix modification clearly suggests that DMA is sensitive to process-related quality variations [
7]. The current effort focuses on assessing the effects of void content on the thermomechanical performance of additively manufactured high volume fraction, continuous fiber-reinforced thermoplastic matrix composites.
2. Experimentation
Specimens with intentionally varied amounts of void content were additively manufactured and subjected to dynamic mechanical analysis for the purpose of aiding the development of an understanding of the effects of manufacturing defects, in this case, void content, on the quality of the processed composite materials.
2.1. Materials
The feedstock material employed in this work is a continuous commingled roving, Compofil PET-70-R2690N (Jushi USA Fiberglass Co., Ltd., Irwindale, CA, USA), which is composed of continuous E-Glass fibers in parallel with continuous, transparent PET thermoplastic fibers at a ratio of 70% glass fiber by weight (nominally 55% by volume). Documented in prior work [
1], differential scanning calorimetry (DSC) was used to determine the glass transition region of the PET thermoplastic in this commingled product. In addition to verifying an amorphous microstructure, the prior work determined a nominal mid glass transition temperature of 71.5 °C for the PET thermoplastic [
1]. An adhesive-back polyimide film, 0.05 mm thickness, was used as the deposition surface to provide sufficient tack to secure the deposited continuous fiber-reinforced thermoplastic material to the heated aluminum print bed.
2.2. Fiber Placement and Consolidation Hardware
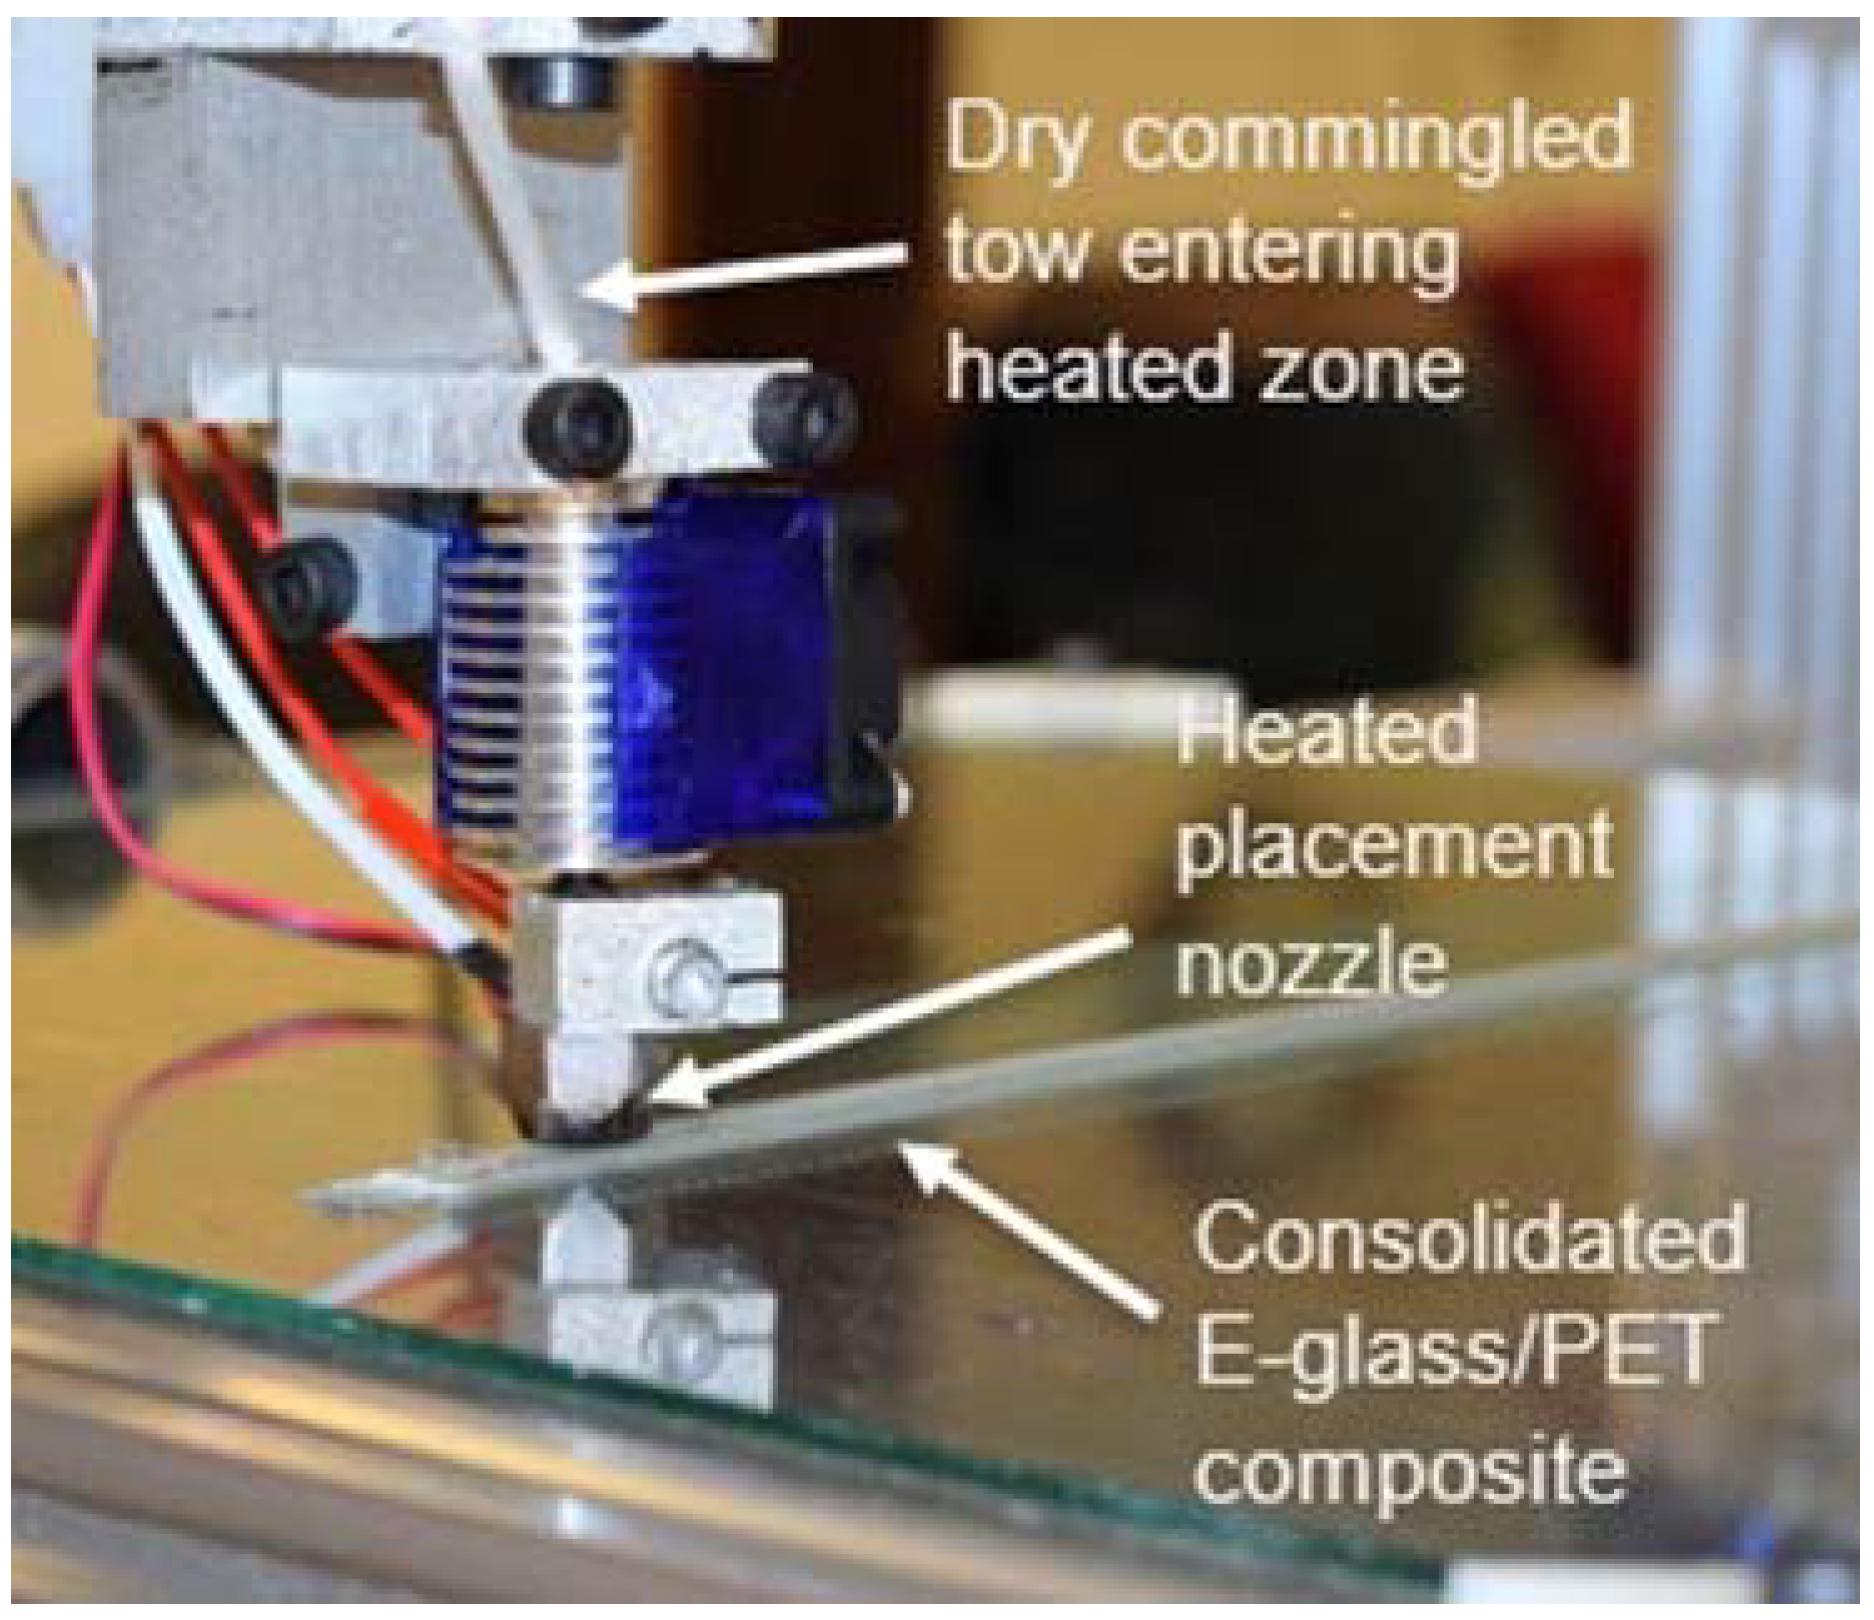
The general configuration of the manufacturing equipment employed in this effort is that of a fused filament deposition 3D printing system. The specific configuration used in this research is a custom developed 3-axis gantry-based automation system with a build volume of approximately 300 mm × 600 mm × 300 mm. The system makes use of many commercially available 3D printing components as the basis for the extrusion system. To process the dry commingled feedstock and create a continuous fiber-reinforced composite, the feedstock must travel through the heated zone and nozzle so that the PET fibers flow. Then, by fixing the end of the heated tow to the build surface and moving the printhead across the print bed, along a preprogrammed path, the E-Glass fiber-reinforced material is pultruded, along with the PET matrix. As the system positions the material, the face of the nozzle is positioned to apply pressure, forcing the fiber-reinforced PET against the build surface and generating the desired degree of consolidation in the composite. The rudimentary end-effector configuration, shown in
Figure 2, is meant to clearly indicate the technique utilized to convert the dry commingled fiber into a rigid, consolidated E-Glass fiber/PET matrix composite. However, this basic end effector was highly modified for the current effort.
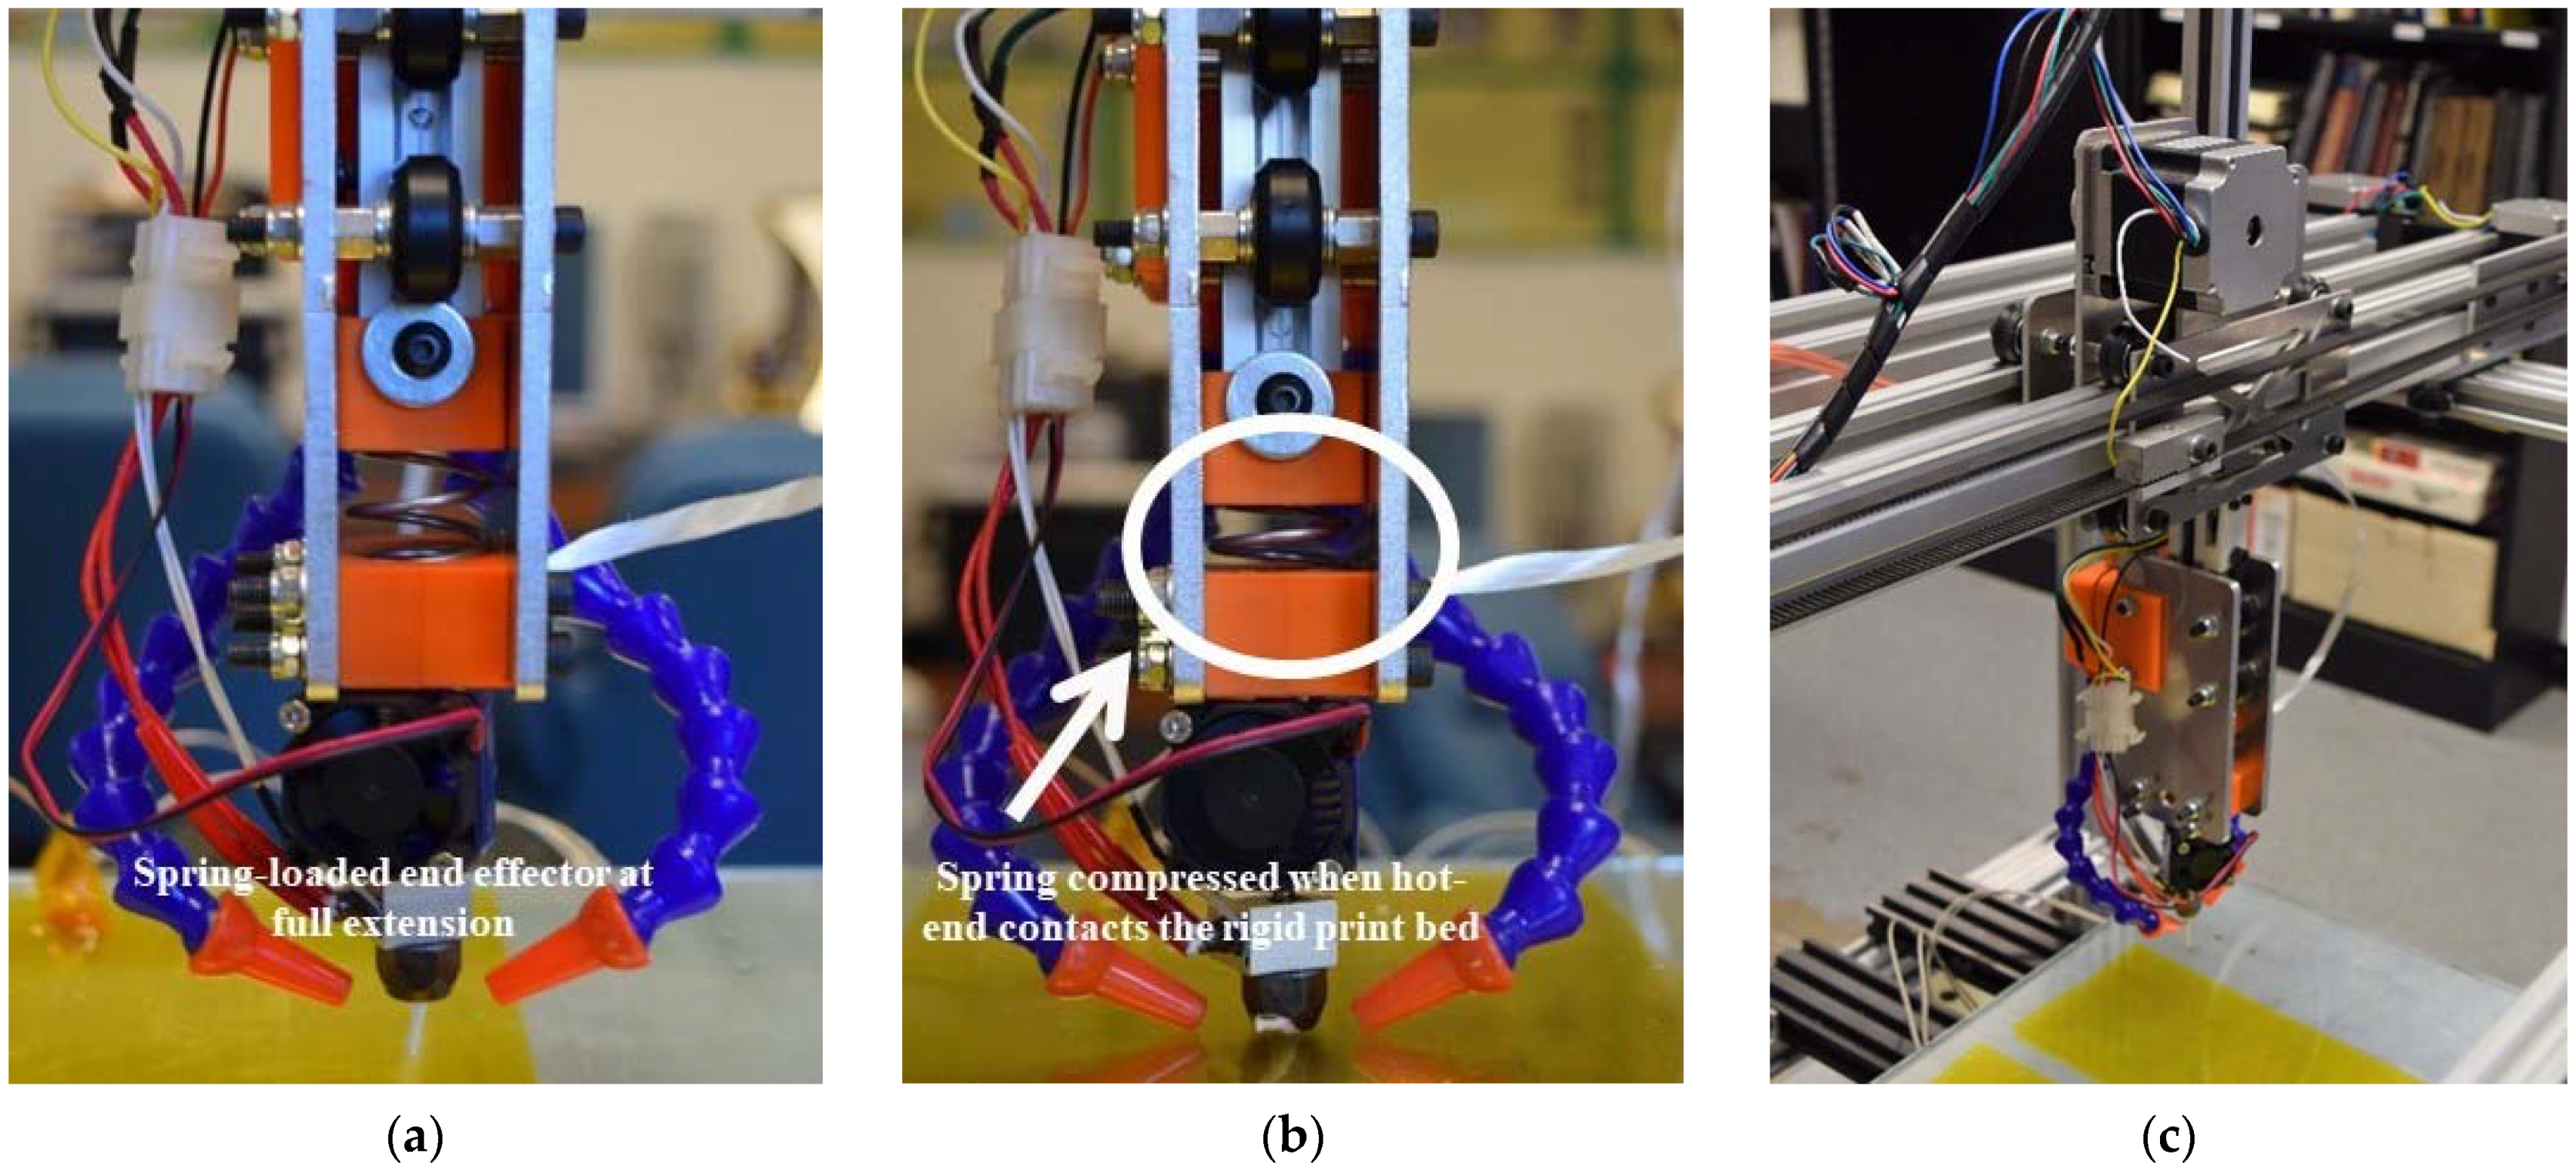
The purpose-built fiber placement and consolidation hardware used in this work integrates a highly modified end effector. While the end effector used has the same basic components as those shown in
Figure 2, the assembly incorporates a spring-loaded extruder mounting system [
1]. An overview of the system, including the spring-loaded end effector, is pictured in
Figure 3. The end effector utilizes a steel compression spring of known stiffness (~7.5 N/mm) to allow for the application of a programmable consolidation force. By programming a negative height above the build surface, the placement nozzle face is pushed into the surface, displacing the spring, resulting in a known consolidation force. The heated nozzle used in this research is similar in concept to a common 3D printer extruder nozzle but is of a specialized design which includes an inner diameter that the commingled tow passes through, of a nominal 1.4 mm. In addition, this specialized nozzle has a large flat face, with an outer diameter of approximately 11.5 mm, enabling the application of the consolidation force to the tow at the point of material deposition, as seen in
Figure 3a,b and described more completely in previous publications [
1,
15,
16]. In addition to the spring-loaded end effector, a rigidly mounted surface was used as the build plate, as seen in
Figure 3c. With this rigid print bed affixed to the machine frame and vertically supported by the workbench the machine rests on, the overall compliance of the print bed was reduced to a point where the contribution to the system spring rate was deemed negligible.
Once relevant layer geometry (width and thickness) was developed empirically, in a method consistent with the earlier work, displacement control in the build direction (Z) allowed for the application of a near constant consolidation force during processing. Near constant consolidation force during processing is possible by means of programmed spring displacements that far exceed any small variations in the displacement of the spring as the print head moves across any irregularities in the surface of the sample. Using programmed spring displacements in the range of 1–2 mm, and assuming small variations in the displacement of the spring during printing (<0.1 mm), total force variation was assumed to stay within the realm of ~1 N. In early proof-of-concept testing of the spring-loaded end effector, no spring movement during printing was visible; therefore, the assumption of negligible variations in the displacement of the spring during printing was deemed tenable [
15]. Consistent consolidation pressure during a multilayer build is achieved by lifting the end effector an amount equal to the layer thickness as each subsequent layer is applied. Two adjustable cooling ducts, oriented to point at the tip of the nozzle, are shown in
Figure 3. Cooling ducts, which supplied compressed air, were included in the design of the spring-loaded end effector as a means of quickly rigidizing the commingled material after deposition on the print bed.
2.3. Process Parameters
Process parameters for this study were based on prior experience using the continuous E-Glass and PET fiber commingled precursor coupled with the additive manufacturing (AM) system relevant to this work [
15]. There are three primary process variables that can be modified to functionally change the quality of the composite material, (i) extruder temperature, (ii) applied consolidation force and (iii) print speed. For this effort, the concept was to generate a variety of void contents by changing the print speed and thus the effective consolidation time while holding the other process variables constant. Confidence in this approach was gained from a study concerned with the effects of void content on the flexural performance of unidirectional glass fiber-reinforced polypropylene which varied the time under consolidation pressure, albeit in a compression molding type process, to produce thermoplastic matrix composites with void contents ranging from 1–14% [
17].
2.4. Specimen Preparation
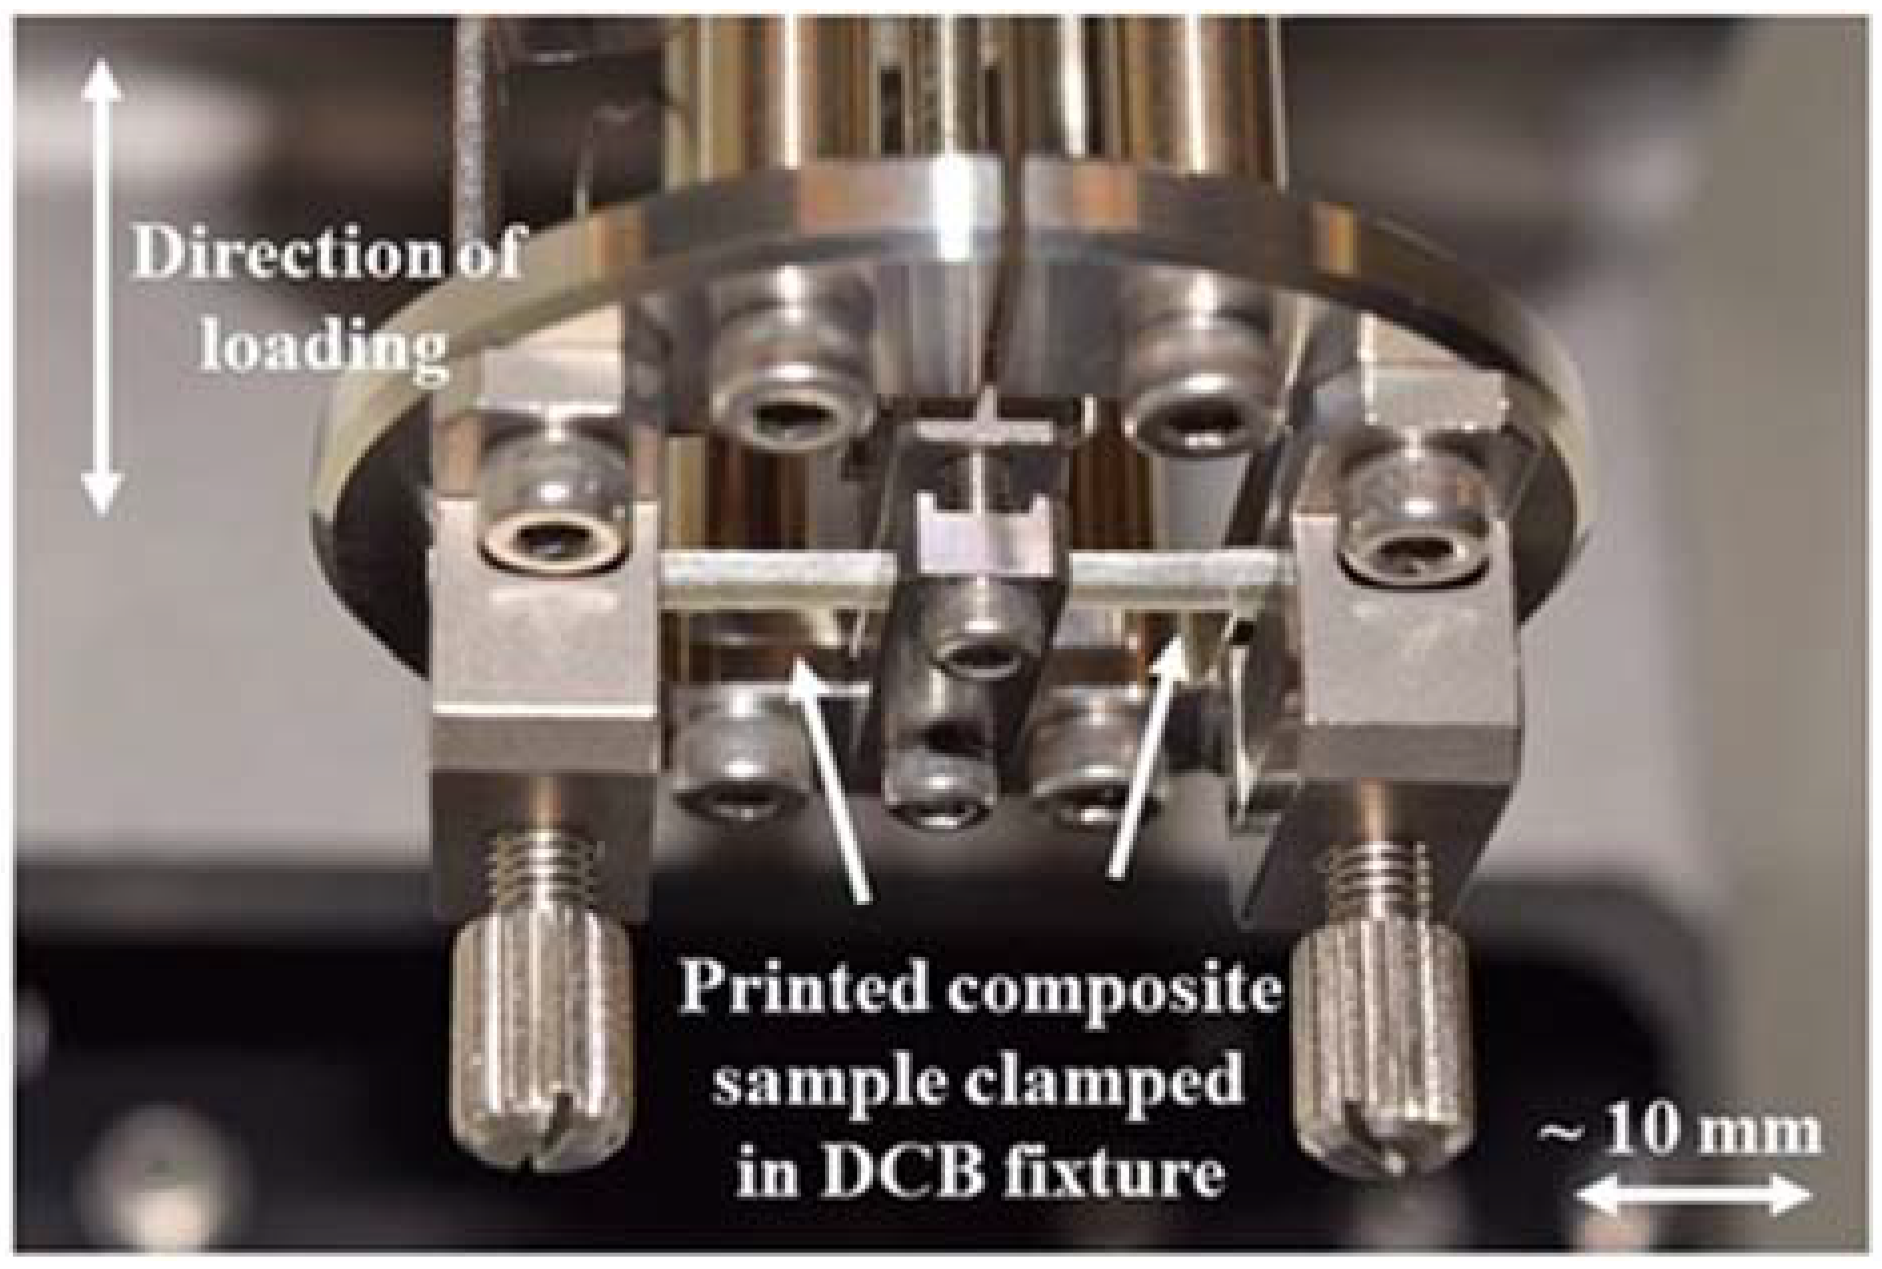
To investigate the effect of material deposition rate on the resulting composite quality, a series of specimens were prepared according to geometric constraints placed on the specimen by both the dynamic mechanical analysis (DMA) test chamber and the corresponding test fixture. The DMA used for this work was a Seiko DMS6100, with a cylindrical test chamber interior geometry defined by a 78 mm height and a 64 mm diameter. The fixture relevant to this work is a double cantilever beam bending device (DCB or clamped-clamped bending) with an outboard clamp to outboard clamp span of 50 mm, maximum clampable width of 15 mm and maximum clampable thickness of 5 mm. These dimensions represent absolute maximums for a clampable specimen geometry. In this fixture, the specimen is rigidly clamped at its lengthwise extremities as well as at the specimen mid-span, where the mid-span (in-board) clamp is rigidly connected to the moving loading shaft of the DMA. The free length of the specimen on each side of the in-board clamp is 10 mm, resulting in a total tested length of 20 mm. The clamped-clamped bending fixture is shown in
Figure 4.
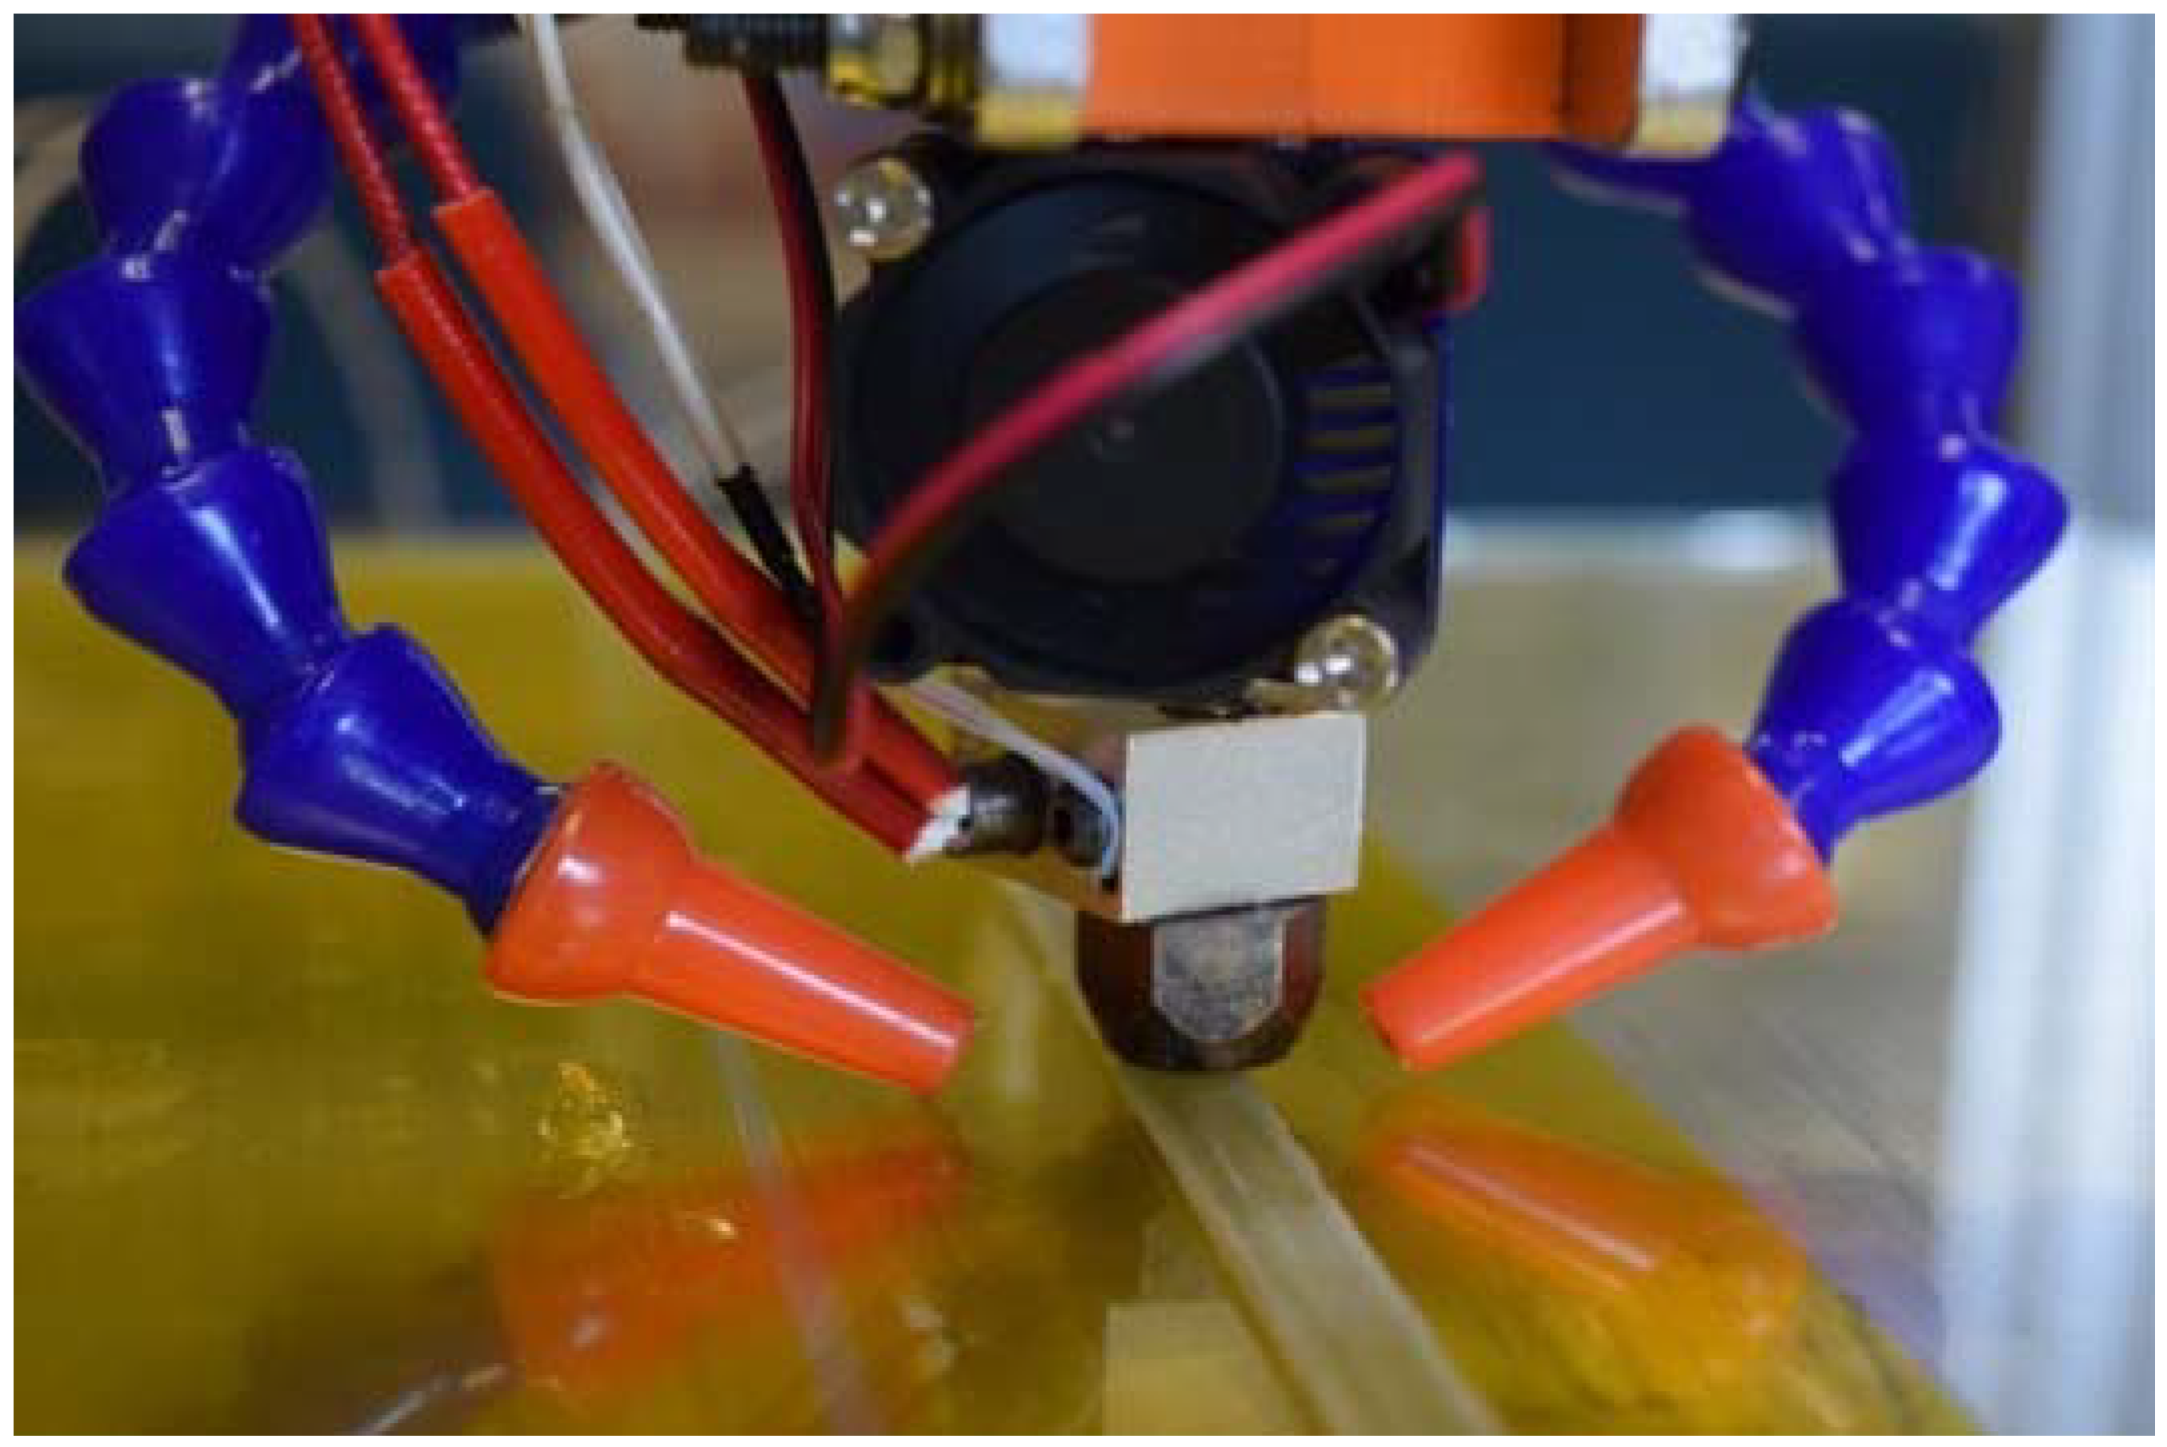
Continuous E-Glass fiber/PET beams of rectangular cross-section were processed from the commingled feedstock using seven print speeds, ranging from 100–400 mm/min in increments of 50 mm/min, while all other process parameters were held constant. Print temperature was held constant at 220 °C with the cooling ducts enabled, print bed temperature was held constant at 72 °C, just above the nominal Tg value determined, by DSC, for the PET thermoplastic in the commingled precursor. The applied spring force for consolidation was held constant at 9 N via the use of control code-based displacement control of the end effector, resulting in a programmed printed layer height, and thus a resulting fiber-reinforced layer thickness of approximately 0.4 mm. Specimens were printed such that the specimen cross-section was comprised of four unidirectional (UD) printed plies of the continuous commingled precursor, placed one on top of another, creating unidirectional (UD) laminated beams nominally 1.5 mm thick. A close-up view of the extrusion and consolidation process is shown in
Figure 5.
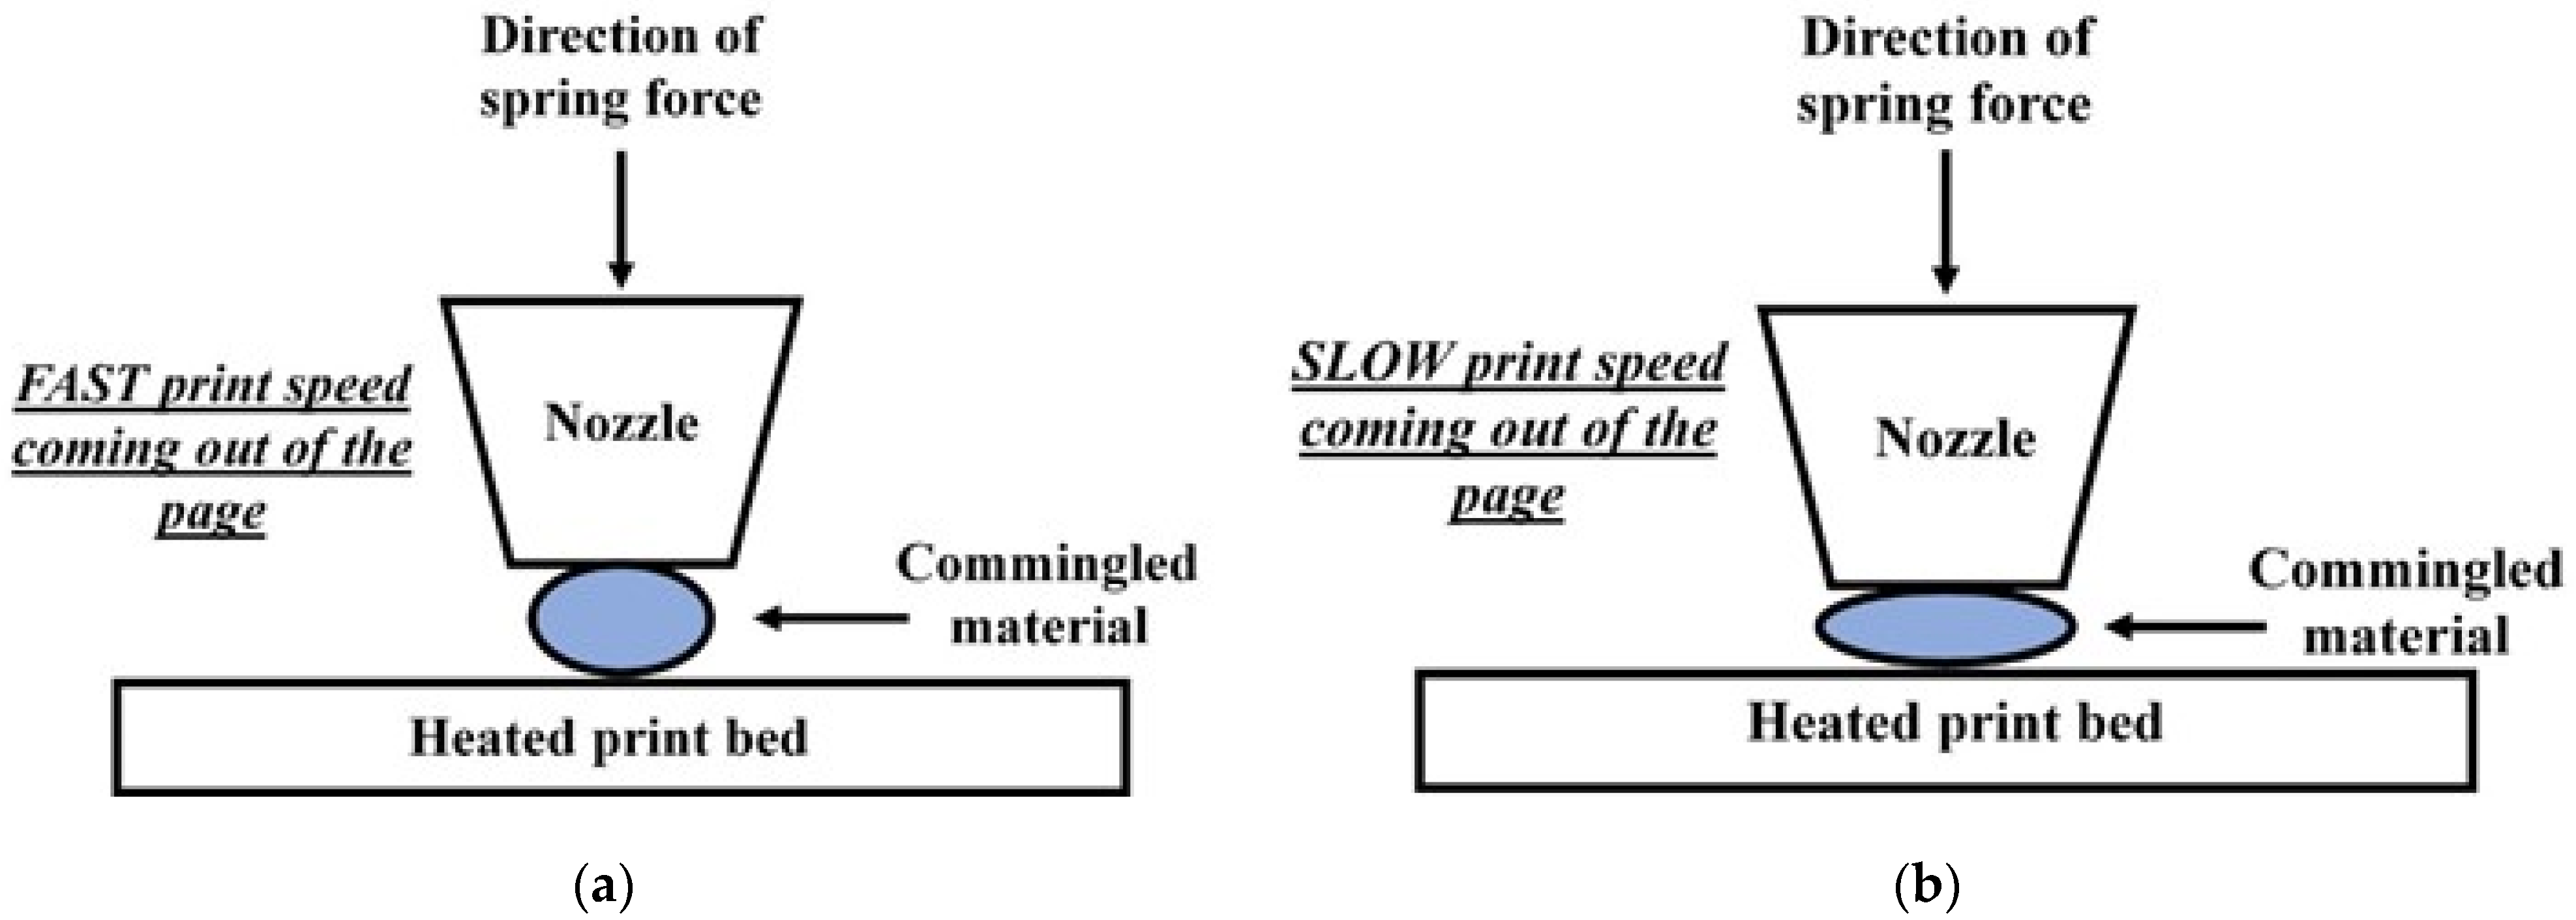
As a result of printing the samples at varying print speeds, analogous to varying the time under consolidation pressure, the nominal sample thickness increased as a function of increasing print speed. This is a trend consistent with other works in the literature [
17,
18]. This trend is intuitive under the assumption that the viscous flow of the thermoplastic polymer in the commingled material, in the low viscosity state experienced during processing, occurs almost entirely due to mechanical force applied by the spring-loaded end effector via the heated nozzle. This implies that the slower print speeds, with all other parameters held constant, will generally correspond to thinner samples. A slow print speed provides a longer period of time for the low viscosity polymer to flow laterally away from the nozzle outlet. Consequently, the changes in sample thickness with print speed were accompanied by changes in the sample width. As the thickness of each ply increased with increasing print speed, the width of the ply decreased accordingly. This concept is illustrated graphically in
Figure 6, where under otherwise equal processing parameters,
Figure 6a correspond to higher print speeds and less consolidation. In comparison,
Figure 6b is indicative of lower prints speeds.
All beam specimens were printed to have an approximate total length of 120 mm. A single DMA test specimen, of 60 mm length was cut from the mid-section of each 120 mm beam. This method provides test specimens from the portion of the beam that is produced under a steady-state print speed, and thus under consistent consolidation, removing material produced during transients as the system accelerates and decelerates.
A total of 10 continuous E-Glass/PET specimens were printed at each print speed, with 6 being used for DMA testing and the remainder for metallographic investigation. Following trimming to the 60 mm length, all specimens were sanded, using 400 grit SiC paper, along the length of the vertical edges (1.5 mm thickness) to provide a pseudo-planar surface for subsequent specimen width measurements. Sanding along the top and bottom of the specimens was not required as the surface finish of both top and bottom surfaces of the specimen were effectively molded during printing by the print bed and the consolidation face of the hot-end fiber placement nozzle.
Specimen cross-section dimensions were measured with a digital micrometer. Four measurements of specimen width and thickness were taken along the length of the beam and averaged. An example of an as-printed beam specimen compared to a post-processed DMA specimen is shown in
Figure 7. The average dimensions of each group of DMA specimens (seven total groups, each composed of six specimens), separated by print speed, are reported in
Table 1.
2.5. Test Procedures
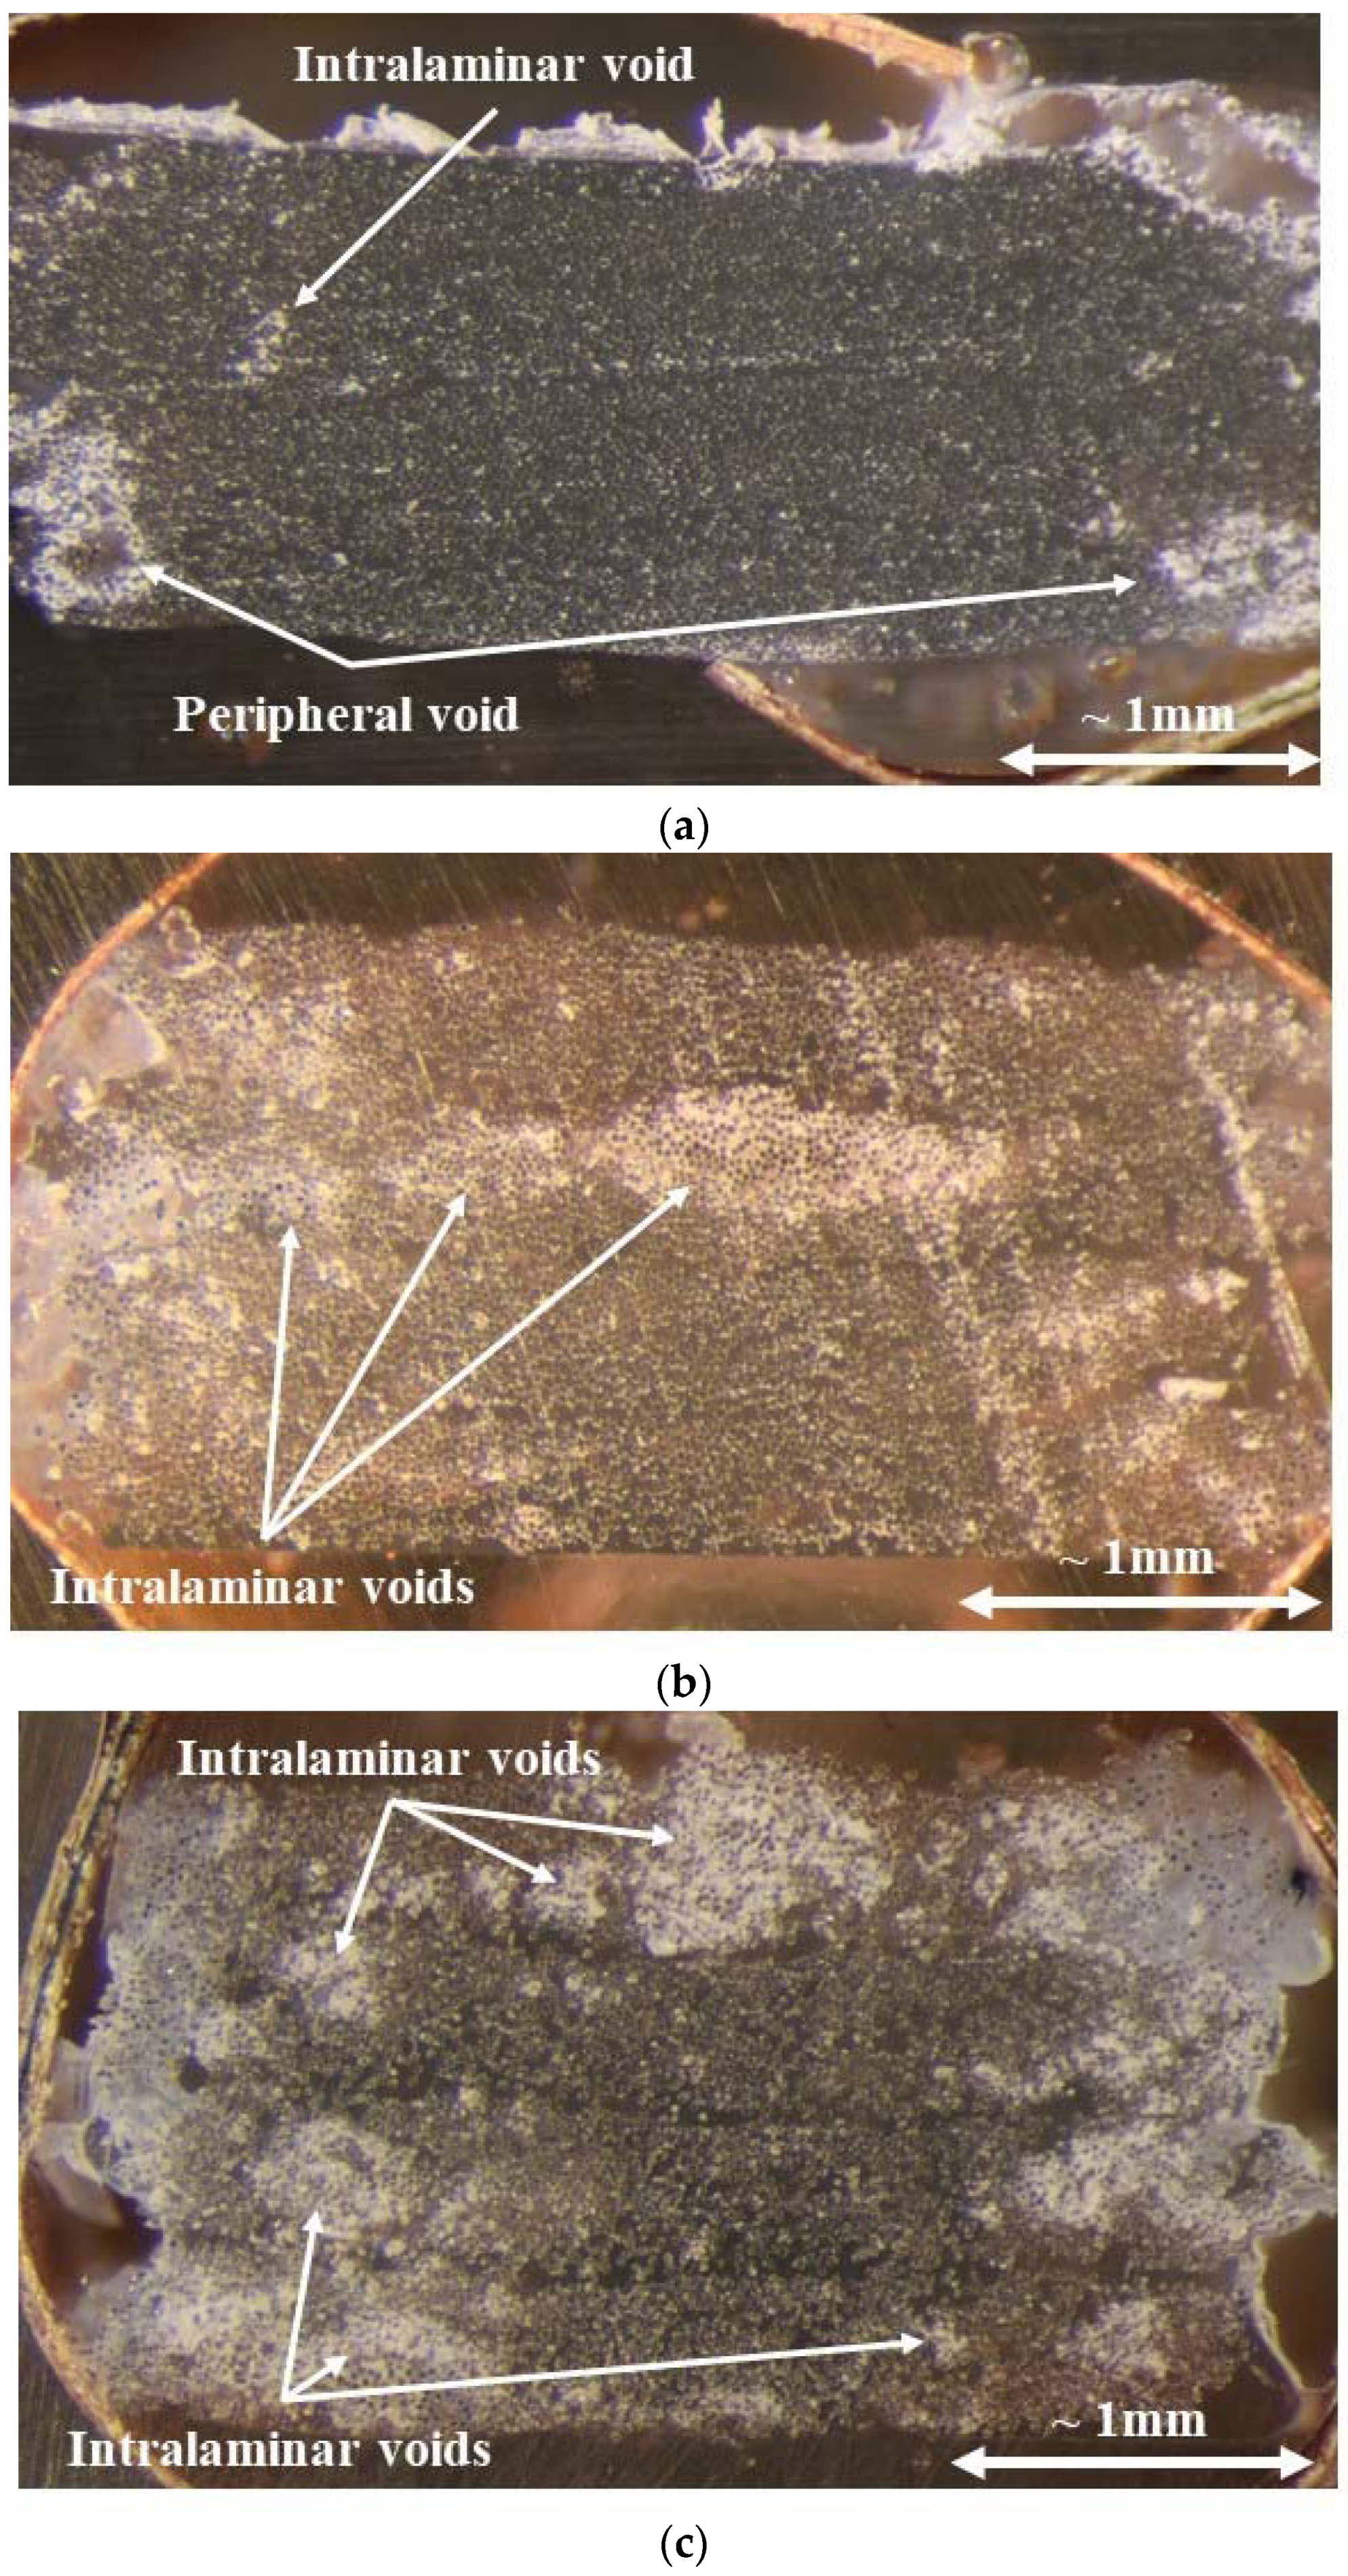
Manufactured specimens were visually inspected. The degree of translucency is a useful indicator of the fiber wetout and internal defects. A more translucent specimen suggests that there is good wetout of the fiber by the PET matrix material and few voids, while an opaque specimen indicates trapped air inside the specimen. Metallographic techniques were also employed to image the cross-sections of representative regions of the printed specimens to verify the consistency of the fiber distribution.
2.5.1. Dynamic Mechanical Analysis
Based on ASTM D4065-12 [
19], DMA tests were performed using a clamped–clamped double cantilever configuration. Specimens for testing were cut from the as-printed beams such that the continuous E-Glass fiber reinforcement spanned the length of the specimen. The test protocol was performed over the temperature range from 30 °C to 90 °C at a heating rate of 5 °C per minute, with a frequency of 1 Hz. A heating rate of 5 °C per minute was chosen as it provides relatively short scan times of roughly 12 min per scan, and yet is slow enough to expect reasonably constant material temperatures given the specimen size.
It is generally accepted that the maximum oscillatory strain to remain within the linear viscoelastic range, as specified by ASTM D4065-12, is less than 0.01 mm/mm. For the purpose of this effort, a nominal strain of 0.005 mm/mm was chosen to ensure the test was performed well within the linear viscoelastic range. Equation (1) was applied to determine the mid-span displacement that would be utilized to generate the 0.005 mm/mm nominal strain.
For Equation (1), ‘
ε’ represents oscillatory strain, ‘
a’ represents maximum beam displacement, ‘
t’ represents nominal DMA specimen thickness and ‘
l’ represents the unclamped or free length of one half of the double cantilever specimen. For the current double cantilever beam test geometry, where ‘
l’ = 10 mm and using the test specimen dimensions given in
Table 1, a 25 μm mid-span specimen displacement translates to a maximum oscillatory strain in the range of 0.0040–0.0052 mm/mm, depending on nominal sample thickness. Thus, 25 μm was used as the programmed mid-span displacement for all tests. Maximum values of the storage modulus (E’), loss modulus (E”) and damping factor (tan δ) were determined directly from the DMA output.
The glass transition temperature (Tg) was also of interest as a potential indicator of void content. Typical methods to determine the glass transition temperature include using the onset of the increase in the tan δ curve, the peak of the tan δ curve, the onset of the E’ drop, the onset of the increase in the E” curve or the peak of the E” curve [
20]. Choosing a method for the determination of Tg is largely dependent on idiosyncrasies that relate to the particular goals of the relevant study, coupled with the background of the experimentalist. The relevant ASTM Standard for the determination and reporting of dynamic mechanical properties, ASTM D4065, recommends using the peak of the tan δ as general practice, while also acknowledging that the other phenomena previously described can also indicate the glass transition temperature [
19].
For the purpose of this work, the glass transition temperature was determined as the temperature at the maximum magnitude of the E” curve at 1 Hz. Literature concerning the correlation between both DMA and differential scanning calorimetry (DSC)-based methodologies for determining the glass transition temperature of polymers indicates that choosing Tg based on the maximum value of the loss modulus (E”), explicitly at 1 Hz, corresponds well with the mid-Tg observed in DSC [
21]. For reference, it was reported that, in isolated cases, differences between Tg determined from the maximum E” and the mid-Tg from DSC can be as much as ±10 °C; however, it should be noted that there is a much poorer correlation between the mid-Tg from DSC and the Tg as determined by the peak of the tan δ curve [
21].
2.5.2. Constituent Material Content Tests
Volume fraction evaluation of all six specimens of each of the seven print speeds was performed in accordance with ASTM D3171 [
22]. Each specimen was dried in a desiccator and weighed prior to determining the composite density via the Archimedes method. For this density determination, specimens were painted on all sides with a thin acrylic coating, of known density, prior to density measurement. This was conducted to seal any open surface porosity and mitigate water uptake in the specimens. Specimens were weighed following the application of the acrylic coating, and as such, the volume of the acrylic coating was accounted for in the relevant calculations. Following composite density determination, the PET matrix from each sample was pyrolyzed in a muffle furnace in air for 5 h at 550 °C, leaving only the continuous E-Glass reinforcement. The glass fiber reinforcement was then weighed, and constituent volume fractions (fiber, matrix and void) were determined based on constituent densities for the commingled precursor material provided by the manufacturer. The constituent density values used in all void fraction calculations were 2.62 g/cm
3 for the E-glass fibers and 1.27 g/cm
3 for the PET fibers.
4. Discussion
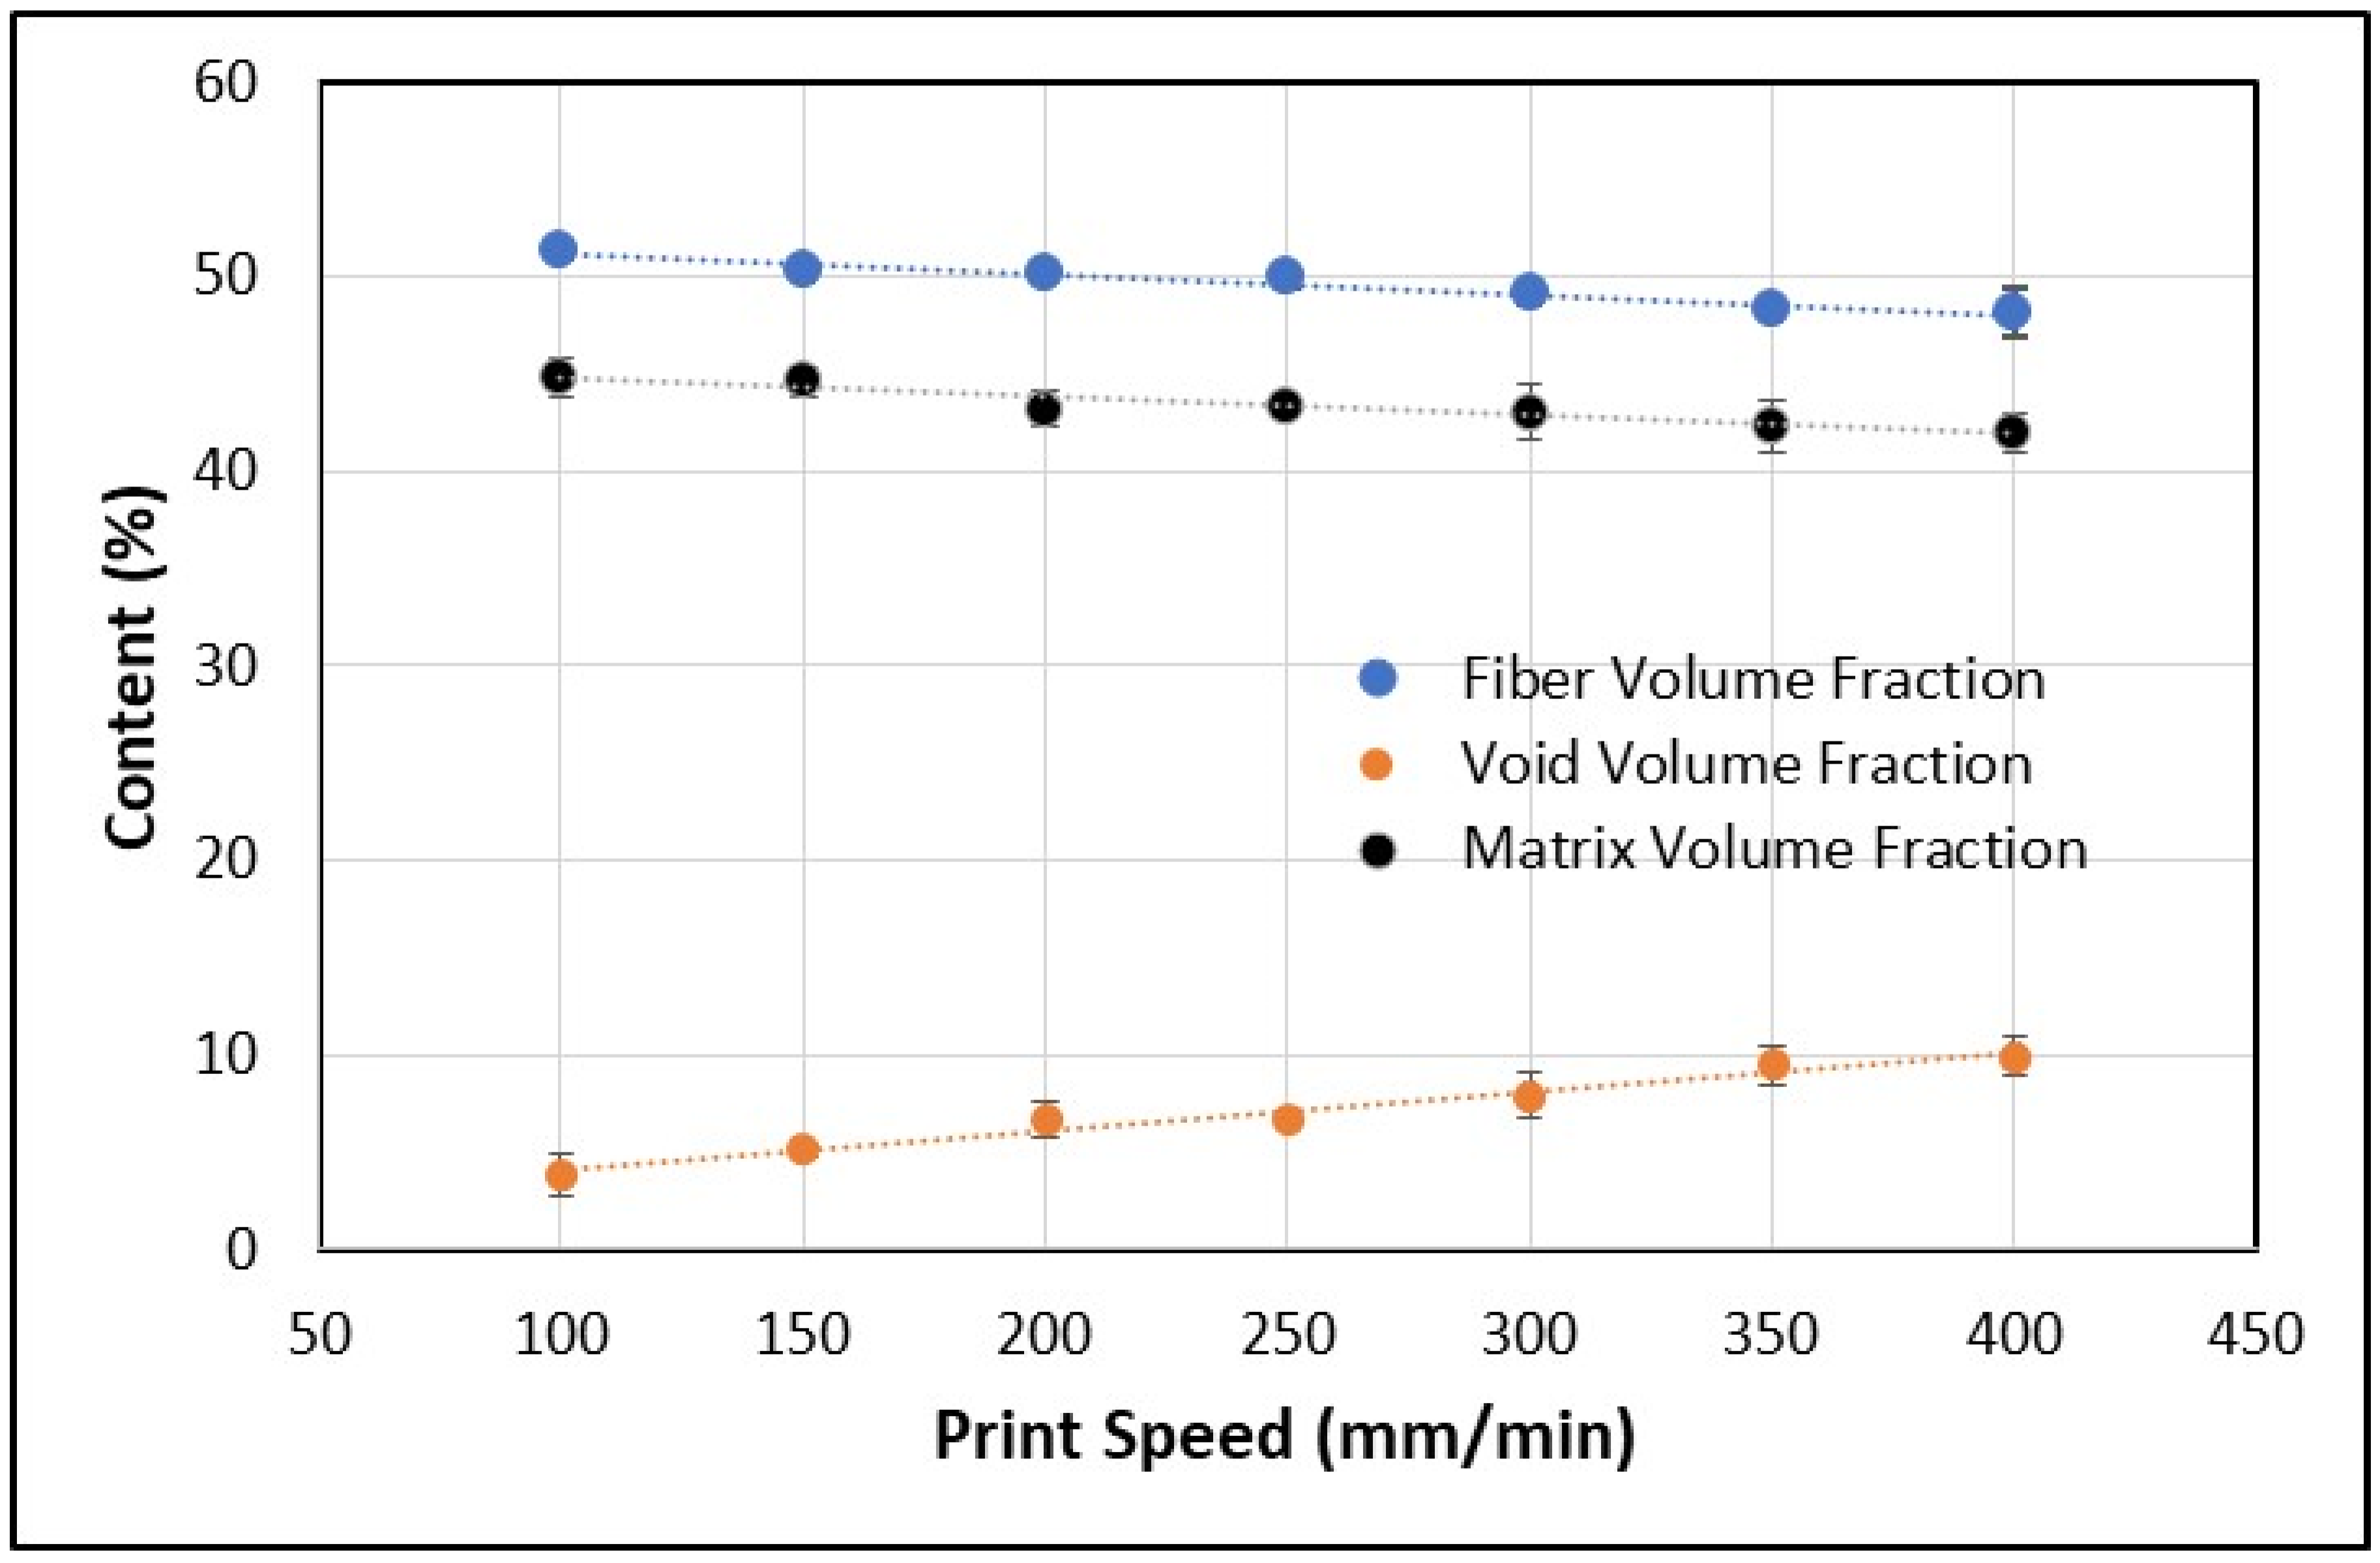
The results shown indicate a relationship between composite quality and print speed. The values of the maximum storage modulus, E’, the maximum loss modulus, E”, and the glass transition temperature, Tg, showed similar trends of decreasing values with increasing print speed, as indicated by the trends displayed in
Figure 8 and
Figure 10. The damping factor, tan δ, showed the opposite trend, increasing with increasing print speed, as seen in
Figure 9. The void content was also shown to increase with print speed, as seen in
Figure 11. However, to better investigate these trends, it is necessary to consider the DMA results and the measured void content. To better visualize the direct relationships between E’, E”, tan δ and Tg and the void content, the data is replotted, in terms of DMA results versus void content, in
Figure 13,
Figure 14,
Figure 15 and
Figure 16. The maximum measured storage modulus data, determined as a function of void content, is presented in
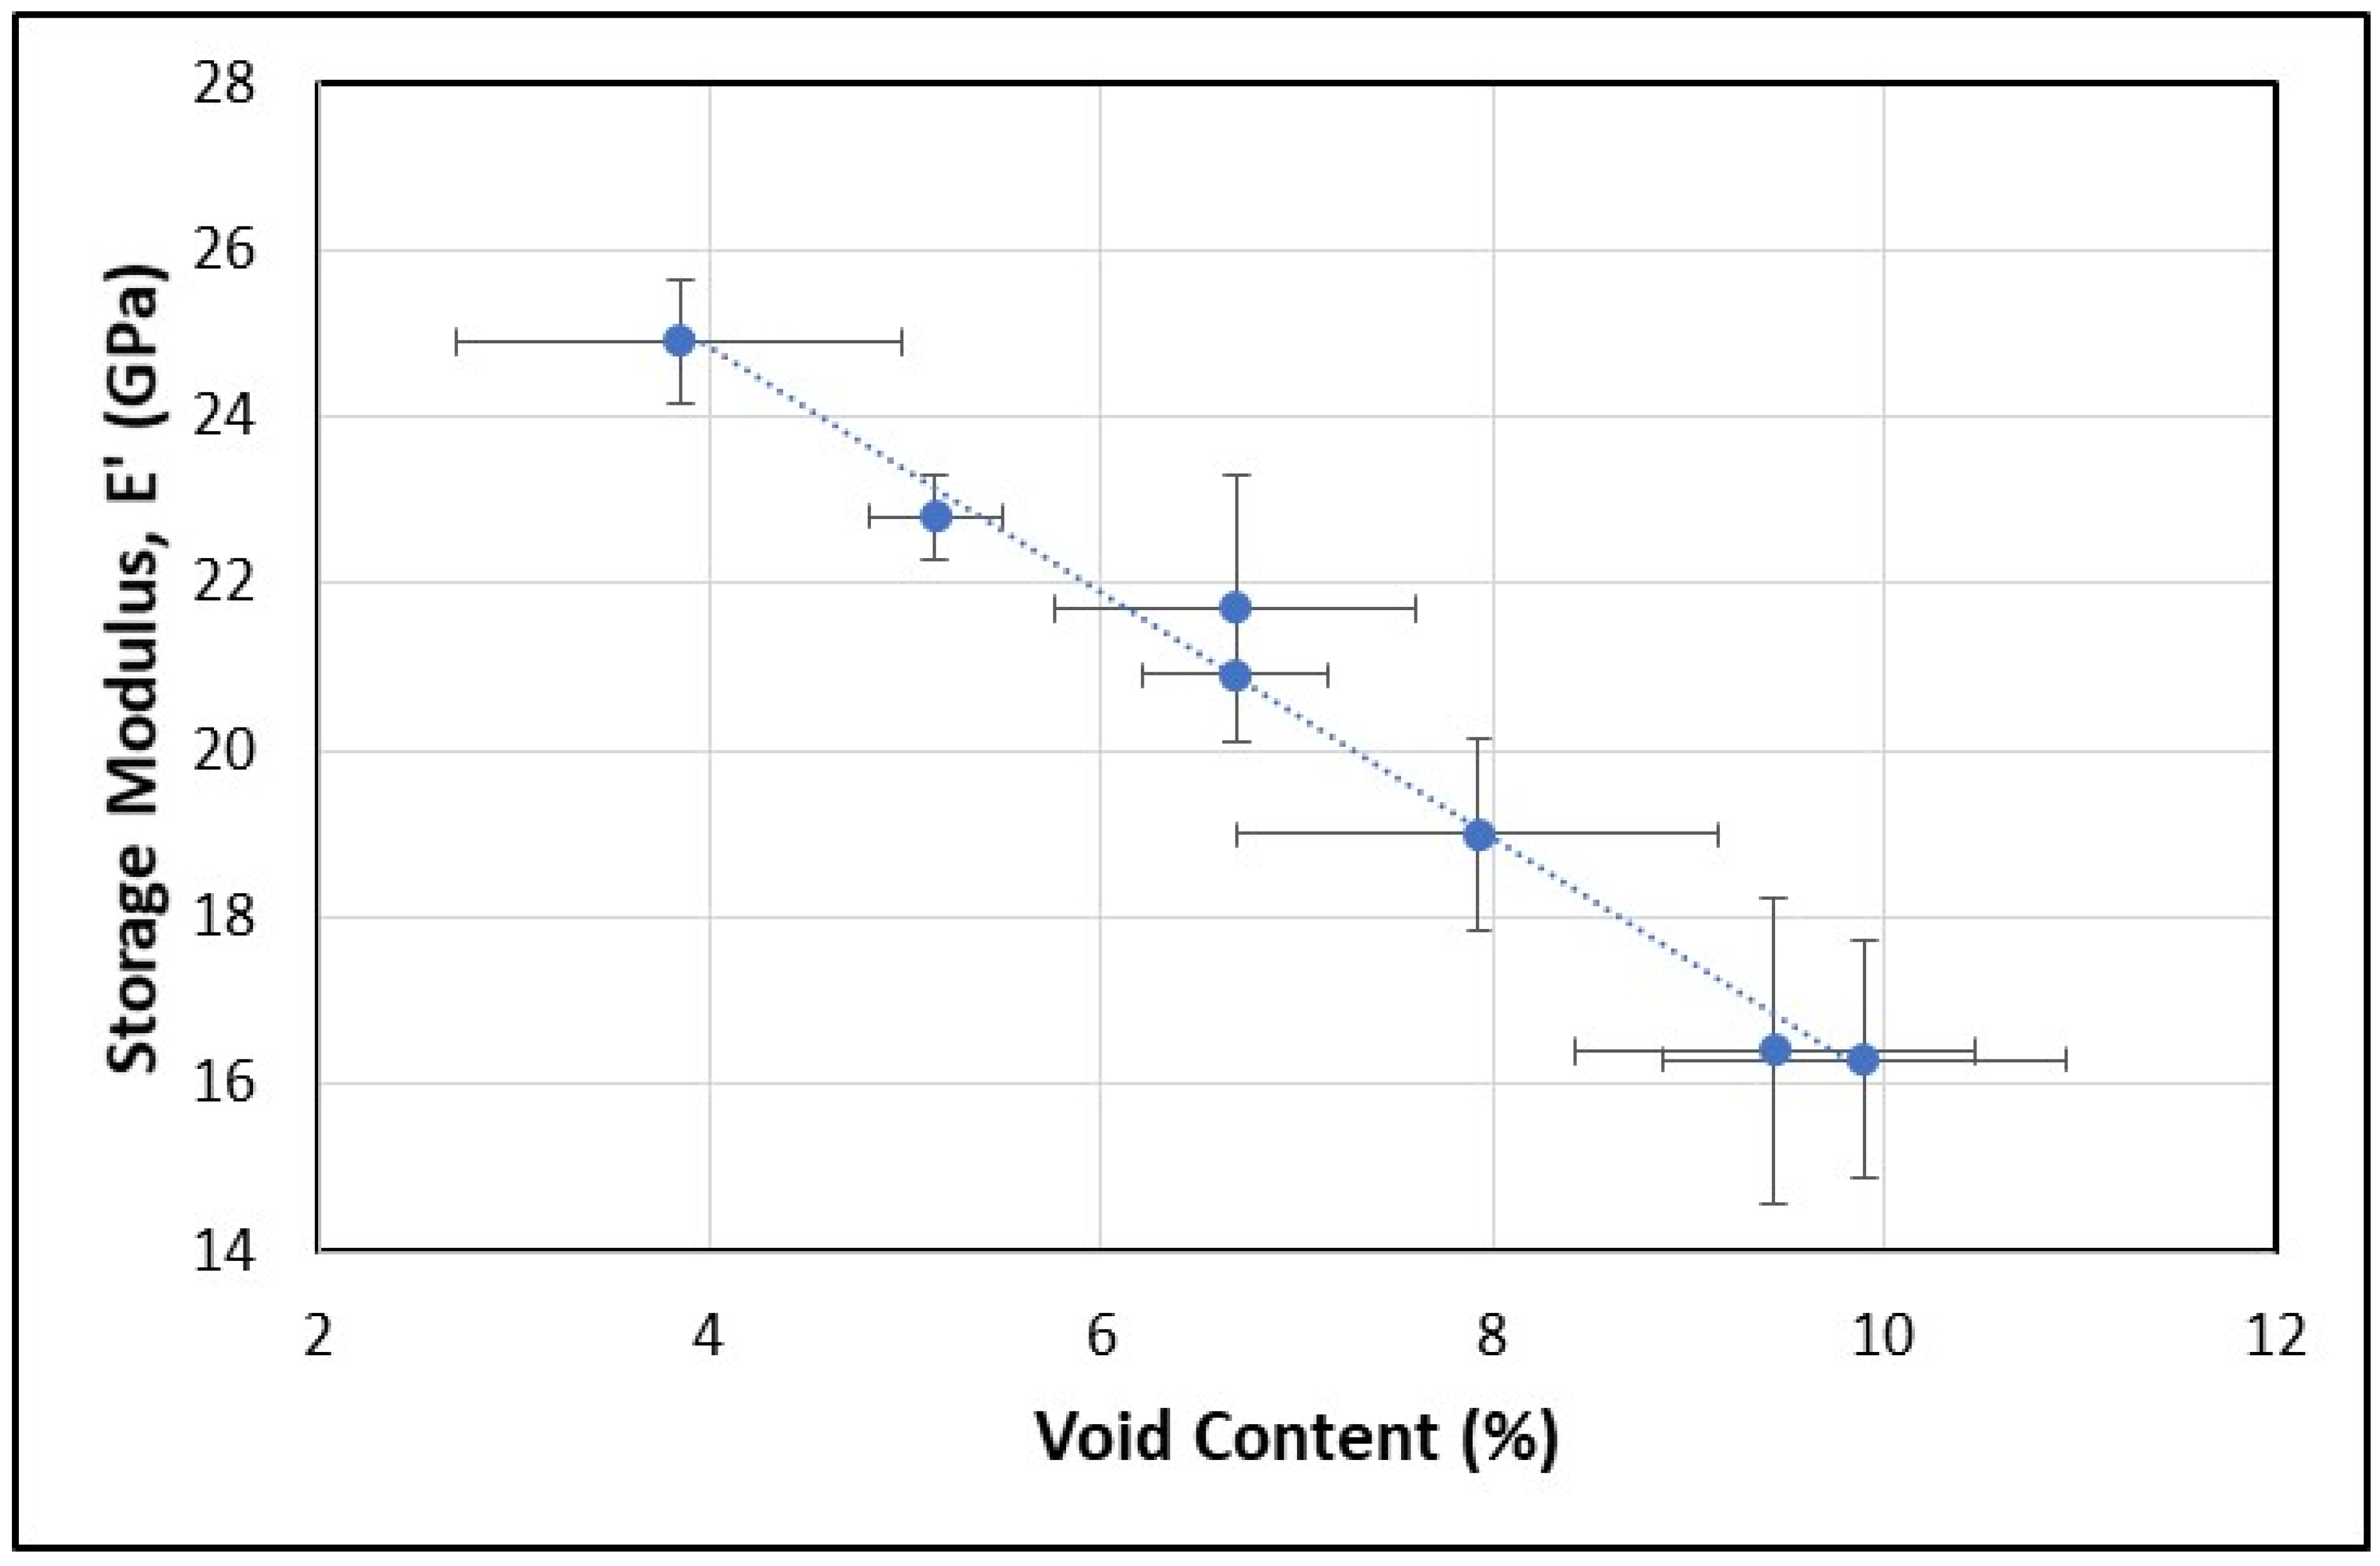
Figure 13 with associated error bars indicating the standard deviation of the six samples measured at each of the seven print speeds for both the average maximum storage modulus and the void content.
When examining
Figure 13, it is clear that there is a distinct negative trend in the storage modulus with increasing void content in the printed composite specimens. Further, it is important to realize that the data in
Figure 11 also show a decreasing fiber volume fraction with print speed. This indicates that the decreasing E’ can also be correlated to the reduced fiber volume fraction. It should be noted that at a void content of approximately 6.7%, there are two values of storage modulus. These two points represent the print speeds of 200 and 250 mm/min. The standard deviations of these two storage modulus values overlap, making it difficult to separate them; however, even though the effective consolidation was not different for these two cases, a linear trendline of storage modulus with void content still fits the data collected, falling within the error bars related to the associated standard deviations. Based on the data presented, the measured average values of the maximum storage modulus decrease by approximately 33%, with close to a 6% increase in void content. This decrease in the maximum measured storage modulus translates to an approximate 5% decrease, or almost a 1.5 GPa drop per 1% added void content.
The average of the maximum value of the measured loss modulus, E”, was also determined for each of the seven print speed specimen groups along with the associated standard deviations. In this research, the maximum measured loss modulus was observed in the glass transition region of the DMA temperature sweep and can also be used as an indicator of the glass transition temperature [
20,
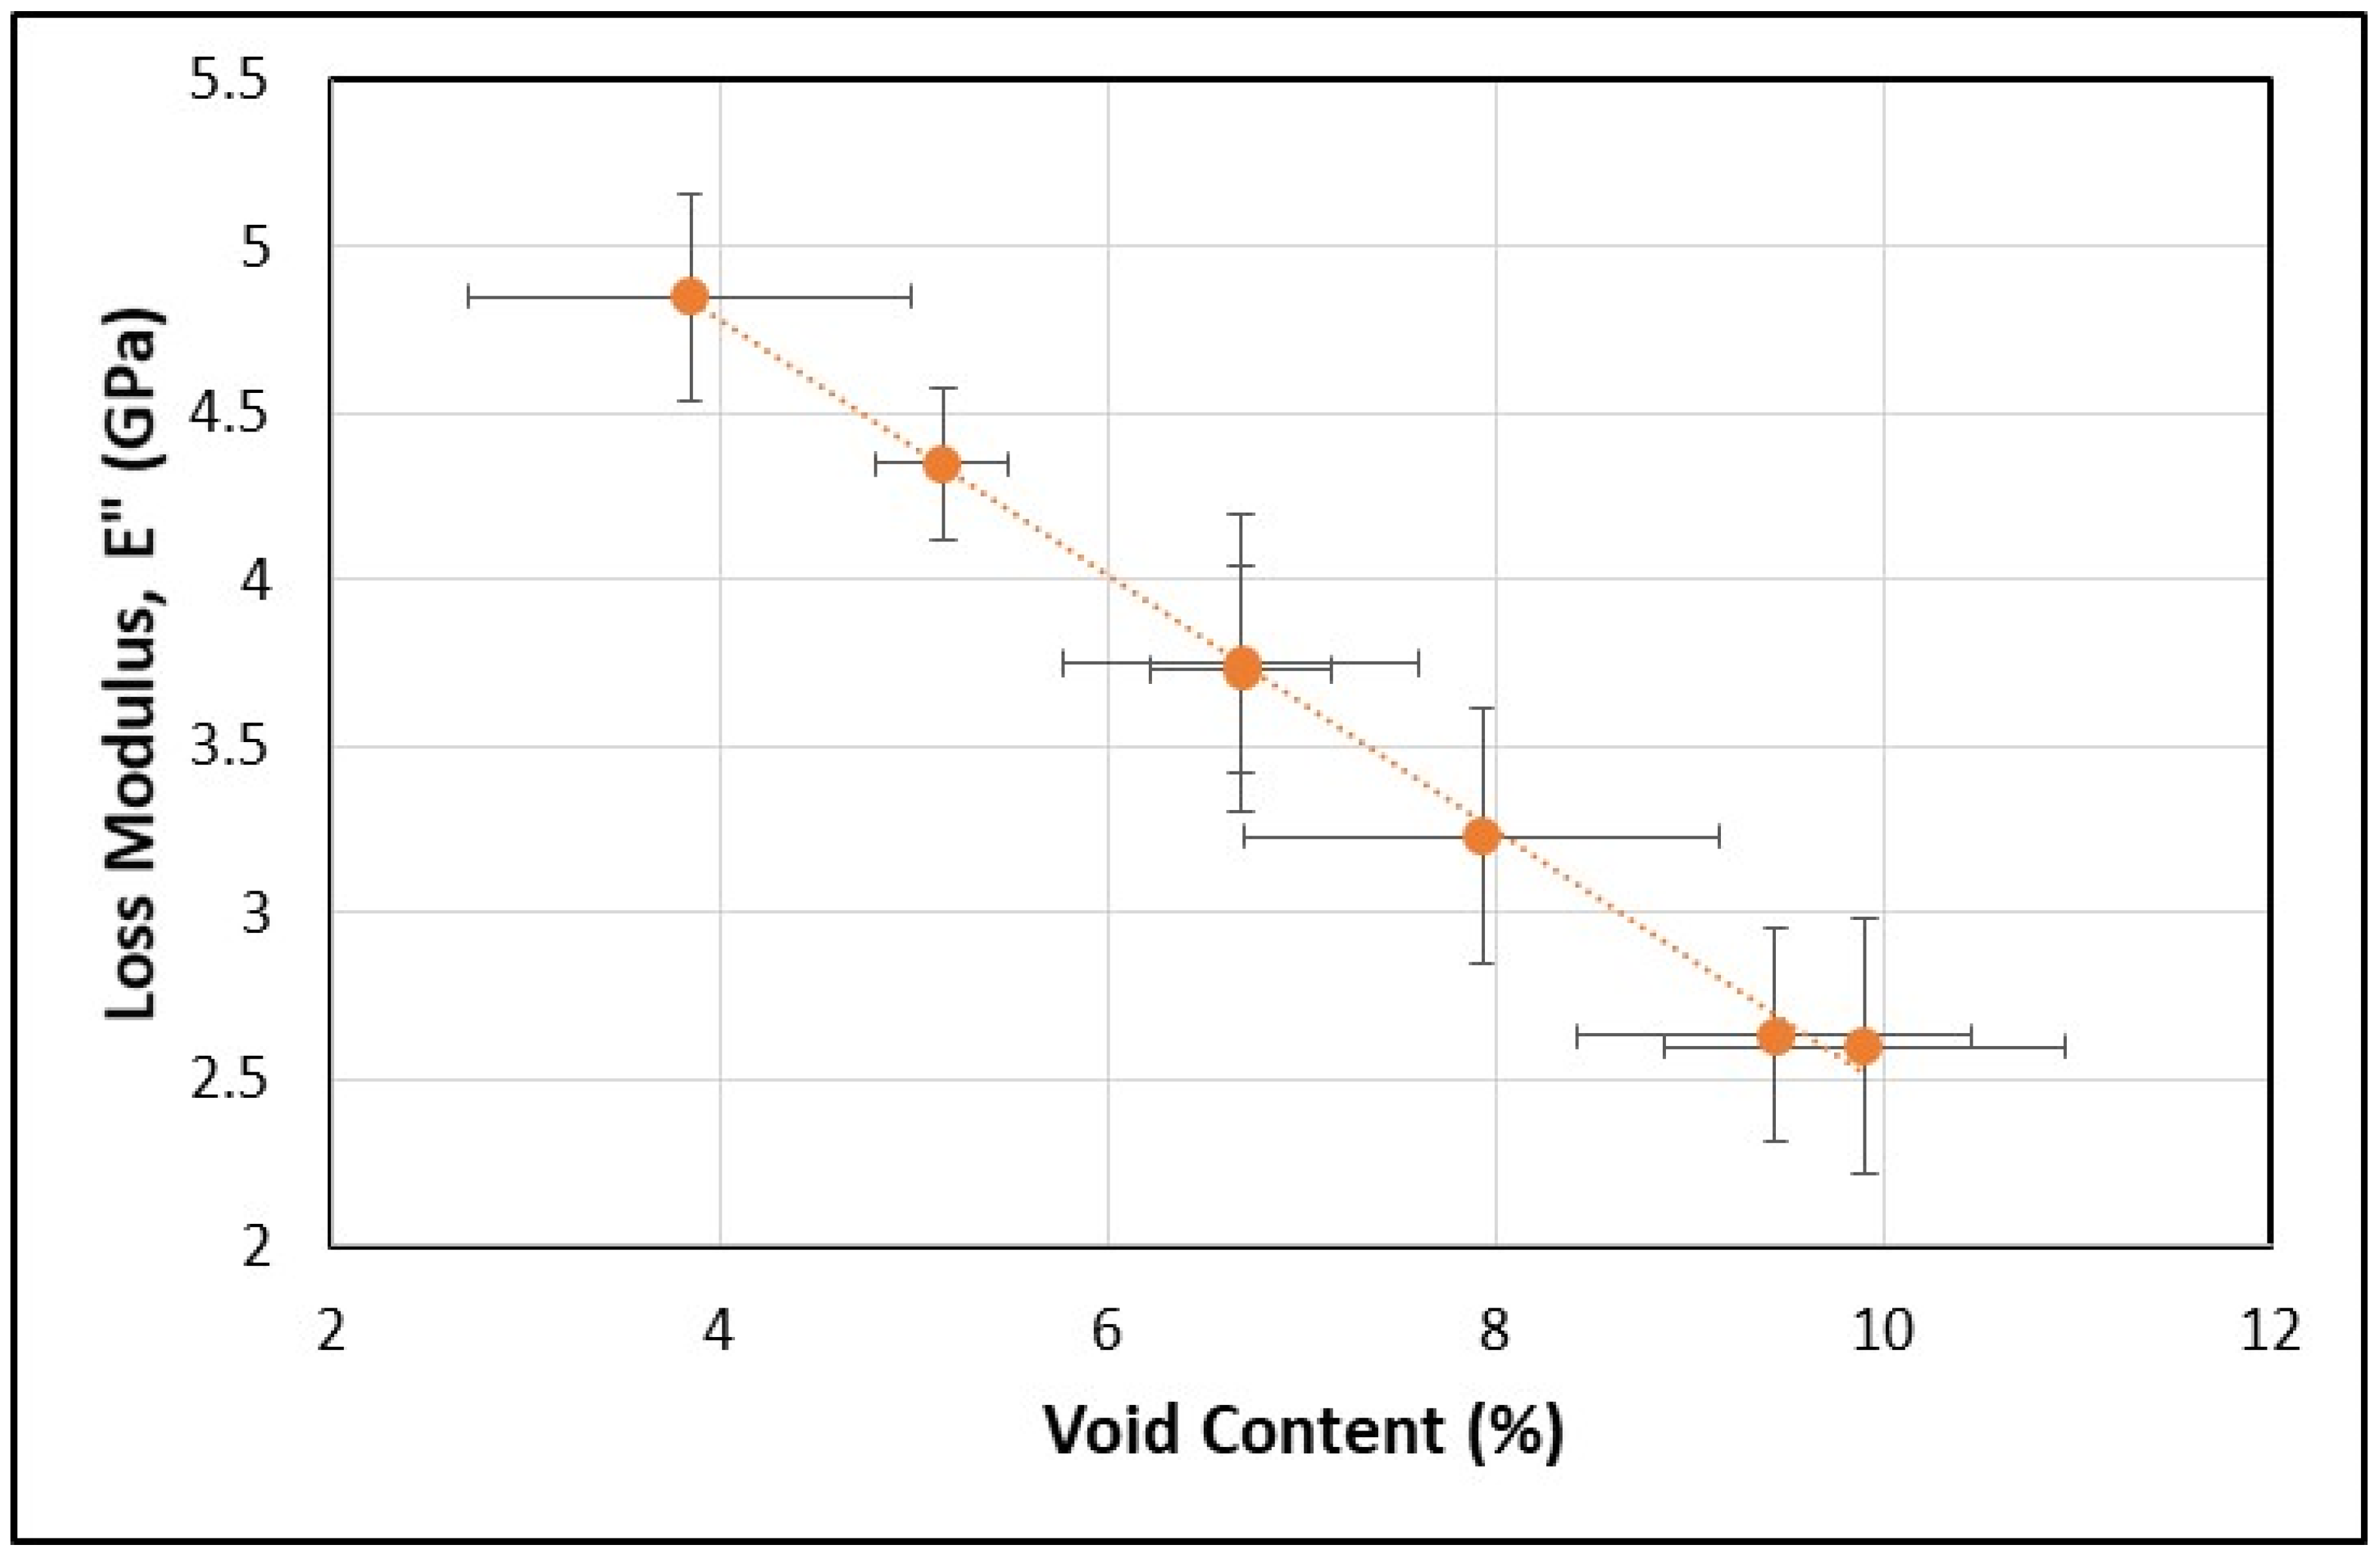
23]. More generally, the loss modulus serves as a representation of the ability of a polymer to dissipate strain energy as heat through internal motions. In consideration of the relevant DMA literature, it is not uncommon for studies to report differences in the maximum measured loss modulus for the same temperature at which the maximum E” is measured; however, it is uncommon to see commentary on the significance of the magnitude of E” at its maximum value in the DMA scan. Similar to the format used to present the measured average maximum storage modulus as a function of void content, the measured average maximum values of loss modulus, with associated sample standard deviations, are presented against void content in
Figure 14.
Again, a linear trend line was added to
Figure 14 for the purpose of showing a seemingly linear relationship in the empirical data within the experimental window. Like the results of the storage modulus, the measured loss modulus data is also subject to two stacked, or vertically coincident, data points at 6.7% void content. As with the prior case, these stacked data points correspond directly to the nominal 200 mm/min and 250 mm/min specimen groups which exhibited nearly identical average void contents. In keeping with the storage modulus trend, the nominal values for measured average maximum loss modulus at these two points lie within the sample standard deviations of each other, and as such, cannot be readily distinguished as being significantly different from one another. Based on the data presented, the measured average values of the maximum loss moduli decrease by approximately 45% with the 6% increase in void content. This decrease in the measured maximum loss modulus translates to an approximate 7% decrease or almost a 0.4 GPa drop per 1% added void content.
At first glance, this decreasing trend of E” with void content seems counterintuitive as damping should seem to increase with increasing void content. However, within the tested temperature range, it is assumed that the viscoelastic material response is heavily influenced by the amorphous PET thermoplastic matrix, as well as the interface between the PET matrix and the continuous E-Glass reinforcement. As such, it is likely that the negative trend in the maximum measured loss modulus, with increasing void content, can be generally related to a combination of the corresponding decreases in both the fiber volume content and the matrix volume content, as seen in
Figure 11. This is in addition to the fact that these measured values of maximum E” are taken in the temperature region of the glass transition and far above the temperature of the measured maximum E’. Thus, to better assess the effect of voids on the damping characteristics, it is useful to consider the damping factor, tan δ. The trend of increasing tan δ with void content, shown in
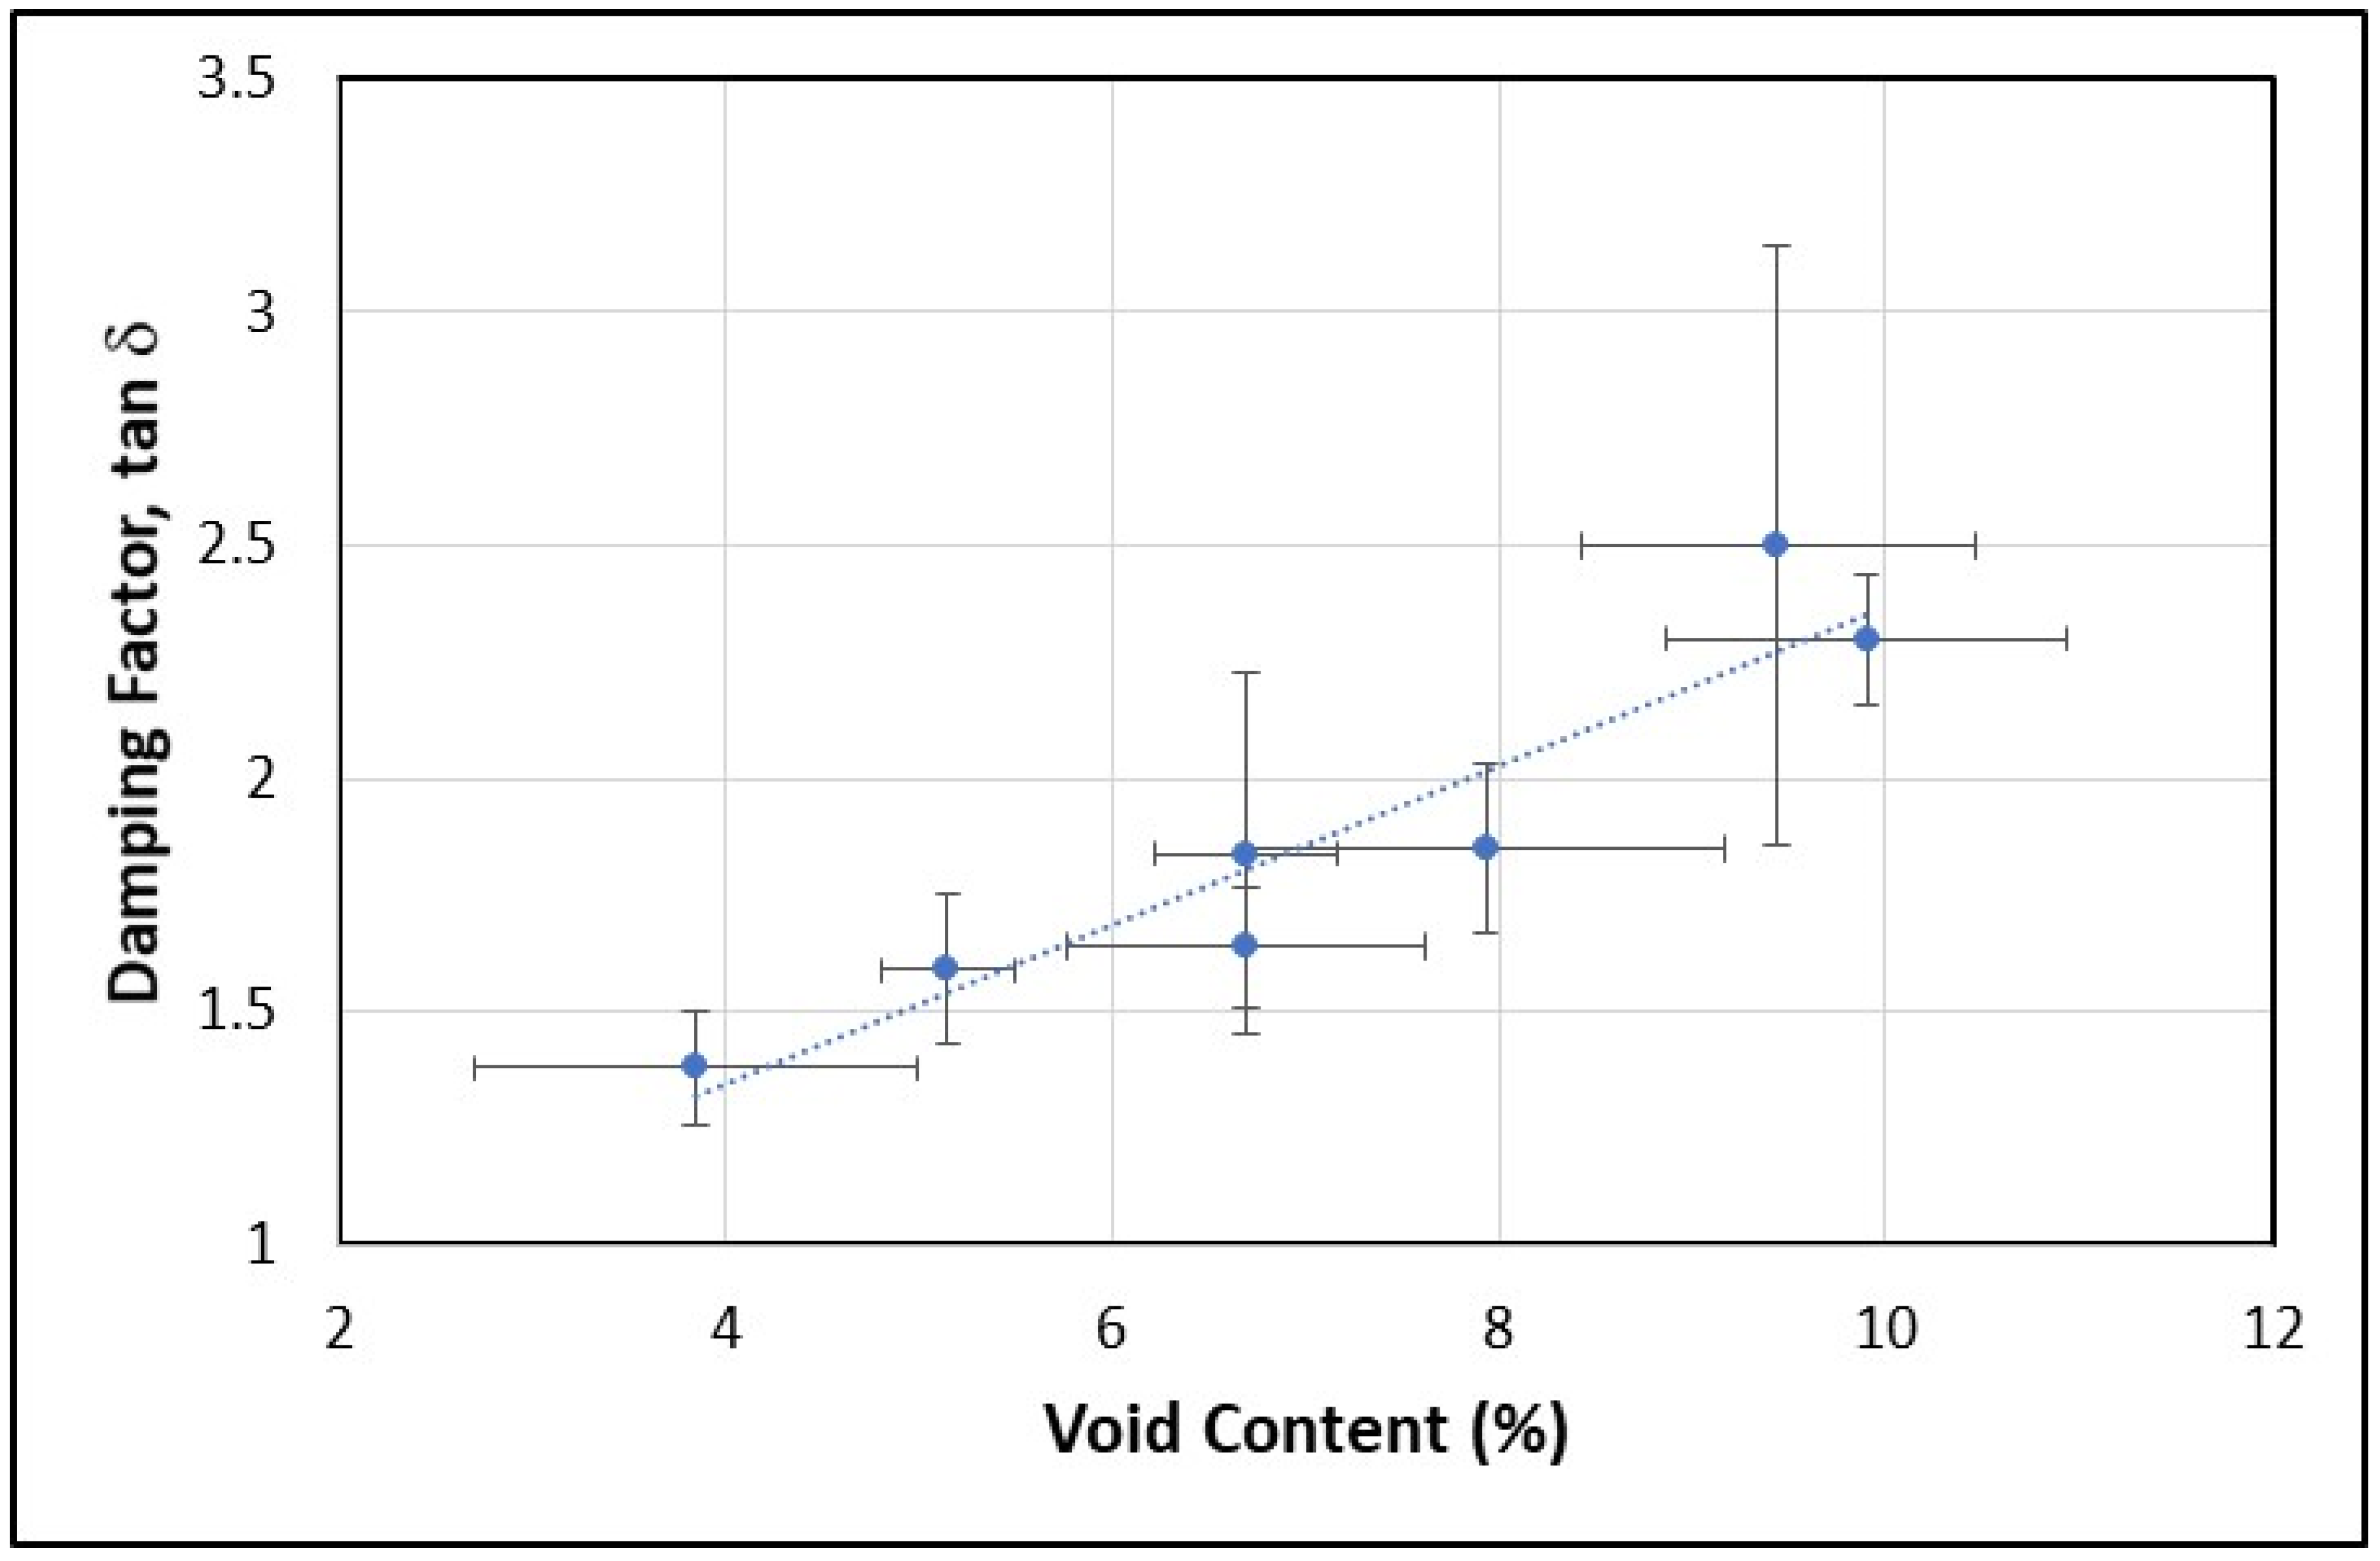
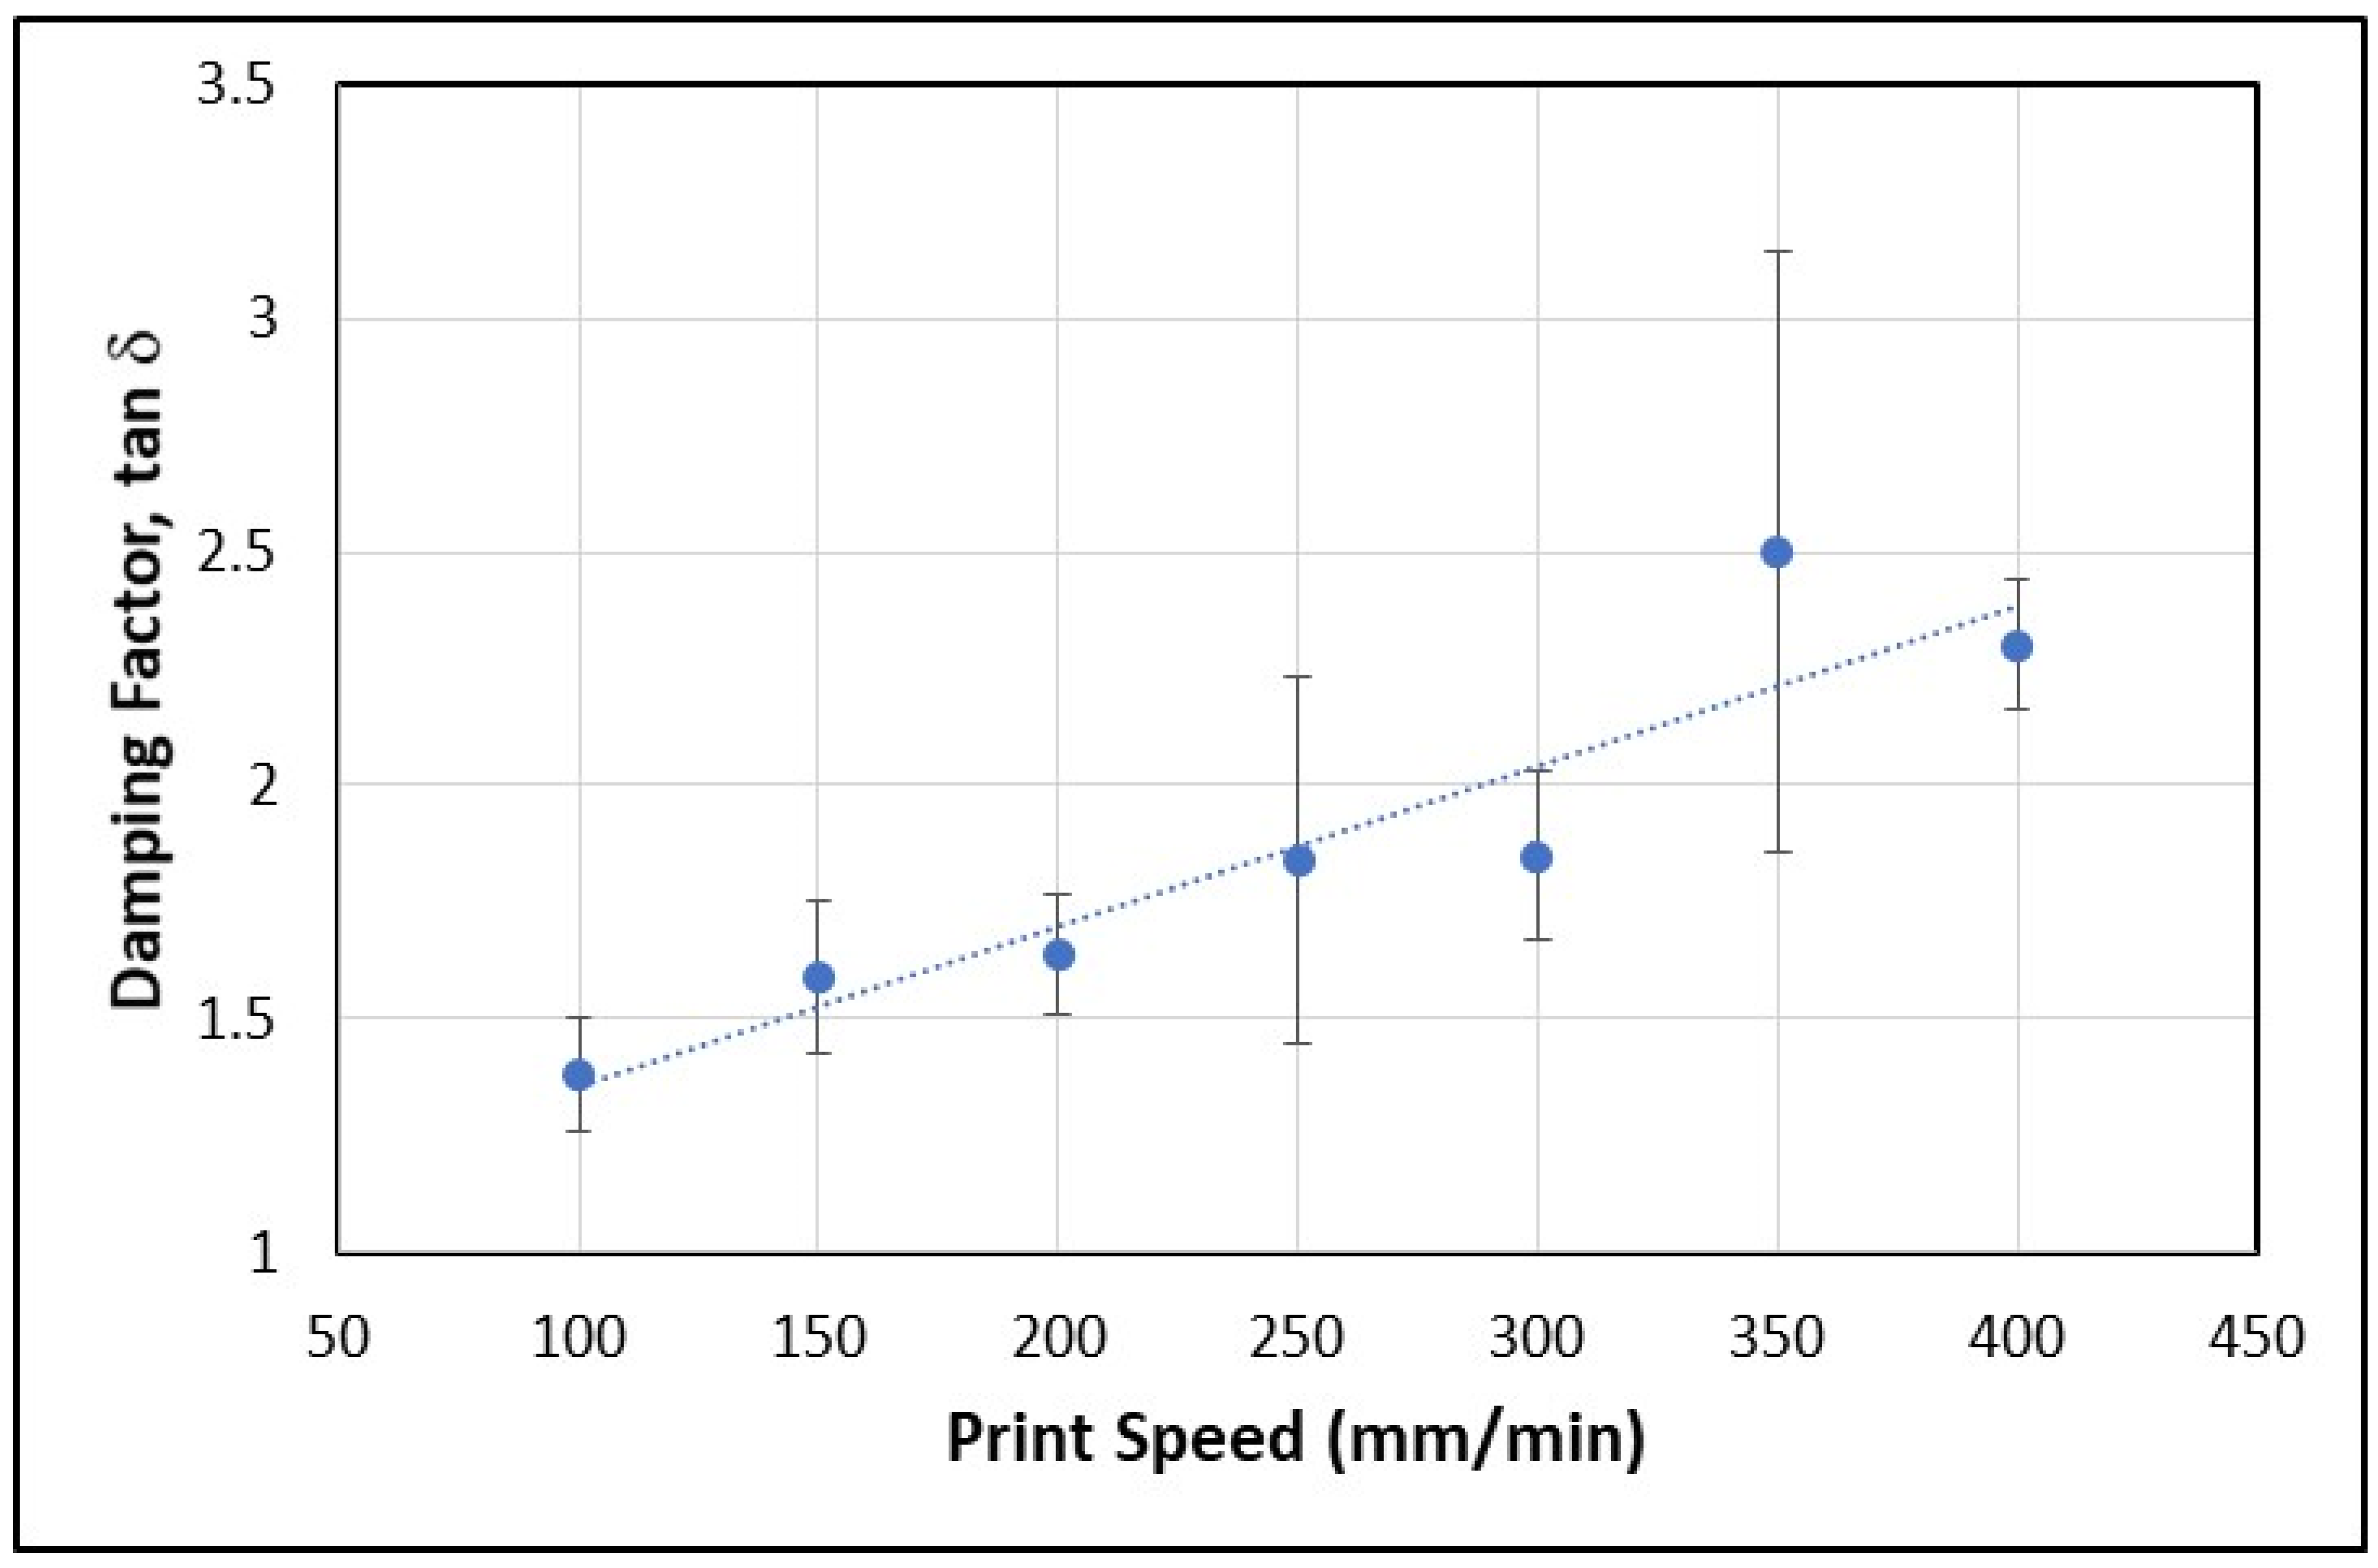
Figure 15, is a clear indication of the effect of increasing voids. This increase in the damping factor is consistent with expectations.
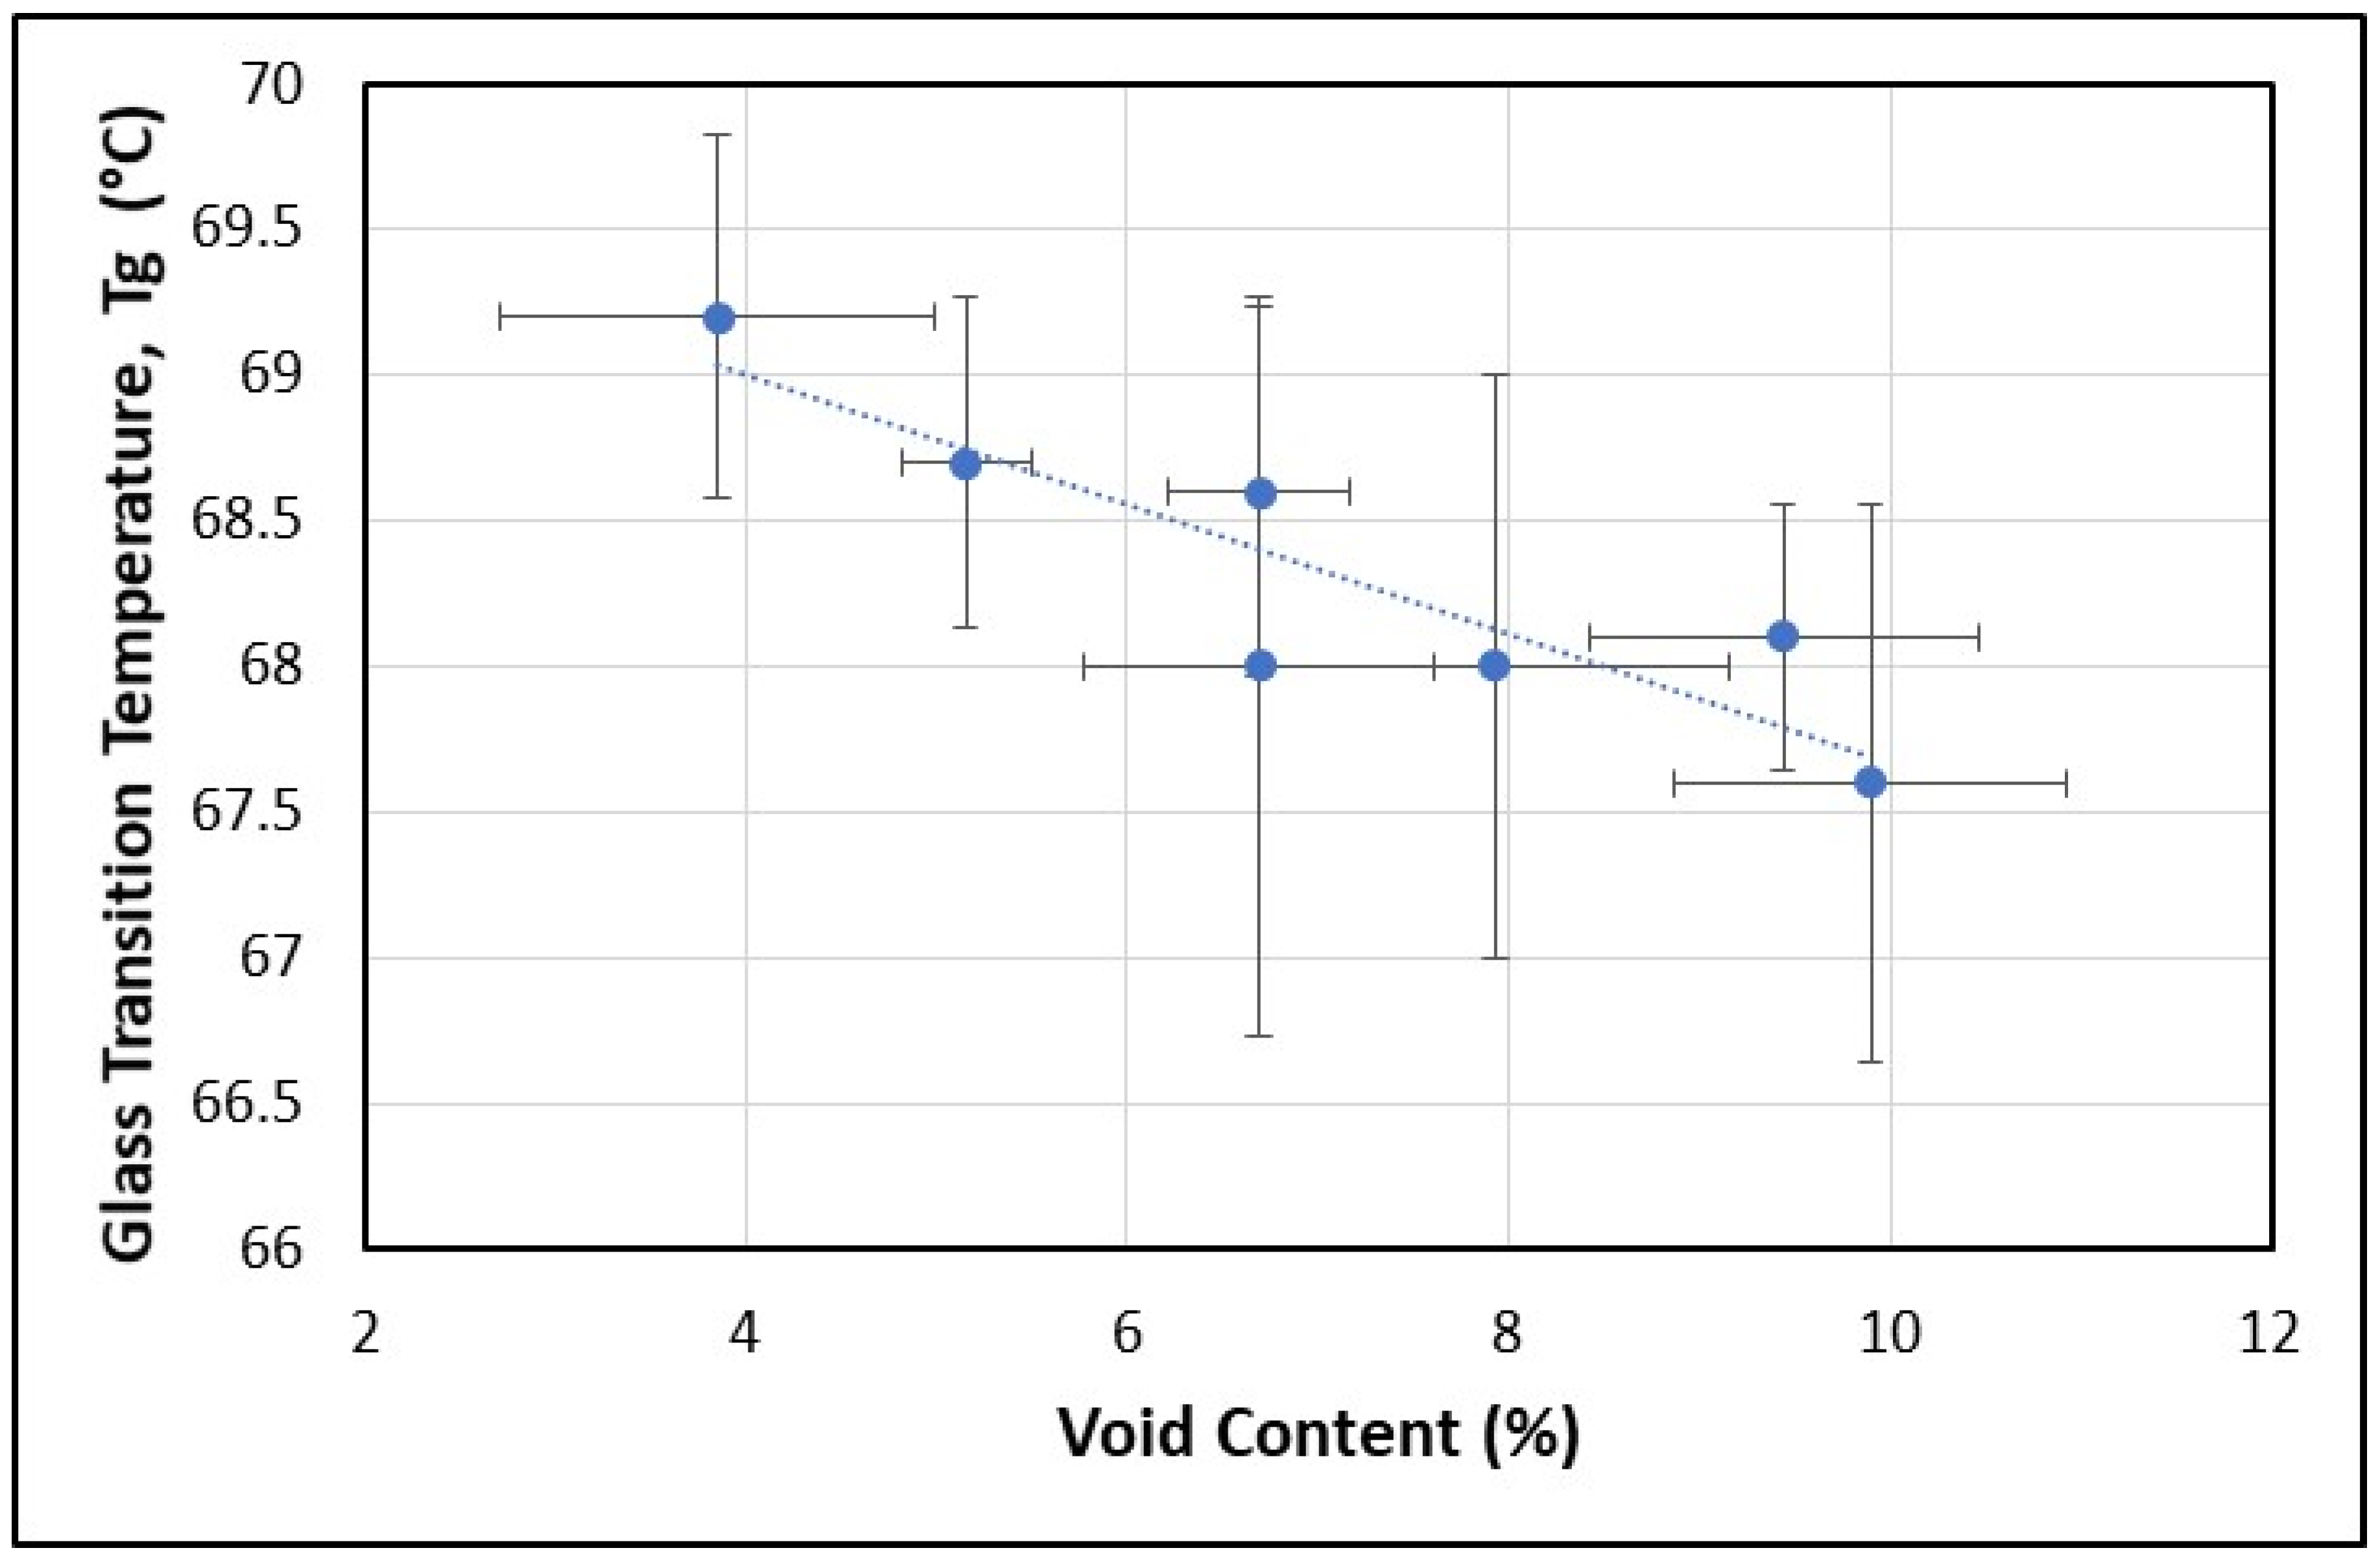
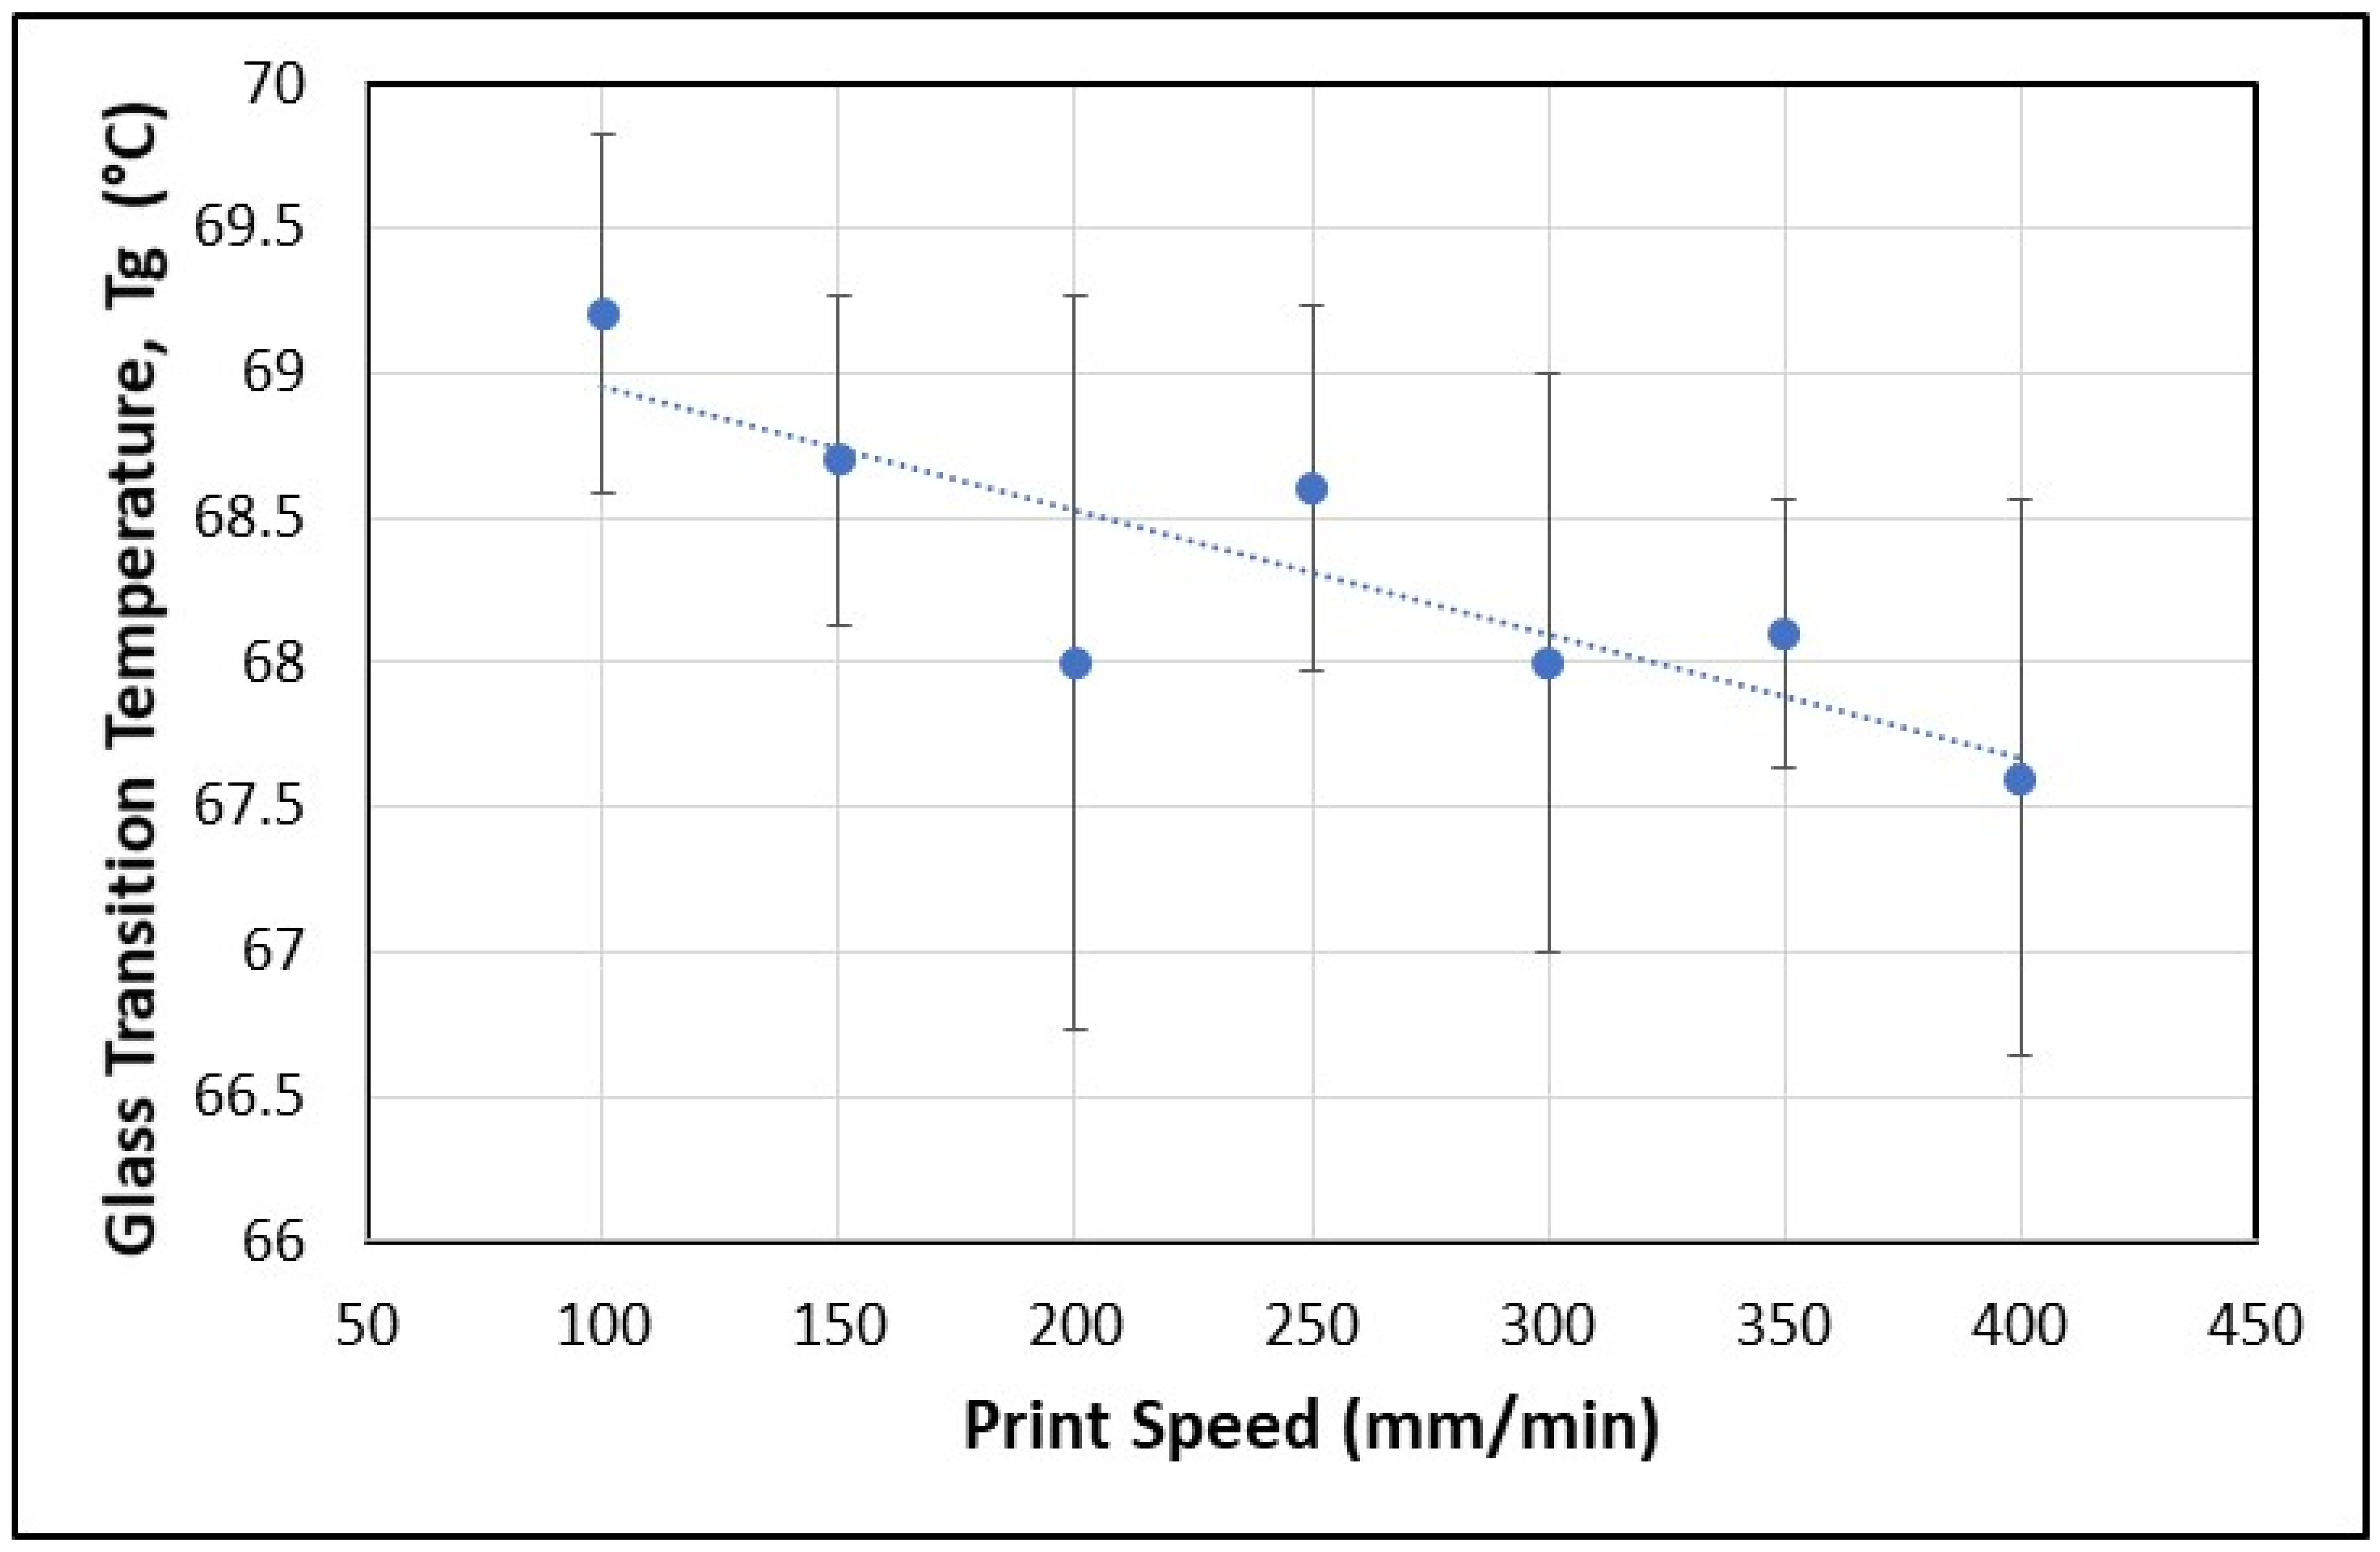
Finally, it is important to consider how the glass transition temperature, Tg, as measured from the maximum loss modulus, E”, varies with void content, as shown in
Figure 16. Despite the seemingly small range of measured glass transition temperature across the approximately 6% increase in void content, as well as the relatively large sample standard deviations, the negative trend shown in
Figure 16 is tenable based on the first (graphically the left-most data point) and last (graphically the right-most data point) data points coupled with their associated standard deviations, which do not overlap. In the relevant literature, it is common to record variations in Tg as a function of small changes to a material that is subjected to dynamic mechanical analysis [
7,
18,
23,
24]. Furthermore, the two most relevant articles to this work reported clear shifts in Tg to lower temperatures, with decreased interfacial contact between the constituent reinforcement and matrix as well as increased void content (i.e., manufacturing defects) [
7,
18].
The fundamental assumption driving this experimental study was that DMA measurements would be more sensitive to variations in void content than other quasi-static mechanical tests such fiber dominated tensile tests or even short beam shear testing. It was also important to understand if DMA would be sensitive enough to serve as a tool to investigate changes in the manufacturing process parameters. The storage modulus, loss modulus and the damping factor results all showed a strong correlation with the void content and the associated print speed. Additionally, the measured trend of decreasing glass transition temperature with increasing voids was consistent with prior efforts. However, it should be noted that the maximum measured storage modulus has a lower standard deviation than that of both the loss modulus and the damping factor and tends to be more consistently determined. Correspondingly, the damping factor, tan δ, determined from the ratio of E”/E’ at the maximum value of E’ demonstrates a consistently increasing trend with void fraction. While the linear trendline suggests a 5% change in storage modulus and a 14% change in the damping factor for each increment of 1% void content, a more conservative approach involves considering the standard deviation in the values of void content. The standard deviations in the void content are greater than those in the DMA measured values, and thus, while the trends of storage and damping factor with void fraction may be clear, the variability in void fraction suggests that the resolution of this approach may be limited by the variability in the void content measurement. This limitation, tied to the method of void content measurement, still does not diminish the potential for this DMA-based approach to serve as a quality evaluation tool, as clear trends exist between the DMA data and both the print speed and void content. To gain further insight into the potential for this technique to assess manufactured thermoplastic matrix composite quality and understand the interrelationships between the three primary process parameters, print speed, consolidation pressure and temperature, future efforts will need to investigate the effects of changing temperature and consolidation pressure on the resulting void content.


