Article

Static and Fatigue Debond Resistance between the Composite Facesheet and Al Cores under Mode-1 in Sandwich Beams

by
Vignesh Selvam
,
Vijay Shankar Sridharan
and
Sridhar Idapalapati
*
School of Mechanical and Aerospace Engineering, Nanyang Technological University, Singapore 639798, Singapore
*
Author to whom correspondence should be addressed.
Currently with School of Material Science and Engineering, Nanyang Technological University, Singapore 639798, Singapore.
J. Compos. Sci. 2022, 6(2), 51; https://doi.org/10.3390/jcs6020051
Submission received: 17 November 2021 / Revised: 20 January 2022 / Accepted: 30 January 2022 / Published: 7 February 2022
(This article belongs to the Special Issue Polymer Composites and Fibers)

Abstract

:
The debonding toughness between unidirectional glass fiber reinforced polymer face sheets and cellularic cores of sandwich structures is experimentally measured under static and fatigue loading conditions. The effect of various core geometries, such as regular honeycomb and closed-cell foams of two relative densities on the adhesive interfacial toughness is explored using the single cantilever beam (SCB) testing method. The steady-state crack growth measurements are used to plot the Paris curves. The uniformity of adhesive filleting and the crack path was found to affect the interfacial toughness. The static Mode-1 interfacial toughness of high-density foam cores was witnessed to be maximal, followed by low-density honeycomb, high-density honeycomb, and low-density foam core. Similarly, the fatigue behavior of the low-density honeycomb core has the lowest crack growth rates compared to the other samples, primarily due to uniform adhesive filleting.

1. Introduction

The employability of sandwich structures has shown a growing trend in various industries, including aerospace, renewable energy, automotive, marine, etc. [1,2]. Based on the intended applications, lightweight core materials of various densities and topologies are used. Due to their high specific strength and stiffness, sandwich composites are used in critical high-value components in aircrafts, such as the wing leading edge, aileron balance panels, engine nacelle components, thrust reversers, rudder, radomes, and engine impact liners.
Honeycomb sandwich structures reinforced with thin or thick face sheets have been found attractive for utilization in aero engine applications ranging from simple acoustic panels to impact liners to contain impacts during service by foreign object impact damage (FOD) [3,4]. Their application has shown good in-service reliability and maintenance in terms of localized repairs [5]. During service, sandwich structures are subjected to many complicated failure mechanisms (e.g., core compression, shear crimping, face sheet buckling, and face/core disbonding) based on their geometry, material properties, and loading condition.
One of the most critical ones is the face sheet/core debonding in which the face sheet of the sandwich structure is separated from the core. Some of these damages can be fomented due to either a manufacturing defect or adhesive agglomeration or deficiency in the interface. A prime example of this has been recorded within the Aviation Investigation Report ‘Loss of Rudder in Flight’ [6], where a disbond at the z-section of a rudder grew due to pressure cycling loads to a critical size, resulting in a rapid and sudden explosion of the skin. This leads to a chain of failure events and to catastrophic rudder failure. These disbond growths are incipient in nature and can cause significant damage, leading to compromising the operational safety of the aircraft. Hence, studies pertaining to critical energy release rates and damage growth in various core-face sheet interfaces must be conducted to develop an aid for the design of structural sandwich composites. There are a few patents on the use of multi-layer hybrid composite sandwich structures, such as future aircraft engine casings (GE®, for example). When these casings are to be repaired for low-speed impact damage scenarios, various core plugs are inserted with composite laminates using adhesive bonded joints. It is of design interest to know the failure pattern and peak loads for any debonds (manufacturing defect), which are influenced by the core topologies, under static and fatigue loading conditions.
Shipsha et al. [7] studied fatigue crack growth in two different foam cores and derived Paris curves to understand the crack growth rates when subjected to cyclic opening loads. They found the fatigue crack growths for the low-density foam cores were significantly larger. Kyle et al. [8], in their work, explored temperature-dependent quasistatic interfacial toughness and fatigue crack growth through experimental and analytical approaches in a sandwich beam comprised of a Nomex honeycomb core with graphite/epoxy face sheets (skins). They found that the cold temperature increased toughness and reduced fatigue crack growth rates relative to room temperature, with high temperature having a relatively low impact. They also added that the mechanisms of failure and resulting data suggest that core strength is the dominant factor. There are many studies on the static and dynamic Mode-1 interface interfacial toughness evaluation between foam cores with polymer matrix composite face sheets [9,10,11,12], but there is a lack of studies on the dynamic between Al alloy core topologies and composite. The Mode-I dominated failure mechanism is characterized using various test methods [13,14,15,16,17,18,19,20] in which the pre-crack usually runs parallel to the core/face sheet interface. Among these various test methods, the single cantilever beam (SCB) test is considered to be one of the most reliable and standardized methods [21]. In this method, the sandwich composite is attached to a non-rotating rigid base fixture, while a tensile load is applied to the top face sheet with a pre-crack, as illustrated in Figure 1.
Earlier works in the SCB test samples involved large scatter in the values of debond toughness due to a combination of failure mechanisms [22]. However, several studies that followed helped in streamlining the procedure and iterated the process for better accuracy [13,16,19,21]. The SCB specimen geometry, as prescribed by Ratcliffe and Reeder [22], is followed in this work.

2. Materials and Methods

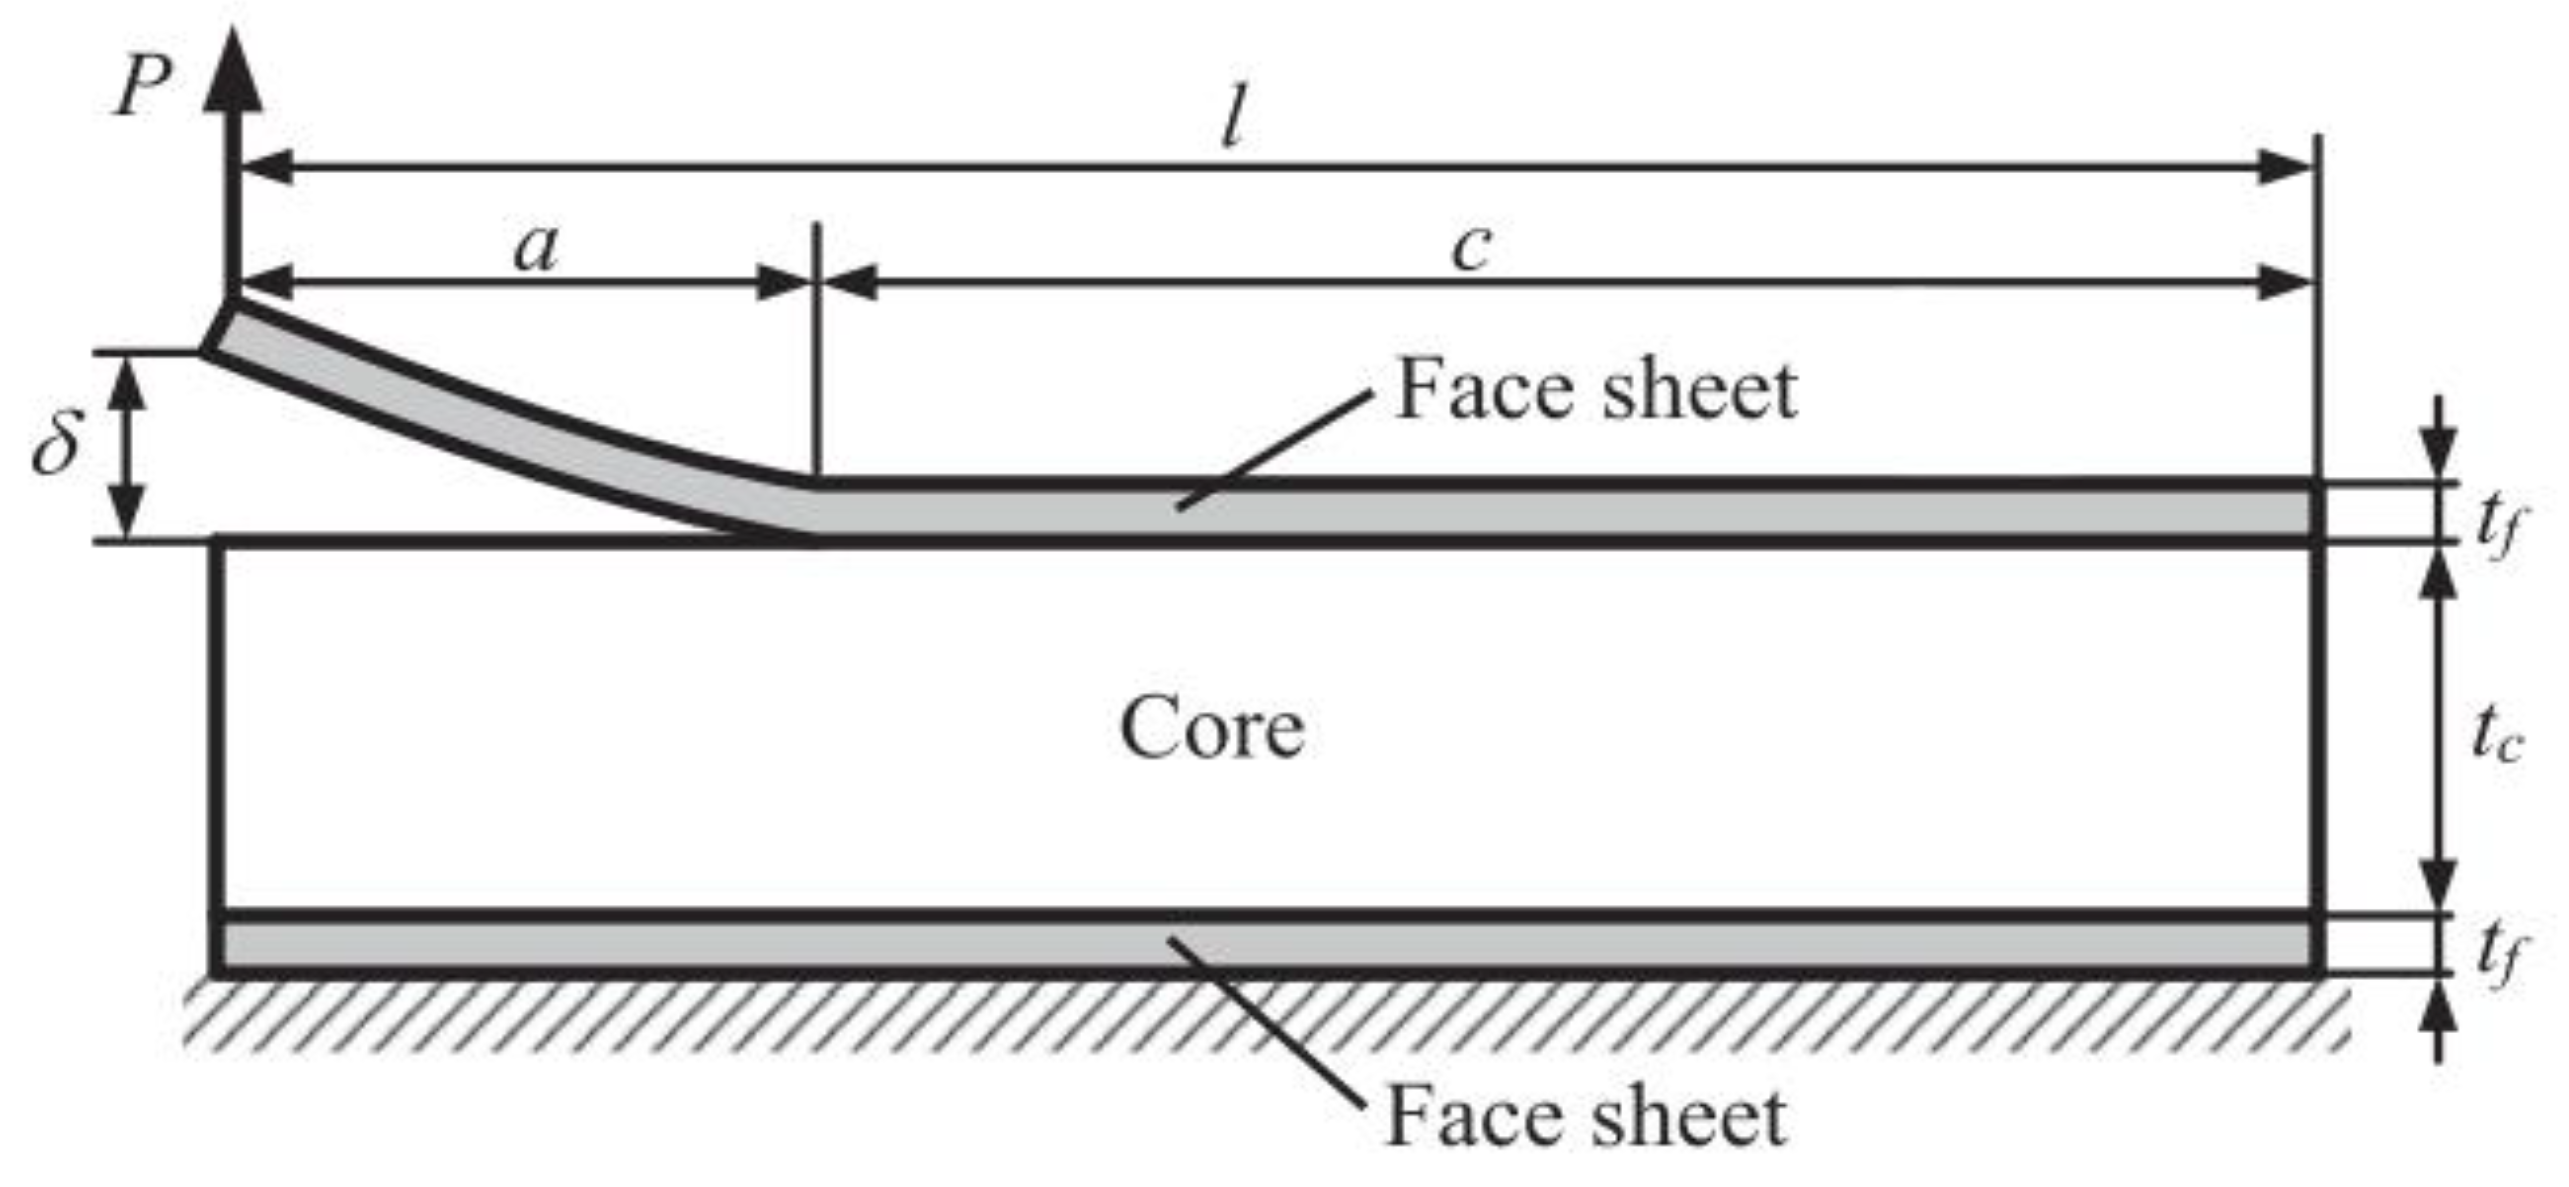
2.1. Interfacial Fracture Toughness Calculation

The main objective of the SCB test is to find the static strain energy release rate due to the peeling of the face sheet from the core of the sandwich structure in an opening mode (Mode-I) according to the ASTM standard D5528−13 [23]. The base fixture should be rigid to sustain peak loads and should not impose any rotation during the test. The support fixture was designed in such a way that the adjustable top clamps secure the specimen to the fixed rigid base, which is fastened to the Universal Testing Machine pedestal (UTM). The specimen position can also be adjusted using the wide slots created on the top clamps. When the specimen is loaded, the sandwich specimen is constrained to translate in the longitudinal direction to ensure the applied load is always normal to the specimen. A schematic 3D representation of the fixture is illustrated in Figure 2. A similar loading fixture was used by Ratcliffe and Reeder [22] with loading rods instead of translating base. Both the methods are said to yield similar results, but, due to its simplicity, translating the base fixture is used in this study. The applied force, P, and respective displacement, δ, are recorded using a data logger at several points of interfacial crack growth to calculate the corresponding compliance, C = P δ .
Modified beam theory (MBT) [24] was employed to compute the interfacial toughness, G I C , of the sandwich specimens, based on the Griffith energy balance as [12]:
G C = P C 2 2 b d C d a
where b is the width of the specimen, C is the compliance of the bonded face sheet, a is the debond length, and P c is the force corresponding to the debond growth. Like monolithic laminates, the modified beam theory for sandwich structures uses an analytical compliance solution of the SCB specimen, which is based on beam-on-elastic foundation model and is given by [20]:
C SCB MBT = δ P = 4 λ k [ λ 3 a 3 3 + λ 2 a 2 F 1 + λ a F 2 + 3 a k 10 λ G x z , f t f b + F 3 2 ]
where the parameters G x z , f , t f , and b are the face sheet transverse shear modulus, face sheet thickness, and SCB specimen width, respectively. The compliance coefficients, F 1 , F 2 , and F 3 , are hyperbolic functions of λ and Lb, which decrease to unity if the intact SCB specimen length, L b , is kept higher than a minimum value, L b , min . The cantilever beam consists of two sections: the bonded and the unbonded section. The intact SCB specimen length, L b , corresponds to the bonded section. The parameter k is the elastic foundation modulus and is expressed in terms of core thickness, t c , and compressive modulus, E c , as
k = E c b t c
The parameter λ is the ratio of the stiffness of elastic foundation to the bending stiffness of the beam and is given by
λ = [ 3 E c t c t f 3 E f ] 1 4
where E f is the flexural modulus of the face sheet.
The compliance value given by Equation (2) can be simplified by applying limitations to the initial debond length, a 0 , and SCB specimen length, L b . When the initial debond length, a 0 , is kept above a minimum value to dominate the bending deformation of face sheet, and when the SCB specimen length, L b , is greater than 2.7 λ , the functions F 1 , F 2 , and F 3 reduce to unity and the compliance solution reduces to the following [17,18]:
C SCB MBT m 1 ( a + Δ ) 3
These limiting values are calculated in Section 2.2. In this study, the SCB test specimens are fabricated to satisfy the above limits; thus, the SCB specimen compliance solution was assumed to adopt the form of Equation (5).
The parameters m 1 and Δ are obtained from the relationship between C 1 3 and debond length. By substituting compliance Equation (5) into Equation (1) for the derivative, d C d a , the apparent interfacial toughness is given by:
G C MBT = 3 P c δ 2 b ( a + Δ )
Paris law [25] is used to analyze the crack propagation in steady-state as
d a d N = A   G I m a x p
where d a d N is the fatigue crack growth rate; A and p are material parameters.
During the fatigue test, ASTM standard D6115 [26] recommends using displacement control for both monolithic and sandwich structures. To find the displacement limit, the following expression is used:
δ m a x 2 [ δ cr 2 ] av = G I m a x G I C
where δ m a x is the maximum displacement for the fatigue test, while δ cr av is the average critical displacement from the quasi-static test and G I m a x G I C is the ratio between GI for fatigue test against GIC from the quasi-static test. Numerous researchers [27,28,29] have contributed to the characterization of delamination in Region II. The fatigue fracture characterization of laminated fiber composites is closely related to the matrix properties, matrix toughness, and the strength of the fiber/matrix interface. The effect of matrix material on delamination growth was studied by Hojo [29]. The stress ratio also depends on the mode ratio [29] and delamination growth law [30].

2.2. Sizing of SCB Specimen

To use the compliance solution in Section 2.1 Equation (5), some limitations were imposed on the minimum specimen length, L min , and initial debond length, a 0 , which are described in the following steps. The main dimensions that influence the SCB test, like the minimum face sheet thickness of the debonded face,   t f , min , the minimum specimen length,   L min , and the final debond length, a m a x , are obtained from the analysis proposed by Ratcliffe et al. [22] and as described below for completeness. Since four different types of cores are used in this experimental work, the strongest core, i.e., high-density honeycomb core, properties are used to explain the sample calculation of the procedure in the following steps:
Step 1: Values of L hinge ,   t c ,   E c ,   G xz , f ,   E f ,   G c ,   a prop ,   σ c are selected and the initial value of t f is assumed to begin the iteration.
L hinge is the length of the hinge. G xz , f   a n d   E f are the shear and flexural moduli of the face sheet, σ c is the bending stress of the core, E c is the through thickness modulus, and G c is face sheet/core peel debond toughness. These properties, as listed in Table 1, are taken from either the literature or manufacturer datasheets [22,31,32].
Step 2: Minimum specimen width, b , is determined:
Limitation: b > 25 mm or six honeycomb cell size
Step 3: Compute minimum intact specimen length, L b , min , which, in turn, will be used to find the final length of the specimen:
L b , min 2 . 7 [ t c t f 3 E f 3 E c ] 1 4 = 14 . 14   mm
Step 4: Compute initial debond length, a 0 , to ensure dominant deformation mode acting on the face sheet is bending, a min bending :
a 0 a min bending 30 E f t f 2 G xz , f 0 . 59 L b , min 12.71   mm
Step 5: Compute initial debond length to simplify the compliance solution, a min compliance :
a 0 a min compliance = L b , min = 14 . 14   mm
Step 6: Select a 0 (the selected value should be larger than a min bending and a min compliance ):
a 0 = a min compliance = 14 . 14   mm
Step 7: Compute maximum debond length, a m a x , the assumed a prop = 50   mm :
a   m a x a 0 + a prop = 64 . 14   mm
Step 8: Compute minimum face sheet thickness to ensure assumption of small displacements is valid, t f small   disp :
t f t f small   disp = [ a m a x ( 3 a m a x 2 E f 200 G c ) 1 4 ( t c E f 3 E c ) 1 4 ] 4 3   1 . 25   mm
Step 9: Compute minimum face sheet thickness to prevent face sheet failure, t f strength :
t f t f strength   6 E f G c a m a x 2 σ c 2 [ a m a x + ( t c ( t f small   disp ) 3 E f 3 E c ) 1 4 ] 2 = 0 . 092   mm
Step 10: Select t f , min (the selected value should be larger than t f small   disp and t f strength ):
t f , min = t f small   disp = 1 . 25   mm
Step 11: Compute minimum specimen length, L min , using the values determined before:
L min L hinge + a m a x + L b , min   = 101.28   mm
All the equations used were pre-determined and implemented in many previous studies, which have given promising results. Since the stiffness of the Al alloy foam Alporas® high-density core is larger than the other cores used, the calculated t f , min is used as a benchmark value and kept the same for all other core materials.

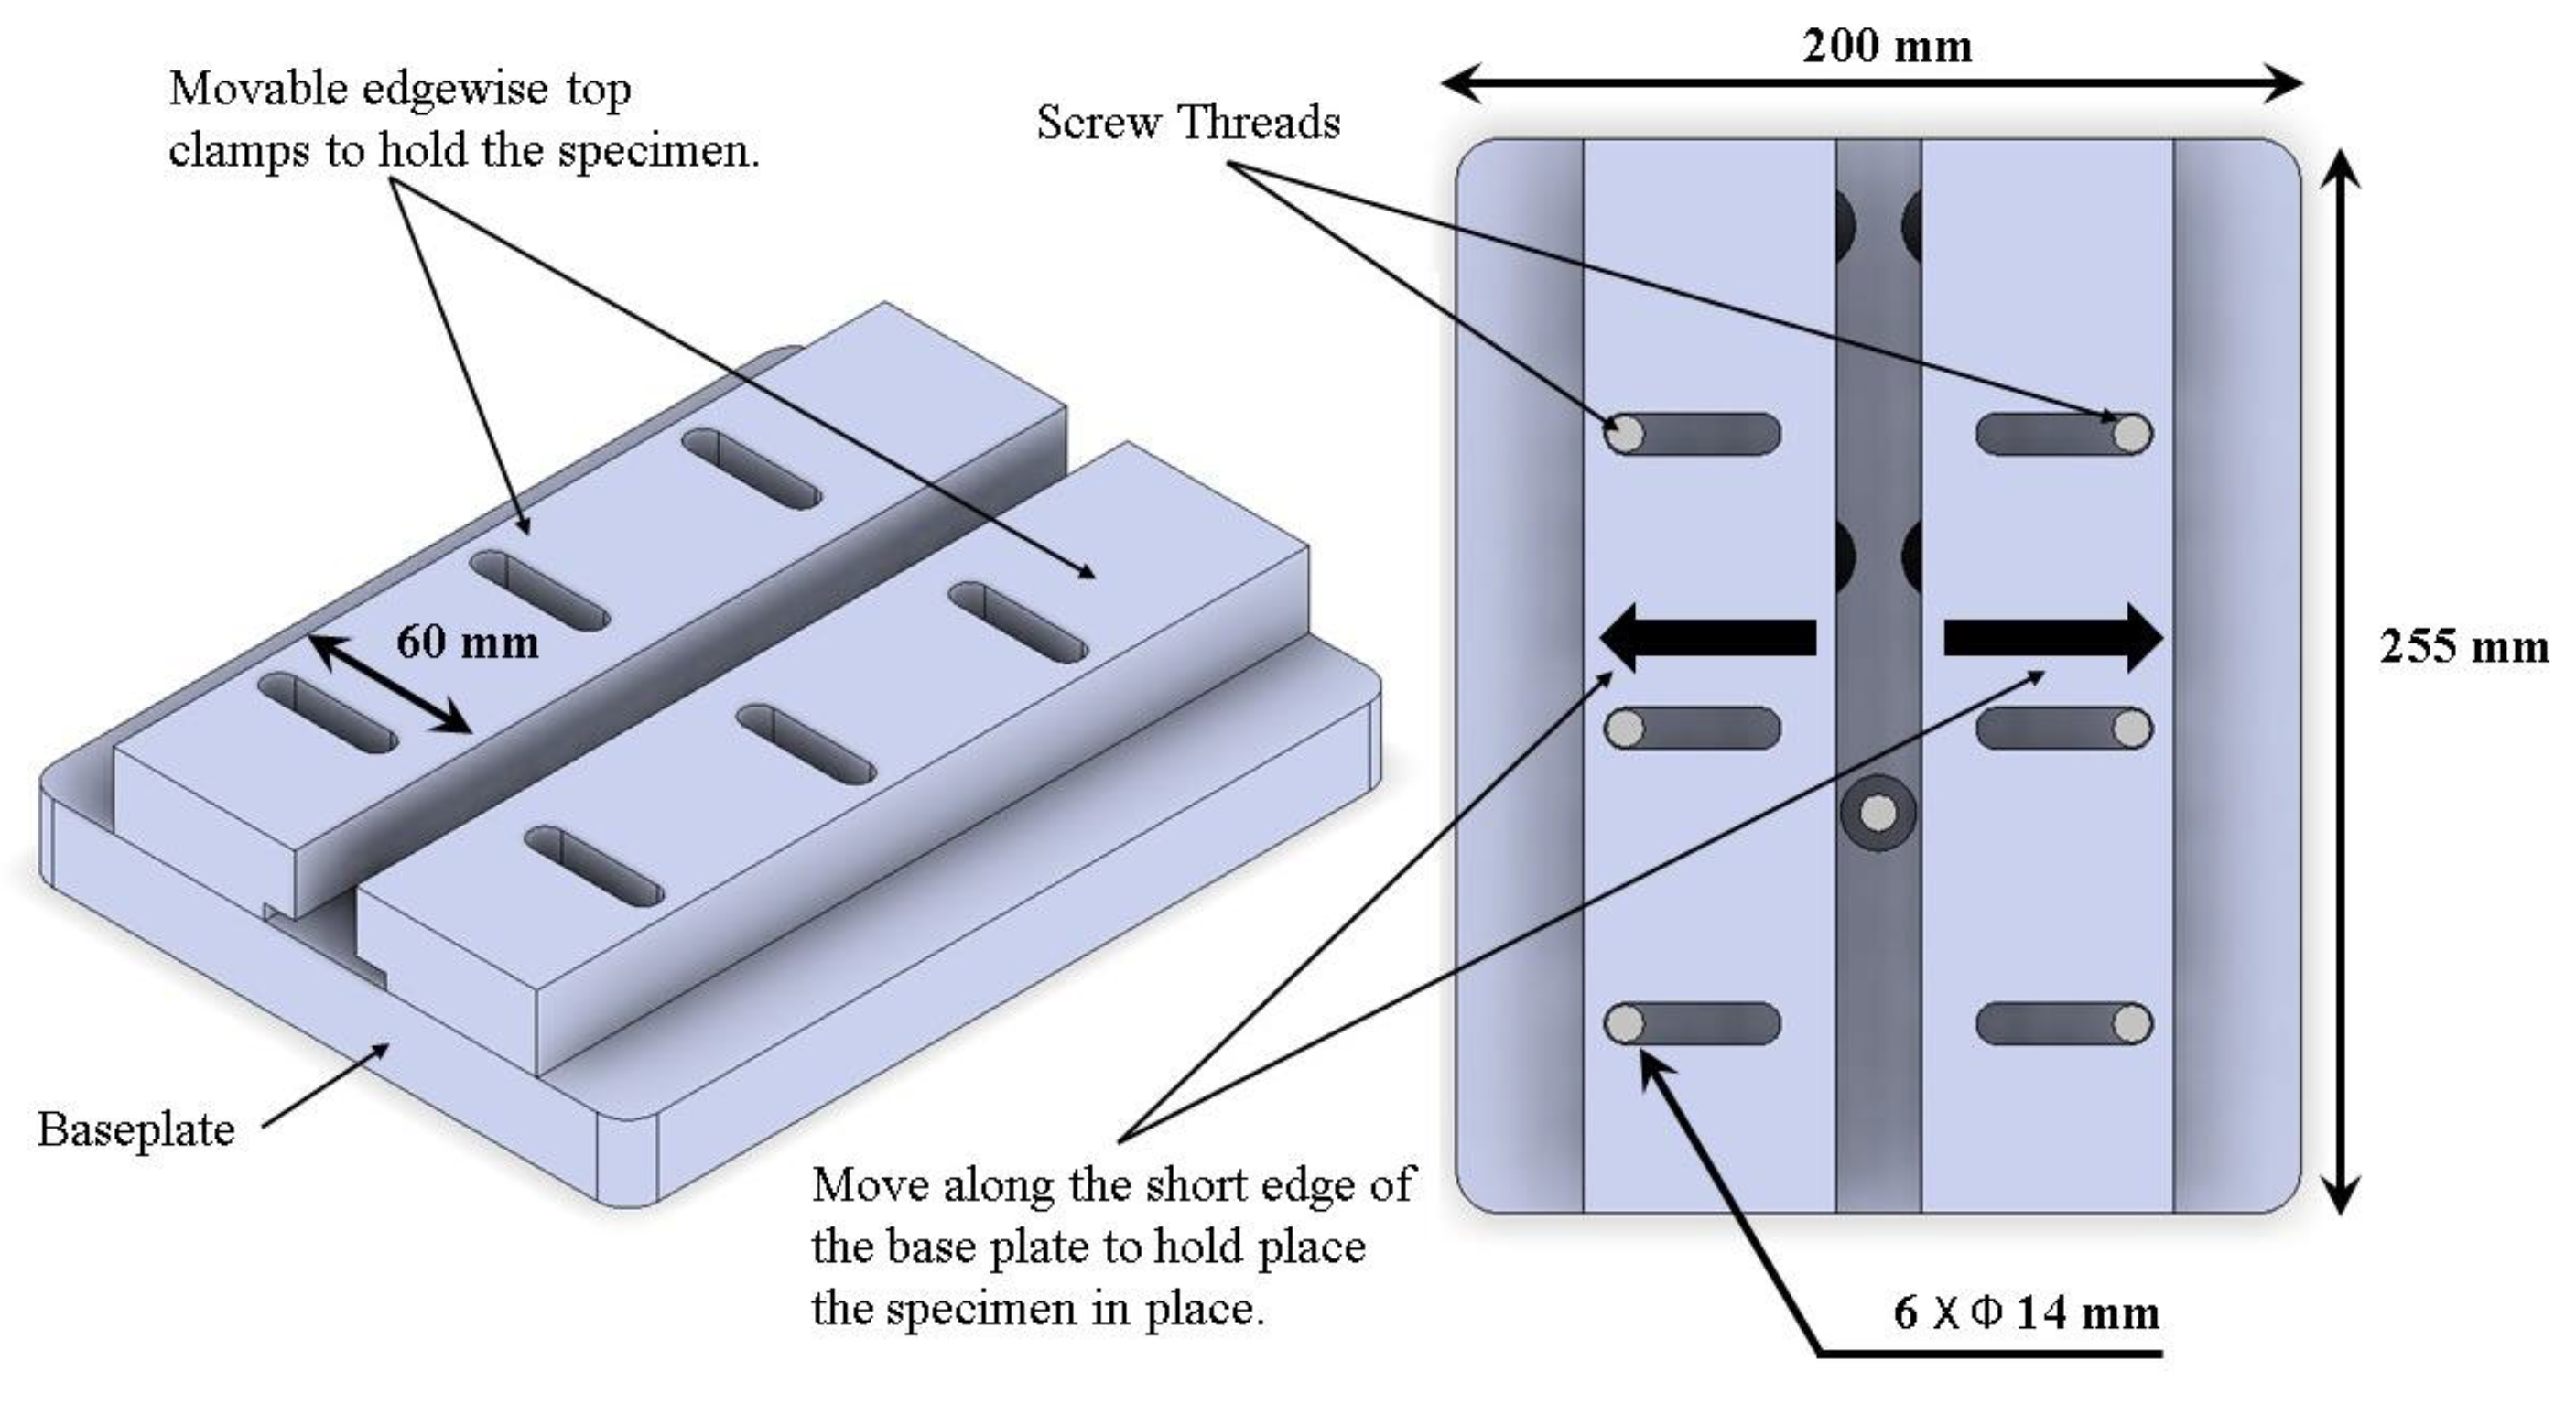
2.3. Specimen Design and Fabrication

Four sets of specimens with different material configurations were considered for testing under both static and fatigue loading. The first two sets of specimens were fabricated using GFRP laminates (unidirectional (UD) G17500/6509/33% prepreg with a 0.15 mm nominal ply thickness) as face sheet and aluminum honeycomb core provided by Hexcel® corporation with two different densities. Modified epoxy based structural film adhesive, AF3109−2K, procured from 3M® was used to bond the face sheet with the core of the sandwich structure. The remaining two sets of specimens consist of Al alloy foams (Alporas® or Cymat®) as cores with the same GFRP face sheet. A schematic representation of different material configurations used in this study is listed in Table 2.
Face sheet laminates were fabricated using 10 and 40-plies of unidirectional GFRP prepregs (10-plies for the top and 40-plies for the bottom face sheet, respectively) of 300   mm length by 250   mm width. The laminates were cured using an autoclave for 125 min at a temperature of 150 °C and at the rate of 5 °C/min under a vacuum of 76 kPa and pressure of 340 kPa.
Prior to secondary bonding of the adherends, the bonding area of the adherends was treated with white alumina particles of 220 grit size at 0.4 MPa pressure followed by degreasing using lint-free cloth dabbed in acetone. The mean contact angle in the bonding area measured using de-ionized water was found to decrease from 78° to 43° after the surface treatment. The average value of surface roughness, Ra, was also found to increase from 0.8 μm to 3.7 μm, providing improved mechanical anchorage from the surface treatment. Foam cores were also degreased with acetone and dried in an oven to ensure that there would not be any impurities in the face sheet core interface.
The second stage of the sandwich fabrication was to bond the bottom face sheets onto different cores of 220   mm length by 50   mm width. Two layers of AF3109−2K adhesives, with the same dimensions as the cores, were stacked together and placed between the bottom treated face sheets and each core. A 50 mm length and 50 mm wide polytetrafluoroethylene (PTFE) film was placed between the core and film adhesive along the top side of the sandwich plate. This served to create the artificial debond for the SCB test. The resulting sandwich was vacuum bagged and secondary bonded at a dwell temperature of 125 °C over a period of 60 min, where the heating and cooling rate was maintained at 3 °C/min under a pressure of 520 kPa and 140 kPa vacuum.
Geometrical dimensions of all the sandwich specimens, according to the specimen sizing presented in Section 2.2, are illustrated in Figure 3. Two different densities of aluminum honeycomb cores and closed cell foams are used as cores (see Figure 4). The material properties of face sheet and core materials are listed in Table 3, respectively.
Three specimens in each (SCB1-L, SCB1-H, SCB2-L, and SCB2-H) material configuration were manufactured and tested under static loading. Following, two specimens of SCB1-L, SCB1-H, SCB2-L, and SCB2-H were tested under fatigue loading. Microscopic images of the core and face sheet interface of all the material configurations are presented in Figure 5, Figure 6, Figure 7 and Figure 8.

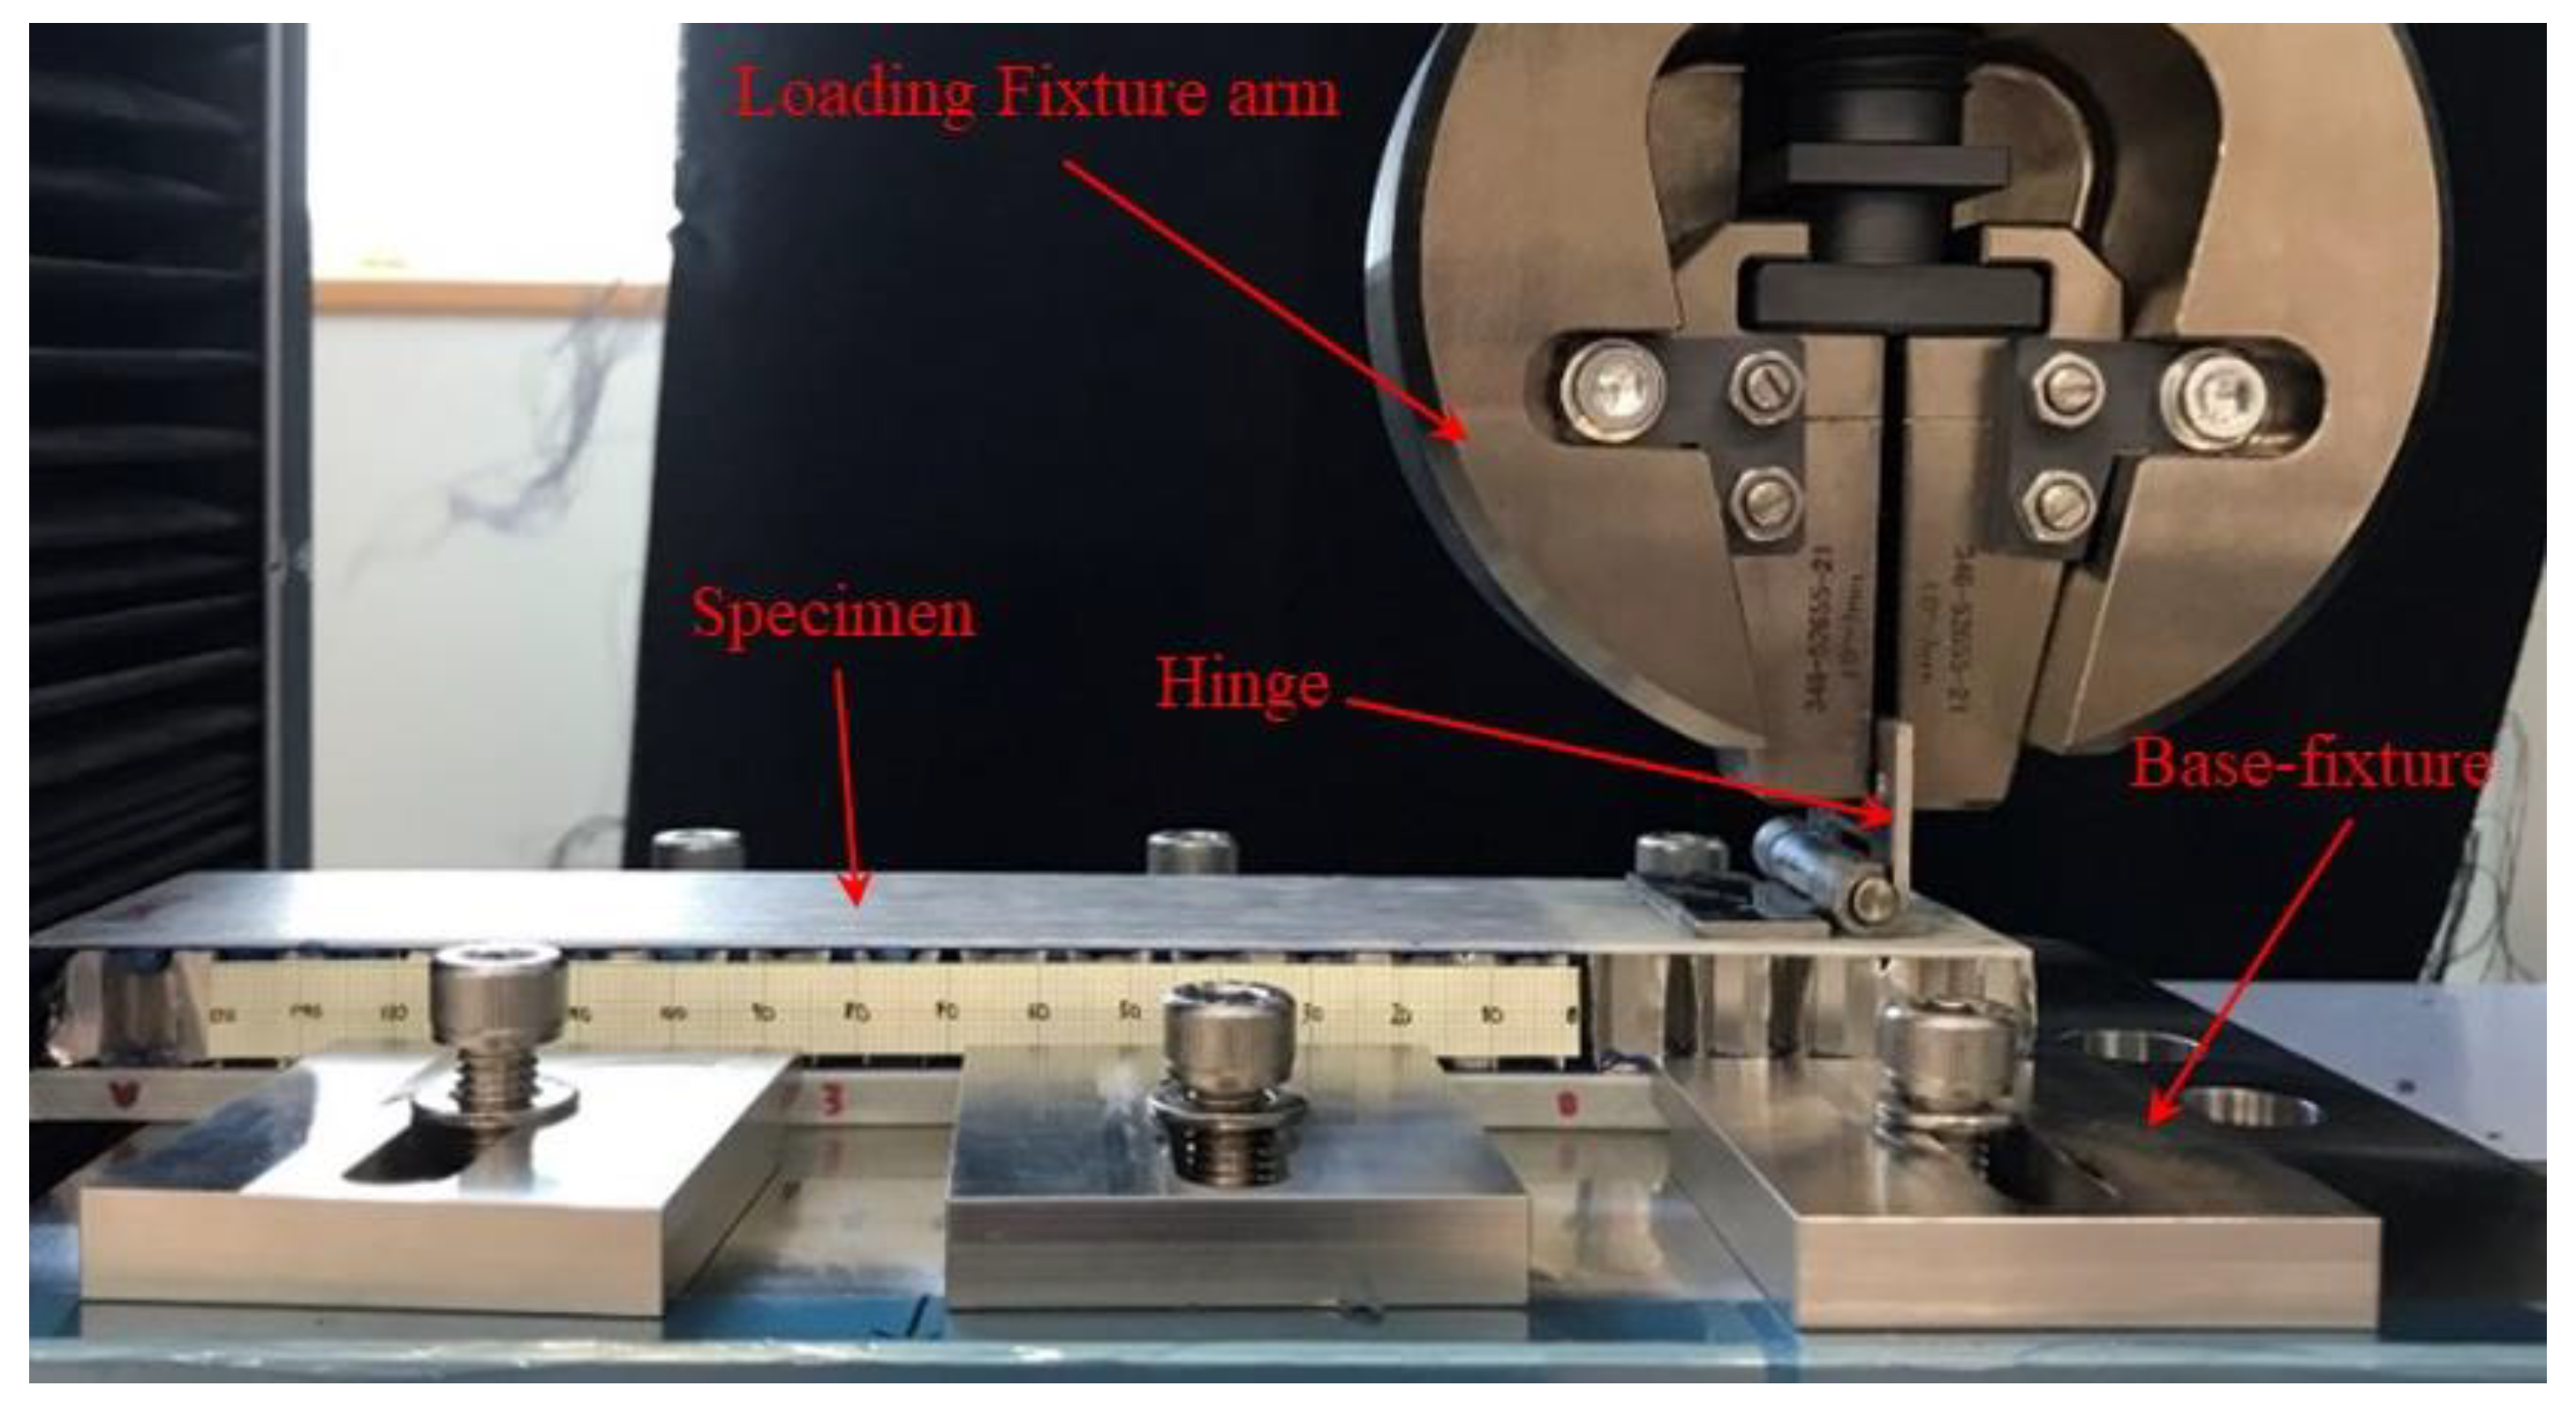
2.4. Test Methodology

All static single cantilever beam (SCB) tests were carried out using a 10 kN Shimadzu Universal Tensile Machine (UTM). A baseplate support fixture was attached to the lower part of the machine to secure the specimen using clamps. As shown in Figure 9, the bottom part of the SCB sandwich specimen was then positioned on this rigid baseplate, while the top face sheet of the specimen with the initial crack was clamped to the UTM using a door hinge.
A thin layer of white paint was coated on the crack path of the specimen to visually observe the propagation of the crack. The initial crack front was marked on the edge of the specimens at which a graph sheet was pasted for measuring crack growth. Twelve SCB specimens were then loaded under displacement control at a rate of 1.0 mm per minute in the vertical direction. A digital camera equipped with macroscopic lens was placed to record the crack propagation. Figure 10 shows live crack monitoring instrumentation and UTM connected with a DAQ constantly recorded the values of applied load, P, and the corresponding displacement, δ. Once the pre-crack in the adhesive layer reached a length of 60 mm, test was stopped, and the specimen was removed.
Steady-state crack-growth is characterized using Paris law: the threshold interfacial toughness value at which the crack starts to propagate can be retrieved. The fatigue test was conducted under displacement control based on the maximum displacement values from the quasi-static test calculated at a different percentage of G I m a x G I C . Piano hinges were used to mount the specimen to the loading arm of the 1 kN load cell MTS Landmark testing machine. Two specimens each of SCB1-L, SCB1-H, SCB2-L, and SCB2-H were tested. Crack propagation along the adhesive layer was monitored using an HD camera, and the displacement, load, and time values were collected using a data-logger. The stiffness ratio, λ , is a material property that changes with different material configurations, and its value for the tested sandwich systems is listed in Table 4.

3. Results and Discussions

3.1. Effects of Different Core Geometry on the Interfacial Toughness of Sandwich Structures under Static Loading

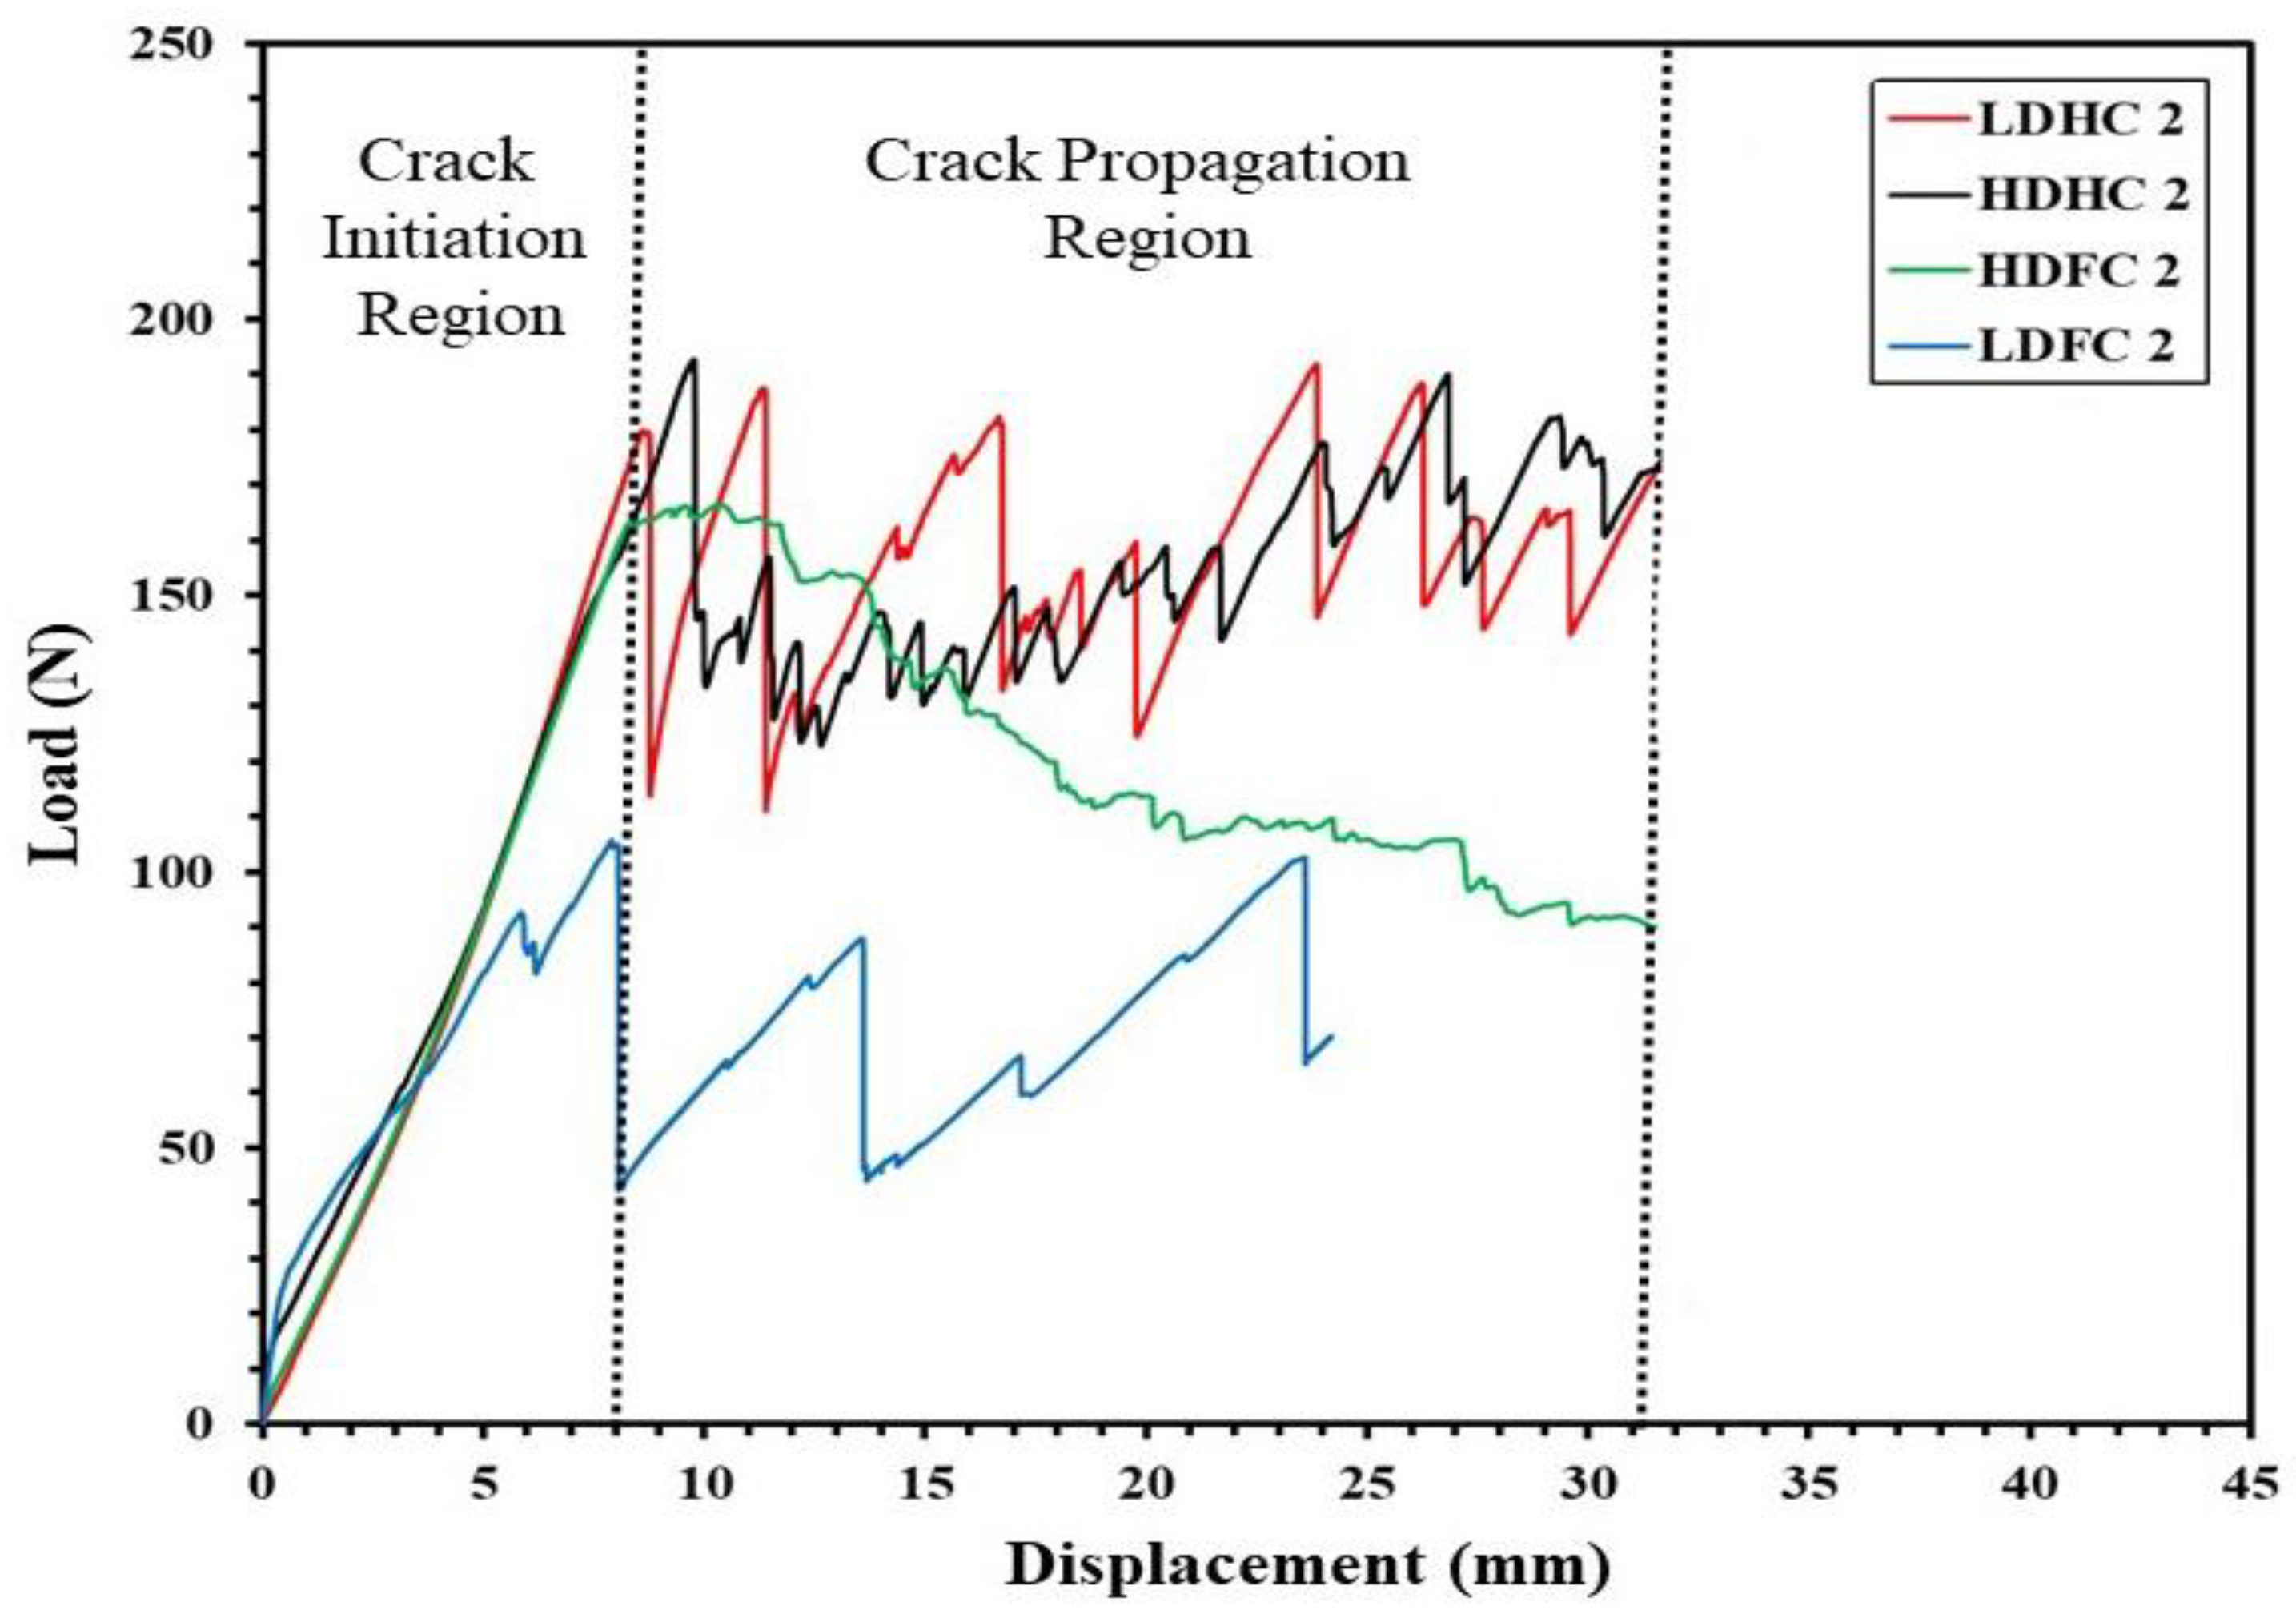
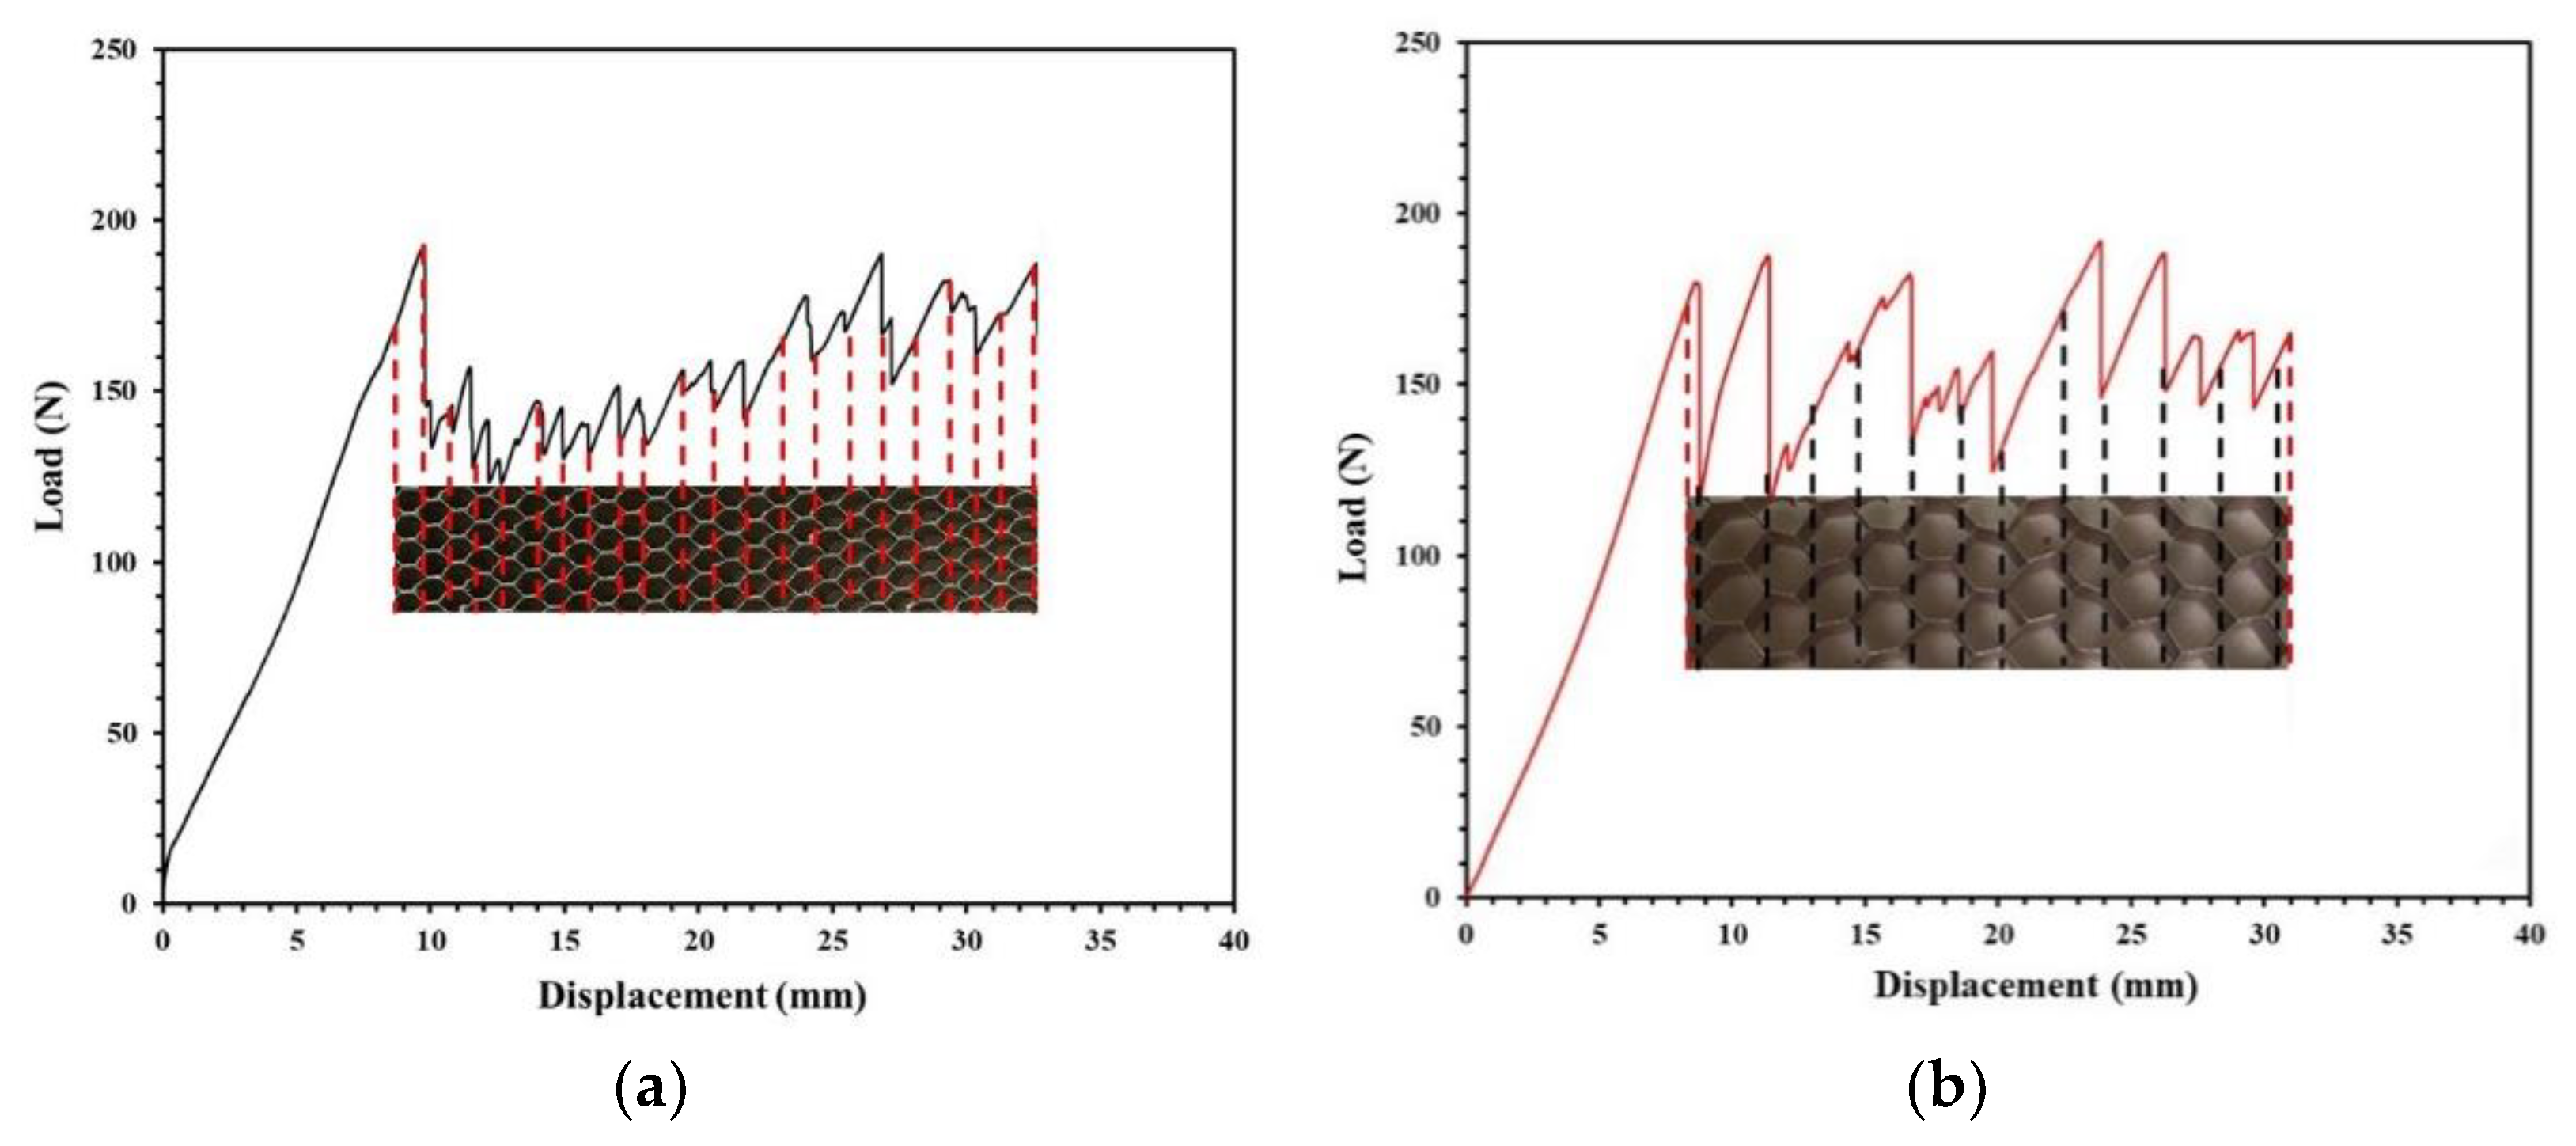
3.1.1. Load versus Displacement Response

As mentioned earlier, a total of three specimens in each (SCB1-L, SCB1-H, SCB2-L, and SCB2-H) material configuration were tested under static loading. The nature of the crack propagation and scatter of all the tested specimens in each category were consistent. The variation of load with displacement is depicted in Figure 11 for all the four tested sandwich configurations.
In the load-displacement plot, all the sandwich specimen systems exhibited an initial sharp increase in load followed by a sharp decrease in load as cross-head displacement increased. Initial peak load corresponds to the critical value for the crack to initiate (GIC). The subsequent peak on the load-displacement curve corresponds to the load required for the crack to propagate. For all the sandwich specimen systems, the crack starts to propagate at 8 to 10 mm of crosshead displacement. For the honeycomb cores, since the cores are made up of uniformly distributed cell walls and due to the agglomeration of adhesives and adhesive fillets, the crack requires higher strain energy to propagate at these locations. The crack propagation behavior observed in the honeycombs was similar to slip-stick phenomena, which are determined by the cell size. This type of crack growth was seen in both the HDHC and LDHC sandwich configurations. The critical peak load for HDHC sandwich structures is 192.42 N at 9.73 mm cross-head displacement, and the critical peak load for LDHC sandwich structures is 180.44 N at 9.12 mm. The percentage reduction in load between the two honeycomb configurations is 6.2%.
On the other hand, the load-displacement curves of the HDFC exhibited an initial sharp increase followed by a gradual decrease with displacement. This gradual decrease was due to the homogenous nature of the foam core with closely clustered pores. This smooth gradual decrease is very much evident in the high-density foam core but is different for the LDFC. In LDFC, there was an arbitrary increase and decrease in load, which was due to the non-uniform and chaotic presence of large cells on the surface of the foam core, as shown in Figure 4.
The critical peak load for the HDFC sandwich structures is 166.33 N at 9.83 mm cross-head displacement, and the critical peak load for LDFC sandwich structures is 102.71 N at 8.05 mm cross-head displacement. The percentage reduction in load between the two-foam core configurations is 38.32%. Since the characteristics of load versus displacement plot are directly related to the interface of the cracked path, a side-by-side comparison of both is performed to have a better understanding of the different sandwich configurations. The biggest difference between the load-displacement curves for both honeycomb cores is the number of peaks and troughs. Comparing both load-displacement curves together, the curve for the high-density honeycomb core has more peaks and troughs than the high-density honeycomb core sandwich structures. The difference in the number of peaks was due to the formation of adhesive fillets near the cell walls because of the cells and the free flow characteristics of the adhesive during curing. This can be seen in Figure 12a,b, where the distance between each peak corresponds to the length of the cell size. Each peak corresponds to the resistance provided by the cell wall of the honeycomb structure, and each trough was due to the cell.
For the foam cores, the load-displacement response is determined by the foam density analogous to the double cantilever beam (DCB) test, where the load decreases with respect to the change in stiffness of the specimen. The load-displacement curve for the low-density foam core is more sporadic due to the core topography. As the core has a large cell size on it, more adhesives were used to fill up these dents for the core to bond properly to the top face sheet.

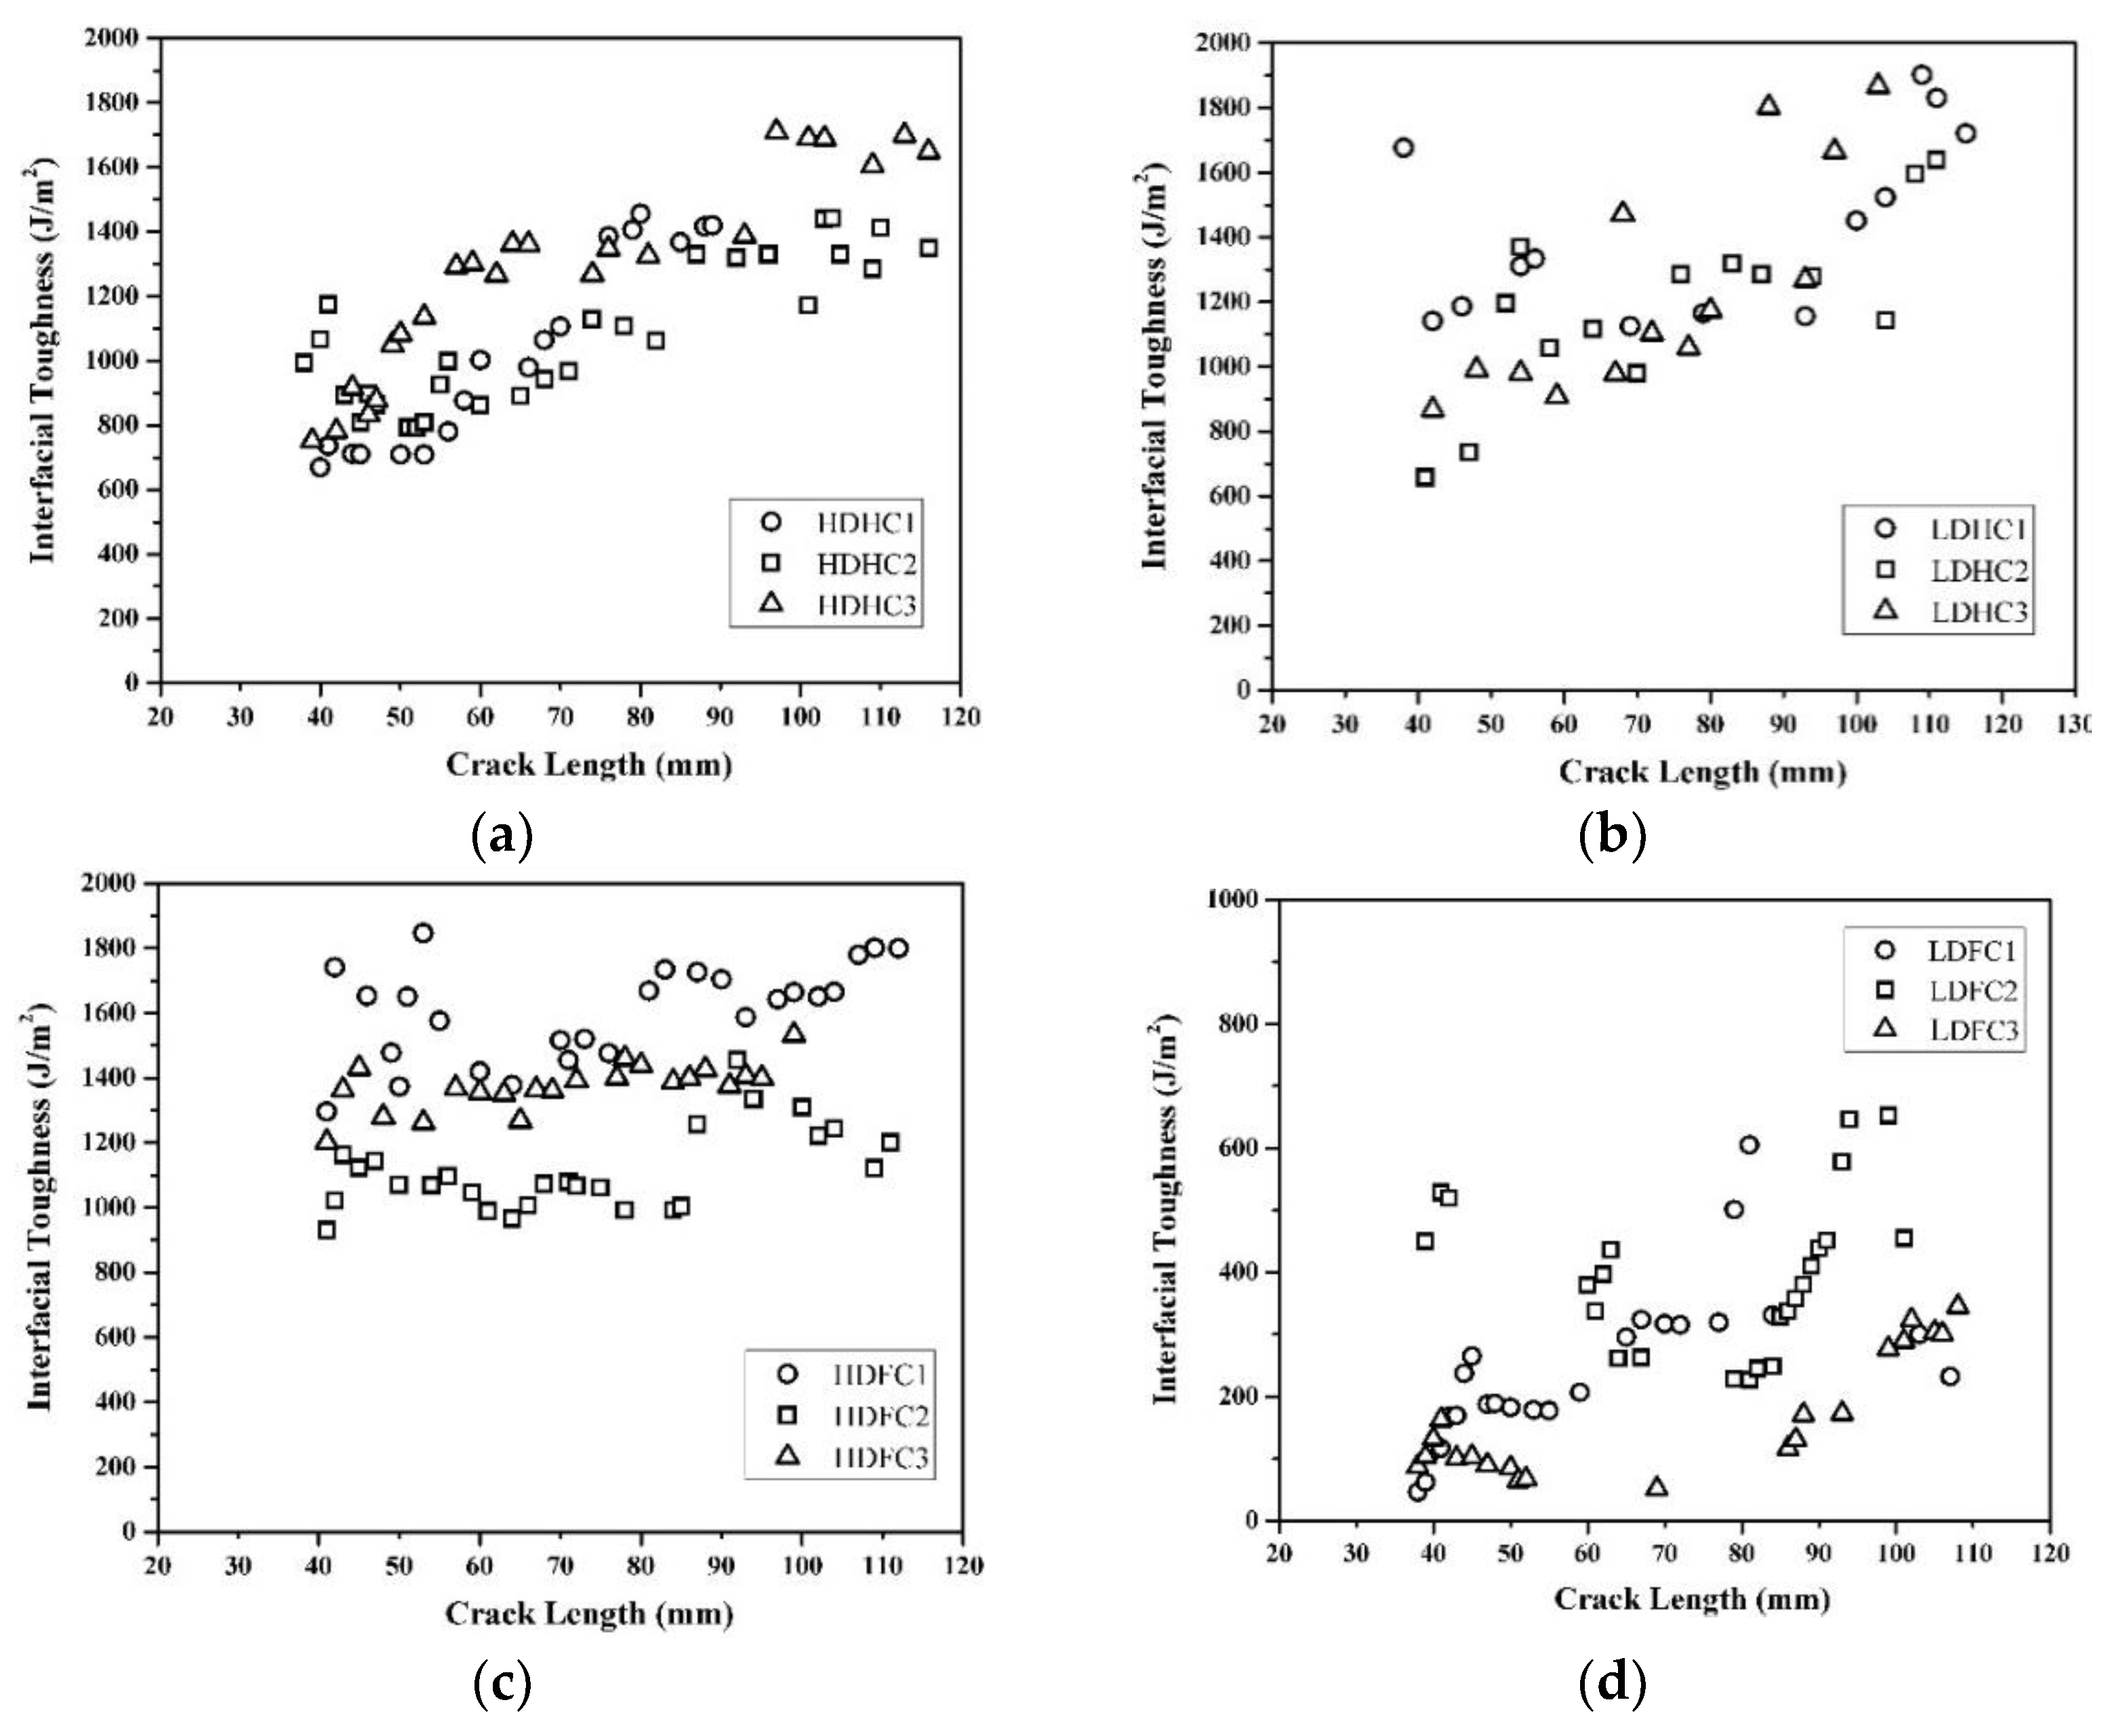
3.1.2. Interfacial Fracture Toughness

The interlaminar fracture toughness of the SCB specimens was calculated using the Equation (8). The debond resistance curve ( G I C vs. a) is plotted for all four sandwich systems with three specimens each (Figure 13).
Figure 14 compares the debond resistance of all four sandwich structure configurations. It can be deduced from the figure that the HDHC, HDFC, and LDHC sandwich structures lie in a similar range of 800 to 1200 J/m2. The LDFC specimens have the lowest interfacial toughness values due to the presence of large cell sizes on the surface of the core. The average and standard deviation of the interfacial toughness values for all the SCB sandwich specimens are listed in Table 5.
The interfacial toughness of the four different sandwich structures is compared with the tests conducted by Adams et al. [33] in Figure 15: the interfacial toughness values of the honeycomb sandwich structures lie in the same range as the values presented by Adams. They conducted tests with carbon fiber reinforced plastic/Nomex honeycomb core sandwich structures. The honeycomb cell size significantly affects the scatter of the calculated apparent interfacial toughness. An increase in cell size or a decrease in core density will lead to a more unstable load-displacement response. The interfacial toughness values increased from a 3.2 mm honeycomb cell size to a 9.5 mm honeycomb cell size.
It can be noted from Table 5 that the HDFC samples have the highest average interfacial toughness value compared to the other samples because of the crack kinking into the core of the specimen, which can be seen in Figure 16. The fractured surfaces of the sandwich structures were color inverted for better visualization of intricate details. The fracture surfaces of the face sheets of both honeycomb cores are in yellow, which means they contained adhesive resin material only. On the other hand, the fracture surfaces of the face sheets of both foam cores are yellow and grey, which means they contained both the adhesive resin material and the core. This means that the crack propagated into the foam cores, resulting in the top layer of the foam core being sheared off during the debonding process. Thus, the interfacial toughness of the HDFC samples is larger. It also shows that the tensile strength of the foam cores is lower in the thickness direction compared to the tensile strength of the honeycomb cores. The interfacial toughness of the LDFC is very low compared to the other samples because the top layer of the foam core was supported by a very thin layer of metal with large voids, which makes it easier to peel. This is evident in Figure 17, which shows a detailed analysis of the fractured surface of the sandwich specimens.
Complete and partial cohesive failure was predominantly seen in the HDHC and LDHC honeycomb samples, respectively, with a small amount of fiber tear failure in the LDHC samples.
Both the honeycomb cores exhibited similar failure modes during the static tests. In LDHC, some traces of interfacial face sheet ply failure were witnessed along with partial-cohesive and cohesive failure, while the HDHC core exhibited only cohesive and partial-cohesive failure, whereas the foam cores predominantly exhibited failure modes in the bulk of core with a smaller proportion of cohesive failure, demonstrating that the bulk mechanical properties of the core are inferior compared to the threshold loading that is required for the crack to propagate in the core face sheet interface.

3.2. Mode-I Fatigue Interfacial Toughness Testing

The objective of this investigation was to characterize the Mode-I interfacial fatigue interfacial toughness for the different material configurations analyzed previously. The specimen geometries for fatigue tests are also like those of static ones. Based on the quasi-static SCB test, the average GIC value was considered for the Mode-I fatigue test of sandwich structures. By using Equation (8) given in Section 2.1, the maximum displacement (δmax) needed for the test was calculated. The δ max values need for each specimen type for different G I m a x G I C percentages were calculated, and, from those, 75% of the maximum interfacial toughness was used for the fatigue test. The δmax values calculated for the different sandwich configurations are tabulated in Table 6. The test was conducted under the loading ratio (R -loading ratio between the maximum displacement against minimum displacement during one cycle of fatigue test) of 0.1 and frequency of 3 Hz. The MTS Landmark was used to test the specimens, and a high-definition camera was used to monitor the crack.

4. Results and Discussions

From the fatigue test, the change in compliance over a cycle was plotted against GImax to generate the Paris law for the steady-state region II using power-law curve fitting tools on Microsoft Excel. The Paris law response for the different material configurations is plotted in Figure 18. The average critical interfacial toughness (GIC) values of each specimen type are also plotted to define Region III (Gmax), at which the crack attains an asymptotic G value.
The power-law coefficient m for the four different sandwich systems is tabulated in Table 7. As we can infer from Table 7, the LDFC samples have the highest Paris law power exponent, which suggests that the rate of crack propagation is very fast compared to the other samples. This is mainly because of the core topography present on the face sheet and core interface. The LDFC samples have the highest crack propagation rate, followed by HDHC and HDFC, respectively. Since the crack was kinked into the core of the HDFC samples, a reduction in crack propagation was seen. Due to the large adhesive fillets in the LDHC samples, which can be seen in Figure 6, an increase in the interfacial toughness values was witnessed, manifesting a lower rate of crack propagation. Figure 19 shows the steady-state crack-growth Paris law response of all the specimens tested.

5. Conclusions

The interfacial delamination propagation of sandwich structures with different material configurations was tested using a single cantilever beam (SCB) test. The first set of specimens was fabricated using GFRP laminates as face sheets and aluminum honeycomb cores of two different densities. The second set of specimens contains a similar material configuration as set one, with GFRP laminates as face sheets with closed-cell aluminum foam cores. In both cases, AF3109−2K film adhesive was used to bond the face sheet and core. The LDHC (low-density honeycomb) samples showed rich adhesive fillets compared to other material configurations. The total bond area of the LDFC (low-density foam core) sample was much less compared to other samples due to the presence of large cell sizes. The critical peak loads for HDHC, LDHC, HDFC, and LDFC were at 192.42 N, 180.447 N, 166.33 N, and 102.715 N, respectively. The interlaminar interfacial toughness of the HDHC, HDFC, and LDFC samples was in a similar range of 800 to 1200 J/m2, whereas the interlaminar interfacial toughness of the LDFC samples was in a range of 70 to 200 J/m2. The interfacial toughness of LDFC is very low compared to other the samples because the top layer of the foam core was supported by a very thin layer of metal with large voids, which makes it easier to peel. The Mode-I interlaminar fatigue fracture toughness was also studied for the same material configurations. The Paris law response of the samples reveals that the rate of crack propagation of the LDFC samples was very fast compared to the other samples. Due to the strong adhesive fillets in the LDHC samples, there was a decreased rate of crack propagation, which makes it superior among the other sandwich structure systems.

Author Contributions

Conceptualization, V.S.S. and S.I.; methodology, V.S.S.; software, V.S.; validation, V.S. and V.S.S.; formal analysis, V.S. and V.S.S.; investigation, V.S. and V.S.S.; resources, S.I.; data curation, V.S.; writing—original draft preparation, V.S. and V.S.S.; writing—review and editing, V.S.S. and S.I.; visualization, V.S.; supervision, S.I.; project administration, S.I. All authors have read and agreed to the published version of the manuscript.

Funding

This research received no external funding.

Conflicts of Interest

The authors declare no conflict of interest.

References

  1. Carlsson, L.A.; Kardomateas, G.A. Structural and Failure Mechanics of Sandwich Composites; Springer Science & Business Media: Berlin/Heidelberg, Germany, 2011; Volume 121. [Google Scholar]
  2. Vantini, U. Investigating Effects of Pure Shear Deformation in Wind Turbine Blade Sub-Structures. Master’s Thesis, Polytechnic University of Milan, Milan, Italy, 2014. [Google Scholar]
  3. Langenbrunner, L.L.; Price, R.T.; Baldwin, J.W. Impact Resistant Fan Case Liner. U.S. Patent US08/058,643, 6 September 1994. [Google Scholar]
  4. Geng, D.; Yi, K.; Shang, C.; Yang, J.; He, Y. Application status of composite acoustic liner in aero-engine. In Proceedings of the 10th International Conference on Composite Science and Technology, Lisbon, Portugal, 2–4 September 2015; pp. 2–4. [Google Scholar]
  5. Prabhu, G.; Katakam, V.; Sridharan, V.S.; Idapalapati, S. Uniaxial tensile failure of multi-core asymmetric sandwich composite structures with bonded repair. Compos. Struct. 2019, 224, 111025. [Google Scholar] [CrossRef]
  6. A05F0047; Loss of Rudder, Airbus 310–308, Air Transat Flight 961. Minister of Public Works and Government Services Canada: Quebec City, QC, Canada, 2005.
  7. Shipsha, A.; Burman, M.; Zenkert, D. A Comparative Study of Mode I Fatigue Crack Propagation in Foam Cores for Sandwich Structures by Using Different Test Specimens; ICCM-12 International Committee on Composite Materials: Paris, France, 1999. [Google Scholar]
  8. Berkowitz, C.K.; Johnson, W.S. Fracture and fatigue tests and analysis of composite sandwich structure. J. Compos. Mater. 2005, 39, 1417–1431. [Google Scholar] [CrossRef]
  9. Berggreen, C.; Saseendran, V.; Carlsson, L.A. A modified DCB-UBM test method for interfacial fracture toughness characterization of sandwich composites. Eng. Fract. Mech. 2018, 203, 208–223. [Google Scholar] [CrossRef]
  10. Manca, M.; Quispitupa, A.; Berggreen, C.; Carlsson, L.A. Face/core debond fatigue crack growth characterization using the sandwich mixed mode bending specimen. Compos. Part A Appl. Sci. Manuf. 2012, 43, 2120–2127. [Google Scholar] [CrossRef]
  11. Rinker, M.; John, M.; Zahlen, P.C.; Schäuble, R. Face sheet debonding in CFRP/PMI sandwich structures under quasi-static and fatigue loading considering residual thermal stress. Eng. Fract. Mech. 2011, 78, 2835–2847. [Google Scholar] [CrossRef]
  12. Saseendran, V.; Berggreen, C.; Carlsson, L.A. Fracture Mechanics Analysis of Reinforced DCB Sandwich Debond Specimen Loaded by Moments. AIAA J. 2018, 56, 413–422. [Google Scholar] [CrossRef] [Green Version]
  13. Cantwell, W.; Davies, P. A test technique for assessing core-skin adhesion in composite sandwich structures. J. Mater. Sci. Lett. 1994, 13, 203–205. [Google Scholar] [CrossRef]
  14. Prasad, S.; Carlsson, L.A. Debonding and crack kinking in foam core sandwich beams—II. Experimental investigation. Eng. Fract. Mech. 1994, 47, 825–841. [Google Scholar] [CrossRef]
  15. Cantwell, W.; Davies, P. A study of skin-core adhesion in glass fibre reinforced sandwich materials. Appl. Compos. Mater. 1996, 3, 407–420. [Google Scholar] [CrossRef]
  16. Cantwell, W.; Broster, G.; Davies, P. The influence of water immersion on skin-core debonding in GFRP-balsa sandwich structures. J. Reinf. Plast. Compos. 1996, 15, 1161–1172. [Google Scholar] [CrossRef]
  17. Cantwell, W.; Scudamore, R.; Ratcliffe, J.; Davies, P. Interfacial fracture in sandwich laminates. Compos. Sci. Technol. 1999, 59, 2079–2085. [Google Scholar] [CrossRef]
  18. McGarva, L.; Åström, B. Experimental investigation of compression moulding of glass/PA12-PMI foam core sandwich components. Compos. Part A Appl. Sci. Manuf. 1999, 30, 1171–1185. [Google Scholar] [CrossRef]
  19. Li, X.; Carlsson, L.A. The tilted sandwich debond (TSD) specimen for face/core interface fracture characterization. J. Sandw. Struct. Mater. 1999, 1, 60–75. [Google Scholar] [CrossRef]
  20. Li, X.; Carlsson, L.A. Elastic foundation analysis of tilted sandwich debond (TSD) specimen. J. Sandw. Struct. Mater. 2000, 2, 3–32. [Google Scholar] [CrossRef]
  21. Weaver, C.A. Evaluation of Mode I Fracture Mechanics Test Methods for Sandwich Composites; Department of Mechanical Engineeering, University of Utahp: Salt Lake City, UT, USA, 2010. [Google Scholar]
  22. Ratcliffe, J.G.; Reeder, J.R. Sizing a single cantilever beam specimen for characterizing facesheet–core debonding in sandwich structure. J. Compos. Mater. 2011, 45, 2669–2684. [Google Scholar] [CrossRef]
  23. ASTM D5528-13; Standard Test Method for Mode I Interlaminar Fracture Toughness of Unidirectional Fiber-Reinforced Polymer Matrix Composites. American Society of Testing and Materials: West Conshohocken, PA, USA, 2007.
  24. Rinker, M.; Ratcliffe, J.G.; Adams, D.O.; Krueger, R. Characterizing Facesheet/Core Disbonding in Honeycomb Core Sandwich structure. No. NASA/CR-2013-217959. Available online: https://ntrs.nasa.gov/api/citations/20130010408/downloads/20130010408.pdf (accessed on 16 November 2021).
  25. Paris, P.; Erdogan, F. A Critical Analysis of Crack Propagation Laws. J. Basic Eng. 1963, 85, 528–533. [Google Scholar] [CrossRef]
  26. ASTM D6115-97; Standard Test Method for Mode I Fatigue Delamination Growth Onset of Unidirectional Fiber-Reinforced Polymer Matrix Composites. American Society of Testing and Materials: West Conshohocken, PA, USA, 2019. [CrossRef]
  27. Ramkumar, R.; Whitcomb, J. Characterization of mode I and mixed-mode delamination growth in T300/5208 graphite/epoxy. In Delamination and Debonding of Materials; ASTM International: West Conshohocken, PA, USA, 1985. [Google Scholar]
  28. Tanaka, K.; Tanaka, H. Stress-ratio effect on mode II propagation of interlaminar fatigue cracks in graphite/epoxy composites. In Composite Materials: Fatigue and Fracture; ASTM International: West Conshohocken, PA, USA, 1997. [Google Scholar]
  29. Hojo, M.; Matsuda, S.; Tanaka, M.; Ochiai, S.; Murakami, A. Mode I delamination fatigue properties of interlayer-toughened CF/epoxy laminates. Compos. Sci. Technol. 2006, 66, 665–675. [Google Scholar] [CrossRef]
  30. Saseendran, V. Fracture Characterization and Analysis of Debonded Sandwich Composites. Ph.D. Thesis, Technical University of Denmark, Lyngby, Denmark, 2017. [Google Scholar]
  31. Zenkert, D. An Investigation to Sandwich Construction; Chameleon Press: London, UK, 1995. [Google Scholar]
  32. Gleich, D.; Van Tooren, M.; De Haan, P. Shear and peel stress analysis of an adhesively bonded scarf joint. J. Adhes. Sci. Technol. 2000, 14, 879–893. [Google Scholar] [CrossRef]
  33. Adams, D.O.; Kessler, J.A.; Kuramoto, B.; Bluth, J.; Weaver, C.; Gill, A. Development and Evaluation of Fracture Mechanics Test Methods For Sandwich Composites. In Proceedings of the 2010 FAA JAMS Technical Review Meeting, Wichita, KS, USA, 21–22 July 2010. [Google Scholar]
Figure 1. Single cantilever beam Mode-1 fracture test (SCB) configuration.
Jcs 06 00051 g001
Figure 2. Test fixture with baseplate and top clamps.
Jcs 06 00051 g002
Figure 3. SCB specimen dimensions: (the thickness mentioned in the above images is the average of all the specimens tested).
Jcs 06 00051 g003
Figure 4. Different types of cores used in this study.
Jcs 06 00051 g004
Figure 5. High-density honeycomb (HDHC) face sheet/core interface: (a,b) show the top face sheet/core interface at two different locations; (c,d) show the bottom face sheet/core interface at two different locations.
Jcs 06 00051 g005
Figure 6. Low-density honeycomb (LDHC) face sheet/core interface: (a,b) show the top face sheet/core interface at two different locations; (c,d) show the bottom face sheet/core interface at two different locations.
Jcs 06 00051 g006
Figure 7. High-density foam core (HDFC) face sheet/core interface: (a,b) show the top face sheet/core interface at two different locations; (c,d) show the bottom face sheet/core interface at two different locations.
Jcs 06 00051 g007
Figure 8. Low-density foam core (LDFC) face sheet/core interface: (a,b) show the top face sheet/core interface at two different locations; (c,d) show the bottom face sheet/core interface at two different locations.
Jcs 06 00051 g008
Figure 9. SCB test fixture along with the Mode-I loading.
Jcs 06 00051 g009
Figure 10. SCB experimental setup on a universal testing machine and associated instrumentation.
Jcs 06 00051 g010
Figure 11. Load versus displacement response of 4 sandwich systems under Mode-I loading.
Jcs 06 00051 g011
Figure 12. Comparison of core surface geometry to the load vs. displacement plot (a) HDHC; (b) LDHC; (c) HDFC; (d) LDFC.
Jcs 06 00051 g012aJcs 06 00051 g012b
Figure 13. Debond resistance curve (GIC vs. a) for SCB sandwich structures: (a) HDHC; (b) LDHC; (c) HDFC; (d) LDFC.
Jcs 06 00051 g013
Figure 14. Comparison of debond resistance curve (GIC vs. a) for all 4 SCB sandwich structures.
Jcs 06 00051 g014
Figure 15. Comparison of the current interfacial toughness measurements with that of the Adams et al. [33] work.
Jcs 06 00051 g015
Figure 16. Debonding surface of SCB specimens. (a): Face sheet debonding of SCB1 sandwich configuration; (b): face sheet debonding of SCB2 sandwich configuration.
Jcs 06 00051 g016aJcs 06 00051 g016b
Figure 17. Detailed visualization of the fractured surface of the SCB specimens.
Jcs 06 00051 g017
Figure 18. Paris law region II plot for 4 different SCB sandwich specimen configurations.
Jcs 06 00051 g018
Figure 19. Steady-state crack growth (Paris law) plot for all the tested specimens.
Jcs 06 00051 g019
Table 1. Selected parameters for SCB specimen sizing.
ParametersSelected Value
L hinge 23   mm
t c 12.7   mm
E c 873 . 4   MPa
G xz , f 7   GPa
E f 46   GPa
G c 0 . 25   MPa
a prop 50   mm
σ c 800   MPa
t f 1 . 5   mm
Table 2. The nomenclature and material configurations used for the sets of SCB samples.
Configuration NameFace SheetCoreDensity (kg/m3)
SCB1-LGFRPCymat® closed-cell Al foam170
SCB1-HGFRPAlporas® closed-cell Al foam250
SCB2-LGFRPAluminum Honeycomb69
SCB2-HGFRPAluminum Honeycomb192
Table 3. Core and Face sheet material properties.
Core MaterialDensity   ( kg / m 3 ) E c   ( MPa ) G c   ( MPa )
Al Honeycomb69490.51.6
Al Honeycomb192873.41.6
Cymat Al Foam1704003
Alporas Al Foam25010003
Face Sheet Material E f   ( MPa ) G xz , f   ( MPa ) σ c   ( MPa )
G17500 GFRP46,0007000800
Table 4. Stiffness ratio λ for different material systems.
System
Configuration
Name
Face SheetCoreNomenclatureλ
(Stiffness Ratio)
SCB1GFRPAlporas®HDFC197.50
Cymat®LDFC157.06
SCB2GFRPAluminum HoneycombHDHC190.93
LDHC165.28
Table 5. Average and standard deviation of the interfacial toughness values of SCB samples: (a) average of SCB1; (b) average of SCB2; (c) standard deviation of SCB1; (d) standard deviation of SCB2.
(a)(b)
Specimen NameAverage Interfacial Toughness (J/m2)Specimen NameAverage Interfacial Toughness (J/m2)
HDFC11607.76HDHC11027.98
HDFC21112.56HDHC21082.38
HDFC31373.93HDHC31277.54
LDFC1243.26LDHC11424.89
LDFC2392.2LDHC21190.33
LDFC3165.58LDHC31241.12
(c)(d)
Specimen NameStandard Deviation (J/m2)Specimen NameStandard Deviation (J/m2)
HDFC1305.65HDFC1148.4
HDFC2218.01HDFC2126.17
HDFC3309.33HDFC372.37
LDHC1280.05LDFC1126.87
LDHC2277.55LDFC2124.79
LDHC3347.45LDFC397.46
Table 6. δmax values calculated for the different sandwich configurations.
HDFCLDFCHDHCLDFC
G I m a x G I C δmaxδmaxδmaxδmax
19.087.238.426.39
0.88.126.467.535.71
0.757.866.267.295.53
0.77.596.0497.0445.34
0.67.0335.606.524.95
0.56.425.115.954.51
Table 7. Paris law coefficient for different sandwich specimens.
SpecimenHDHC2LDHC2HDFC2LDFC2
m3.923.283.657.36
Publisher’s Note: MDPI stays neutral with regard to jurisdictional claims in published maps and institutional affiliations.

