

Optimization and Prediction of Mechanical Characteristics on Vacuum Sintered Ti-6Al-4V-SiCp Composites Using Taguchi’s Design of Experiments, Response Surface Methodology and Random Forest Regression

 , ,
, ,  and
and
Abstract
1. Introduction
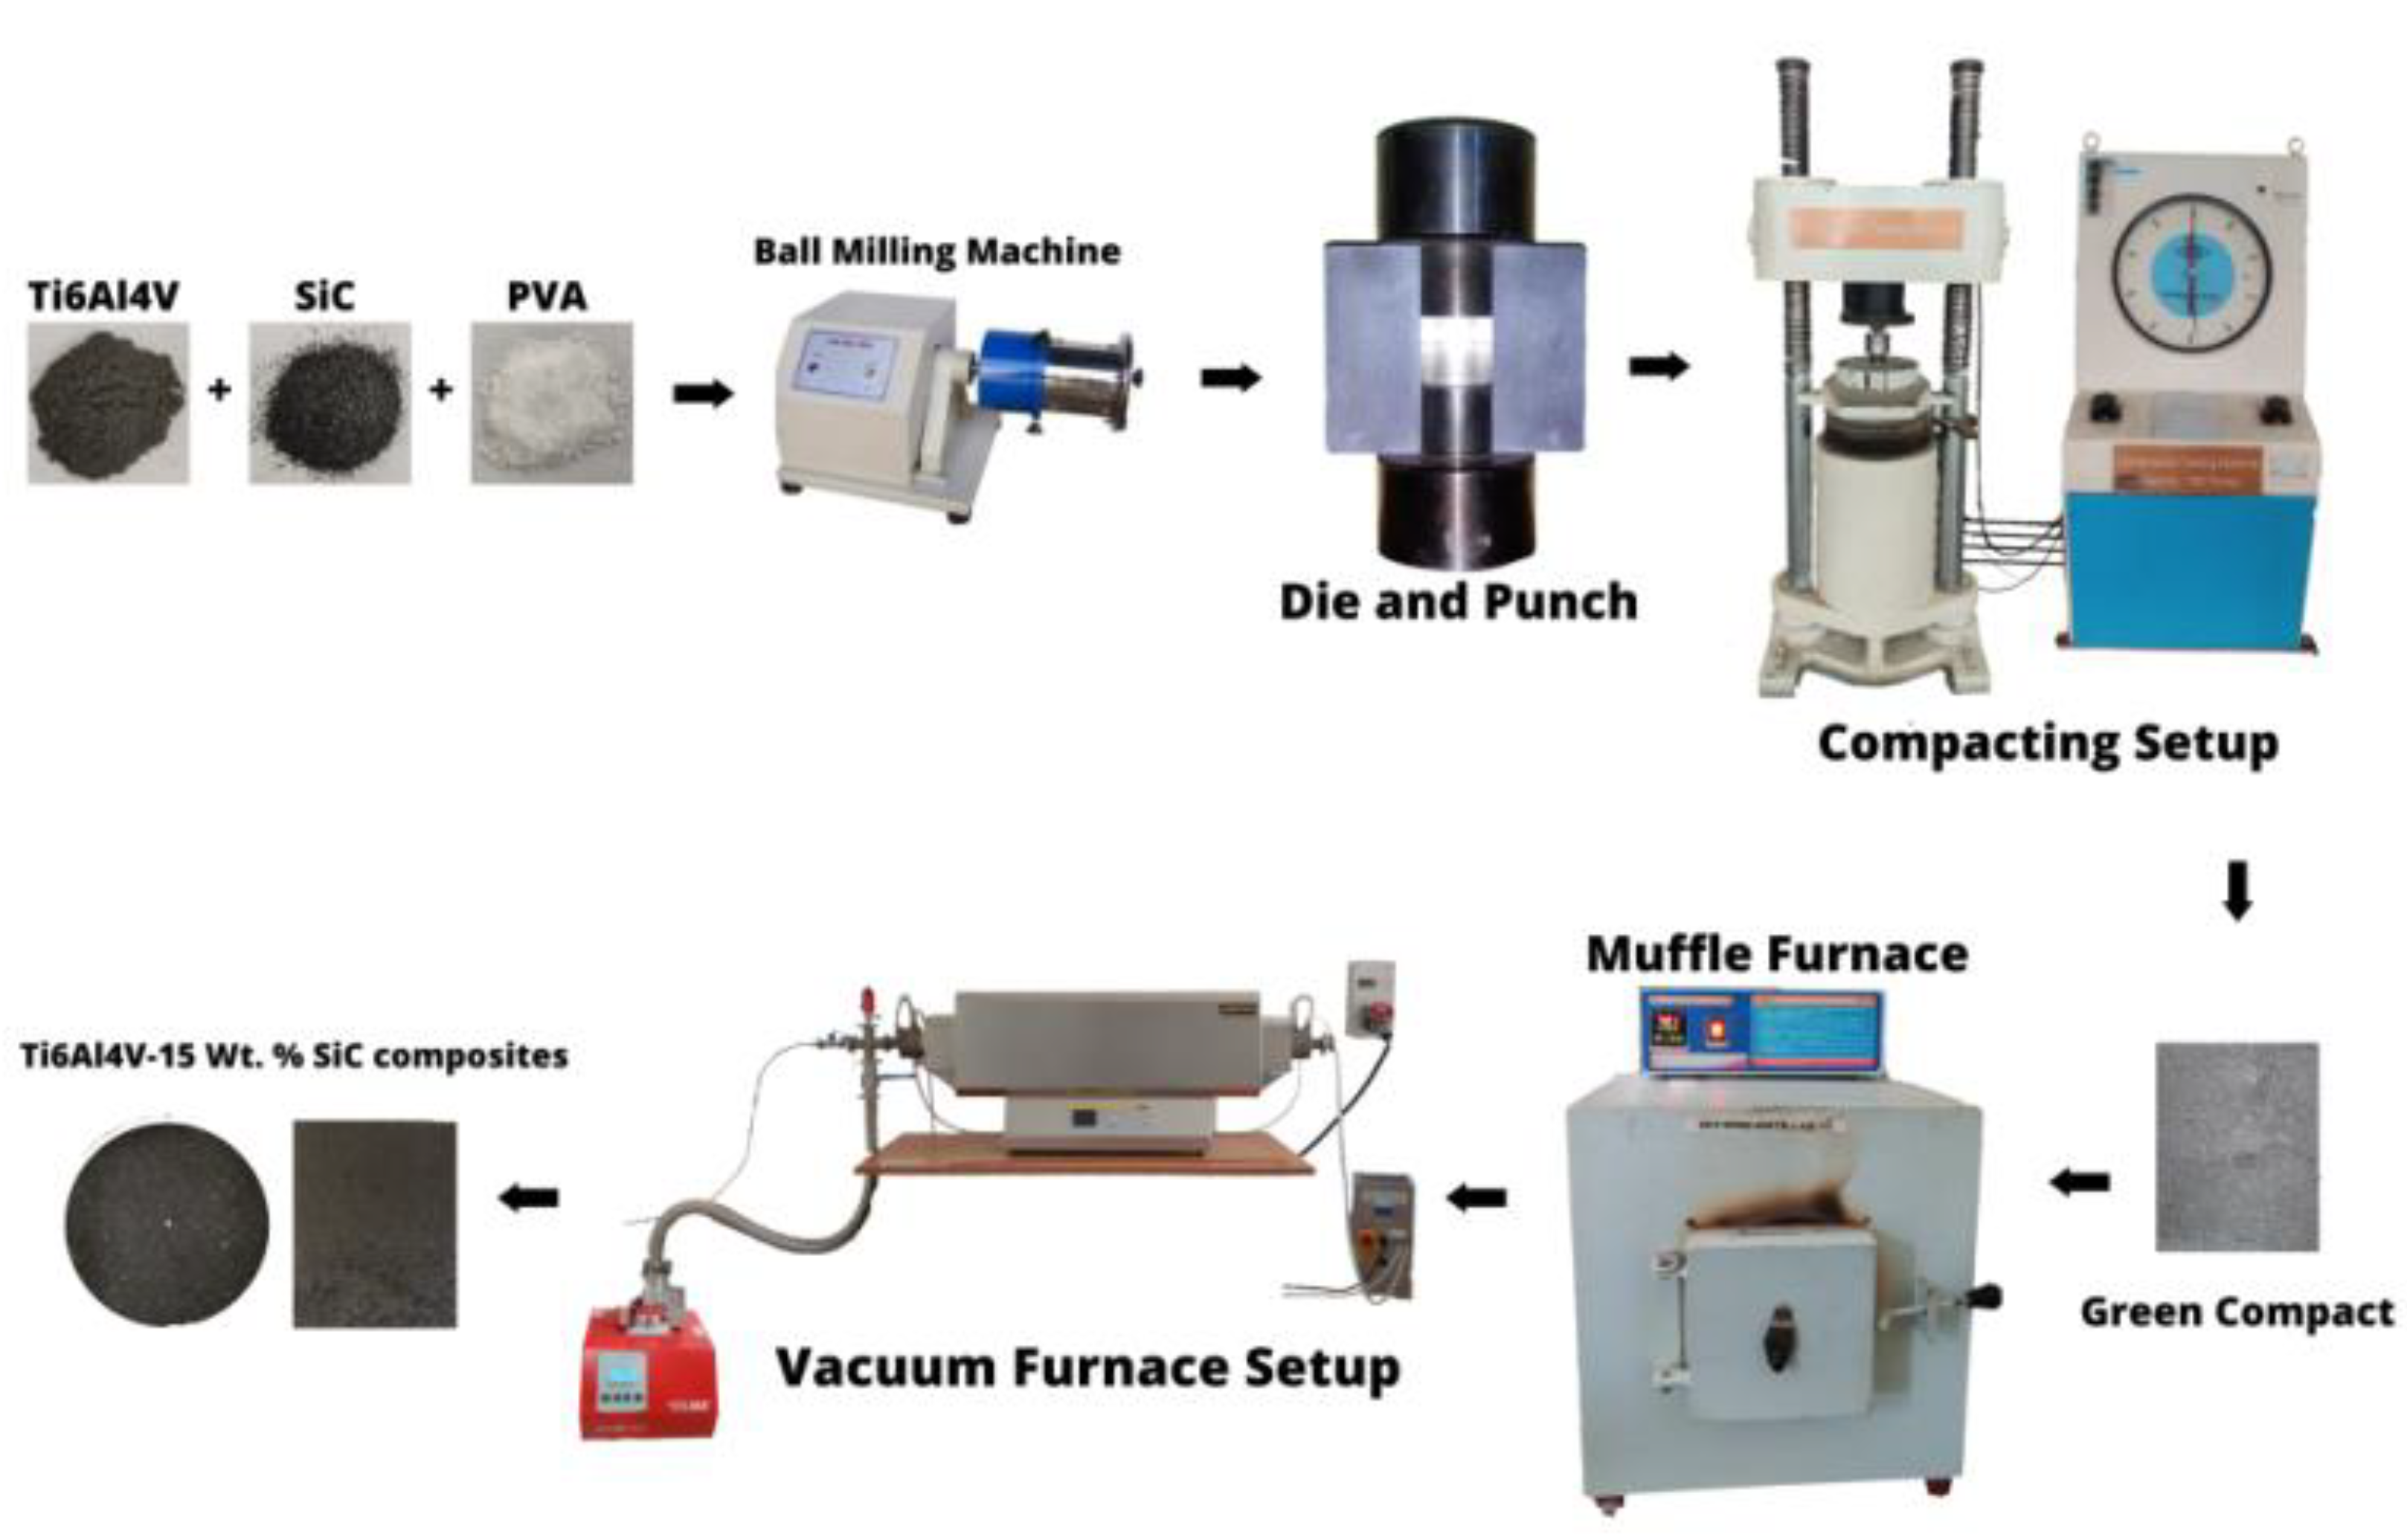
2. Methodology
3. Design of Experiments
3.1. Taguchi’s Design of Experiments
3.2. Response Surface Methodology
3.3. Random Forest Regression
- Step 1: The loading of the data sets.
- Step 2: The selection of the preprocessor.
- Step 3: Classifying the data sets for training and testing.
- Step 4: Training the model using the datasets.
- Step 5: Loading the test data set for a comparison.
- Step 6: Evaluating the prediction performance based on the accuracy and precision.
4. Results and Discussions
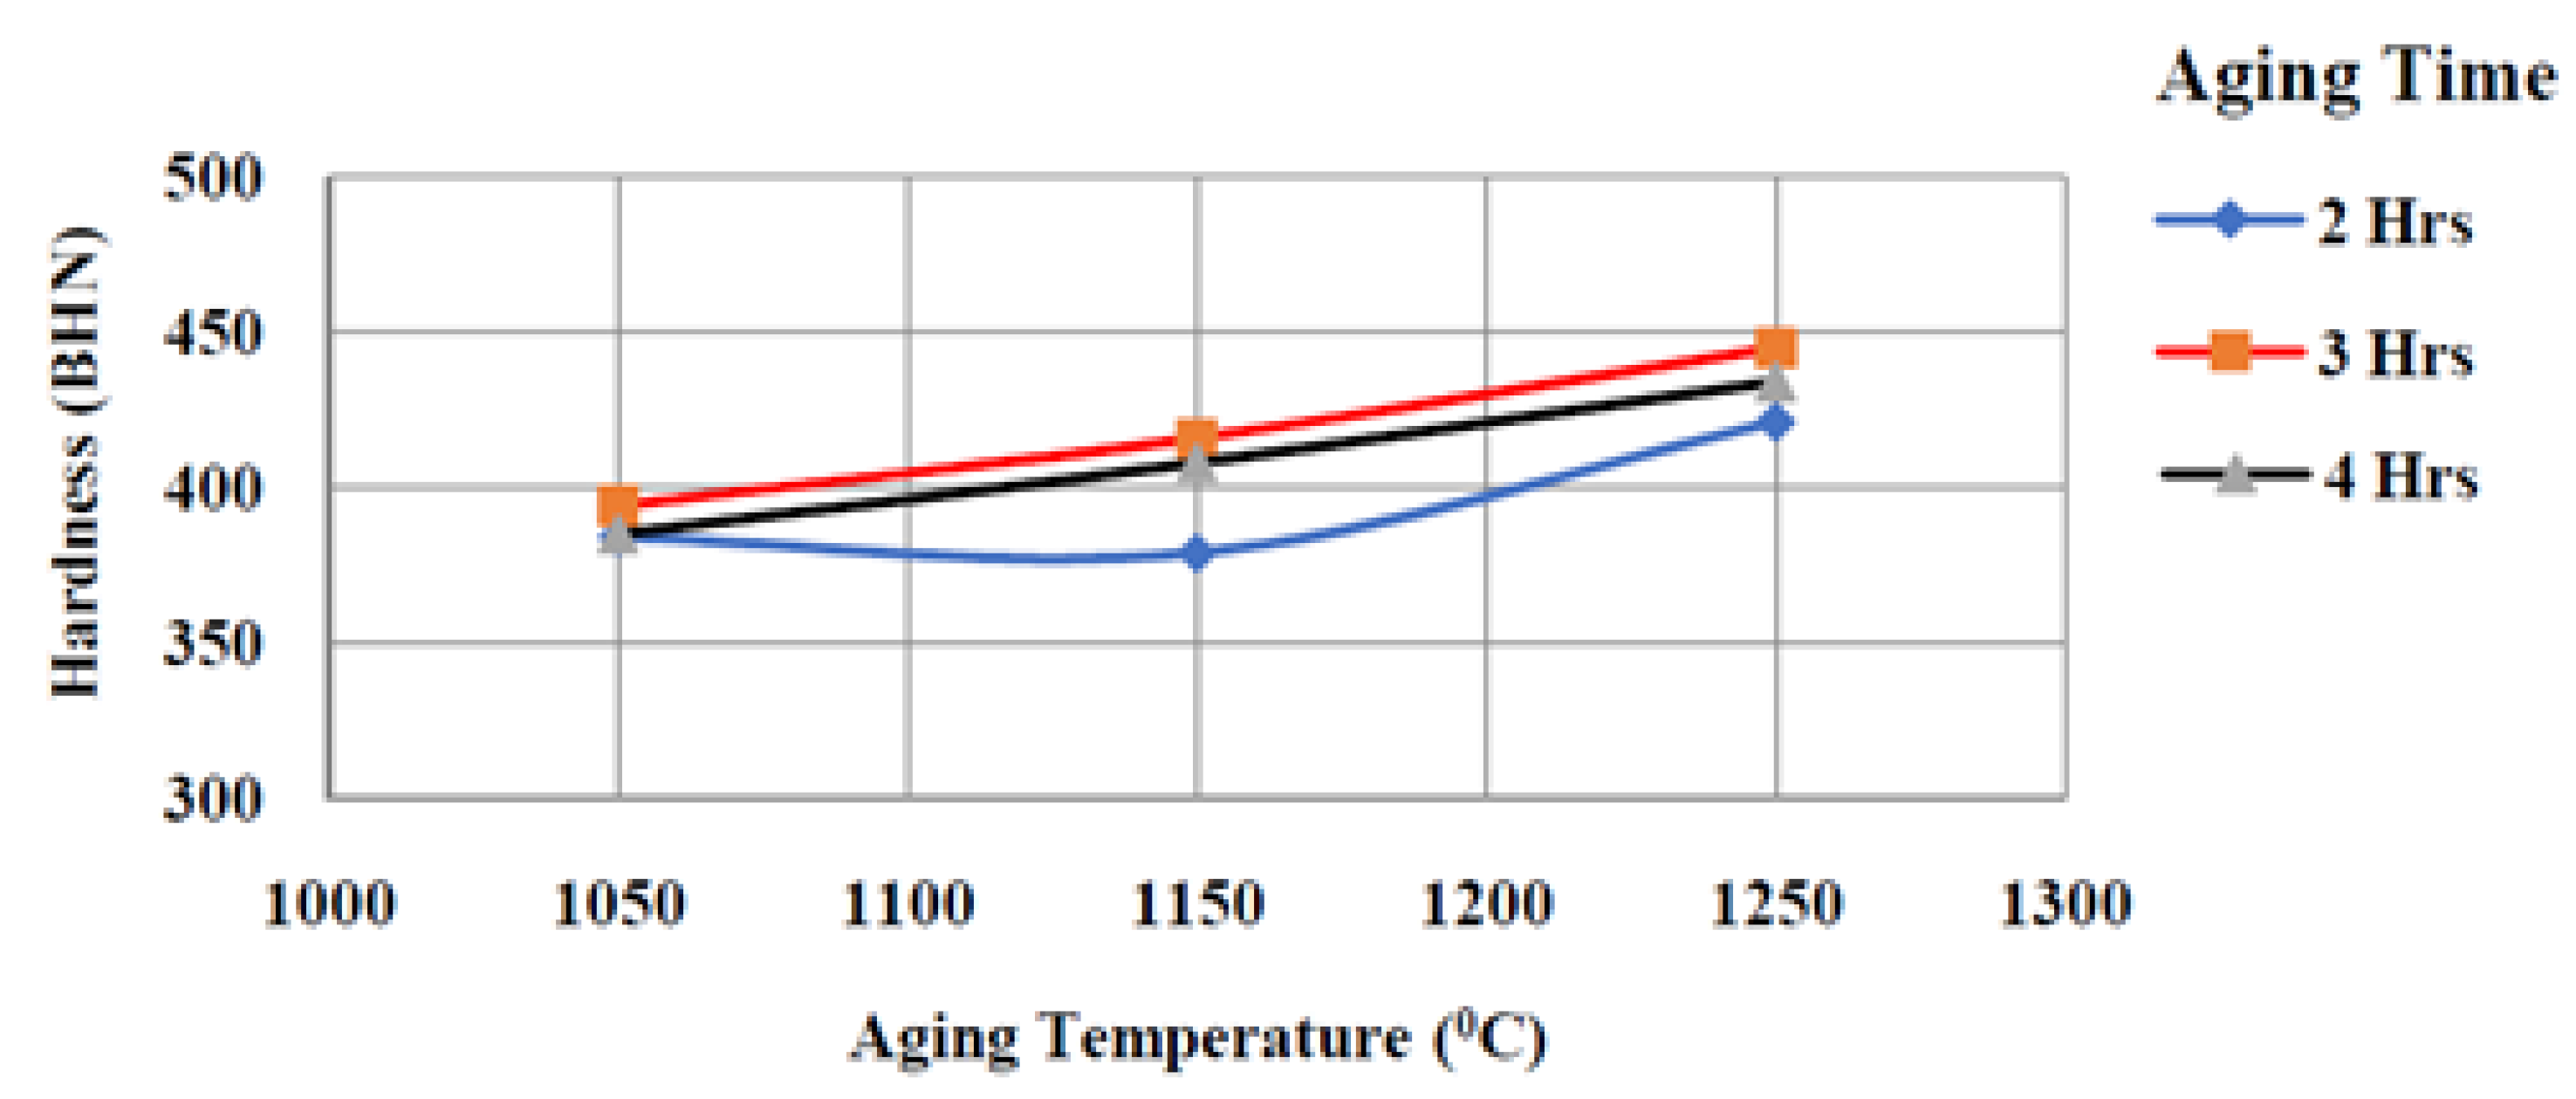
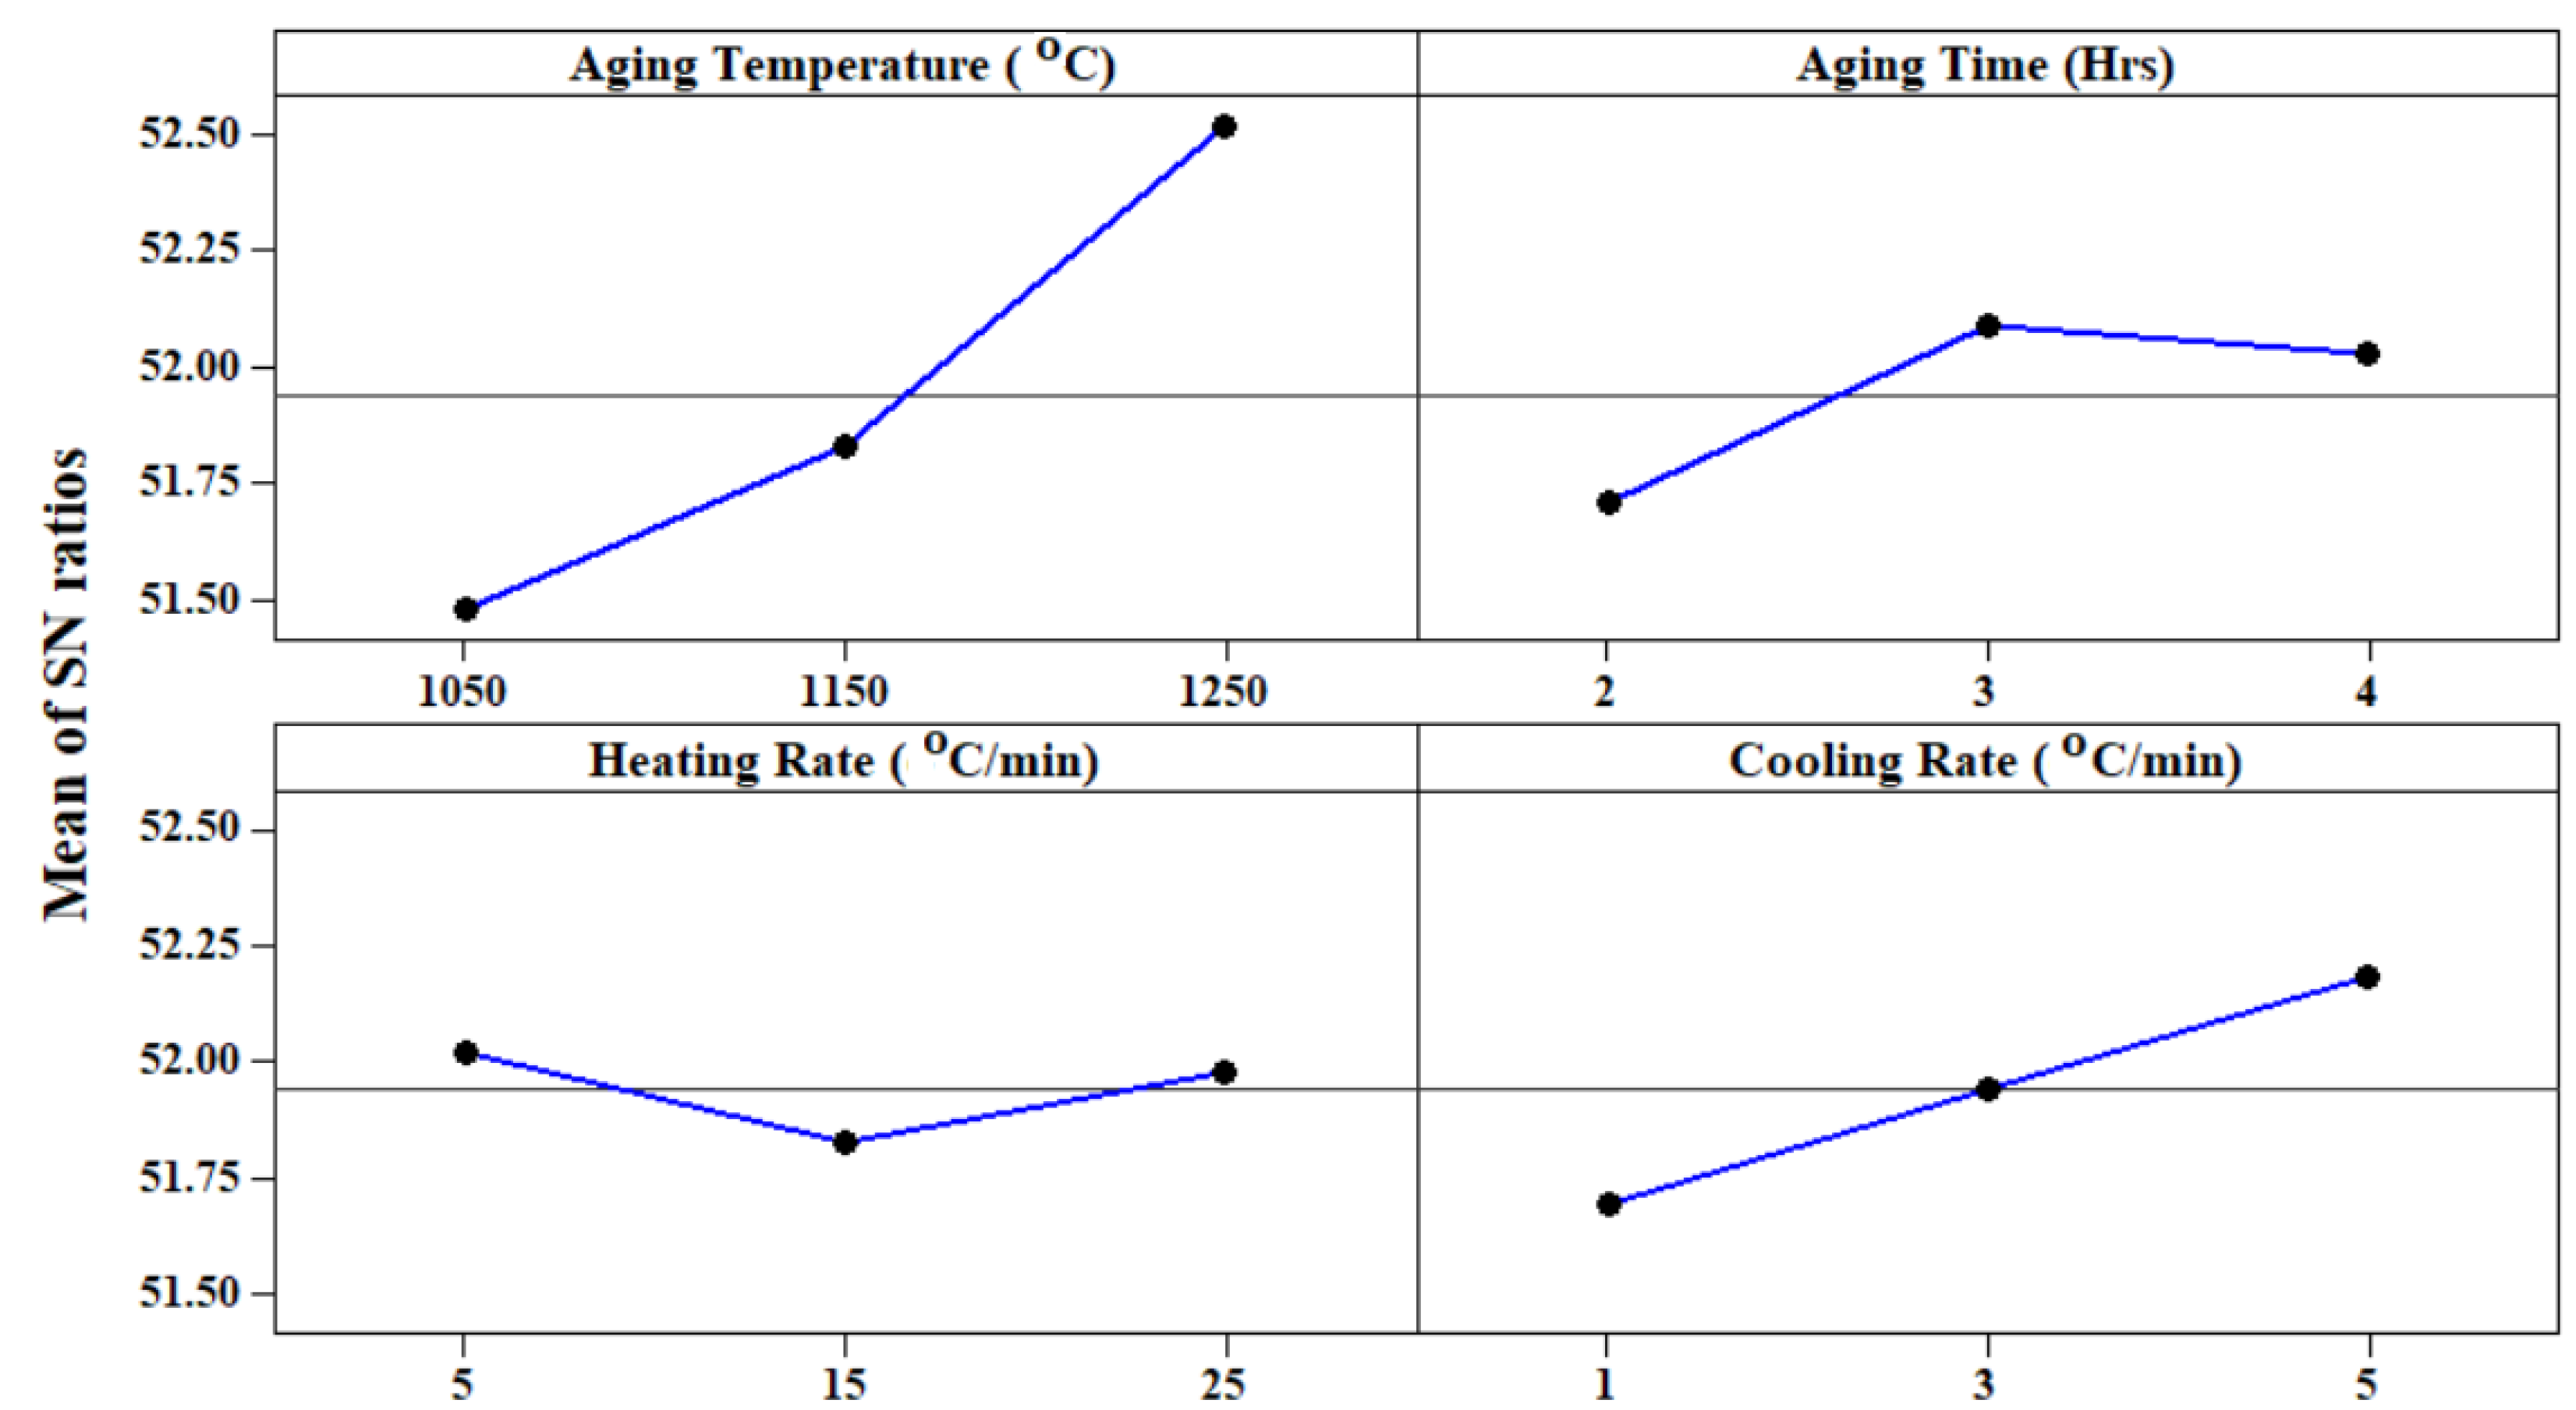
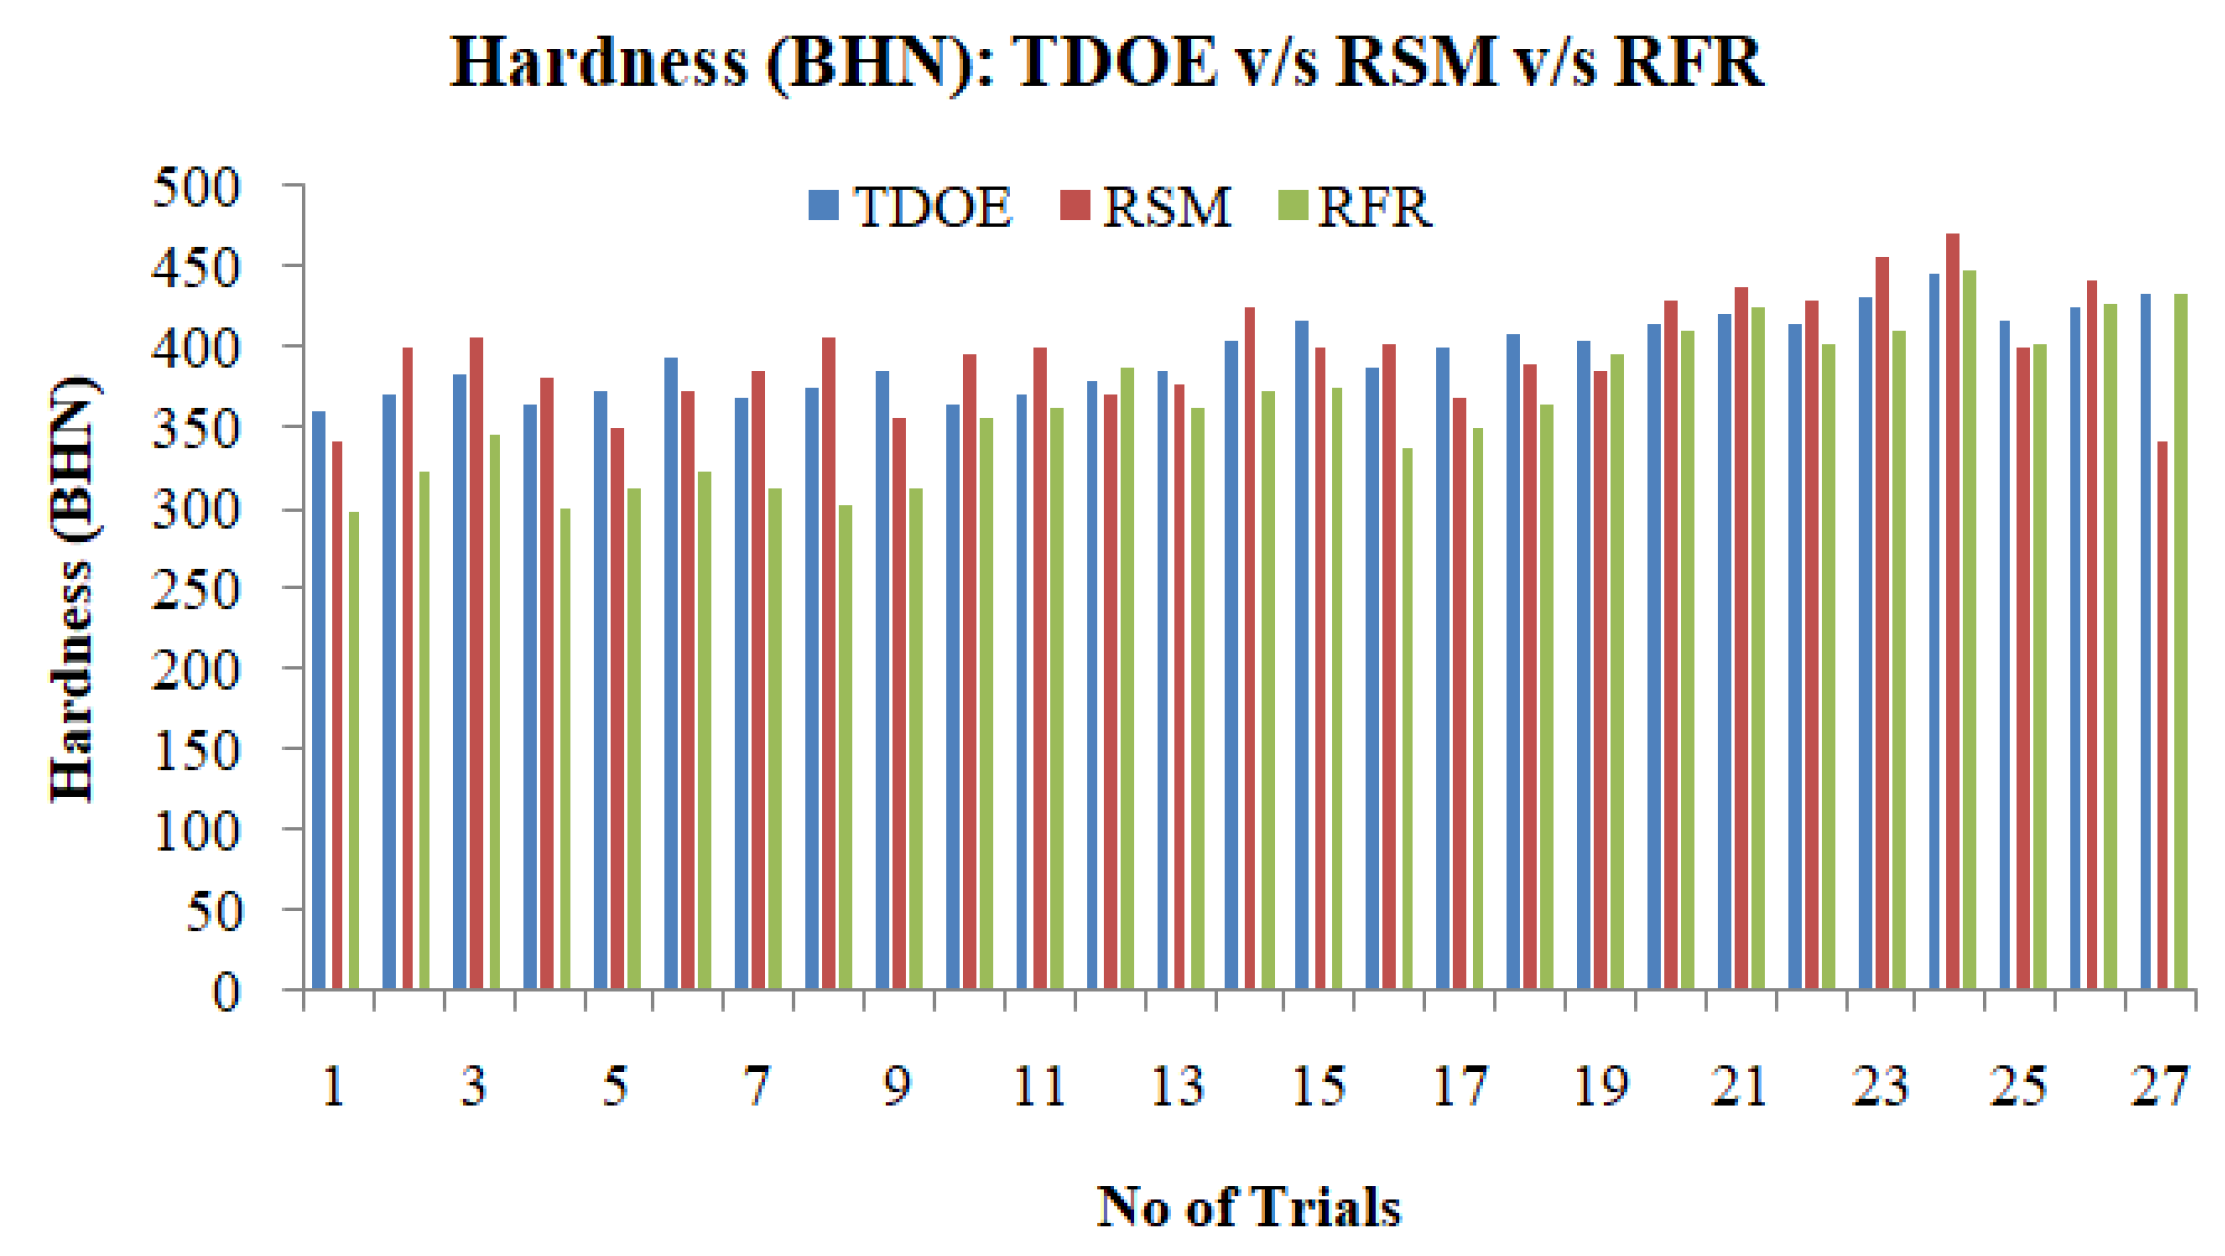
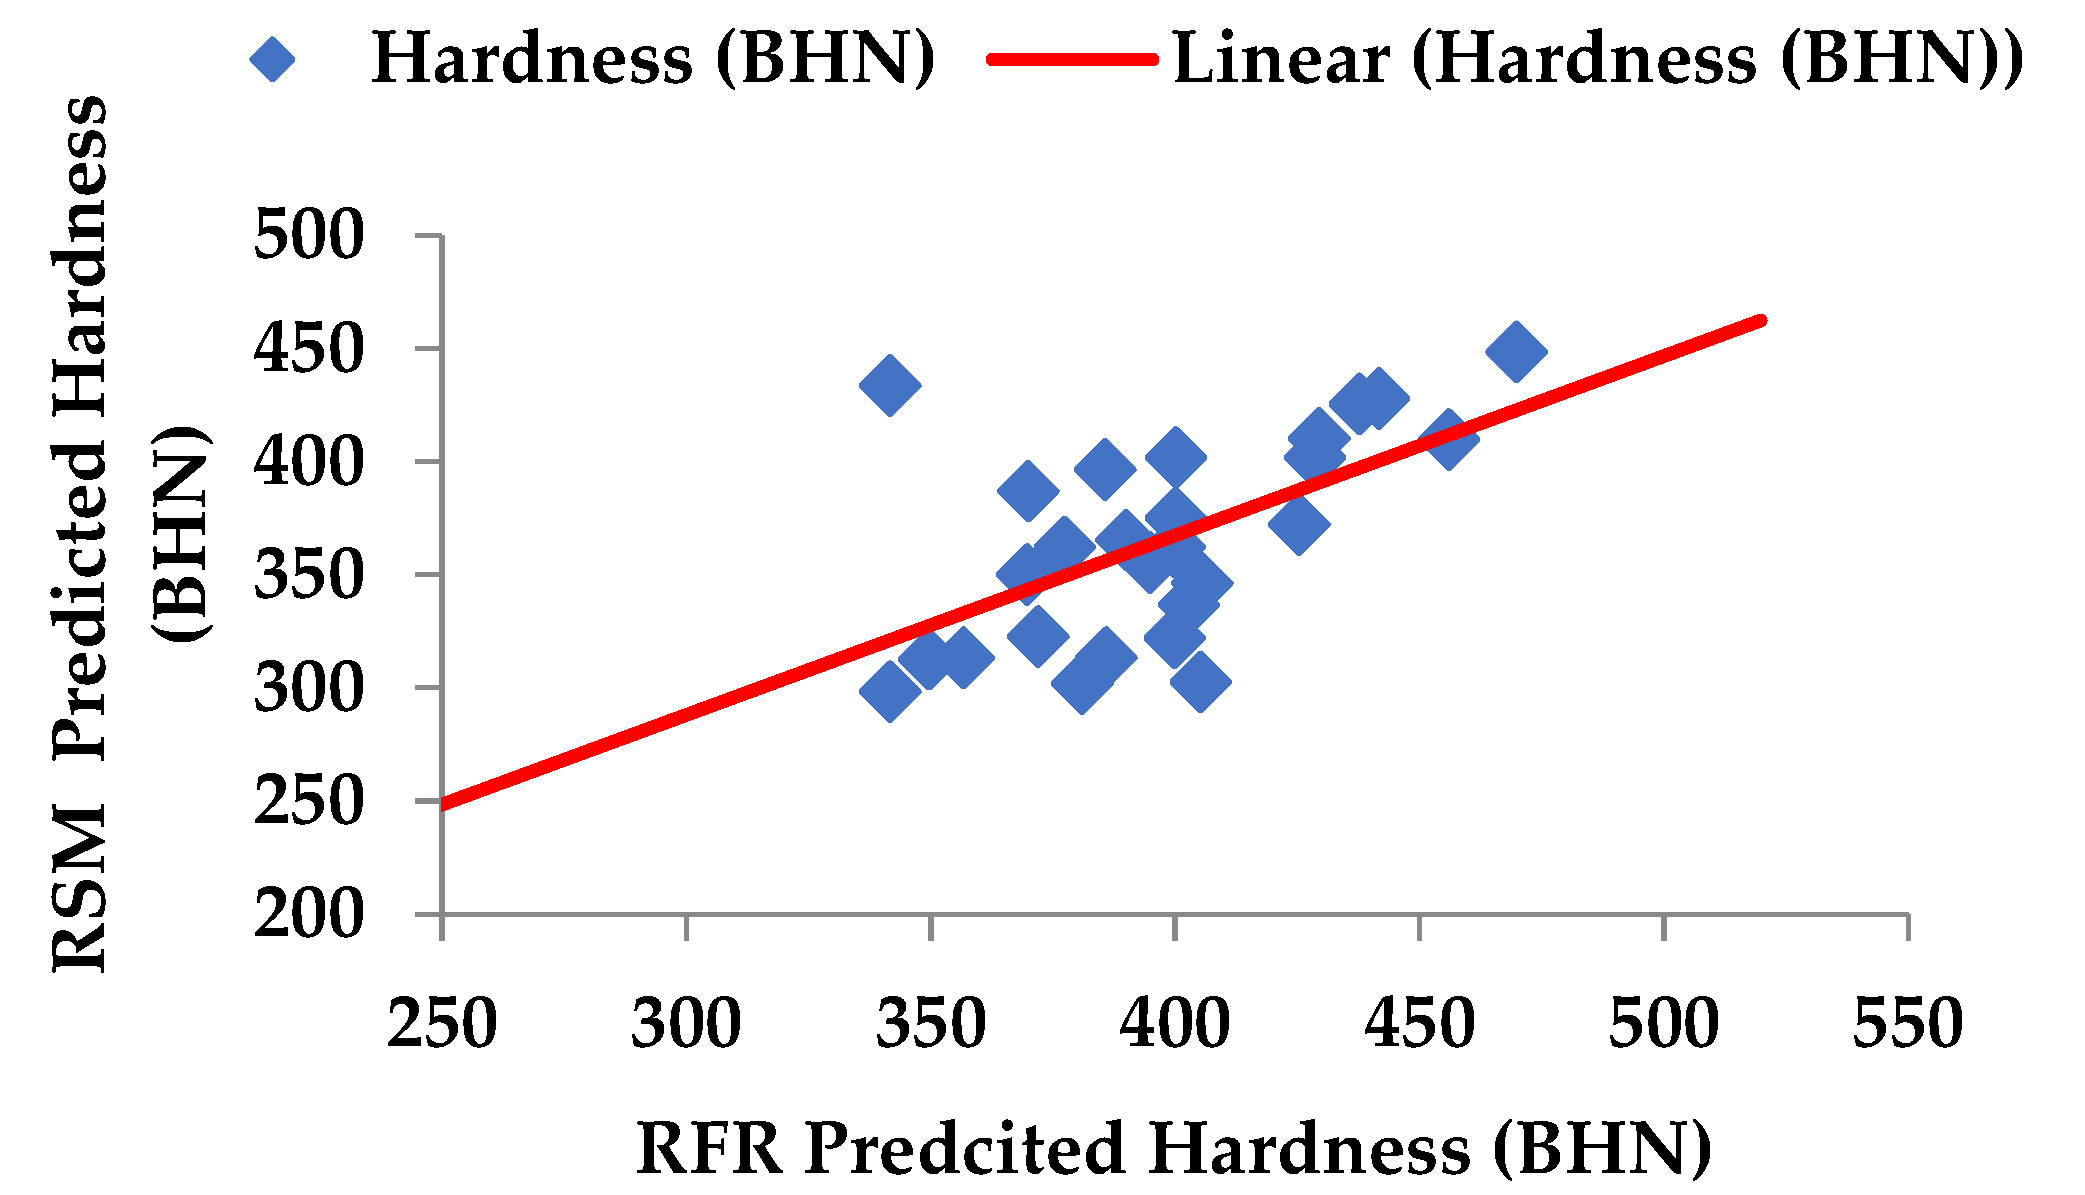
4.1. Hardness
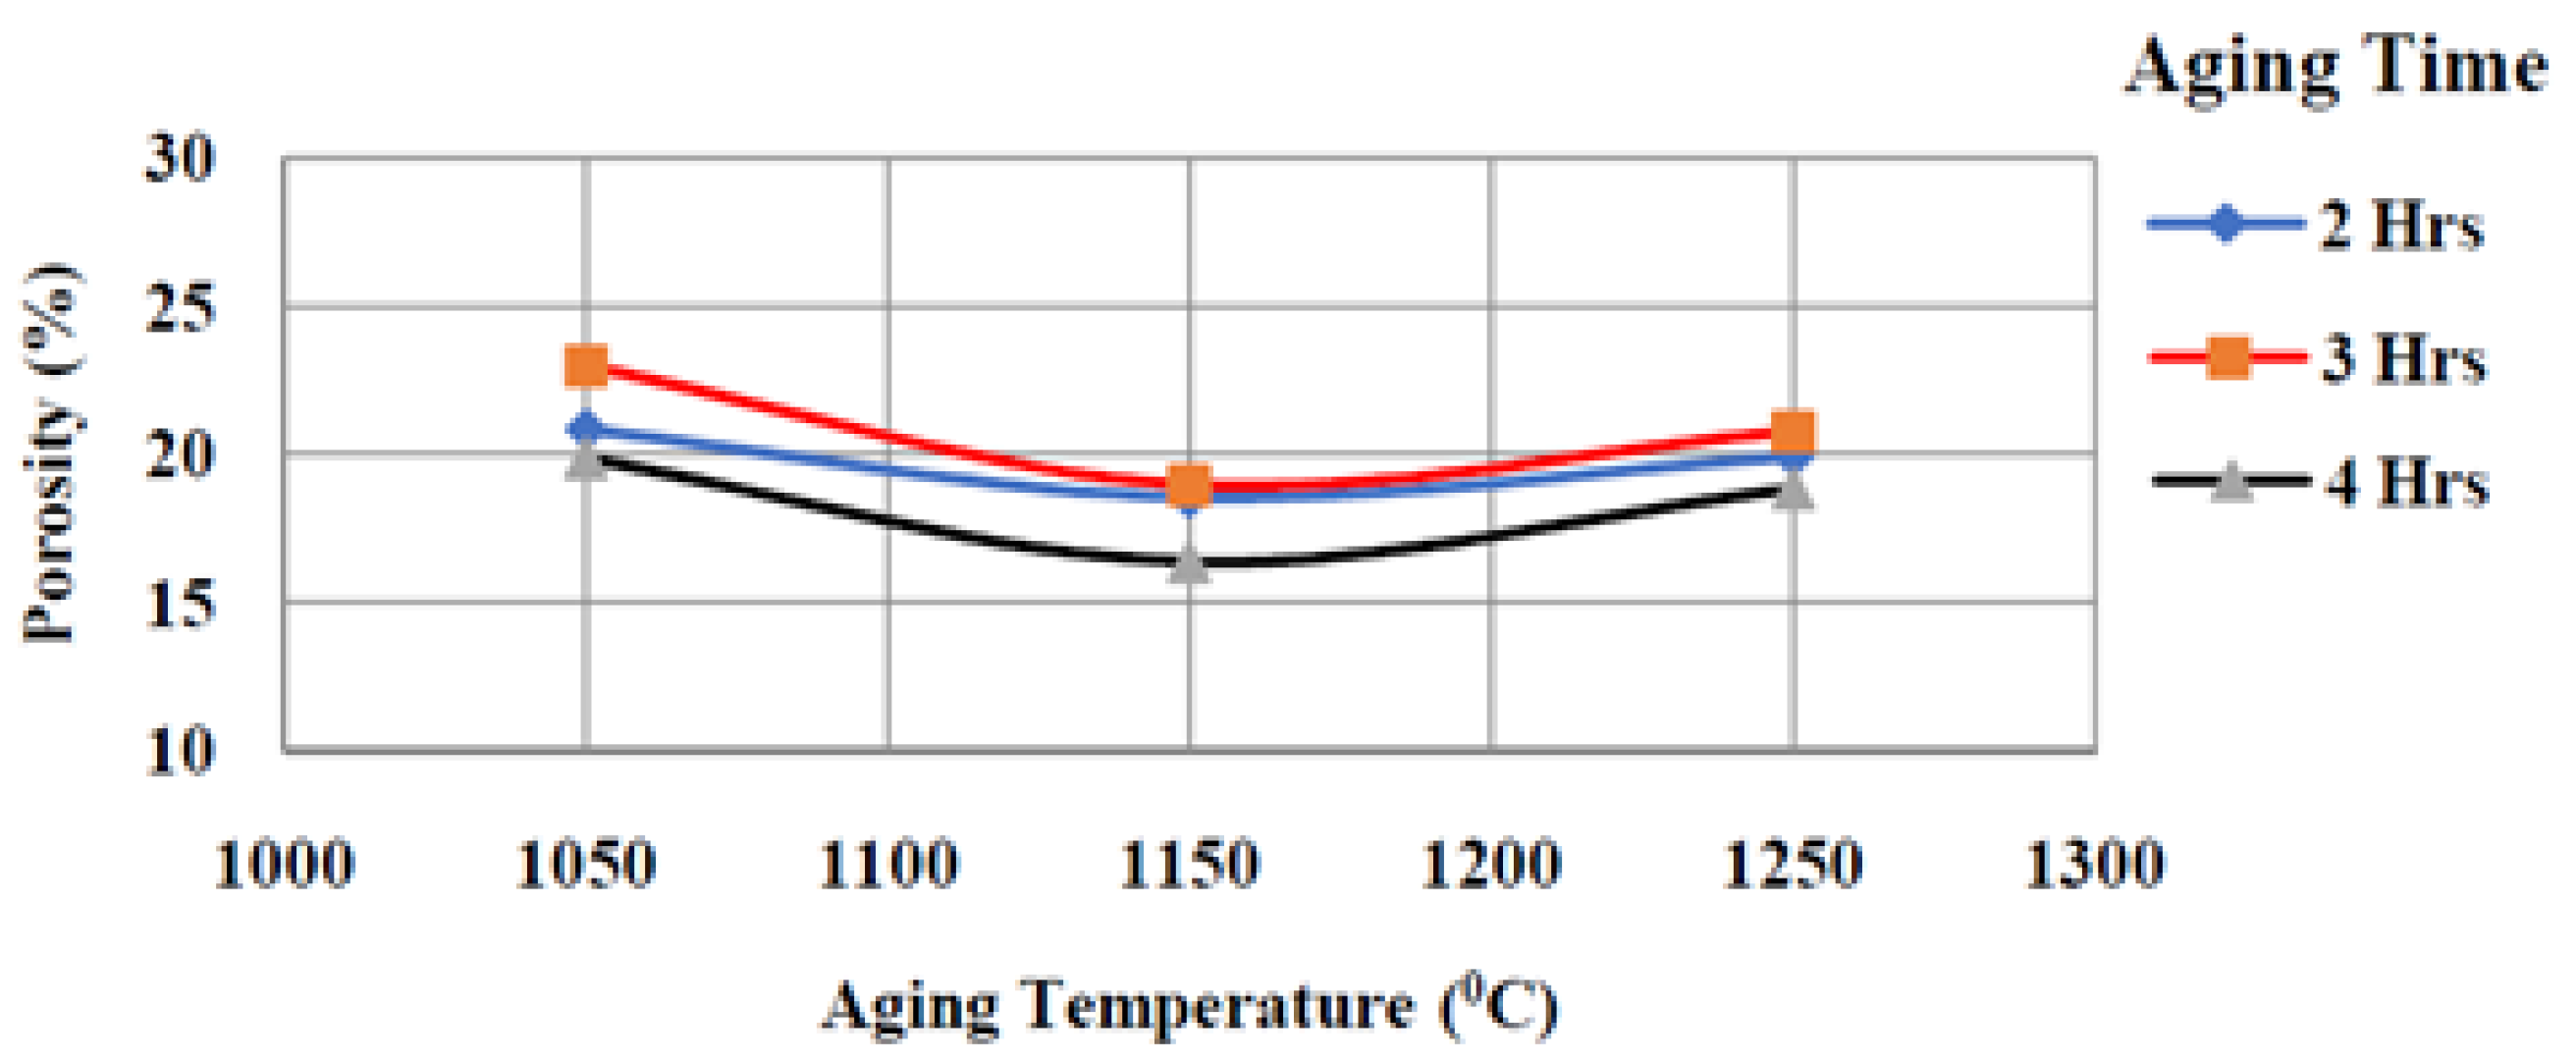
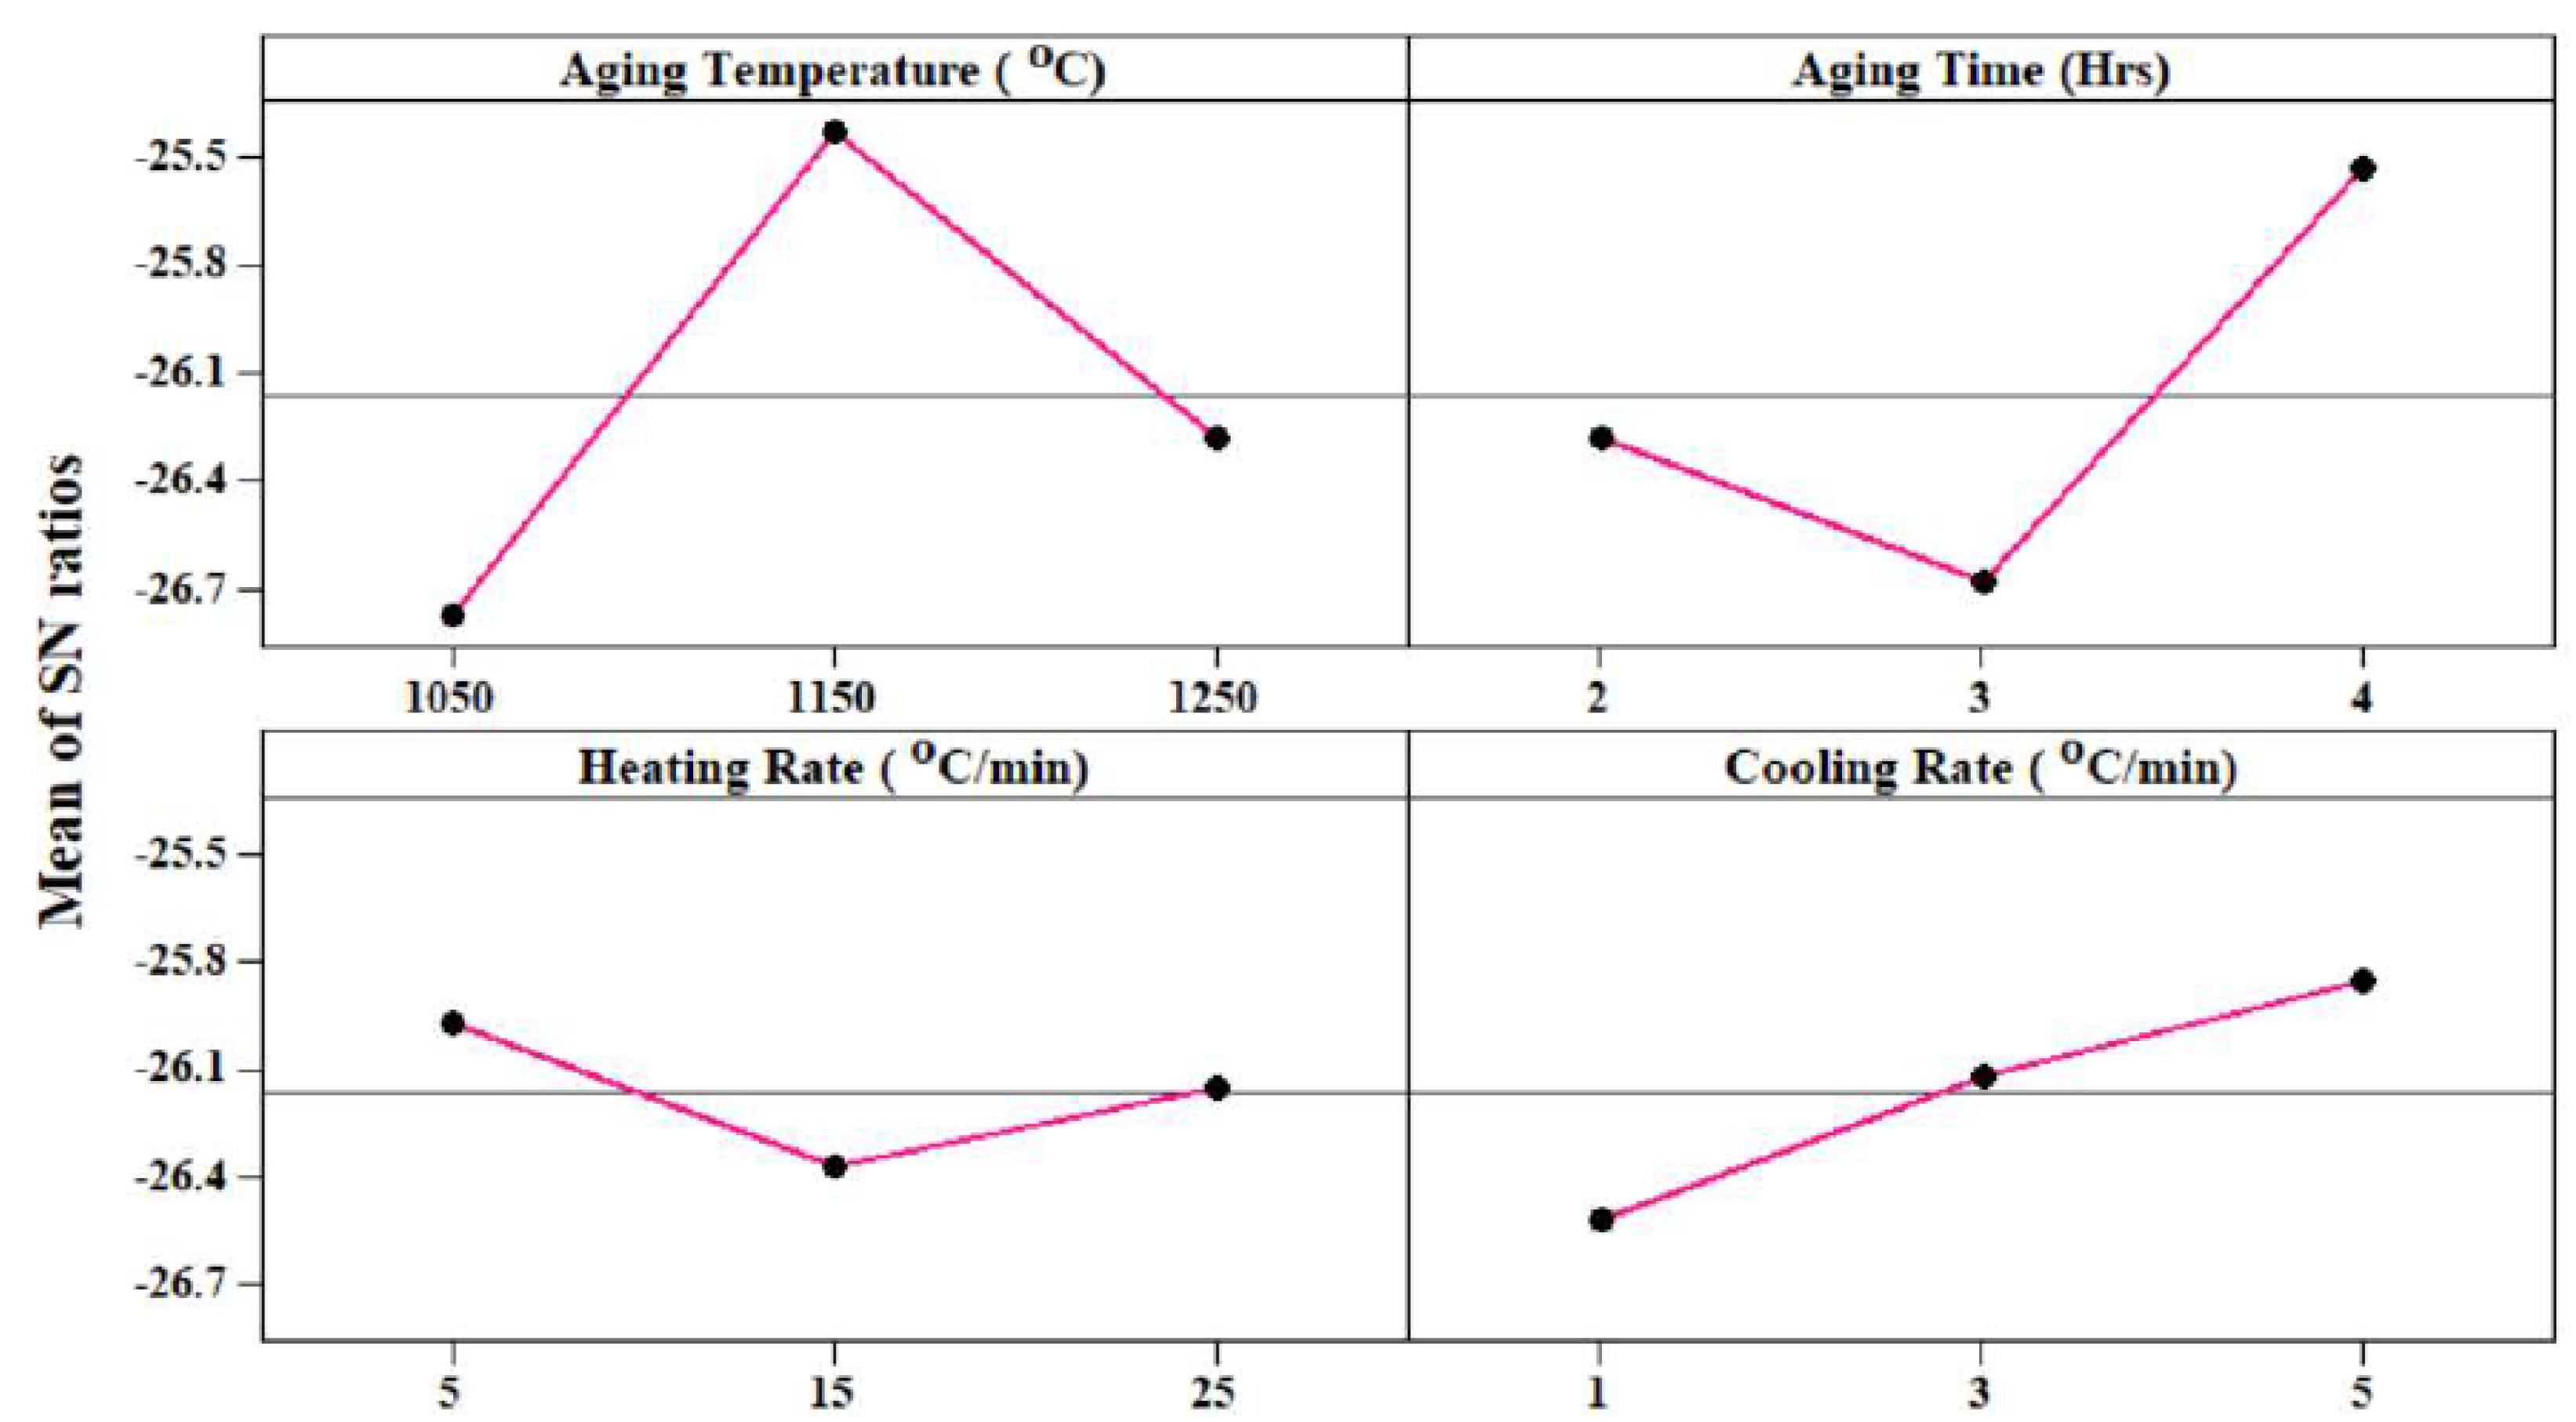
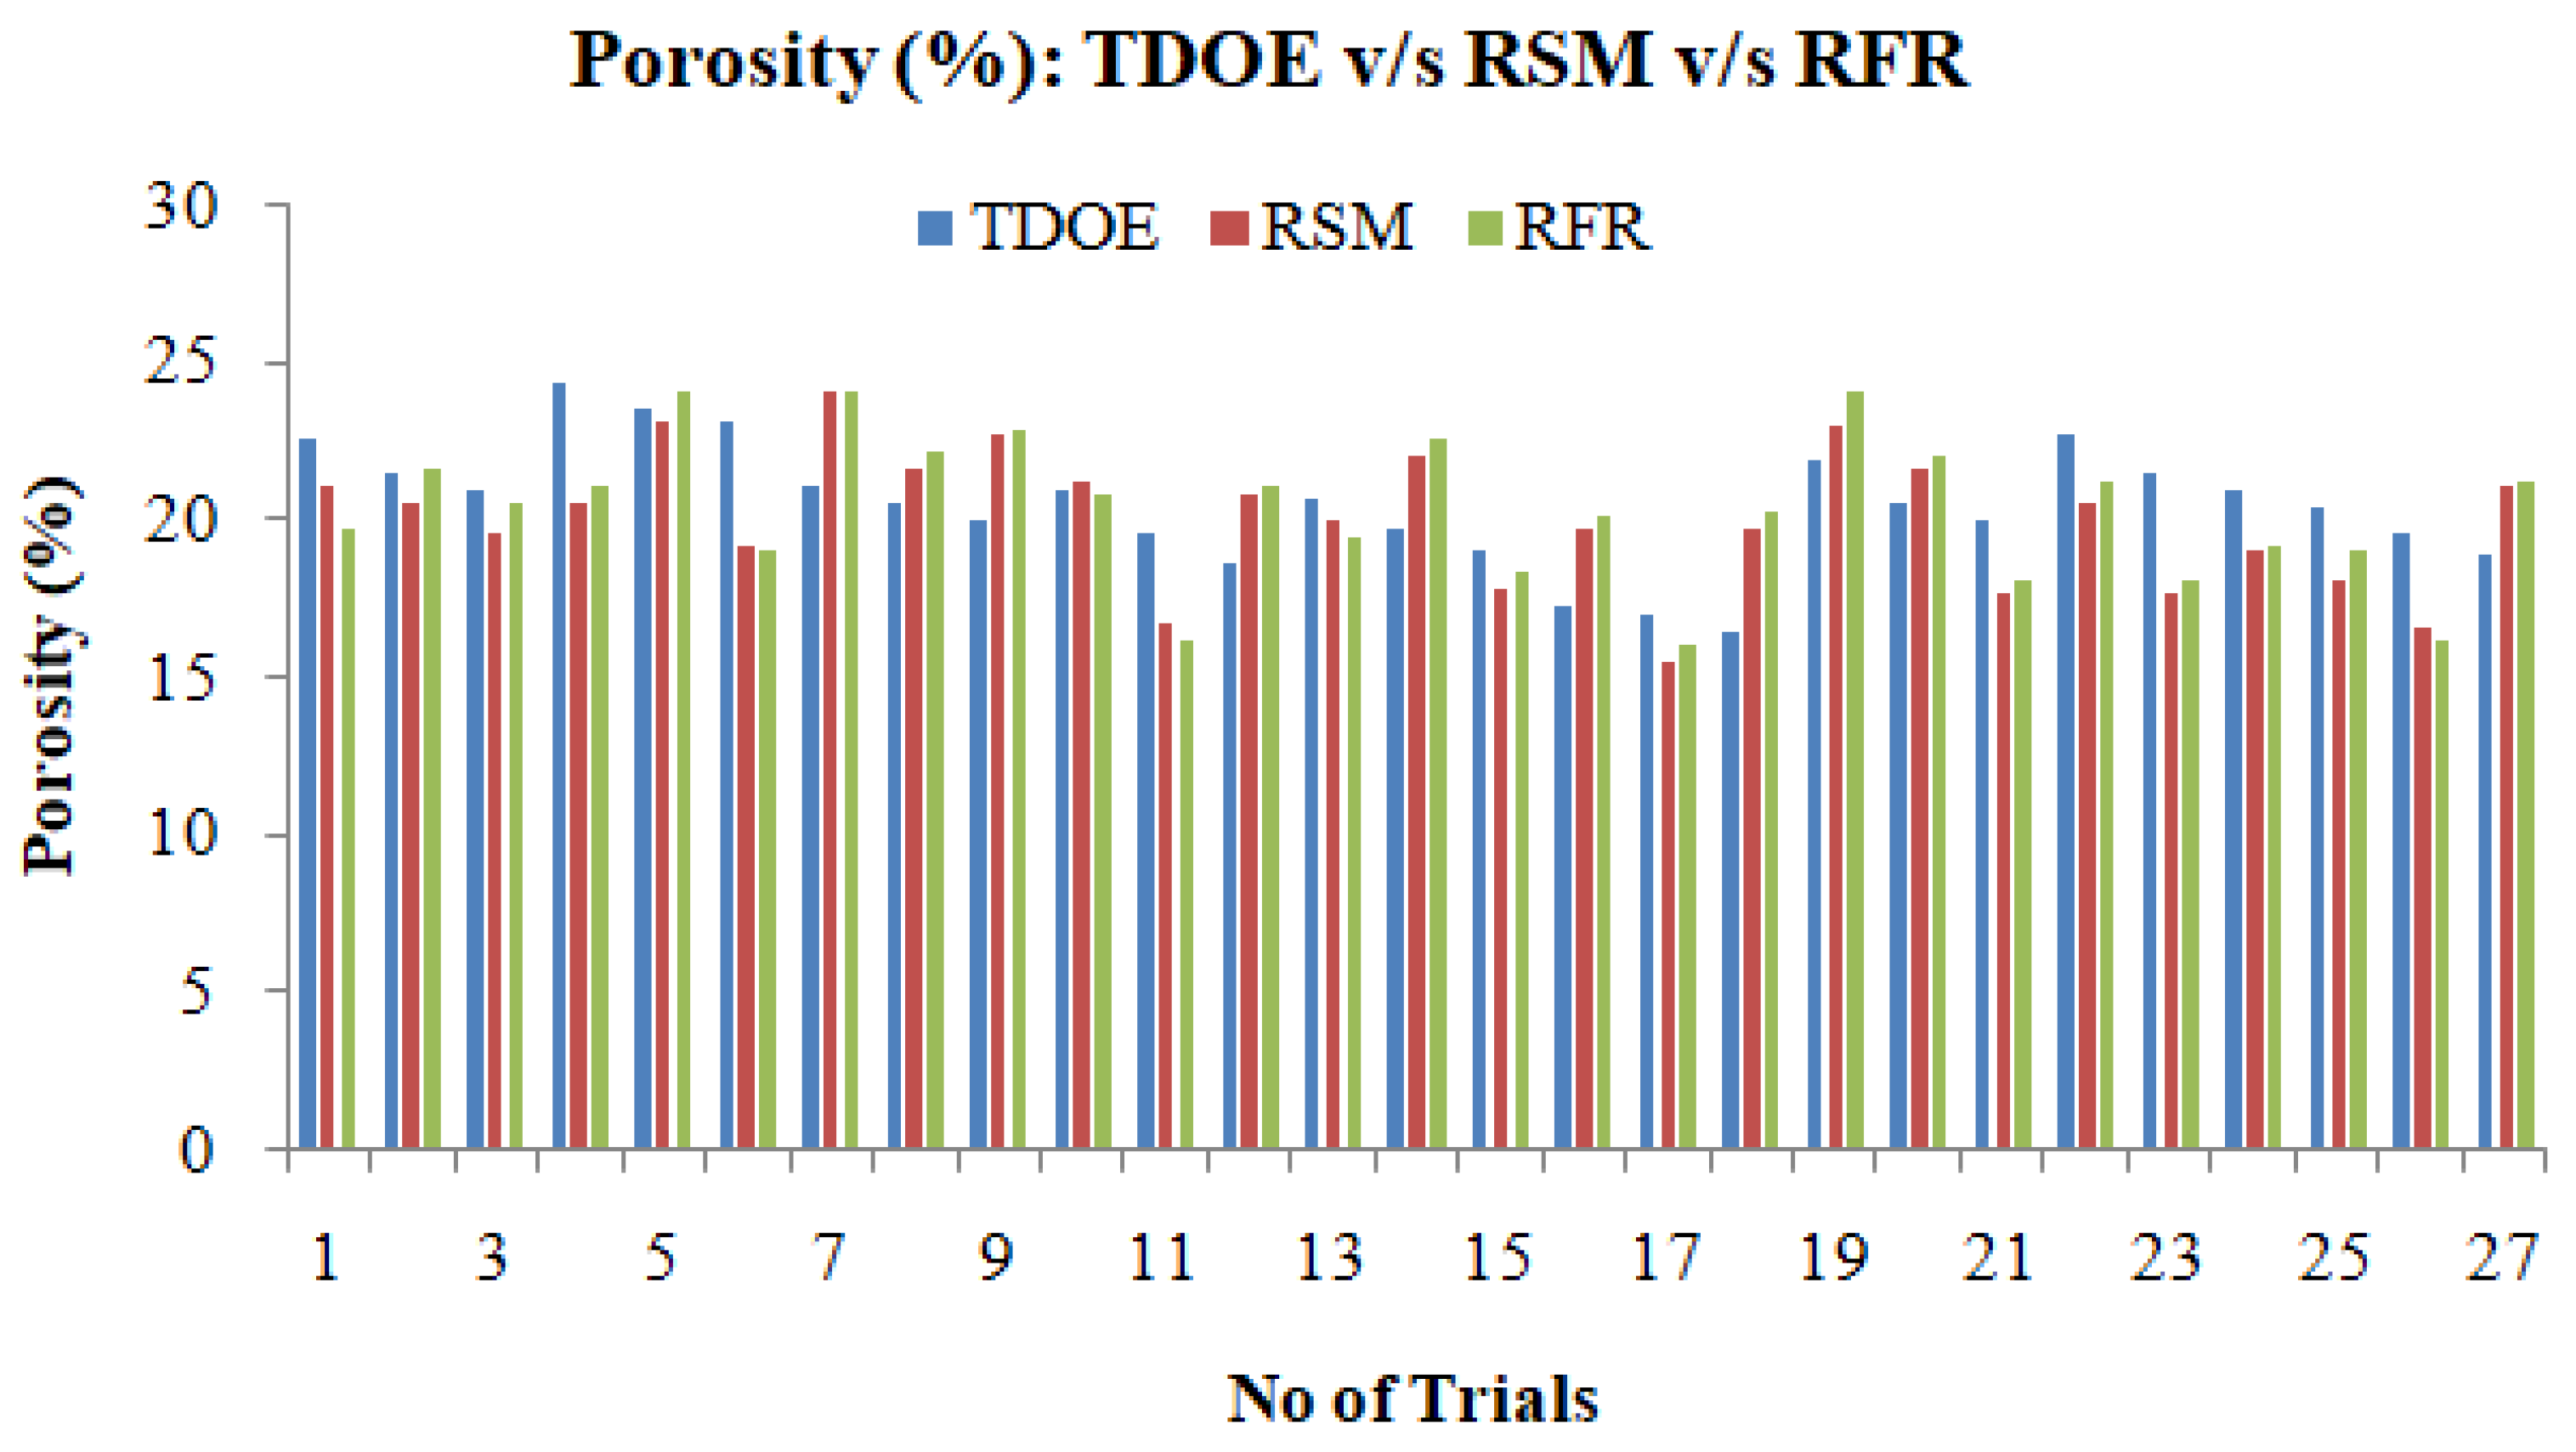
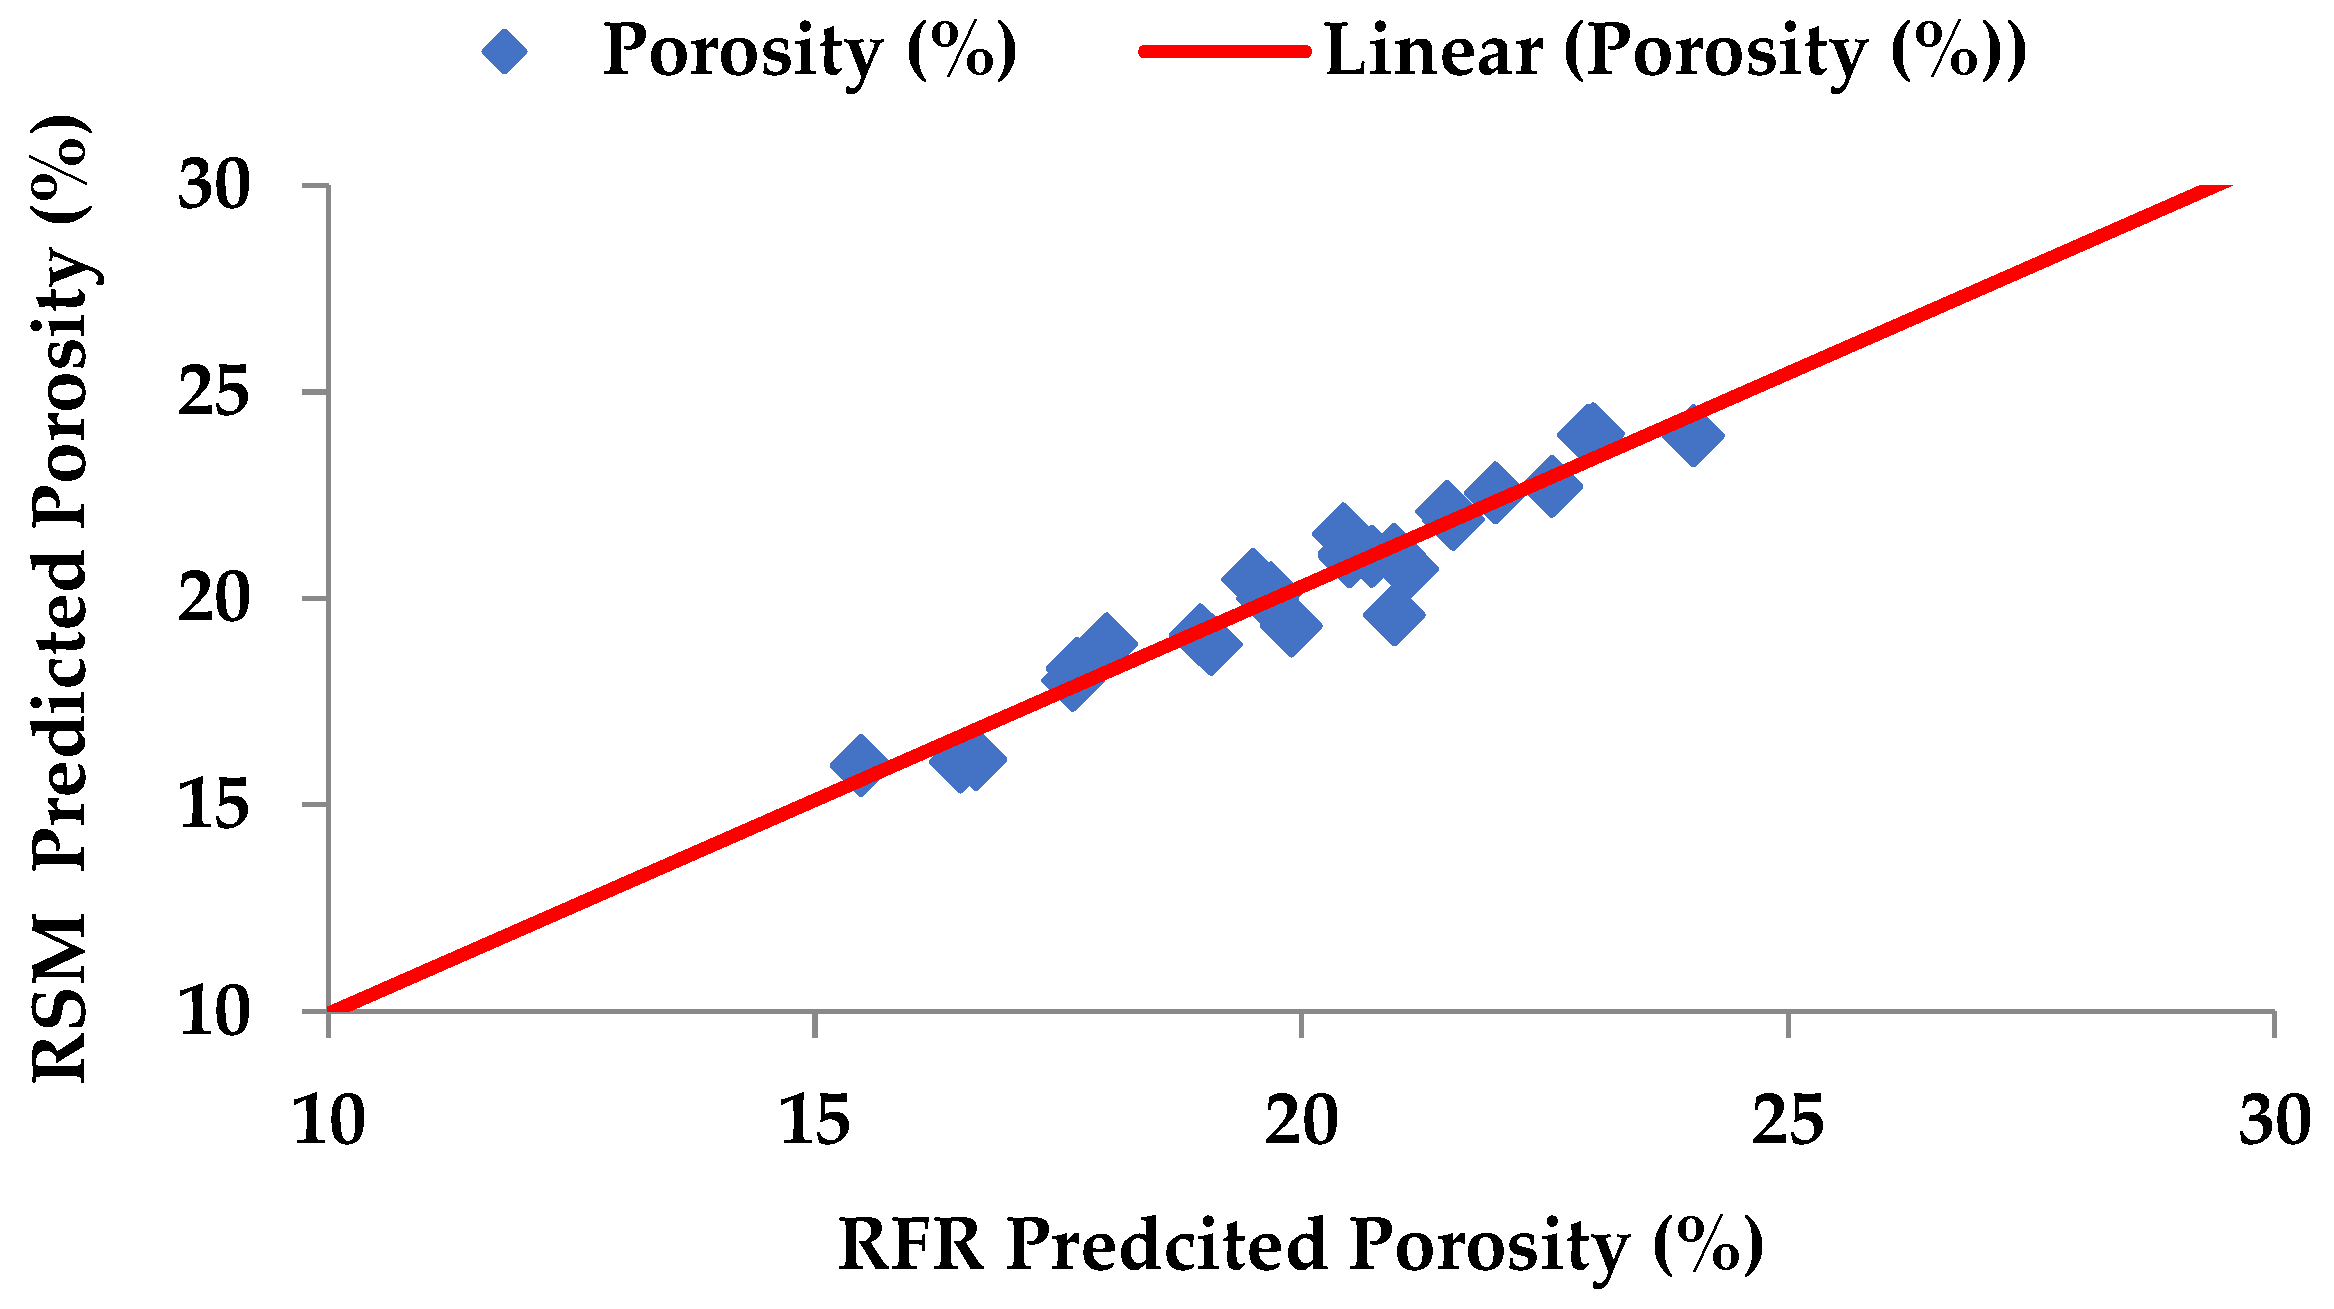
4.2. Porosity
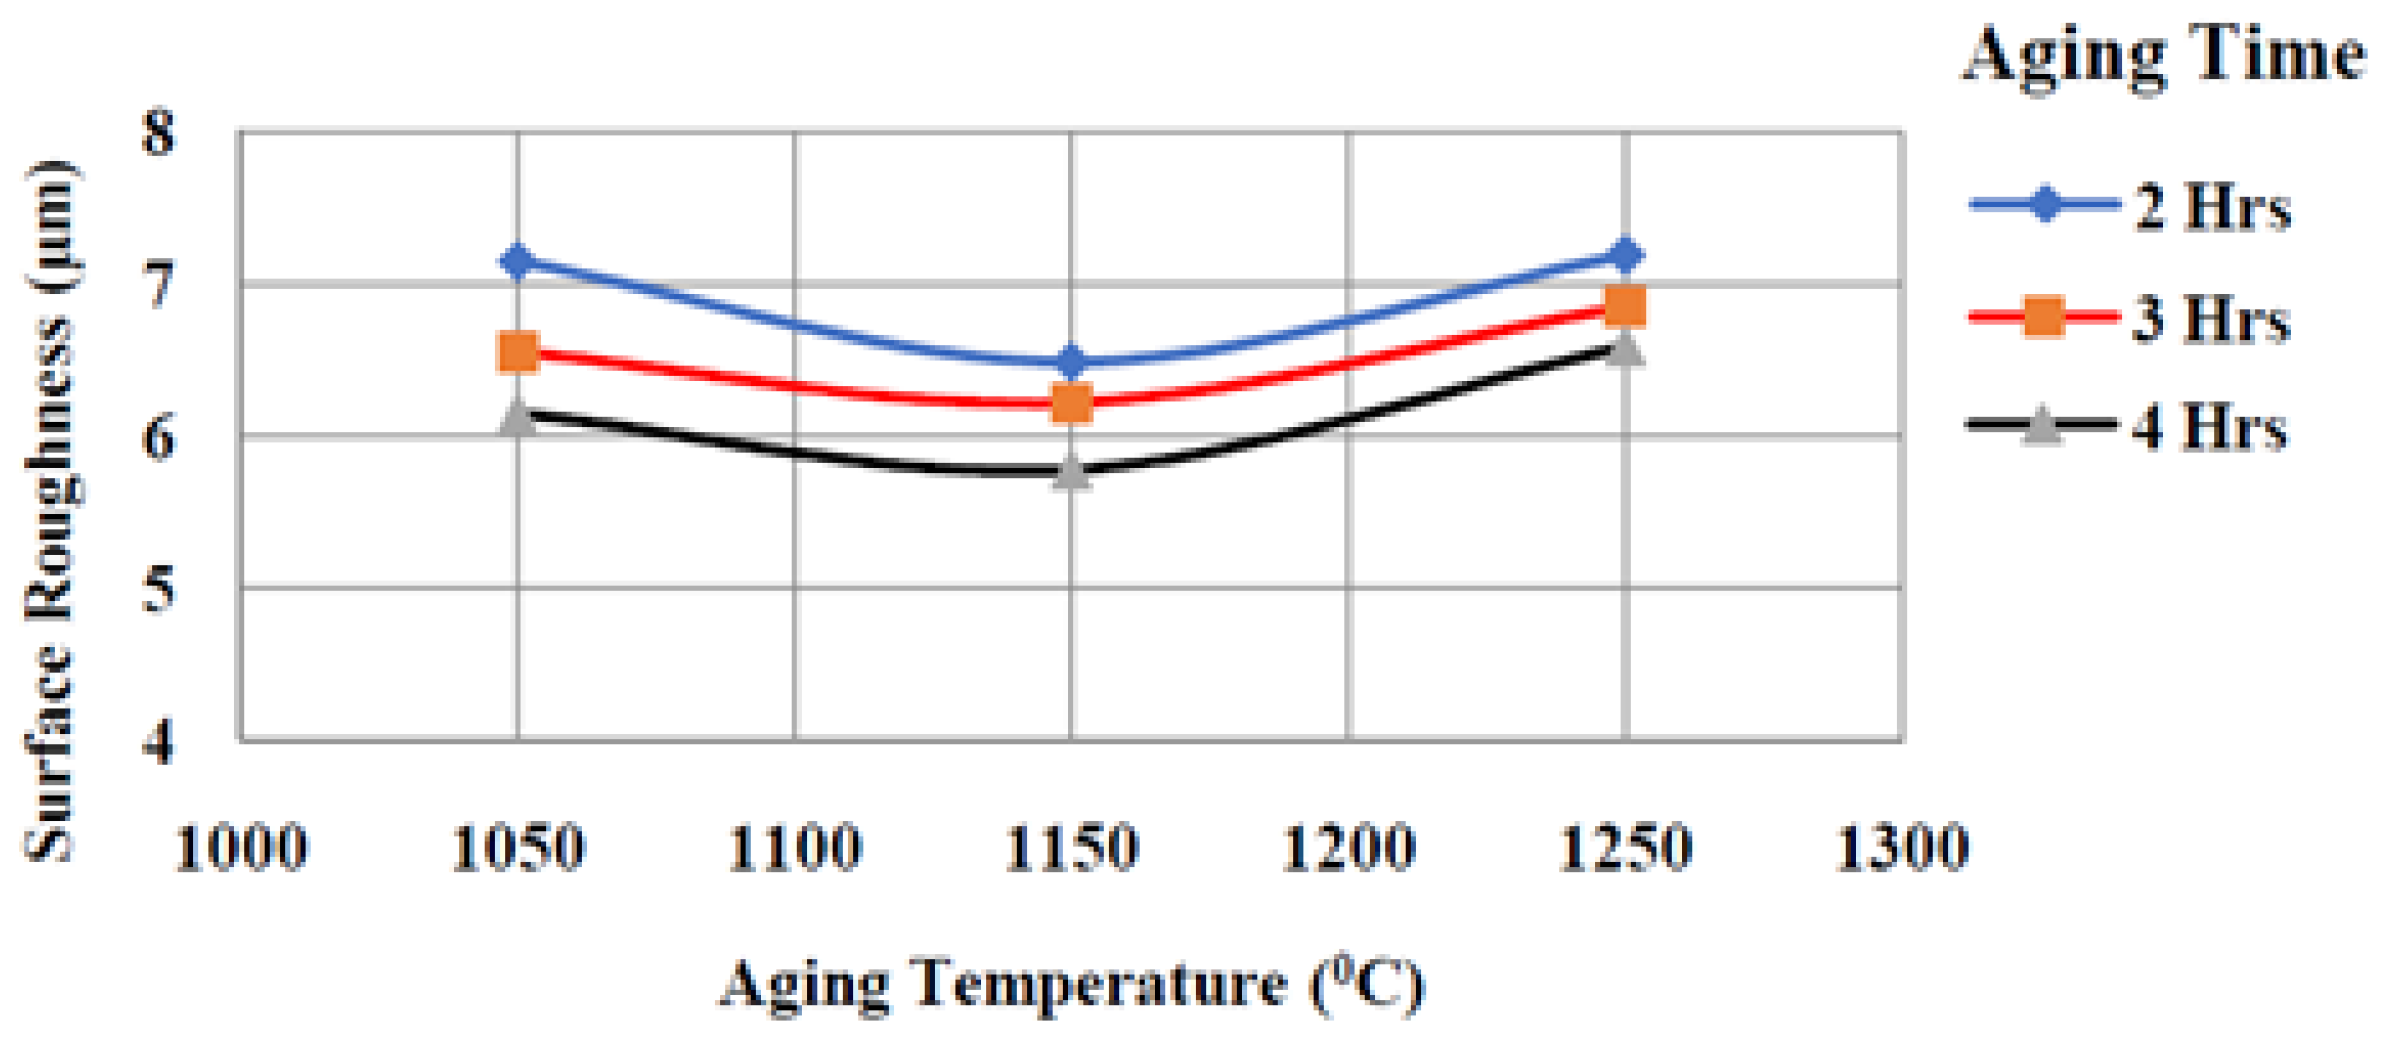
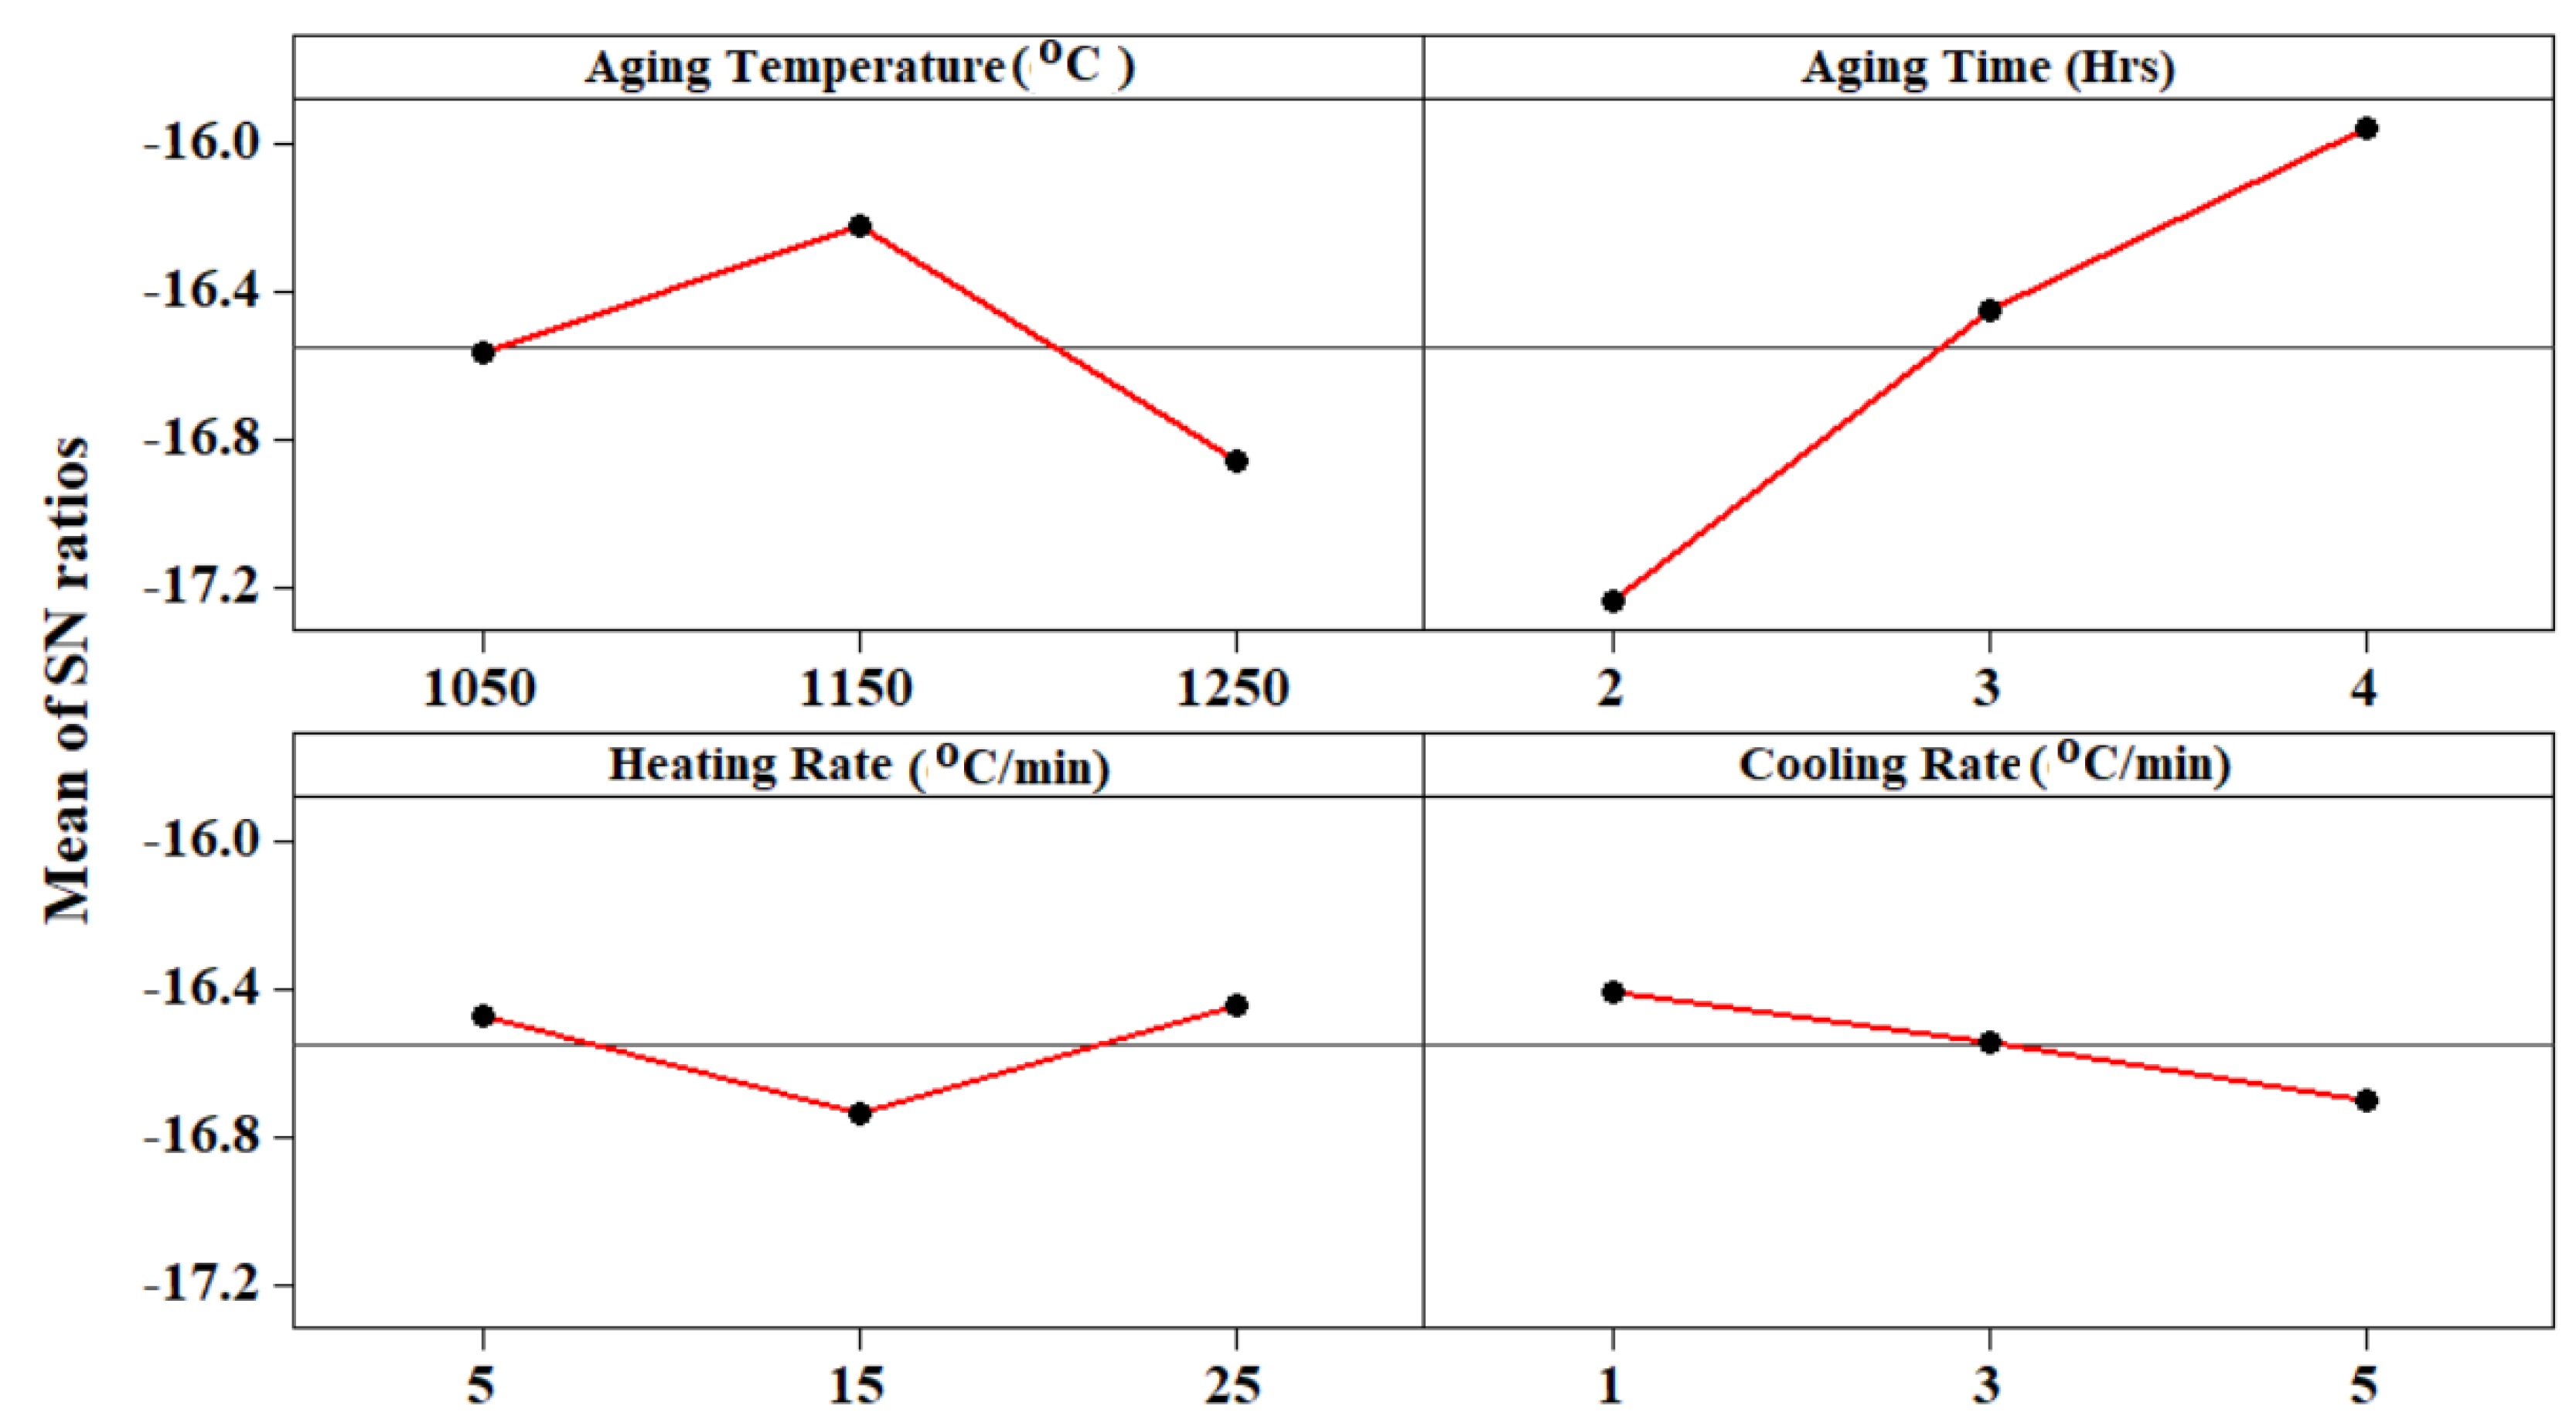
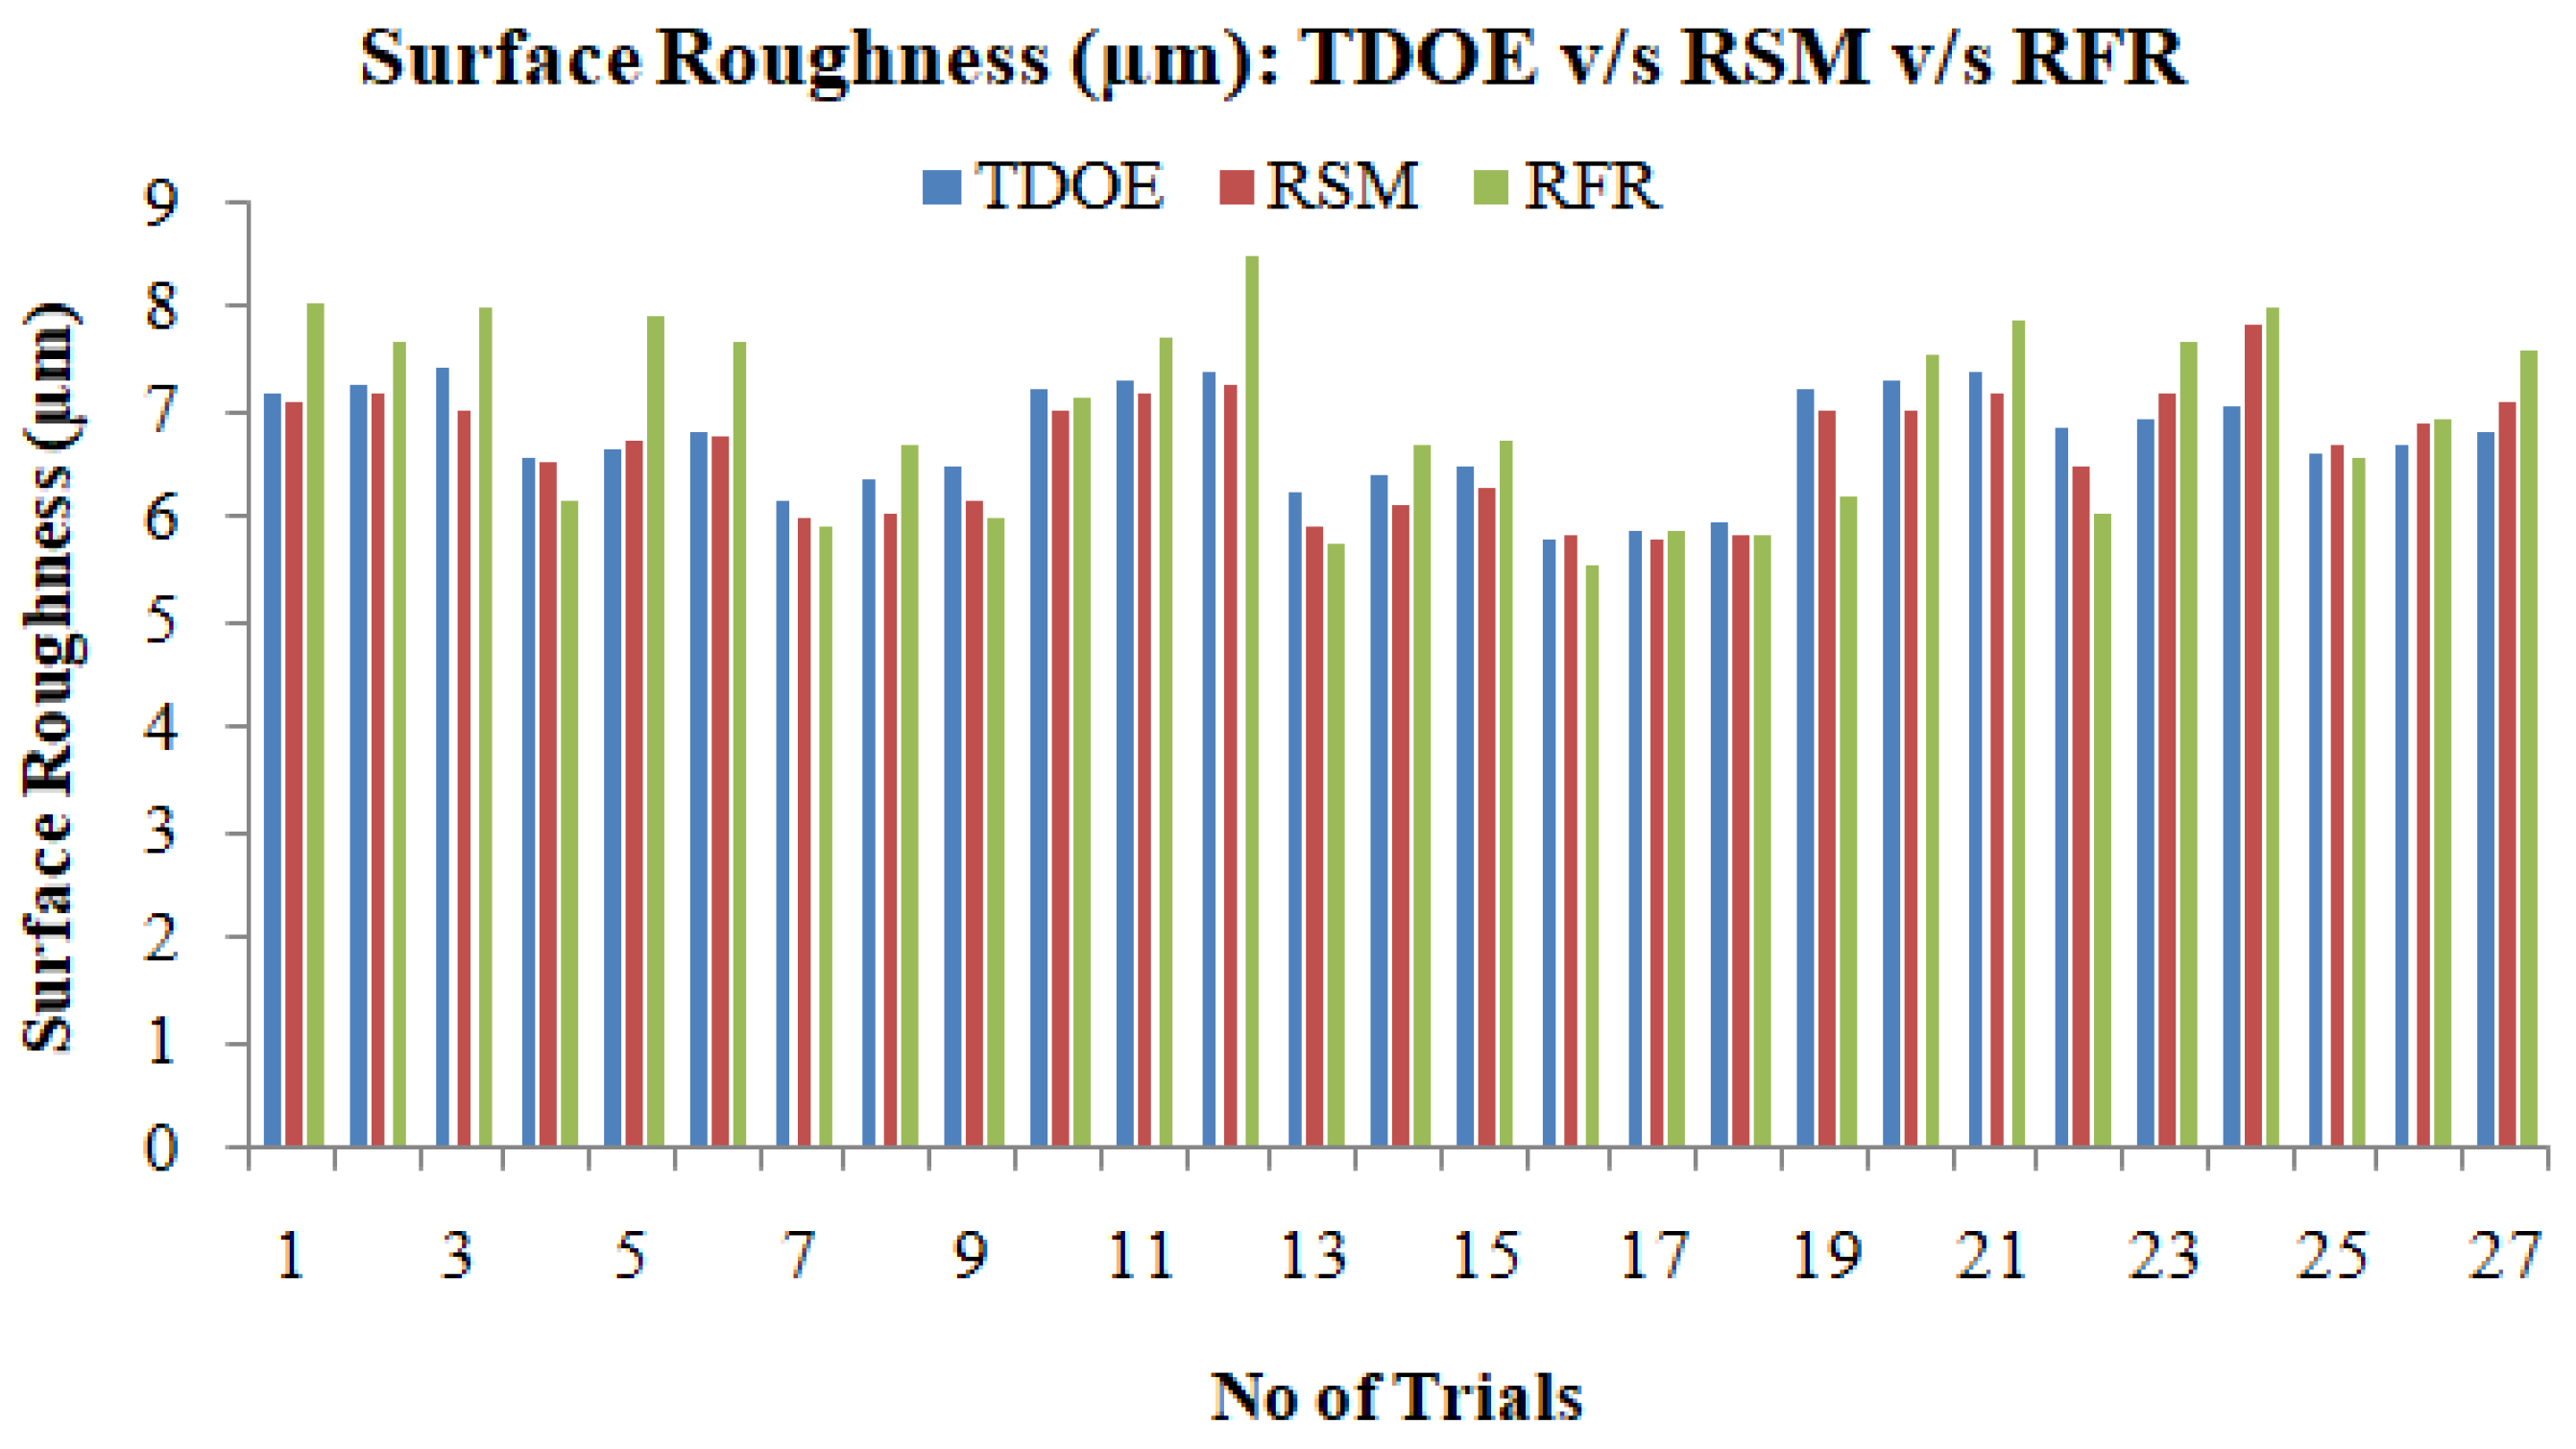
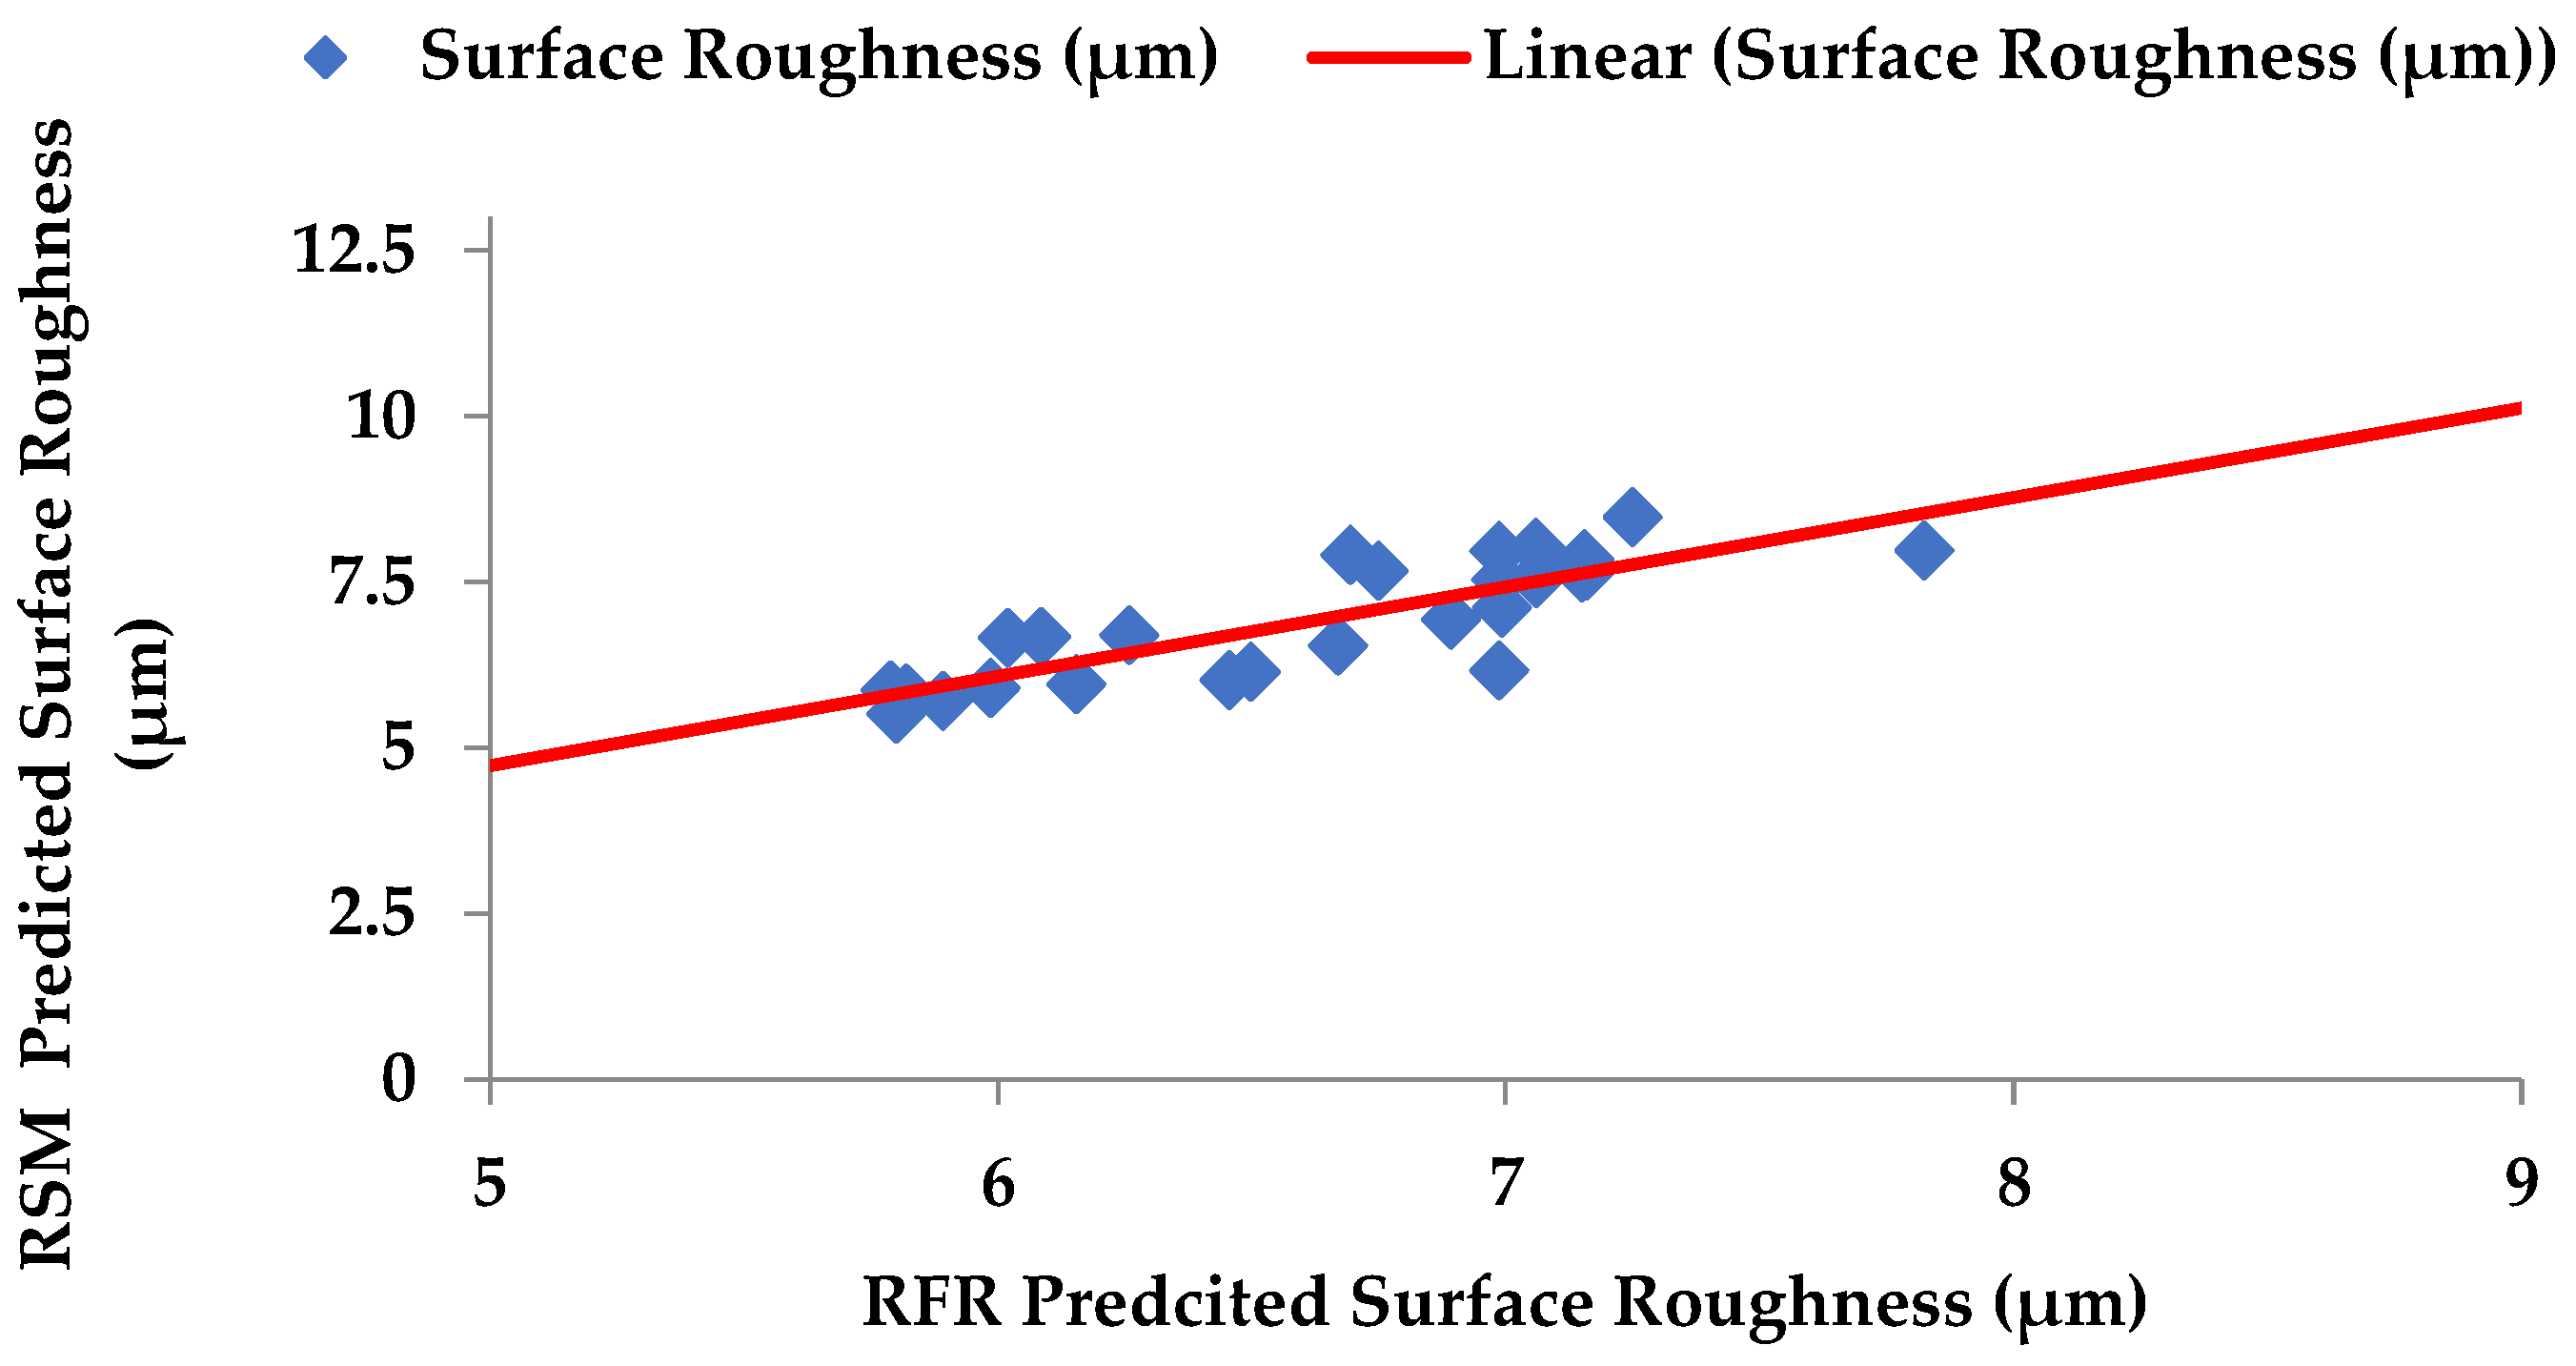
4.3. Surface Roughness
5. Conclusions
Author Contributions
Funding
Institutional Review Board Statement
Informed Consent Statement
Data Availability Statement
Acknowledgments
Conflicts of Interest
References
- Purazrang, K.; Kainer, K.U.; Mordike, B.L. Fracture toughness behavior of a magnesium alloy metal-matrix composite produced by the infiltration technique. Composites 2011, 22, 456–462. [Google Scholar] [CrossRef]
- Tzamtzis, S.; Barekar, N.S.; Hari Babu, N.; Patel, J.; Dhindaw, B.K.; Fan, Z. Processing of advanced Al/SiC particulate metal matrix composites under intensive shearing—A novel rheo-process. Compos. Part A Appl. Sci. Manuf. 2009, 40, 144–151. [Google Scholar] [CrossRef]
- Miracle, D.B. Metal matrix composites—From science to technological significance. Compos. Sci. Technol. 2005, 65, 2526–2540. [Google Scholar] [CrossRef]
- Ragunath, A.S. Review on particulate-reinforced titanium matrix composites. Mater. Sci. 1997, 32, 1–16. [Google Scholar]
- Poletti, C.; Merstallinger, A.; Schubert, T.; Marketz, W.; Degischer, H.p. Wear and Friction Coefficient of Particle Reinforced Ti-Alloys. Mater. Wiss. Werkst. 2009, 35, 741–749. [Google Scholar] [CrossRef]
- Peters, M.; Leyens, C. Titan und Titanlegierungen Weinheim; Wiley VCH: Weinheim, Germany, 2002. [Google Scholar]
- Godfrey, T.; Goodwin, P.s.; Ward, C.M. Titanium’99. In Proceedings of the Ninth World Conference of Titanium, Saint-Petersburg, Russia, 7–11 June 1999; pp. 1868–1877. [Google Scholar]
- Djanarthany, S.; Viala, J.; Bouix, J. Development of SiC/TiAl composites: Processing and interfacial phenomena. Mater. Sci. Eng. A 2001, 300, 211–218. [Google Scholar] [CrossRef]
- Tabrizi, S.G.; Babakhani, A.; Sajjadi, S.A.; Lü, W.-j. Microstructural aspects of in-situ TiB reinforced Ti–6Al–4V composite processed by spark plasma sintering. Trans. Nonferrous Met. Soc. China 2015, 25, 1353–1714. [Google Scholar]
- Kimi, Y.; Choim, J.; Kimy, J.; Lee, Y.Z. Friction and wear behavior of titanium matrix (TiB+TiC) composites. Wear 2011, 271, 1962–1965. [Google Scholar] [CrossRef]
- Oh, J.C.; Yun, E.; Golkovski, M.G.; Lee, S. Improvement of hardness and wear resistance in SiC/Ti–6Al–4V surface composites fabricated by high-energy electron beam irradiation. Mater. Sci. Eng. A 2003, 351, 98–108. [Google Scholar] [CrossRef]
- Abderrazak, H.; Abdellaoui, M. Synthesis and characterization of nano structured silicon carbide. Mater. Lett. 2008, 62, 3839–3841. [Google Scholar] [CrossRef]
- Zhang, Y.Z.; Huang, L.J.; Liu, B.X.; Geng, L. Hot deformation behavior of in-situ TiBw/Ti6Al4V composite with novel network reinforcement distribution. Trans. Nonferrous Met. Soc. China 2012, 22, 465–471. [Google Scholar] [CrossRef]
- Recep, C.; Muharrem, P. The effect of reinforcement volume ratio on porosity and thermal conductivity in Al–MgO composites. Mater. Res. 2012, 15, 1057–1063. [Google Scholar]
- Kok, M. Production of Metal Matrix (Al2O3-Reinforced) Composite Materials and Investigation of Their Machinability by Ceramic Tools; Firat University: Elazıg, Turkey, 2000. [Google Scholar]
- Ghosh, P.K.; Ray, S. Influence of process parameters on the porosity content in Mg–alumina cast particulate composite produced by vortex method. Trans. Am. Foundry Soc. 1988, 214, 775–782. [Google Scholar]
- Montealegre, M.; Neubauere, A.; Torralba, J.M. Influence of nano-reinforcements on the mechanical properties and microstructure of titanium matrix composites. Compos. Sci. Technol. 2011, 71, 1154–1162. [Google Scholar] [CrossRef]
- Dinesh, K.K.; Geeta, A.; Rajesh, P. Properties and characterization of Al–Al2O3 composites processed by casting and powder metallurgy routes (Review). Int. J. Latest Trends Eng. Technol. 2013, 2, 486–496. [Google Scholar]
- Oh, J.M.; Heo, K.H.; Kim, W.B.; Choi, G.S.; Lim, J.W. Sintering properties of Ti6Al4V alloys prepared using Ti/TiH2 powders. Mater. Trans. 2013, 54, 119–121. [Google Scholar] [CrossRef]
- Naranje, V.; Sankar, A.R.; Salunke, S.; Bachchhav, B.D. Experimental Evaluation of Mechanical properties of Epoxy based composite material using Taguchi Method. In Advances in Manufacturing Processes; Springer: Singapore, 2021; pp. 381–395. [Google Scholar]
- Chauhan, V.; Karki, T.; Varis, J. Optimization of Compression Molding Process Parameters for NFPC manufacturing using Taguchi’s Design of Experiment and Modlflow Analysis. Processes 2021, 9, 1853. [Google Scholar] [CrossRef]
- Shetty, R.; Hegde, A. Taguchi based fuzzy logic model for optimization and prediction of surface roughness during AWJM of DRCUFP composites. Manuf. Rev. 2022, 9, 2. [Google Scholar]
- Karthik, S.R.; Londe, N.; Shetty, R.; Nayak, R.; Hegde, A. Optimization and prediction of hardness, wear and surface roughness on age hardened Stellite 6 alloys. Manuf. Rev. 2022, 9, 10. [Google Scholar]
- Fuseini, M.; Zaghloul, M.M.Y. Qualtitative and Statstical Approaches of the electrophoretic deposition kinetics of polyaniline copper coating. Prog. Org. Coat. 2020, 171, 107015. [Google Scholar] [CrossRef]
- Zaghloul, M.M.Y.; Mai, M.Y.Z. Experimental and modeling analysis of mechanical-electrical behaviors of polypropylene composites filled with graphite and MWCNT fillers. Mater. Prop. 2007, 63, 467–474. [Google Scholar] [CrossRef]
- Zaghloul, M.M.Y.; Mai, M.Y.Z. Developments in polyester composite materials—An in depth revuew on natural fibers and nano fillers. Compos. Struct. 2021, 278, 114698. [Google Scholar] [CrossRef]
- Zaghloul, M.M.Y.; Yasser, S.M.; El-Gamal, H. Fatigue and tensile behaviors of fiber-reinforced thermosetting composites embedded with nano-particles. J. Compos. Mater. 2018, 53, 709–718. [Google Scholar] [CrossRef]
- Zaghloul, M.M.Y.; Mai, M.Y.Z. Influence of flame retardant magnesium hydroxide on the mechanical properties of high density polyethylene composites. J. Reinf. Plast. Compos. 2017, 36, 1802–1816. [Google Scholar] [CrossRef]
- Zaghloul, M.M.Y. Mechanical Properties of linear low-density polyethylene fire-retarded with melamine polyphosphate. J. Appl. Polym. Sci. 2018, 135, 46770. [Google Scholar] [CrossRef]
- Prathviraj, N.; Udupa, S. Ad-hoc Network Experimental Design with Taguchi Method to Analyze Performance of Routing Protocols. Eng. Sci. 2022, 19, 83–88. [Google Scholar]
- Shahabaz, S.M.; Sharma, S.; Shetty, N.; Shetty, S.D.; Gowrishankar, M.C. Influence of temperature on mechanical properties and machining of fibre reinforced polymer composites: A review. Eng. Sci. 2021, 16, 26–46. [Google Scholar] [CrossRef]
- Kowshik, S.; Sharma, S.; Rao, U.S.; Shettar, M.; Hiremath, P.; Upadhyaya, A. Investigation on the Effects of Uncarbonised, Carbonised and Hybrid Eggshell Filler Addition on the Mechanical Properties of Glass Fibre/Polyester Composites. Eng. Sci. 2022, 18, 121–131. [Google Scholar] [CrossRef]
- Kamath, G.B.; Subramaniam, K.; Devesh, S.; Chavan, V.; Mohan, N.; Bhat, R.; Wijerathne, H.T. Multi-Response Optimization of Milling Process Parameters for Aluminium-Titanium Diboride Metal Matrix Composite Machining Using Taguchi-Data Envelopment Analysis Ranking Approach. Eng. Sci. 2022, 18, 271–277. [Google Scholar] [CrossRef]
- Shetty, R.; Pai, R.B.; Rao, S.S.; Nayak, R. Taguchi’s technique in machining of metal matrix composites. J. Braz. Soc. Mech. Sci. Eng. 2009, 31, 12–20. [Google Scholar] [CrossRef]
- Shetty, R.; Pai, R.; Rao, S.S. Experimental studies on Turning of Discontinuously Reinforced Aluminium Composites under Dry, Oil Water Emulsion and Steam Lubricated Conditions using Taguchi’s Technique. Gazi Univ. J. Sci. 2009, 22, 21–32. [Google Scholar]
- Shetty, R.; Barboza, B.V.A.; Nayak, R. Mechanical and Machinability study on discontinuously reinforced sisal fibre polyester composite laminates. Mater. Res. Express 2019, 6, 105370. [Google Scholar] [CrossRef]
- Shetty, R.; Pai, R.; Barboza, A.B.V.; Gandhi, V.P. Processing, mechanical characterization and its tribological study of discontinuously reinforced Caryota Urens Fibre Polyester composites. ARPN J. Eng. Appl. Sci. 2018, 13, 12. [Google Scholar]
- Elmushyakhi, A. Parametric characterization of nano-hybrid wood polymer composites using ANOVA and regression analysis. Structures 2021, 29, 652–662. [Google Scholar] [CrossRef]
- Bhushan, R.K. Minimising tool wear by optimization (ANOVA) of cutting parameters in machining of 7075Al Alloy SiC particle composite. Aust. J. Mech. Eng. 2021, 1–19. [Google Scholar] [CrossRef]
- Shetty, A.A.; Shetty, R.; Hegde, N.T.; Vaz, A.C.; Srinivasan, C.R. A study on the effect of Radiometric Variations on a Fuzzy Stereo Matching Algorithm: A Statistical Analysis. Eng. Sci. 2021, 16, 269–280. [Google Scholar] [CrossRef]
- Rochardjo, H.S.; Budiyantoro, C. Manufacturing and analysis of overmolded hybrid fiber polyamide 6 composite. Polymers 2021, 13, 3820. [Google Scholar] [CrossRef]
- Breiman, L. Random forests. Mach. Learn. 2001, 45, 5–32. [Google Scholar] [CrossRef]
- Pavlov, Y.L. Random Forests; Taylor & Francis Group: Boca Raton, FL, USA, 2009; pp. 1–122. [Google Scholar] [CrossRef]
- Wu, M.; Liu, L.; Han, Y. Material genetic engineering—Material design, simulation and top-level design of database. Mod. Sci. 2018, 10, 53–58. [Google Scholar]
- Kazi, M.K.; Eljack, F.; Mahdi, E. Optimal filler content for cotton fiber/PP composite based on mechanical properties using artificial neural network. Compos. Struct. 2020, 251, 112654. [Google Scholar] [CrossRef]
- Jiang, H.; Xiao, Y.; Li, J.; Liu, X. Prediction of the melt index based on the relevance vector machine withmodified particle swarm optimization. Chem. Eng. Technol. 2012, 35, 819–826. [Google Scholar] [CrossRef]
- Huang, J.S.; Liew, J.X.; Liew, K.M. Data-driven machine learning approach for exploring and assessing mechanical properties of carbon nanotube-reinforced cement composites. Compos. Struct. 2021, 267, 113917. [Google Scholar] [CrossRef]
- Lu, H.; Behbahani, S.; Ma, X.; Iseley, T. A multi-objective optimizer-based model for predicting composite material properties. Constr. Build. Mater. 2021, 284, 122746. [Google Scholar] [CrossRef]
- Daghigh, V.; Lacy, T.E.; Daghigh, H.; Gud, G.; Baghaeie, K.T.; Horstemeyerf, M.F.; Pittman, C.U., Jr. Heat deflection temperatures of bio-nano-composites using experiments and machine learning predictions. Mater. Today Commun. 2020, 22, 100789. [Google Scholar] [CrossRef]
- Ganesh, C.J.; Vijay, G.S.; Bekinal, S.I. Modelling of Interior Permanent Magnet Motor and Optimization of Its Torque Ripple and Cogging Torque Based on Design of Experiments and Artificial Neural Networks. Eng. Sci. 2022, 18, 193–203. [Google Scholar]
- Wu, Y.; Chen, E.; Weng, X.; He, Z.; Chang, G.; Pan, X.; Liu, J.; Huang, K.; Huang, K.; Lei, M. Conductive polyvinyl alcohol/silver nanoparticles hydrogel sensor with large draw ratio, high sensitivity and high stability for human behavior monitoring. Eng. Sci. 2022, 18, 113–120. [Google Scholar] [CrossRef]
- Sharma, A.K.; Singh, R.; Tiwari, A.K.; Sharma, A.K. Design, fabrication and analysis of compaction die for powder processing. In Proceedings of the IOP Conference Series: Materials Science and Engineering, Chennai, India, 16–17 September 2020; Volume 992, p. 012005. [Google Scholar] [CrossRef]


| Element | Al | V | Fe | O | C | N | Y | H | Ti |
|---|---|---|---|---|---|---|---|---|---|
| Wt (%) | 6.1 | 4 | 0.16 | 0.11 | 0.02 | 0.01 | 0.001 | 0.001 | Bal |
| Element | C | Fe2O3 | Si | Al2O3 | CaO | SiO2 | P | S | SiC |
|---|---|---|---|---|---|---|---|---|---|
| Wt (%) | 1.17 | 0.66 | 1.43 | 0.25 | 0.14 | 0.8 | 0.32 | 0.04 | Bal |
| Properties | Values (Units) |
|---|---|
| Density | 4.43 g/cm3 |
| Melting point | 1604–1660 °C |
| Beta transitional temperature | 980 °C |
| Tensile strength, ultimate | 1170 Mpa |
| Tensile strength, yield | 1100 Mpa |
| Compressive strength | 1070 Mpa |
| Modulus of elasticity | 114 Gpa |
| Brinell hardness | 379 BHN |
| Elongation at break | 10% |
| Properties | Values (Units) |
|---|---|
| Density | 3.1 g/cm3 |
| Melting point | 2730 °C |
| Beta transitional temperature | 2000 °C |
| Tensile strength, ultimate | 390 Mpa |
| Compressive strength | 2000 Mpa |
| Modulus of elasticity | 410 Gpa |
| Vicker’shardness | 2720 Hv |
| Elongation at break | 0% |
| Control Factors | Levels | ||
|---|---|---|---|
| 1 | 2 | 3 | |
| Aging temperature (°C) | 1050 | 1150 | 1250 |
| Aging time (h) | 2 | 3 | 4 |
| Heating rate (°C/min) | 5 | 15 | 25 |
| Cooling rate (°C/min) | 1 | 3 | 5 |
| Control Factors | Levels | |
|---|---|---|
| 1 | 3 | |
| Aging temperature (°C) | 1050 | 1250 |
| Aging time (h) | 2 | 4 |
| Heating rate (°C/min) | 5 | 25 |
| Cooling rate (°C/min) | 1 | 5 |
| Algorithm: Random forest modeling. |
| Input: Ti-6Al-4V- SiCp |
| Output: Hardness, porosity, and surface roughness |
| Source | DF | Seq SS | Adj SS | AdjMS | F | P | P% |
|---|---|---|---|---|---|---|---|
| A | 2 | 5.0606 | 5.0606 | 2.5303 | 124.7 | 0.000 | 0.0 |
| B | 2 | 0.7590 | 0.7590 | 0.3795 | 18.72 | 0.003 | 0.15 |
| C | 2 | 0.1894 | 0.1894 | 0.0947 | 4.67 | 0.060 | 3.15 |
| D | 2 | 1.0789 | 1.0789 | 0.5399 | 26.63 | 0.001 | 0.05 |
| A × D | 4 | 0.0191 | 0.0191 | 0.0047 | 0.24 | 0.908 | 47.8 |
| B × D | 4 | 0.0161 | 0.0161 | 0.0154 | 0.76 | 0.586 | 0.31 |
| C × D | 4 | 0.0165 | 0.0165 | 0.0041 | 0.20 | 0.927 | 48.54 |
| Residual Error | 6 | 0.1216 | 0.1216 | 0.0202 | |||
| Total | 26 | 7.3082 | 100 |
| Source | DF | Seq SS | Adj SS | Adj MS | F | P |
|---|---|---|---|---|---|---|
| Regression | 14 | 10,841.1 | 10,841.12 | 774.37 | 13.63 | 0.000 |
| Residual error | 14 | 795.5 | 795.53 | 56.82 | ||
| Total | 29 | 11,636.7 |
| Source | DF | Seq SS | Adj SS | Adj MS | F | P | P% |
|---|---|---|---|---|---|---|---|
| A | 2 | 8.4084 | 8.4084 | 4.2042 | 168.59 | 0.000 | 0.00 |
| B | 2 | 6.2052 | 6.2052 | 3.1026 | 124.41 | 0.000 | 0.00 |
| C | 2 | 0.7338 | 0.7338 | 0.3668 | 14.71 | 0.005 | 0.21 |
| D | 2 | 2.0230 | 2.0230 | 1.0114 | 40.56 | 0.000 | 0.00 |
| A × D | 4 | 0.0403 | 0.0403 | 0.0100 | 0.40 | 0.800 | 34.72 |
| B × D | 4 | 0.0876 | 0.0876 | 0.0219 | 0.88 | 0.529 | 22.96 |
| C × D | 4 | 0.0121 | 0.0121 | 0.0030 | 0.12 | 0.970 | 42.1 |
| Residual error | 6 | 0.1496 | 0.1496 | 0.0249 | |||
| Total | 26 | 17.660 |
| Source | DF | Seq SS | Adj SS | Adj MS | F | P |
|---|---|---|---|---|---|---|
| Regression | 14 | 38.0486 | 38.0486 | 2.7178 | 10.00 | 0.000 |
| Residual error | 14 | 3.8064 | 3.8064 | 0.2719 | ||
| Total | 29 | 61.4427 |
| Source | DF | Seq SS | Adj SS | Adj MS | F | P | P% |
|---|---|---|---|---|---|---|---|
| A | 2 | 1.8327 | 1.8327 | 0.9163 | 10.10 | 0.012 | 0.35 |
| B | 2 | 7.4742 | 7.4742 | 3.7371 | 41.21 | 0.000 | 0.00 |
| C | 2 | 0.4671 | 0.4671 | 0.2335 | 2.57 | 0.156 | 4.63 |
| D | 2 | 0.3761 | 0.3761 | 0.1880 | 2.07 | 0.207 | 6.14 |
| A × D | 4 | 0.0117 | 0.0117 | 0.0029 | 0.03 | 0.997 | 29.59 |
| B × D | 4 | 0.0066 | 0.0066 | 0.0016 | 0.02 | 0.999 | 29.65 |
| C × D | 4 | 0.0093 | 0.0093 | 0.0023 | 0.03 | 0.998 | 29.62 |
| Residual error | 6 | 0.5442 | 0.5442 | 0.0906 | |||
| Total | 26 | 10.7218 | 3.369 | 100 |
| Source | DF | Seq SS | Adj SS | AdjMS | F | P |
|---|---|---|---|---|---|---|
| Regression | 14 | 10.8982 | 10.8982 | 0.7784 | 3.53 | 0.012 |
| Residual error | 14 | 3.0889 | 3.0889 | 0.2206 | ||
| Total | 29 | 23.9554 |
Publisher’s Note: MDPI stays neutral with regard to jurisdictional claims in published maps and institutional affiliations. |
© 2022 by the authors. Licensee MDPI, Basel, Switzerland. This article is an open access article distributed under the terms and conditions of the Creative Commons Attribution (CC BY) license (https://creativecommons.org/licenses/by/4.0/).
Share and Cite
Hegde, A.L.; Shetty, R.; Chiniwar, D.S.; Naik, N.; Nayak, M. Optimization and Prediction of Mechanical Characteristics on Vacuum Sintered Ti-6Al-4V-SiCp Composites Using Taguchi’s Design of Experiments, Response Surface Methodology and Random Forest Regression. J. Compos. Sci. 2022, 6, 339. https://doi.org/10.3390/jcs6110339
Hegde AL, Shetty R, Chiniwar DS, Naik N, Nayak M. Optimization and Prediction of Mechanical Characteristics on Vacuum Sintered Ti-6Al-4V-SiCp Composites Using Taguchi’s Design of Experiments, Response Surface Methodology and Random Forest Regression. Journal of Composites Science. 2022; 6(11):339. https://doi.org/10.3390/jcs6110339
Chicago/Turabian StyleHegde, Adithya Lokesh, Raviraj Shetty, Dundesh S Chiniwar, Nithesh Naik, and Madhukara Nayak. 2022. "Optimization and Prediction of Mechanical Characteristics on Vacuum Sintered Ti-6Al-4V-SiCp Composites Using Taguchi’s Design of Experiments, Response Surface Methodology and Random Forest Regression" Journal of Composites Science 6, no. 11: 339. https://doi.org/10.3390/jcs6110339
APA StyleHegde, A. L., Shetty, R., Chiniwar, D. S., Naik, N., & Nayak, M. (2022). Optimization and Prediction of Mechanical Characteristics on Vacuum Sintered Ti-6Al-4V-SiCp Composites Using Taguchi’s Design of Experiments, Response Surface Methodology and Random Forest Regression. Journal of Composites Science, 6(11), 339. https://doi.org/10.3390/jcs6110339