Article

Synthesis and Characterization of Carbon Fiber Nanocomposite Using Titanium Dioxide and Silicon Carbide Nanomaterials

by
Shiva Chandan Reddy Modugu
*,
Jens Schuster
and
Yousuf Pasha Shaik
Department of Applied Logistics and Polymer Sciences, University of Applied Sciences Kaiserslautern, 66953 Pirmasens, Germany
*
Author to whom correspondence should be addressed.
J. Compos. Sci. 2022, 6(10), 312; https://doi.org/10.3390/jcs6100312
Submission received: 5 September 2022 / Revised: 29 September 2022 / Accepted: 8 October 2022 / Published: 13 October 2022
(This article belongs to the Section Nanocomposites)

Abstract

:
Carbon fiber reinforced polymers (CFRPs) have spread to a wide range of industries in recent decades, including the automobile, aeronautics, and space industries. Recently, the emergence of new requirements for improved properties and features has become one of the major drivers of the introduction of innovative methodologies and process optimization. In this study, the effect of nanomaterials on the behavior of carbon fiber-reinforced polymer (CFRP) composites was investigated experimentally. The grafting of TiO2 and SiC nanomaterials onto the surface of fibers was performed by mixing nanomaterials in the epoxy resin. CFRPs were manufactured using vacuum assisted resin transfer molding (VARTM) in this study and characterized using mechanical and thermal testing. The primary test parameters were carbon fiber with epoxy resin and 0% nanomaterials by weight. An increase in properties was observed in nanocomposite with 2% wt. of nanomaterials when compared with 0, 0.5, and 1% wt. Between 0 wt.% and 2 wt.%, the tensile strength, flexural strength, impact strength, hardness, and HDT properties were increased by 17%, 39%, 32%, 14% and 21%, respectively, due to the addition of nanomaterials into the resin.

1. Introduction

A composite material is composed of at least two materials, which combine to give properties superior to those of the individual constituents. Composite materials and specifically carbon fiber reinforced polymers (CFRPs) play a significant role as structural aerospace components due to their exceptional strength and stiffness-to-density/weight ratio [1]. Composites give us the ability to manufacture parts with complicated geometry using fewer components enabling manufacturers to save cost [2].
A nanomaterial is a material with nanoscale particles or constituents, or one produced by nanotechnology. The length range of nanomaterials is between 1 nm to 100 nm. While nanomaterials are certainly small, they have a comparatively large surface area. The main reason to introduce nano-materials into carbon fiber is nanomaterials are developed to exhibit novel characteristics compared to the same material without nanoscale features [3]. With only a reduction in size and no change in the substance itself, materials can exhibit new properties such as electrical conductivity, insulating behavior, elasticity, greater strength, and different color that the very same substances do not exhibit at the micro- or macro- scale [4]. The strength and stiffness of the composites can be altered in a desired direction by using different nanomaterials. The composite manufactured using nanomaterials or materials on the scale of nanometers are called nanocomposites [5].
Nano titanium dioxide can be used in a wide variety of applications such as self-cleaning surfaces and textiles, UV-resistant coatings and paints, disinfectant sprays, sunscreens, water treatment agents, and anticancer treatments. Nano-sized TiO2 has been used in cosmetic products for some time, in particular as an active ingredient in sunscreens, which absorb UV light [6]. TiO2 has an extremely high melting point of 1843 °C and boiling point of 2972 °C, so occurs naturally as a solid, and, even in its particle form, it is insoluble in water. TiO2 is also an insulator [7]. Aramid particles containing nanocomposites (epoxy resin with TiO2) exhibited the best wear and friction behavior under low amplitude oscillating wear conditions [8]. The small amount of nano-TiO2 would be effectively dispersed in polyamic acid colloidal particles. The polyimide-TiO2 hybrid nanocomposite coating carbon fiber sheet displayed an excellent photodegradation performance of methyl orange, which could be degraded more than 30 wt.% after 10 cycles [9]. In a study by Susan and others, homogeneous dispersion of TiO2 nanoparticles on carbon fiber was demonstrated to generate a piezoresistive carbon fiber polymer matrix composite with enhanced self-sensing capabilities. The results demonstrate an approach to improve the sensing capabilities, damping behavior, and mechanical strength of carbon fiber composites by simply adding nanoparticles to the fiber sizing using a commercially scalable deposition method [10]. Enhancements of the wear resistance of epoxy using various fillers like short carbon fiber, graphite, polytetrafluoroethylene (PTFE) and nano-TiO2, were investigated by Zhang and others. The best wear-resistant composition was achieved by a combination of nano-TiO2 with conventional fillers [11].
Silicon carbide (SiC) nanoparticles have high thermal conductivity, stability, purity, good wear resistance, and a low thermal expansion coefficient. At high temperatures, these particles are also resistant to oxidation [12]. From previous research, it was observed that with an increasing percentage of SiC filler particles, there is a decline in tensile and flexural strength but there is a significant improvement in hardness and erosion wear performance of glass fiber composites [13]. Another study showed that SiC particles compounded into carbon epoxy composites expanded the wear obstruction immensely. The highest wear resistance of the carbon epoxy composite was achieved with 10 wt.% of SiC filler [14]. The TiO2 nano additives are added to improve the strength, wear-out resistance, and hardness of the polymer composite. At 3 wt.% of TiO2, the flexural strength of 203.36 MPa was attained [15]. Crosby and Lee investigated the nano effect on the mechanical properties and discussed the properties of three components in a general polymer nanocomposite: the polymer matrix, the nanoscale filler and the interfacial region [16]. Bello and others investigated the effects of aluminum particles on the mechanical and morphological properties of epoxy nanocomposites. Their test results showed poor tensile performance of the aluminum micro-particle reinforced composites because of the weak interface between the matrix and the reinforcing particles which in turn depends on particle size [17]. Mohammad and others studied the effect of SiC/TiO2/Al2O3/graphene nanoparticles deposition on Kevlar fiber. TGA analysis shows that NPs deposition improves the thermal properties of the fiber i.e graphene with binder improving the decomposition temperature by 21.6%. Tensile strength and young’s modulus of binder inclusion coated Kevlar fabric is improved up to 26% and 5.7%, respectively [18]. A systematic investigation of matrix properties was carried out by introducing micro- and nano-sized SiC fillers into an epoxy matrix. The study revealed that with an equal amount of loading, nanoparticle infusion brings about superior thermal and mechanical properties to the matrix than what is usually given by micro-filler infusion [19]. Two non-oxide nanostructures, ZrB2 nanofibers and SiC nanoparticles, as reinforcement phases, were utilized to develop the carbon/phenolic-ZrB2-SiC (C/Ph-ZS) nanocomposite. The addition of 7 wt.% of ZrB2/SiC nano additives homogeneously in a C/Ph composite resulted in an enhancement of room temperature thermal diffusivity. The incorporation of 4–7 wt.% of ZrB2/SiC nanofillers in C/Ph composites leads to a 73% increase in shore D hardness [20].
The publication aims to manufacture carbon fiber nanocomposite by mixing TiO2 and SiC nanomaterials in epoxy resin to increase the mechanical and thermal properties of the nanocomposite by means of vacuum-assisted resin transfer molding (VARTM).

2. Materials and Methods

2.1. Materials Used

The properties and details of the materials used in this project are described below in Table 1, Table 2, Table 3 and Table 4. Carbon fiber and IN2 epoxy resin were purchased from Easy Composites and the nanomaterials were ordered from PlasmaChem GmbH, Berlin, Germany.
IN2 is the industry standard epoxy infusion resin. It is a high-performance low viscosity epoxy resin formulated specifically for use in resin infusion composite production.

2.2. Manufacturing Process

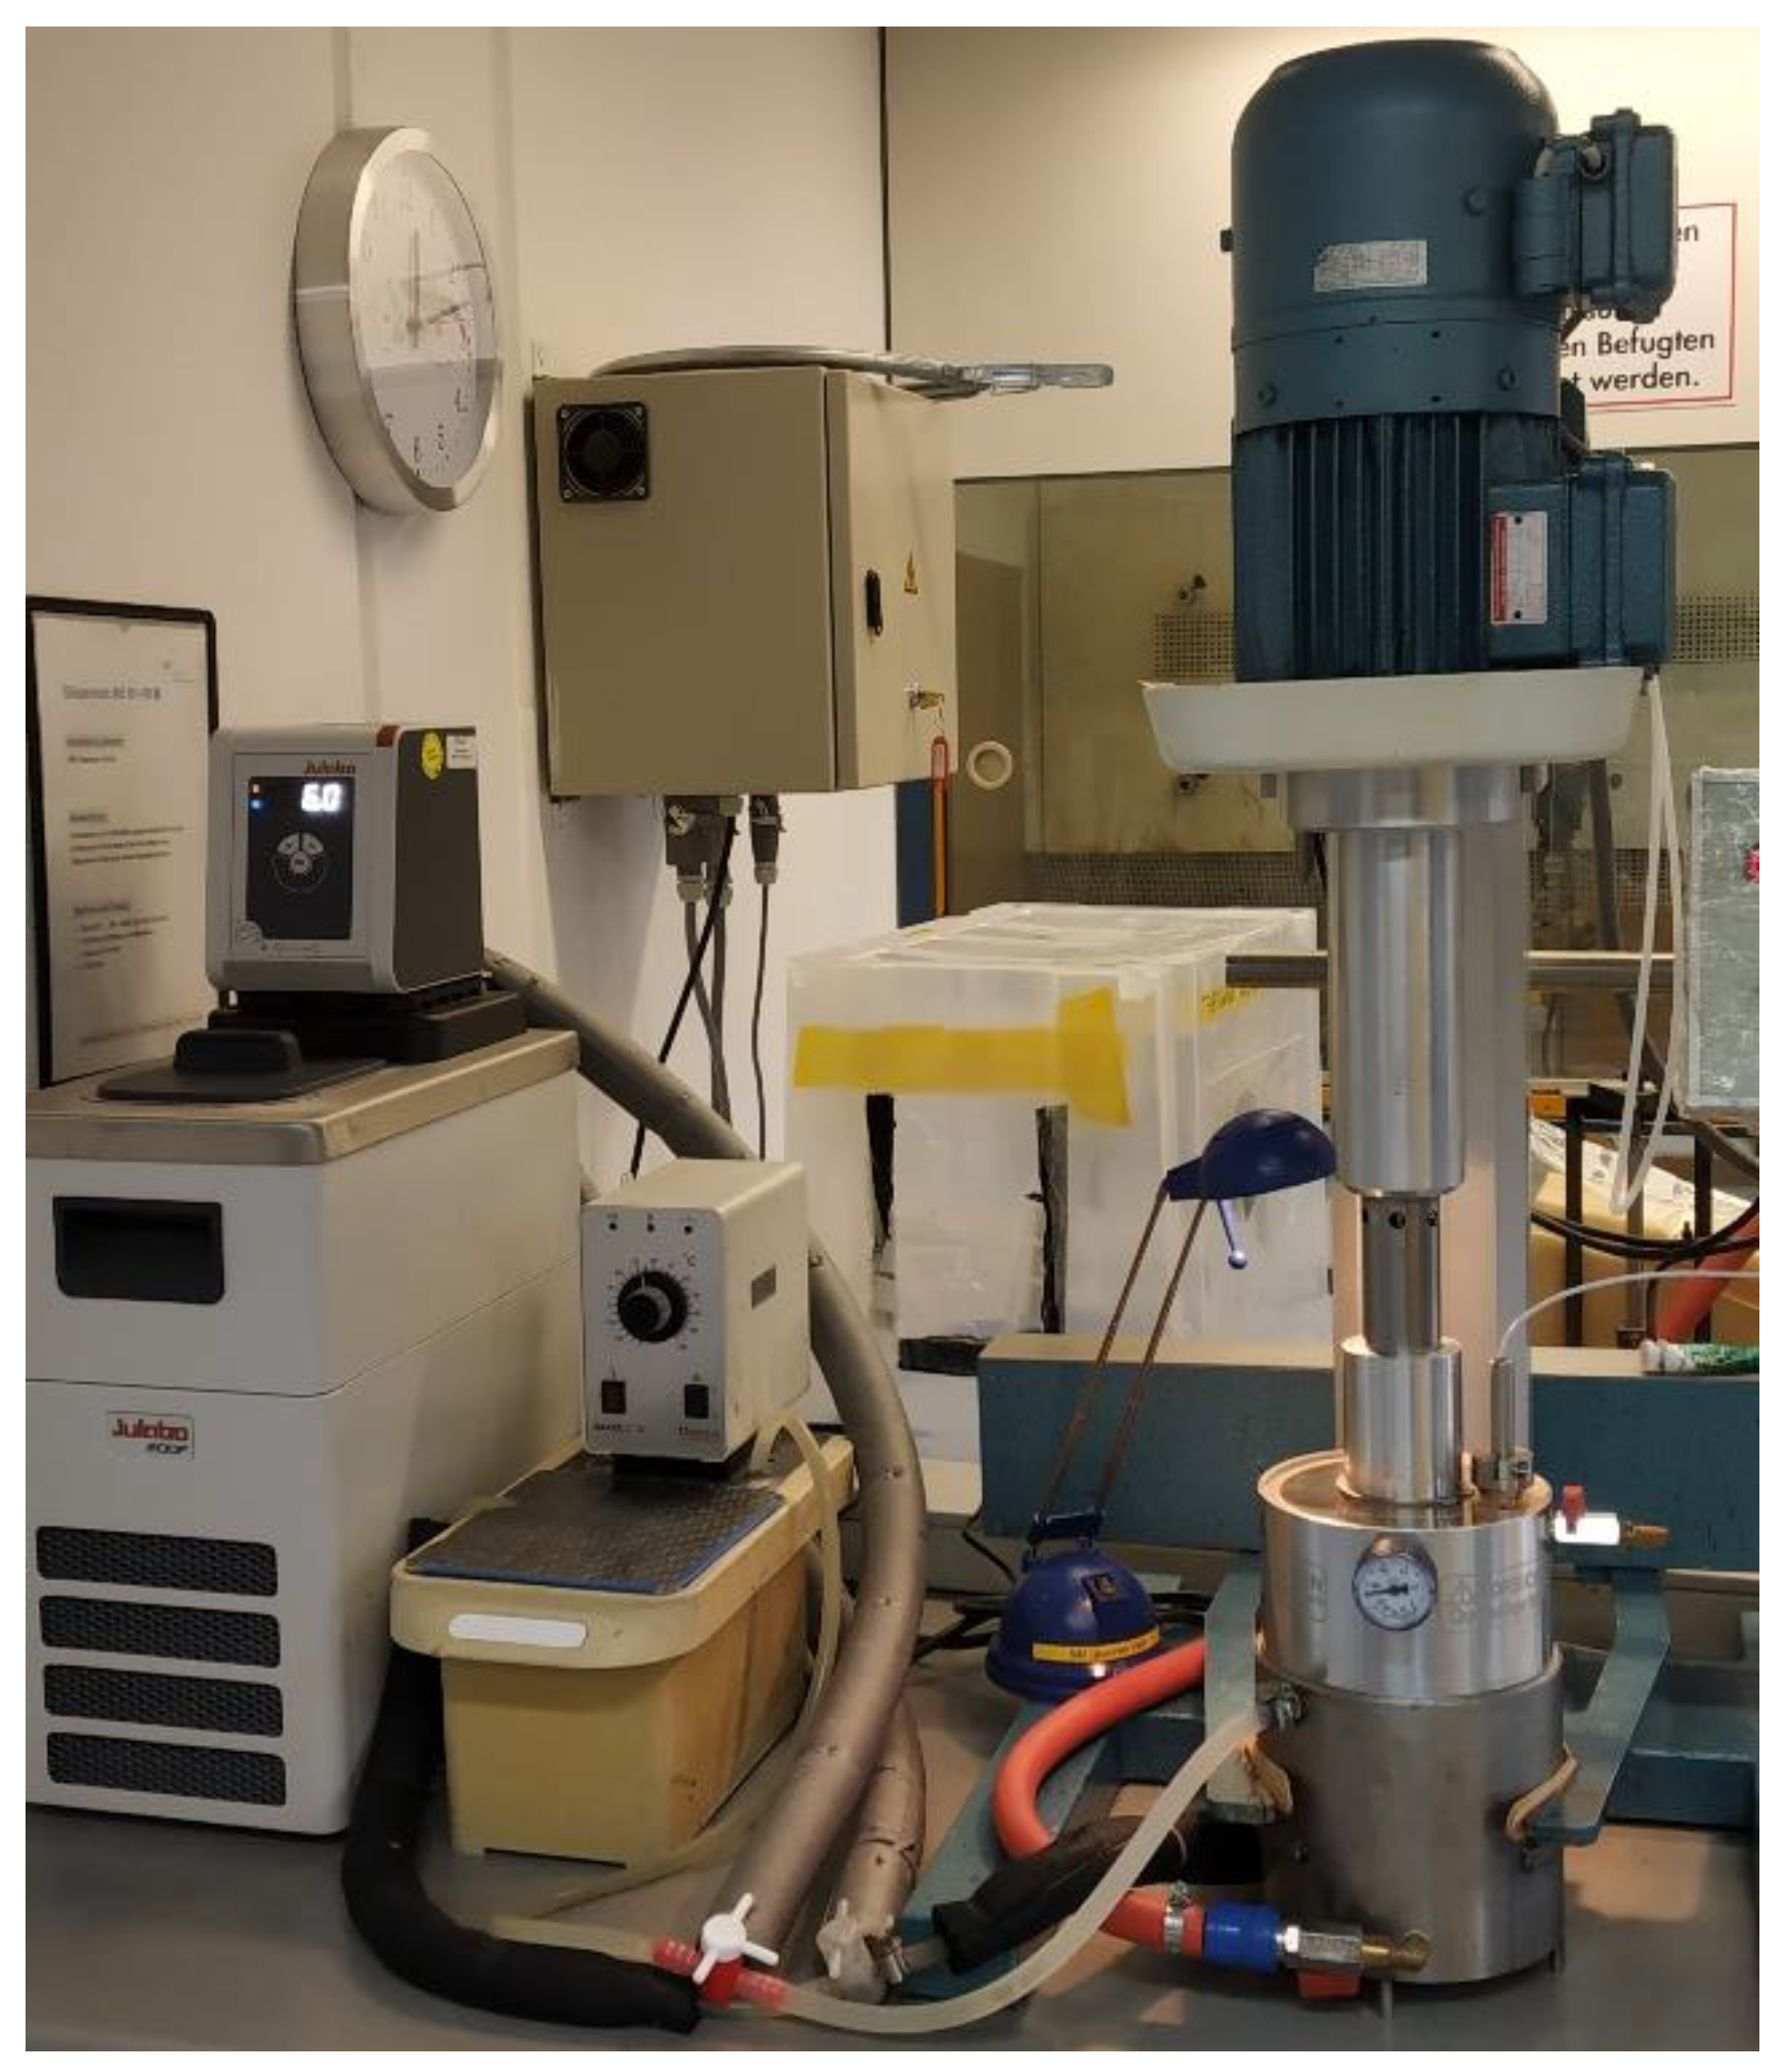
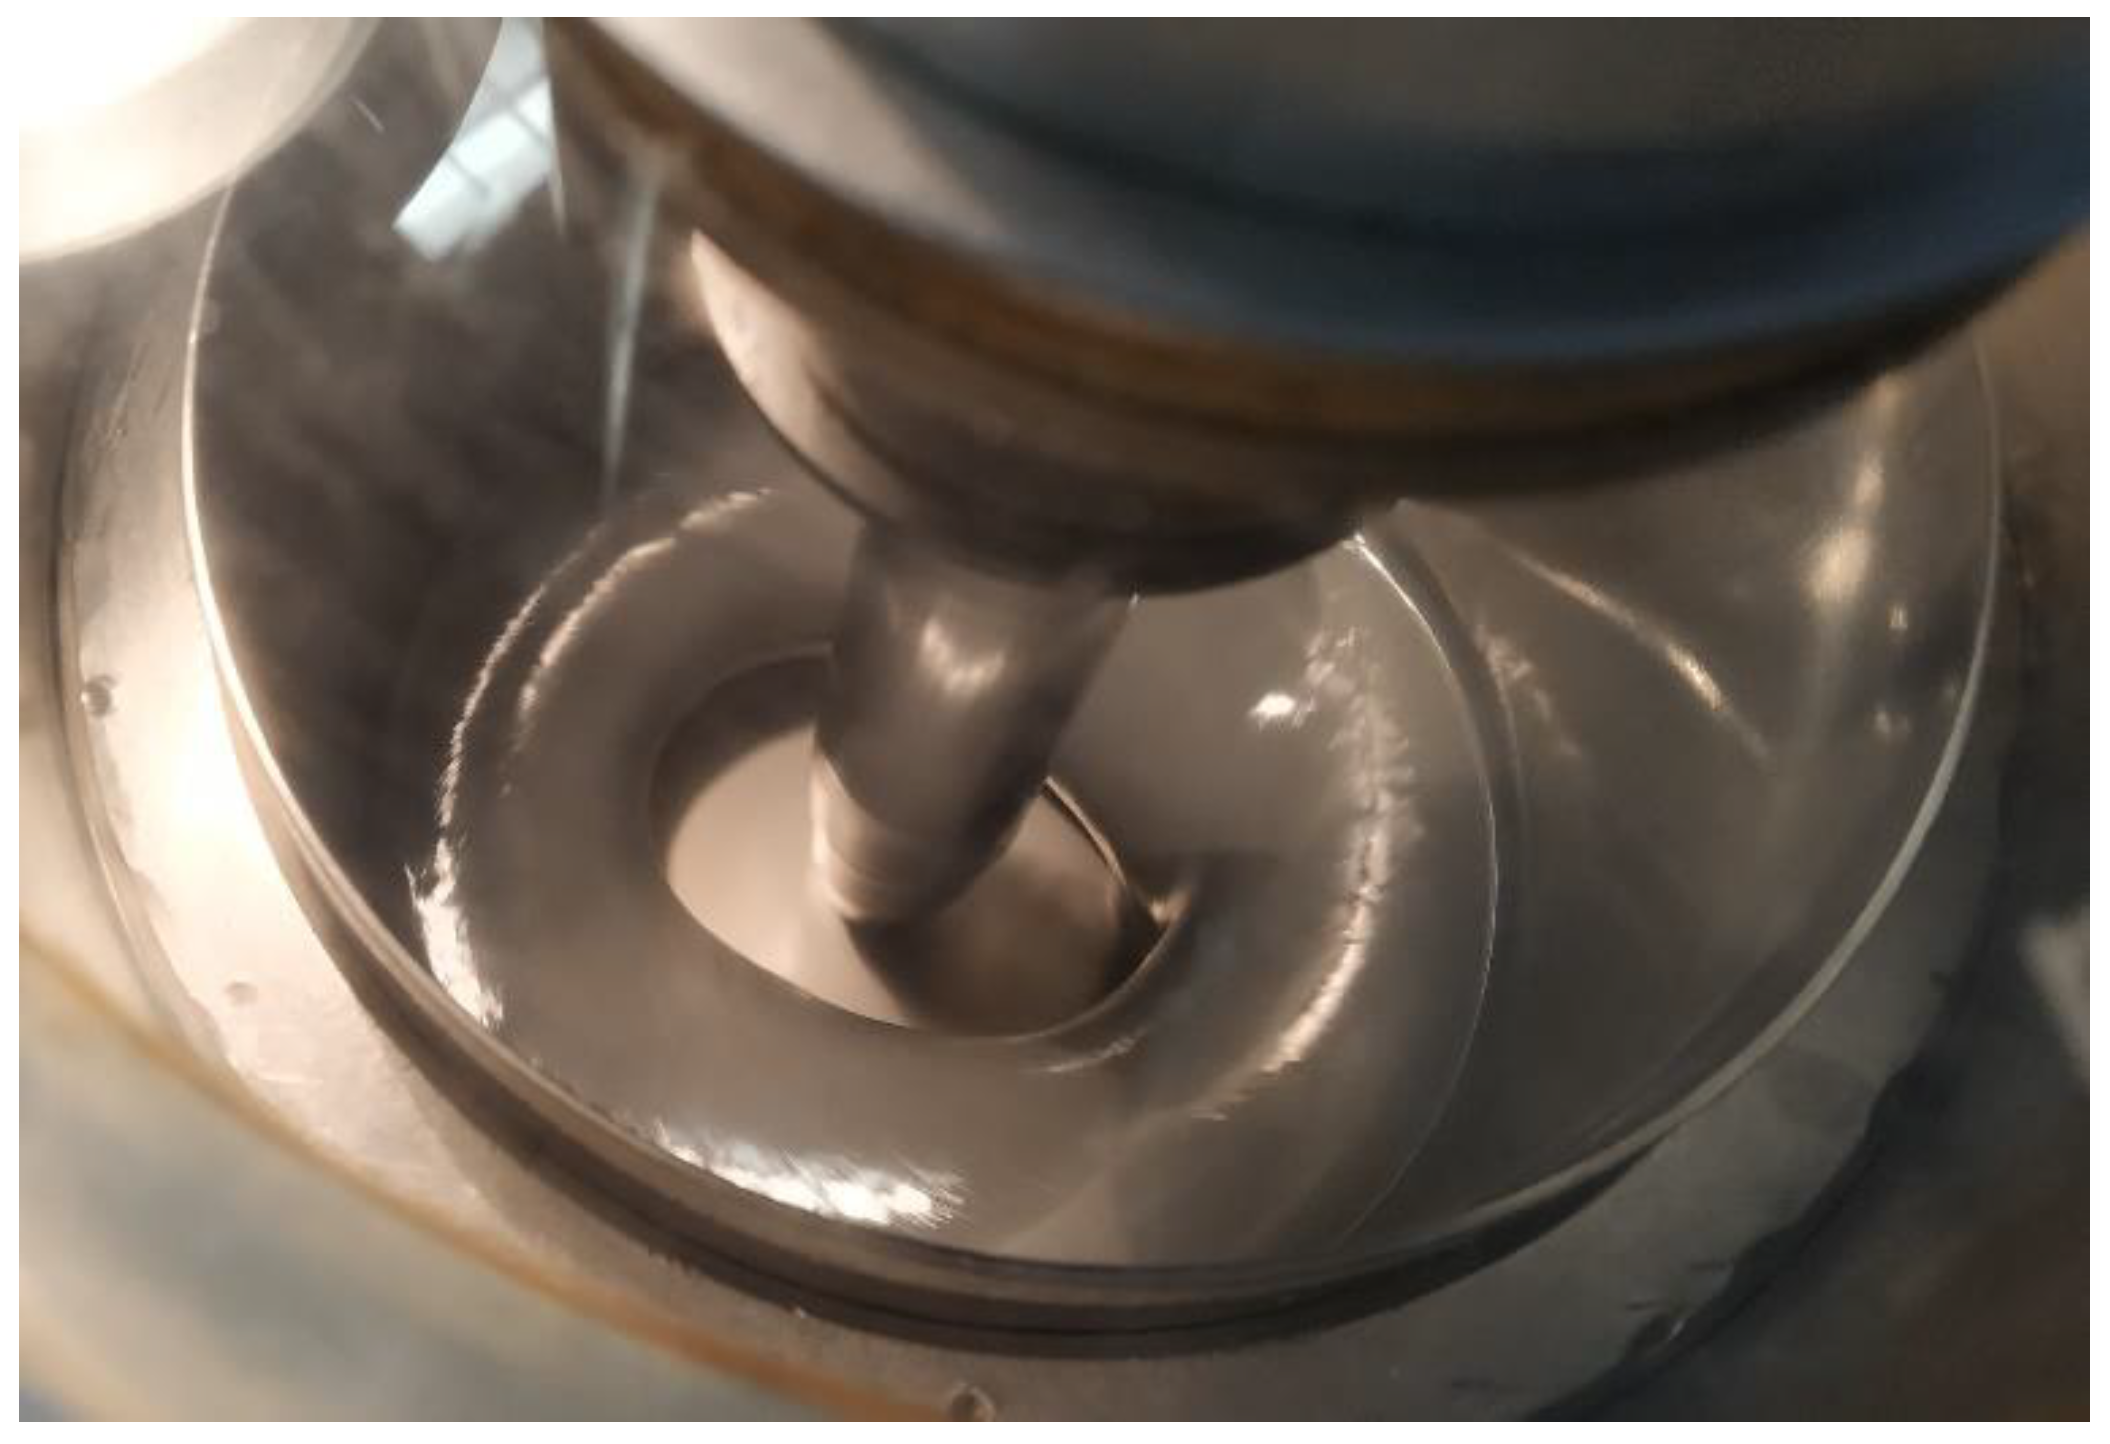
The tendency of nanomaterials to form agglomerates is due to van der Waals attractive force between nanomaterials when they get closer to each other. Agglomerates ultimately result in weaker interfacial interaction between the carbon fiber and epoxy resin. A dissolver was used to break the agglomerates to provide good dispersion of the nanomaterials in the resin (refer to Figure 1).

2.2.1. Dispersion of Nanomaterials in Epoxy Resin

The resin and nanomaterials are weighed and added into a mixing container before being placed in the dissolver. The room conditions were: Temperature 24.8 °C, dew point condensation Td 9.2 °C, and humidity 37% rh.
The container was placed in the dissolver and the vacuum was applied slowly. The mechanical energy was provided by allowing the dissolver blade to rotate in the container. The temperature was raised to 35 °C at 170 rpm and maintained at about this for one hour. During this one hour, the mixture was checked regularly by pausing the rotation and releasing the vacuum to make sure that the resin contains no air in it.
The cooling process began at 100 rpm and lasted one hour. When the temperature reaches 9 °C, the process was paused for inspection. For 15 min, the vacuum was applied again, the temperature was maintained at 35 °C, and the rotation speed was increased to 5800 rpm to ensure full dispersion of nanomaterials in resin (refer to Figure 2). Cooling has been applied till the resin temperature reaches 16 °C at 100 rpm. Later, the resin was removed from the dissolver container.

2.2.2. VARTM Process

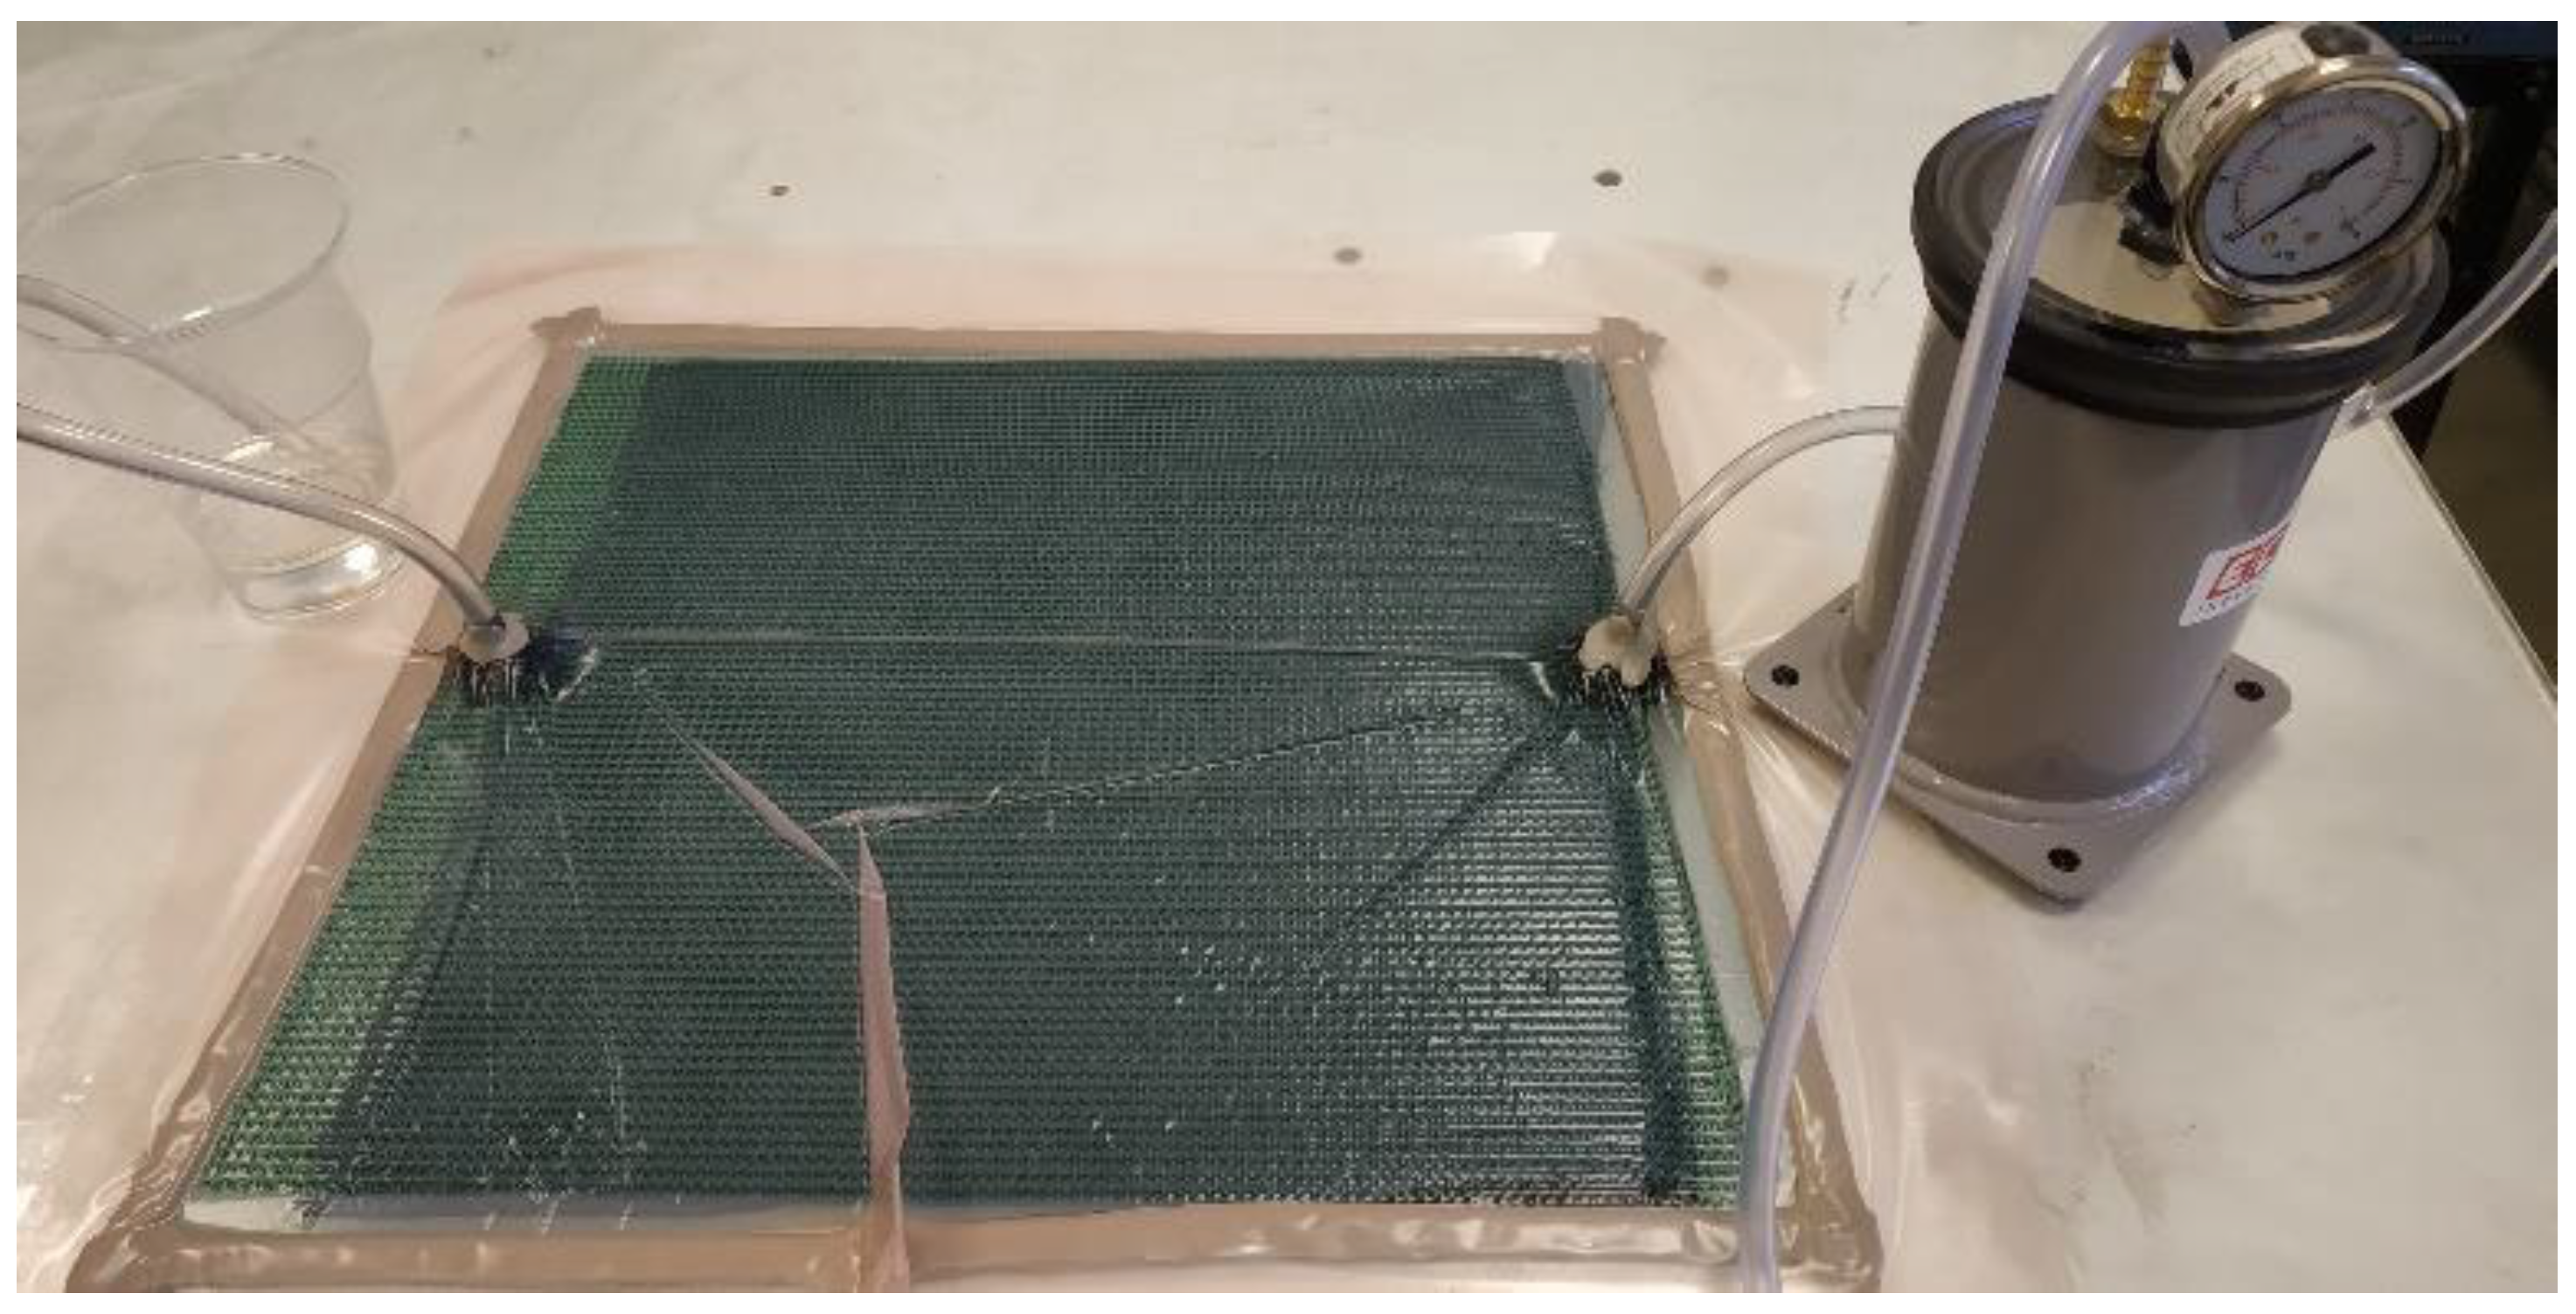
The VARTM process is divided into three steps: preparation, processing, and impregnation. In the preparation step, the cutting of reinforcement fibers, flow media, peel ply, and the vacuum bag was carried out. The carbon fiber reinforcements were arranged with a [0°]6 stacking sequence. Peel ply was placed on both sides of the fibers. To ensure the fast and even distribution of resin over the fibers, the flow media was placed on top of the peel ply. This is followed by placing the entire setup in a vacuum bag as shown in Figure 3. The processing step entails adjusting the pressure in the vacuum bag as well as initiating a chemical reaction by adding a hardener to the resin that causes the resin to cure. The main process of impregnating the resin with fiber occurs with the aid of a vacuum in the impregnating step. 24 h was assigned for the composite to cure.
The orientation of the reinforcement, the viscosity of the resin, the hardening property of the matrix, and the temperature have an impact on this process. A sheet of 300 × 300 × 2.4 mm was produced by using the previously described VARTM process. Four different compositions were manufactured by varying the nano-content and termed as specimens S0, S1, S2, and S3 and weight details are mentioned in Table 5.
Calculations of Weight and Volume fraction of composites:
Equations for calculation:
Fiber weight fraction
W F = M F M C
Nanoparticle weight fraction
W N 1 , 2 = M N 1 , 2 M C
with:
MF—mass of fibers
MC—mass of composite
MN1,2—mass of nanoparticle
For S0: Fiber volume fraction
F = W F ρ F W F ρ F + 1 W F ρ M
For S1, S2 and S3:
Fiber volume fraction
F = W F ρ F W F ρ F + W M ρ M + W N 1 ρ N 2 + W N 2 ρ N 2
Nanoparticle volume fraction
N 1 , 2 = W N 1 , 2 ρ N 1 , 2 W N 1 ρ N 1 + W N 2 ρ N 2 + W F ρ F + W M ρ M
WM = 1 − WFWN1WN2
with:
F—density of fiber
M—density of matrix
N1,2—density of the nanoparticle
The calculation input values for S0 and S1 are mentioned in Table 6 and Table 7. The results of calculations are shown in Table 8.
Specimen S0:
Table 6. Calculation inputs.
PropertyValue
Total weight of composite (MC)285 g
Weight of 6 sheets of carbon fiber (MF)113.4 g
Weight of matrix (MM)171.6 g
Density of fiber ( ρ F )1.79 g/cm3
Density of matrix ( ρ M )1.15 g/cm3
Specimen S1:
Table 7. Calculation inputs.
PropertyValue
Total weight of composite (MC)285 g
Weight of 6 sheets of carbon fiber (MF)113.4 g
Weight of matrix (MM)170.1 g
Weight of TiO2 (MN1)0.75 g
Weight of SiC (MN2)0.75 g
Density of fiber ( ρ F )1.79 g/cm3
Density of matrix ( ρ M )1.15 g/cm3
Density of TiO2 ( ρ N 1 )4.23 g/cm3
Density of SiC ( ρ N 2 )3.1 g/cm3
Table 8. Weight and volume percentage of all specimens.
SpecimenEpoxy Resin (wt.%)Carbon Fiber (wt.%)Total Nanomaterials (wt.%)Epoxy Resin (vol.%)Carbon Fiber (vol.%)Total Nanomaterials (vol.%)
S06040-70.2129.79-
S159.5400.570.0829.730.19
S25940169.5830.040.38
S35840268.9230.290.79

2.3. Test Equipment and Test Parameters

2.3.1. Flexural Tests

Flexural tests were carried out in the accordance with DIN EN ISO 178. It measures the force required to bend a sample under three-point loading conditions. The specimen was supported by a span, and a load was applied at the center, causing three-point bending at a test speed of 5 mm/min and the flexural modulus was measured. This test was carried out on samples measuring 80 × 10 × 2.4 mm.

2.3.2. Tensile Tests

Tensile tests were carried out in accordance with DIN EN ISO 527. The top and bottom grips of the tensile testing machine held the test samples. The grips were moved apart at a constant test speed of 5 mm/min. The force and displacement of the specimen were continuously measured, and the stress-strain curve was plotted. Young’s modulus was measured between 0.05 and 0.25% strain. This test was carried out on samples measuring 120 × 10 × 2.4 mm.

2.3.3. Impact Tests

Charpy impact tests were carried out in accordance with DIN EN ISO 179. It is a single-point test that measures the resistance of a material to an impact from a pendulum hammer with a velocity of 2.9 m/s, a hammer weight of 0.9510 kg, and an impact energy of 4 joules. Toughness is determined by the amount of force required to fracture the material with a swinging pendulum. The specimen was supported horizontally and unclamped at both ends. The impact strength in kJ/m2 was calculated. This test was carried out on unnotched samples measuring 80 × 10 × 2.4 mm.

2.3.4. Hardness Tests

Shore hardness is a measure of a material’s resistance to needle penetration under a defined spring force. It is expressed as a number ranging from 0 to 100 on the A or D scales. The harder the material, the higher the number. The main difference between Shore A and Shore D is that Shore A is used to measure flexible rubbers, whereas Shore D is used to measure harder, rigid materials. Shore A using a cone with a truncate tip is valid from 10 to 90 Shore A. Shore D using a cone with a tip is valid from 30 to 100 Shore D. Shore D was used to measure the hardness of the samples. After needle penetration, hardness values were noted after waiting for a period of 10 s.

2.3.5. Heat Deflection Temperature Tests

The HDT A test was carried out according to DIN EN ISO 75. The heat deflection temperature (HDT) test determines the temperature at which a polymer, plastic, or plastic composite specimen deforms to a certain extent under a given flexural load.
The test device consists of a bath with an option of mounting measuring heads. The temperature of the bath is controlled by an in-built thermostat. The thermostat maintains a constant temperature increase with a gradient of 120 k/h throughout the test sequence. The heat deflection temperature is the temperature at which a standard test bar deflects when subjected to a specified load. It is used to compare the mechanical properties of polymers at high temperatures. The samples are placed in a silicon oil bath, which is heated to a higher temperature. Each sample is loaded with 489 g. In principle, it is a three-point bending test in the presence of increasing temperature. The samples with dimensions 80 × 10 × 2.4 mm were used in this test.

3. Results

3.1. Flexural Tests results

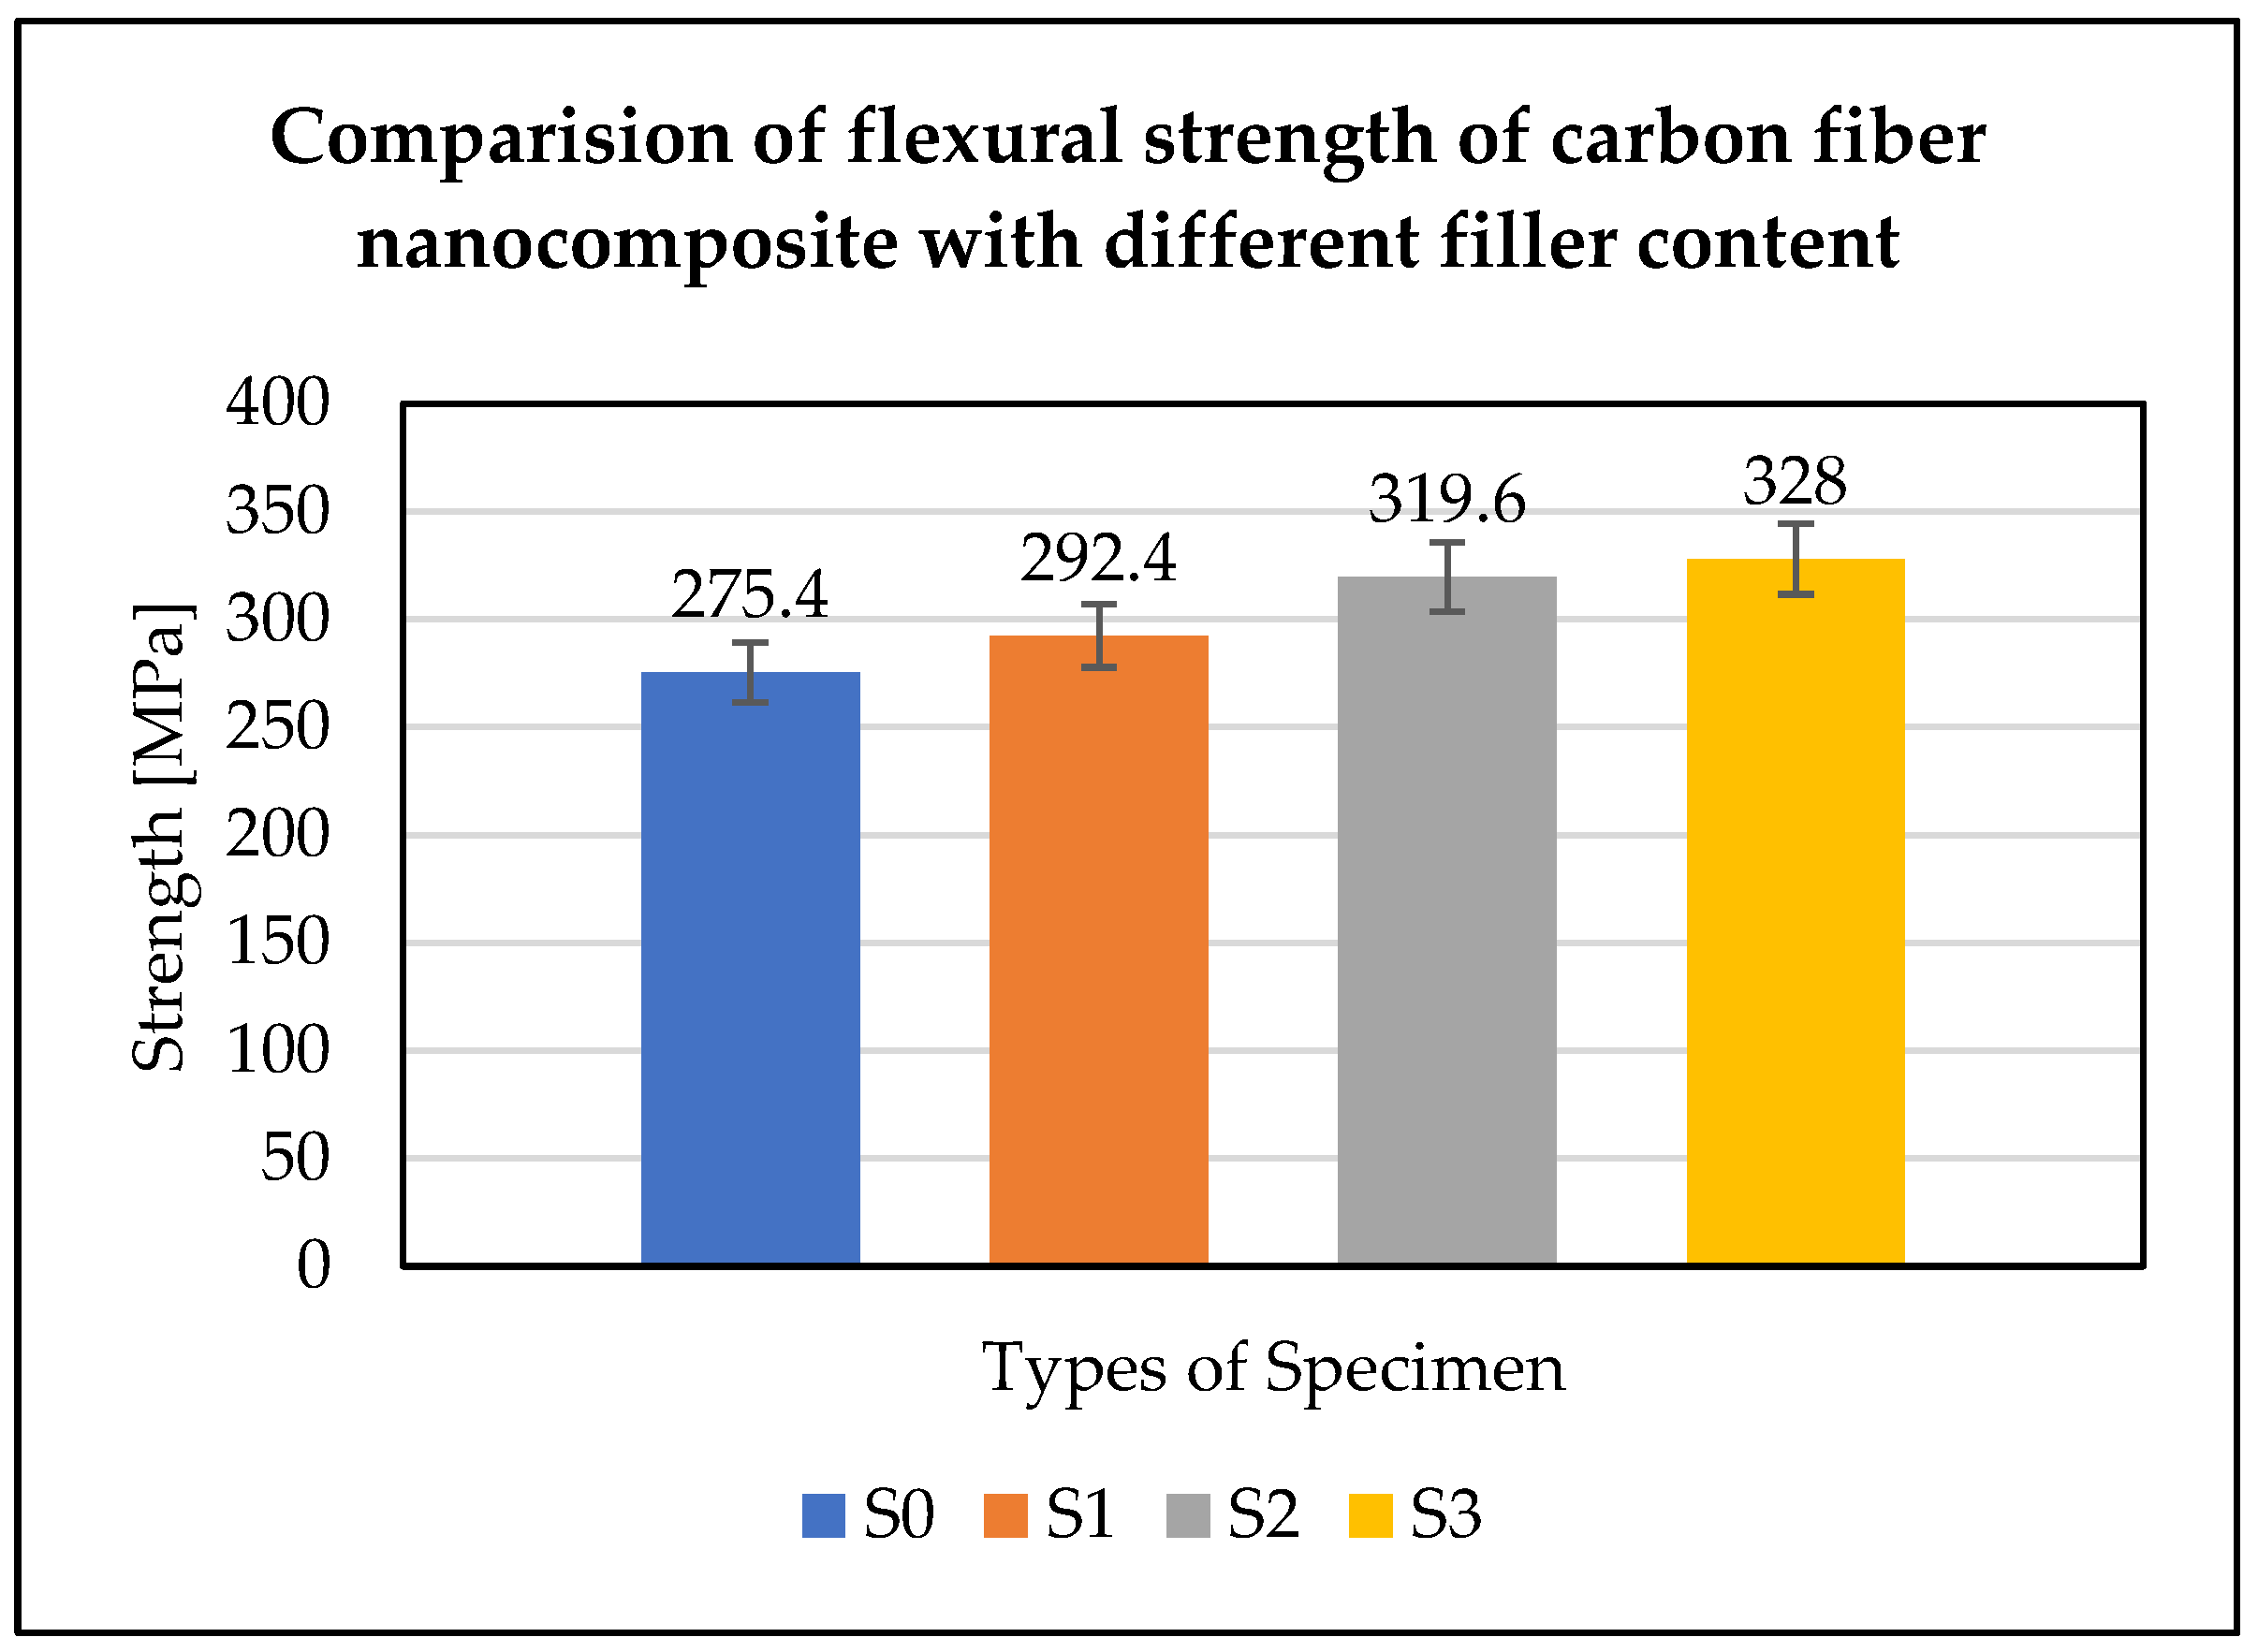
The flexural tests were performed to evaluate bulk stiffness and strength. The result of the flexural test showed that the composite with TiO2 and SiC nanomaterials-doped epoxy resin exhibited improvement in flexural strength and flexural modulus. The flexural strength and modulus increased with an increase in the weight percentage content of nanomaterials in the composite.
As Figure 4 depicts the values of flexural strength, clearly there is an increase of 5.9% when compared to composite with no nanomaterials and composite with 0.5% wt. of nanomaterials. The percentage of flexural strength increase between S1 (0.5% wt.) and S2 (1% wt.) is 8.88%. And between S2 (1% wt.) and S3 (2% wt.) is 2.59%. The overall increase in the flexural strength between S0 and S3 is 17.43% (refer to Table 9 for flexural modulus).

3.2. Tensile Tests

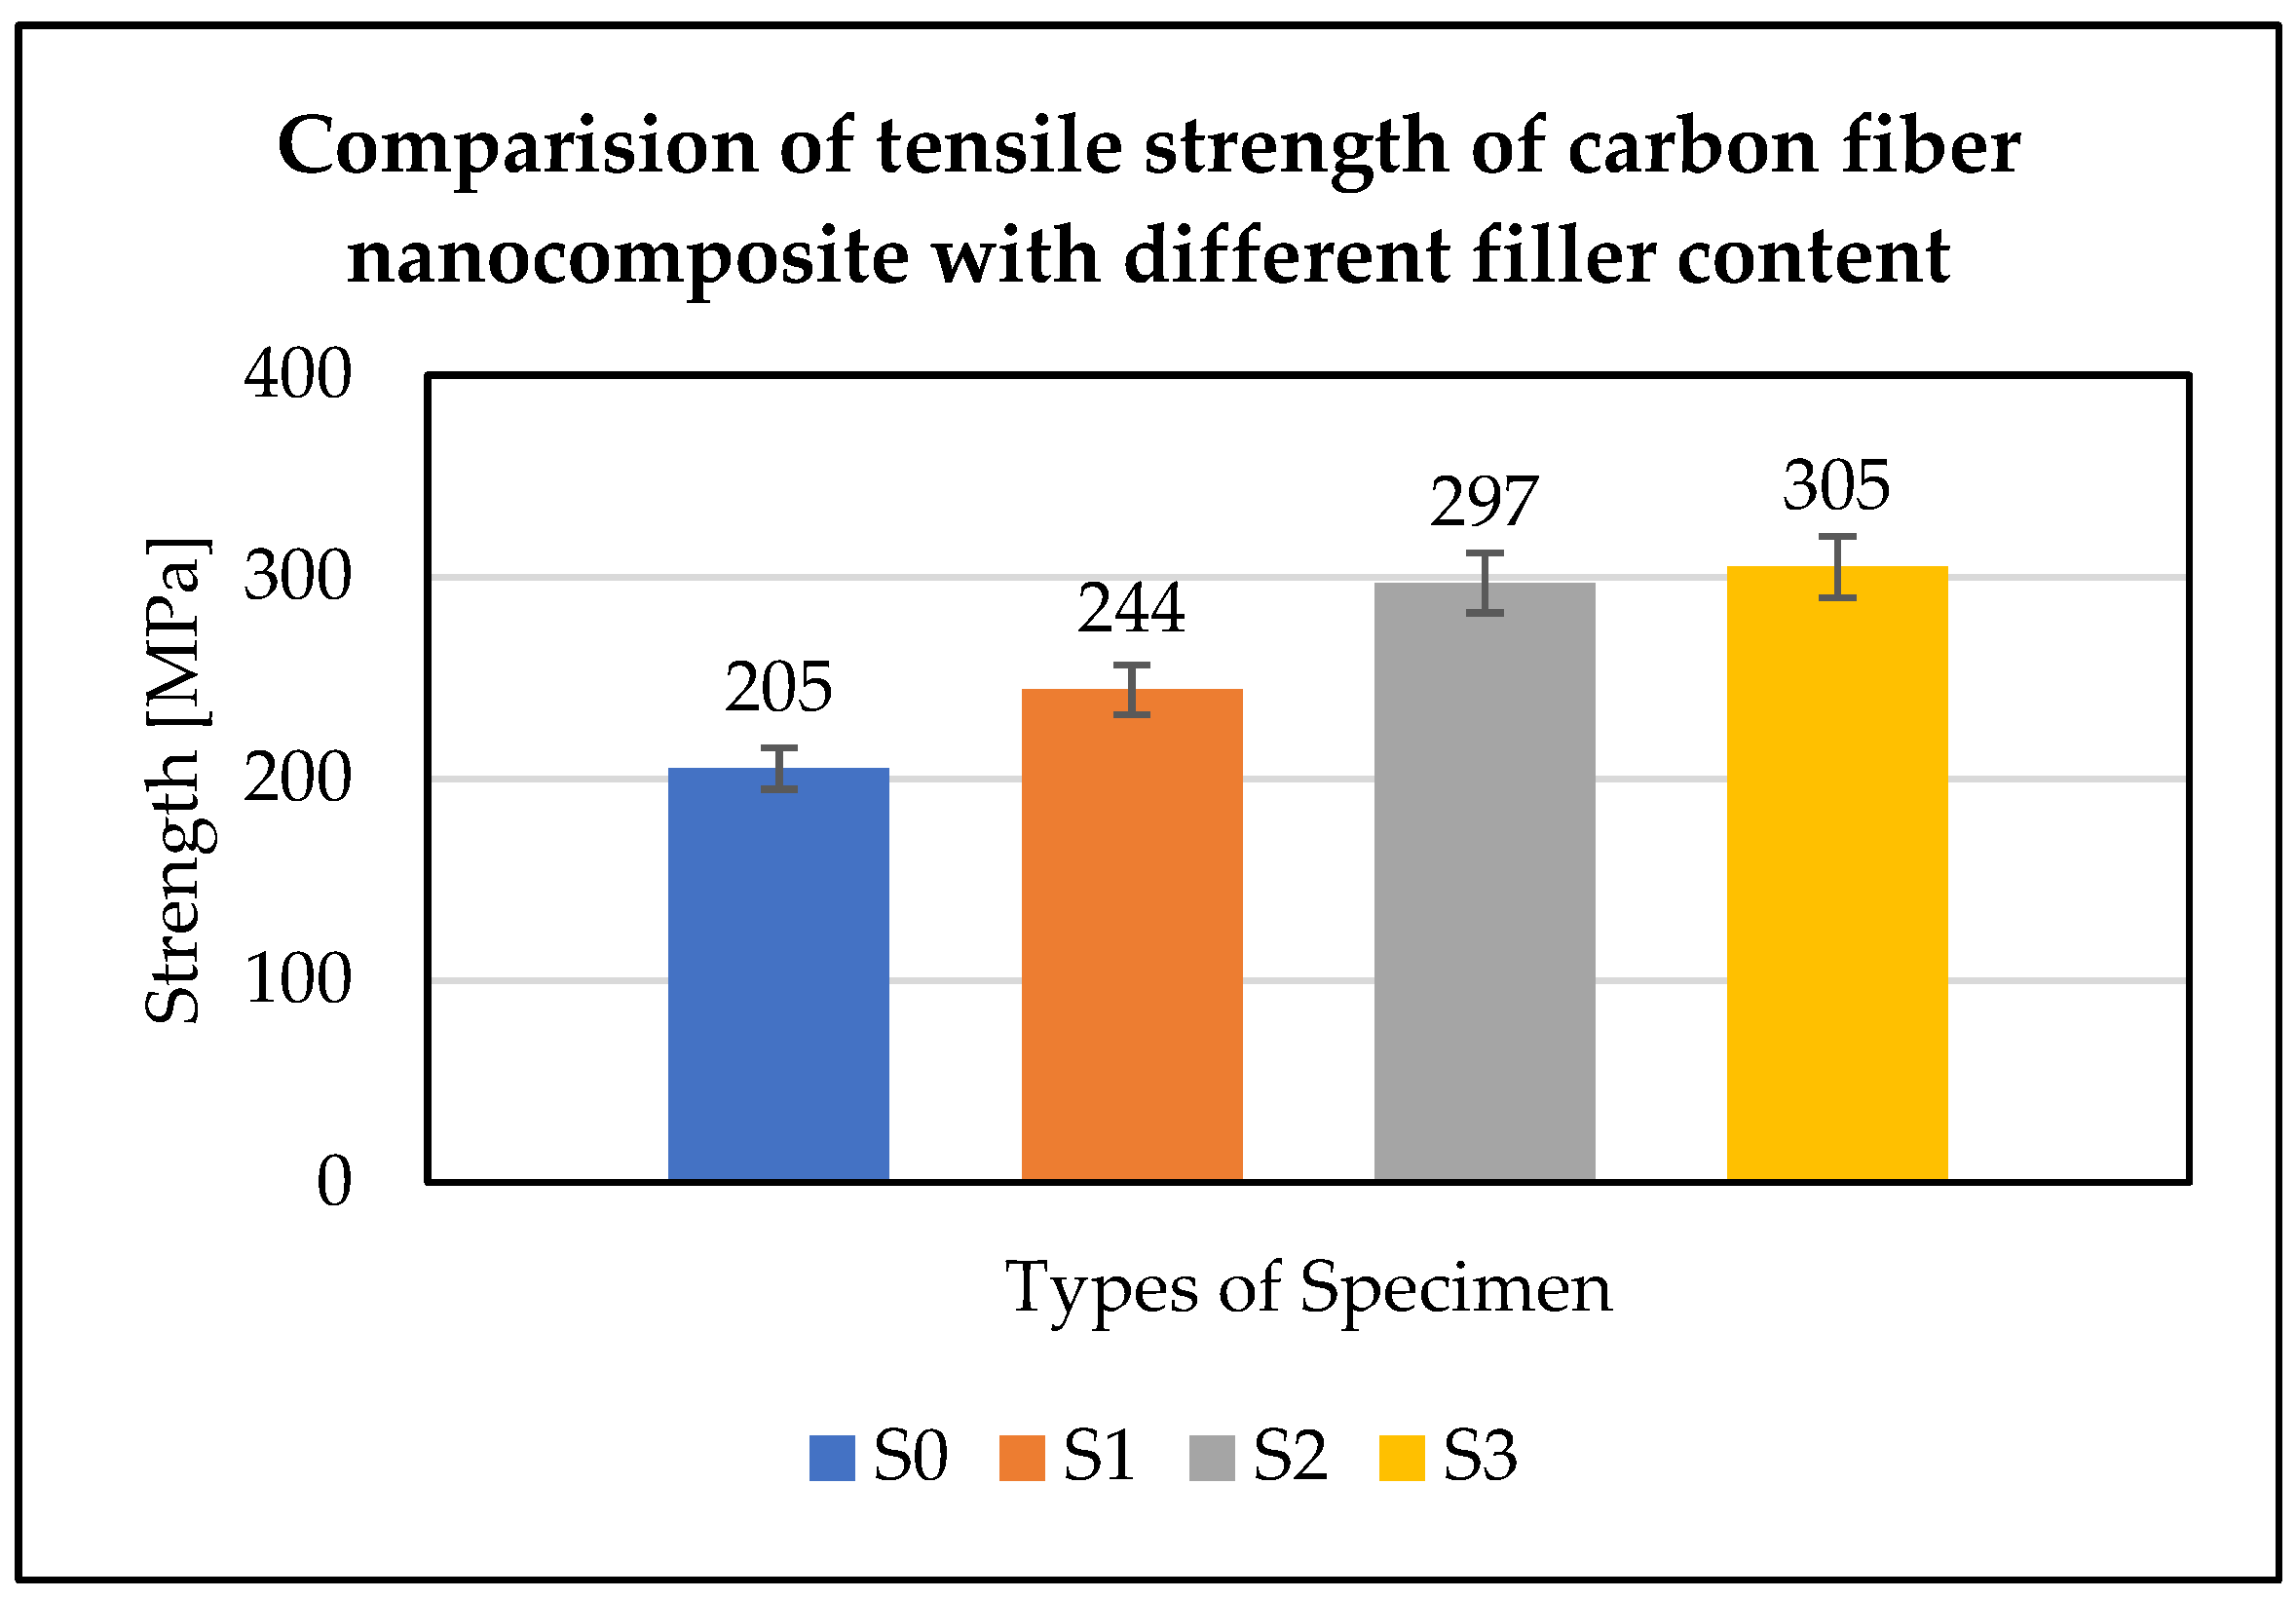
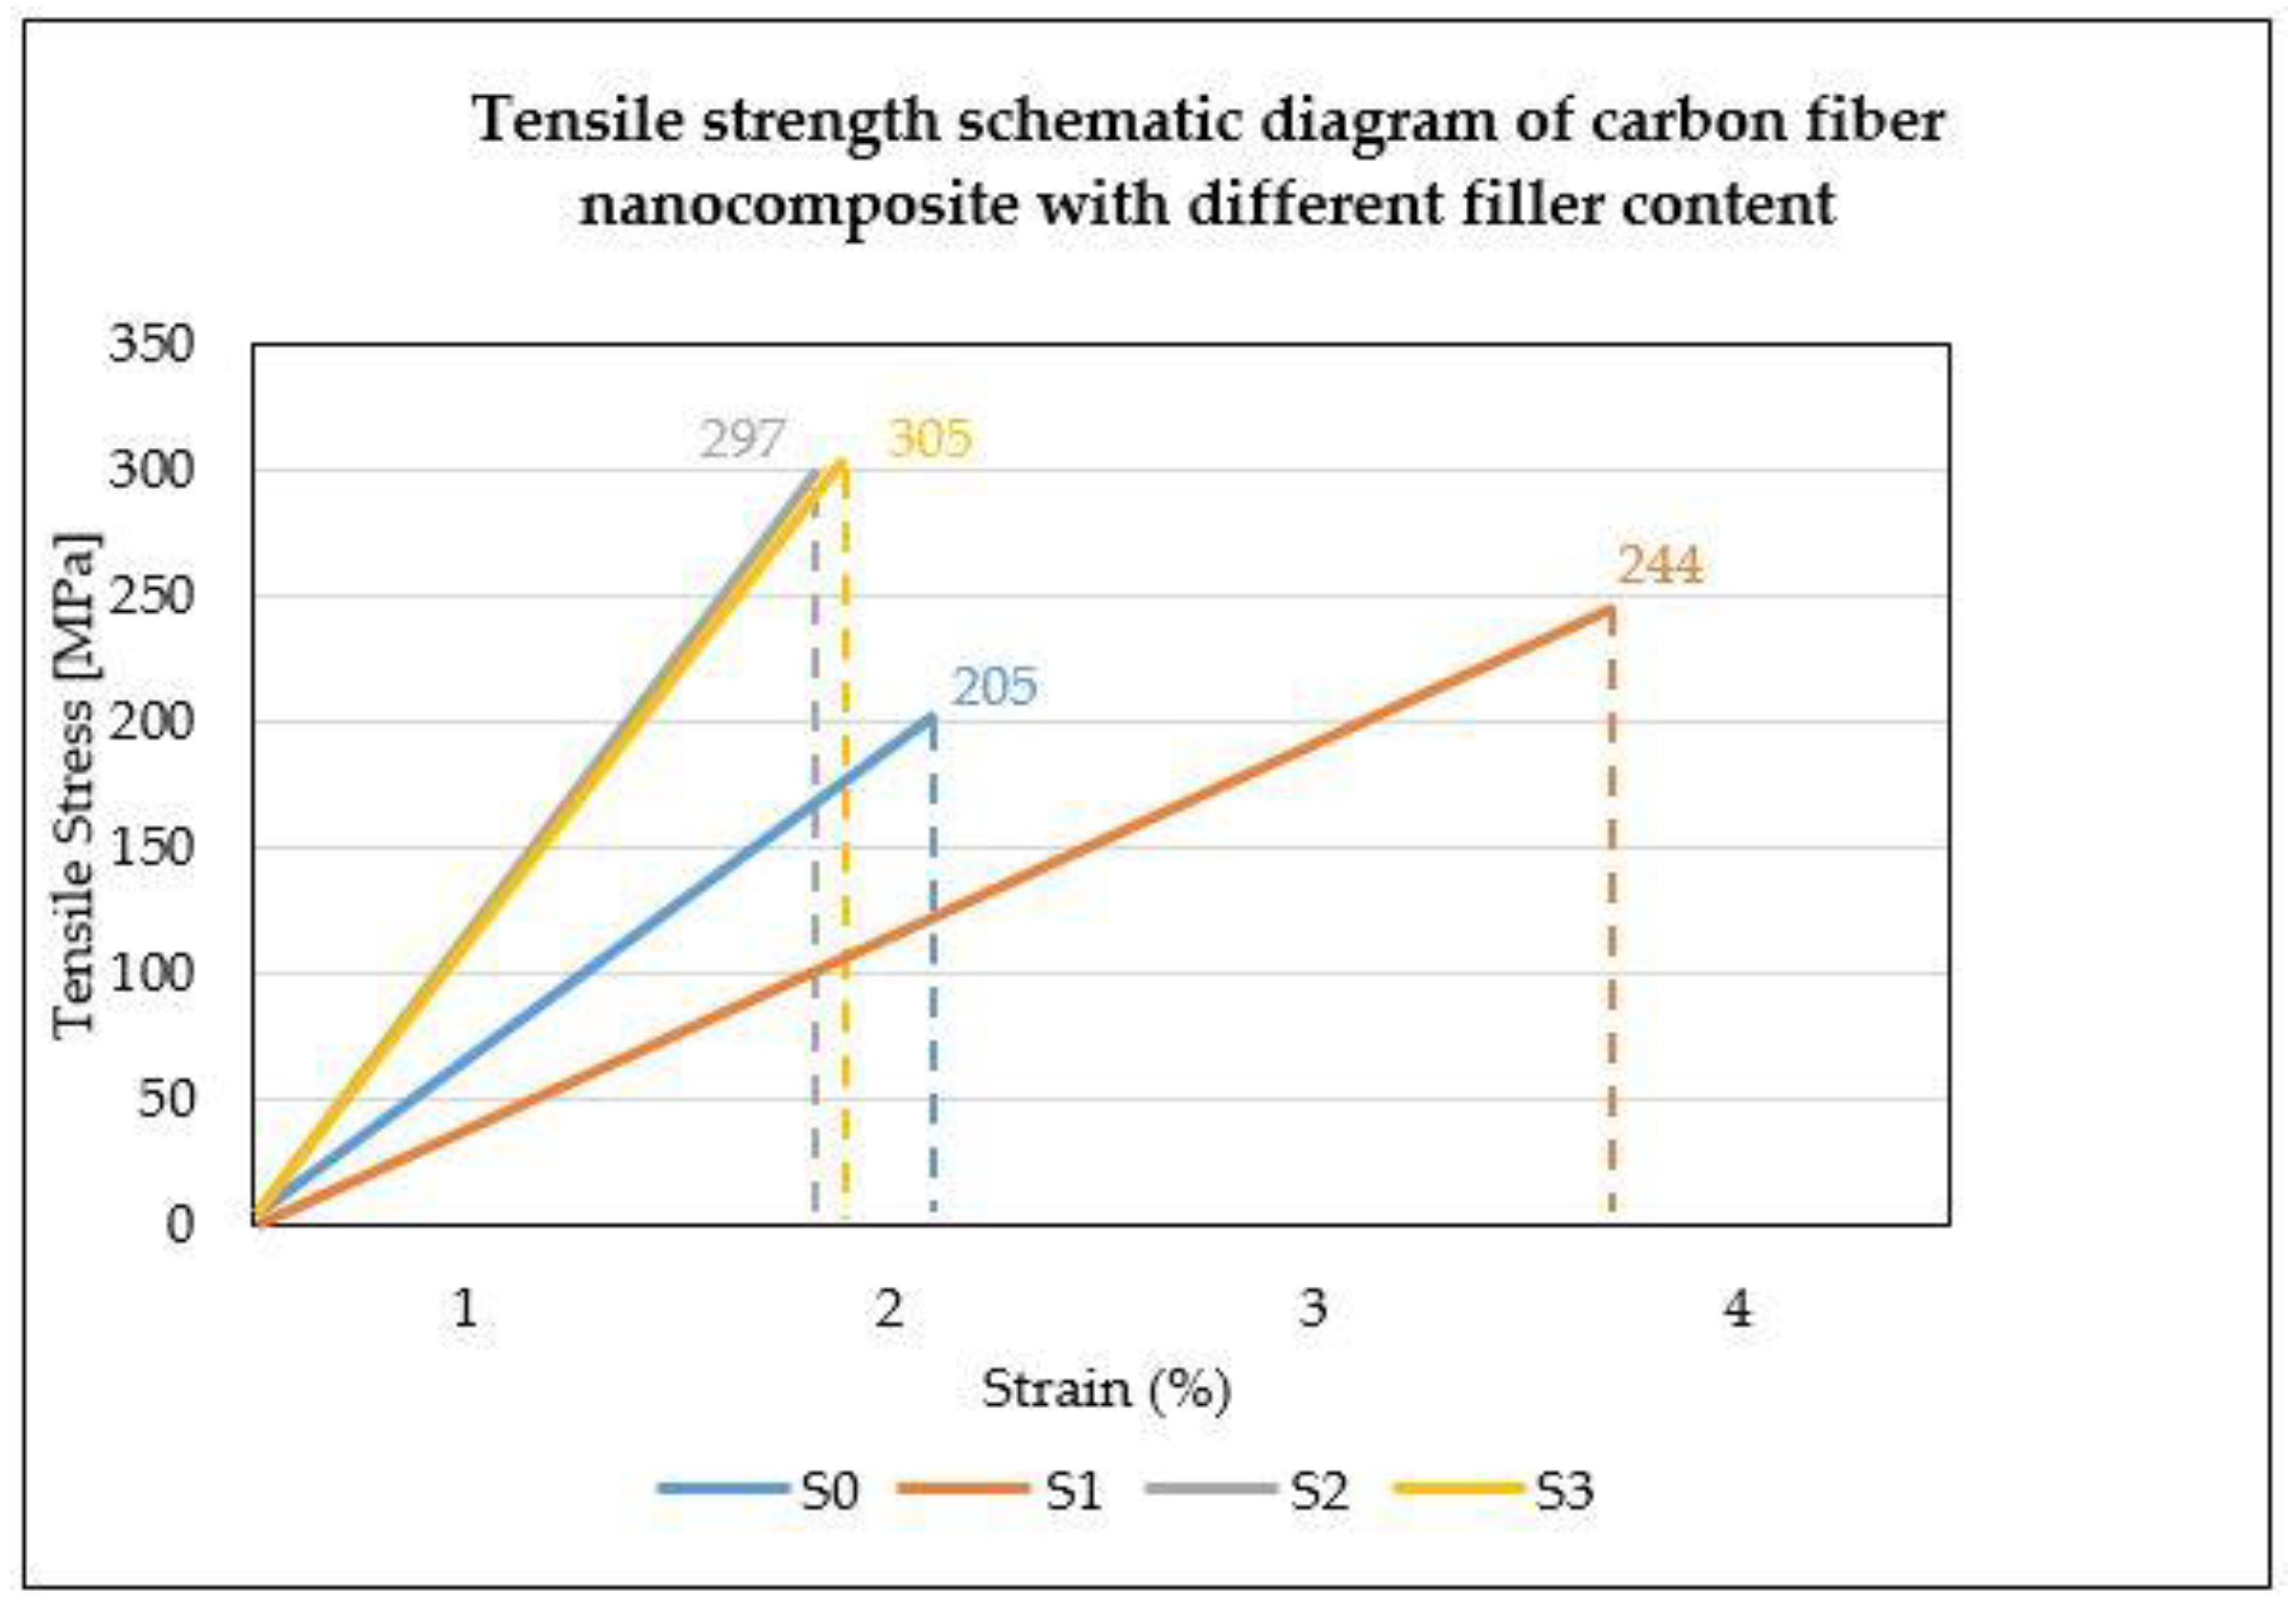
When compared S0 to S1, S1 to S2, and S2 to S3 the tensile modulus increased by 2.87%, 59.60%, and 23.82%, respectively. There is not much difference in tensile modulus between S0 and S1 because there is only a 0.5% wt. of nanomaterials in the resin that spread across the fibers (refer to Table 10 for tensile modulus results). The tensile strength was 205 MPa for 0% wt., 244 MPa for 0.5% wt., 297 MPa for 1% wt., and 305 MPa for 2% wt. The comparison of tensile strength is shown in Figure 5. The percentage of increase in tensile strength from S0 to S3 is 39.21%, as a result of the uniform dispersion of nanomaterials that developed a mechanical interlocking mechanism between the fiber and matrix by holding them together. A schematic diagram also included below Figure 6, for better understanding.
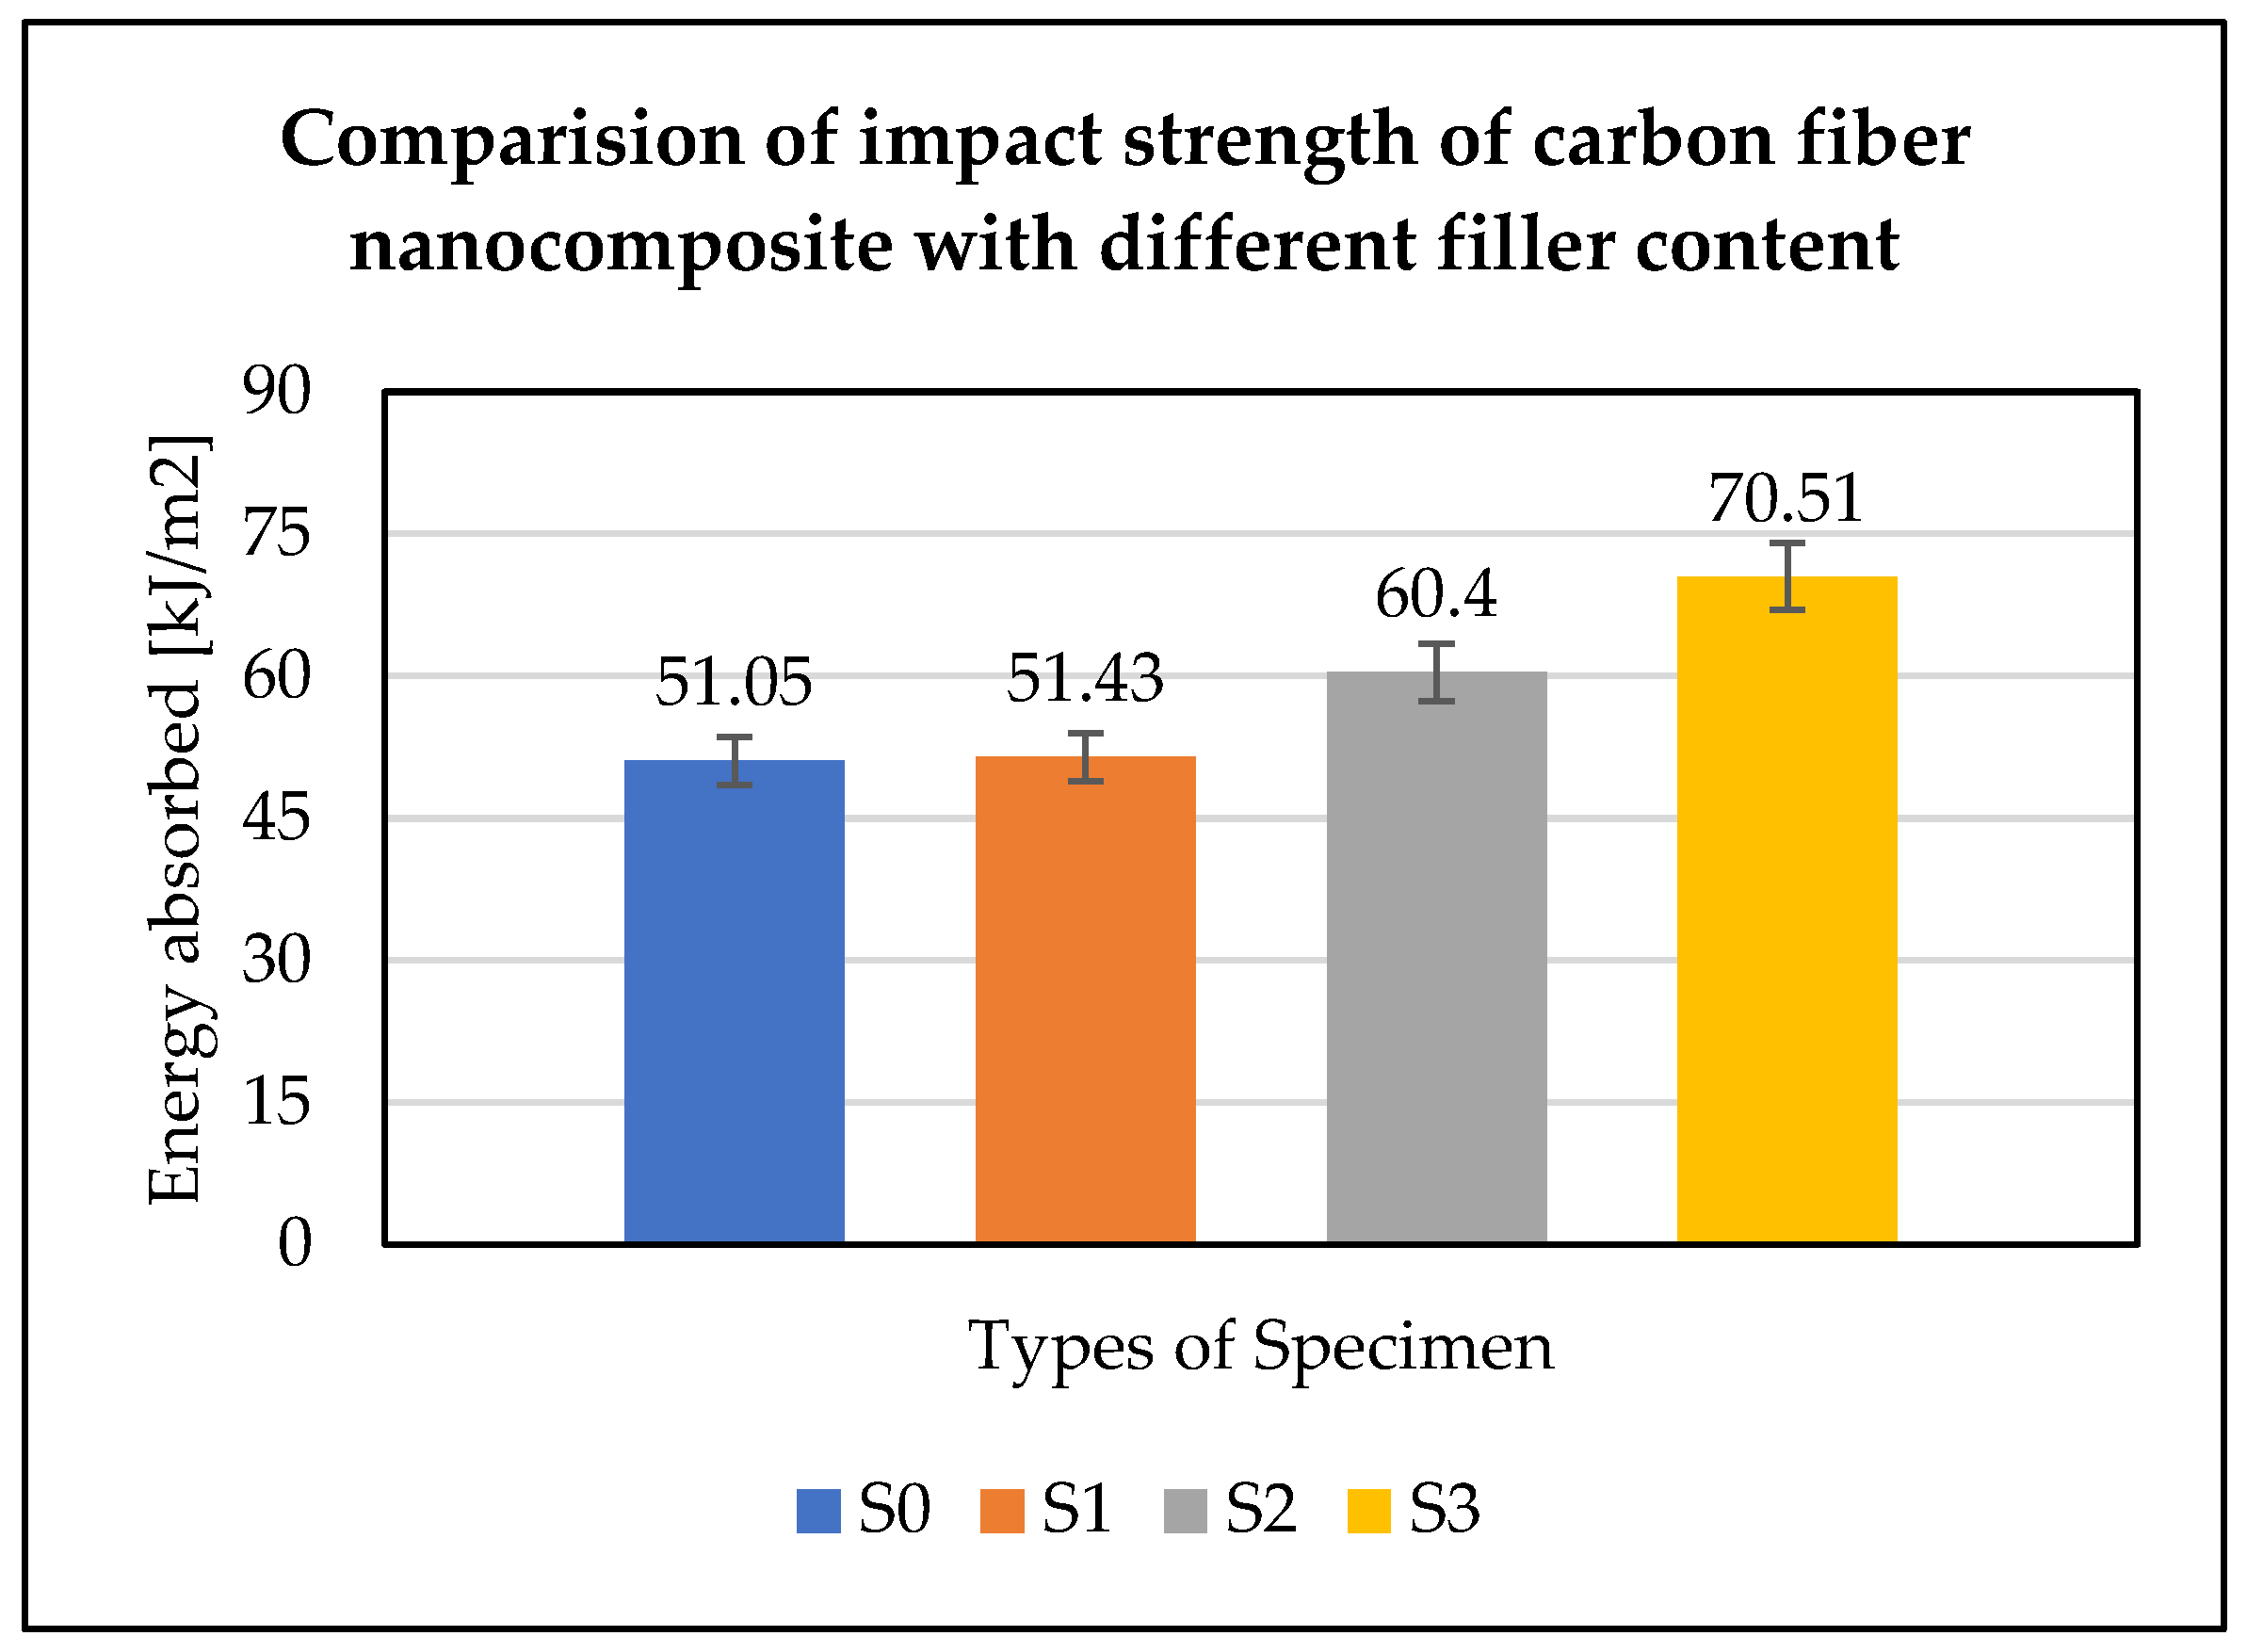
Figure 7, shows impact energy absorption. The energy absorption rate was in increasing order from specimen S0 to S3. Specimen S3, with 2% nano content possessing the highest impact strength. It absorbed 70.51 kJ/m2 of energy which is 15.44% more than the energy absorbed by S2 with 1% of nano content. S1 and S0 absorbed 51.43 kJ/m2 and 51.05 kJ/m2, respectively. Overall, S3 absorbed 32.01% of more energy than S0, the specimen with no nano content, because of the increased nano content in the S3, i.e., 2% wt, which is equivalent to 6 g.

3.3. Hardness Tests

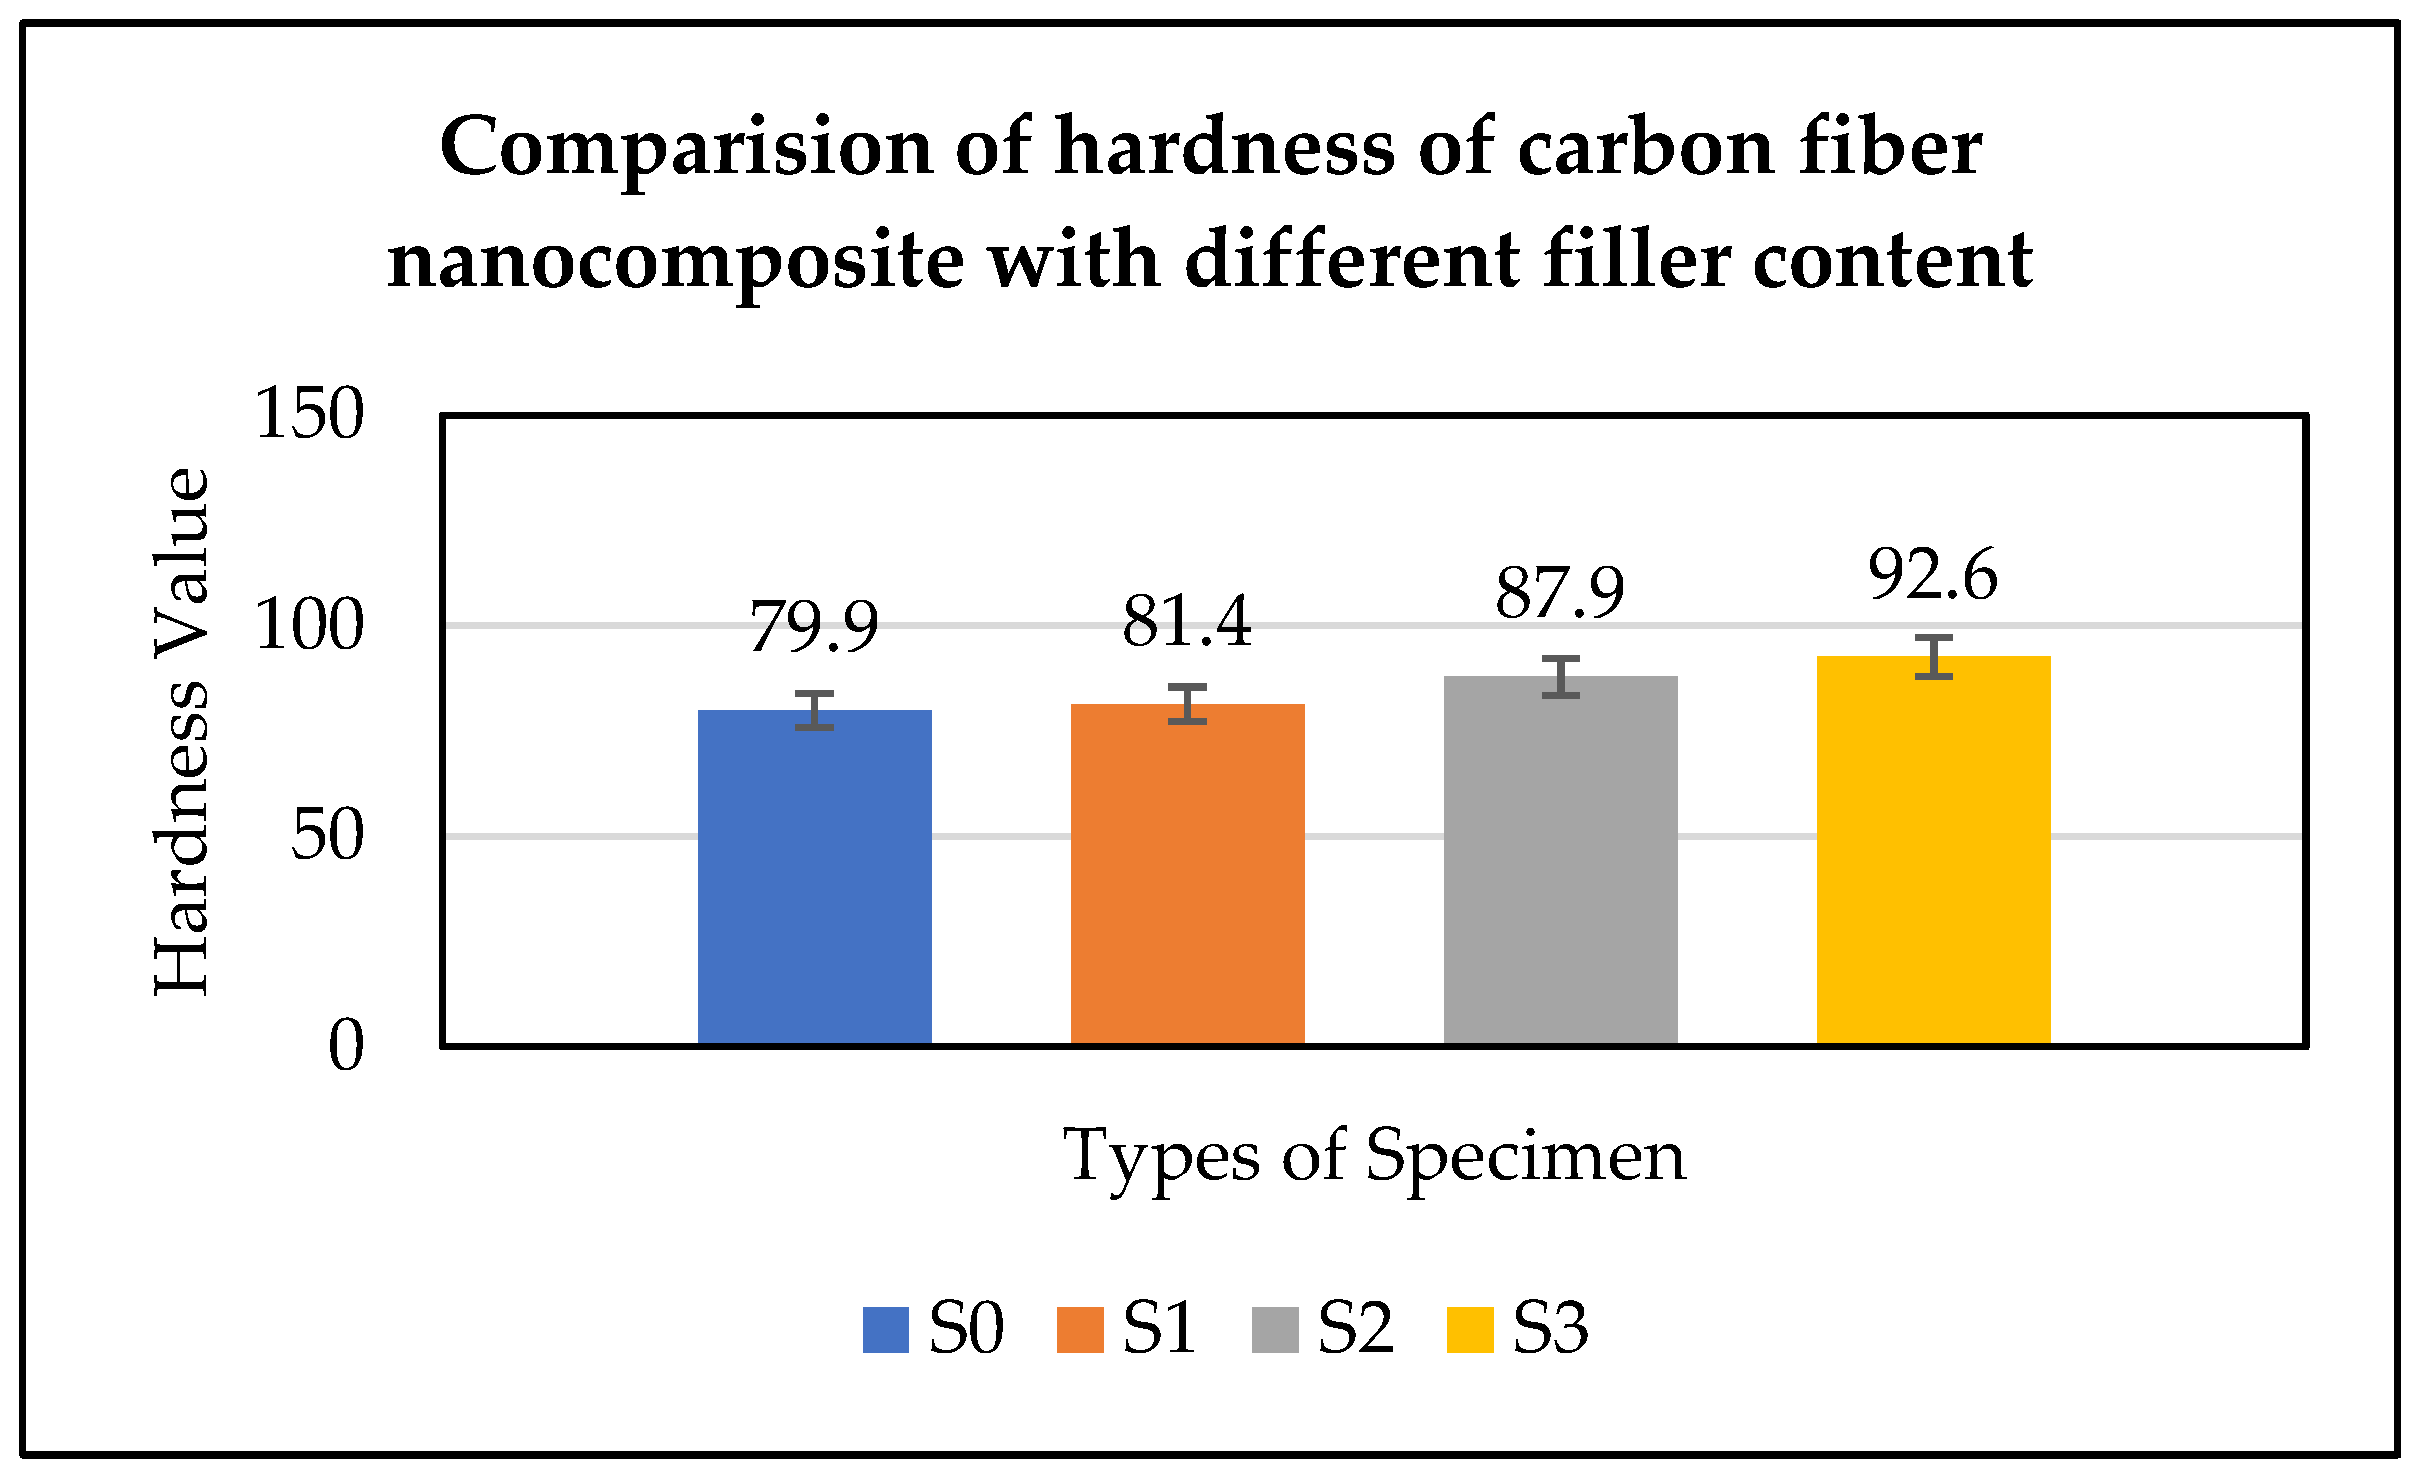
Specimen S0 has a shore hardness value of 79.9 which was increased by 1.85%, 7.67%, and 5.20% when the nano composition has increased by 0.5 wt.%, 1 wt.% and 2 wt.%, respectively. The noticeable hardness difference in Figure 8 can be observed from S2 and S3, leaving S3 as the high hardness specimen compared to other specimens by having 2 wt.% of nanomaterials i.e 6 g. The improvement in this property is particularly due to the incorporation of SiC nanomaterials into the epoxy resin. The comparison between specimens is shown in Figure 8.

3.4. Heat Deflection Temperature Tests (HDT)

The HDT test results were obtained from the nanocomposites which are subjected to elevated temperatures ranging from 24 to 120 °C under loading conditions.
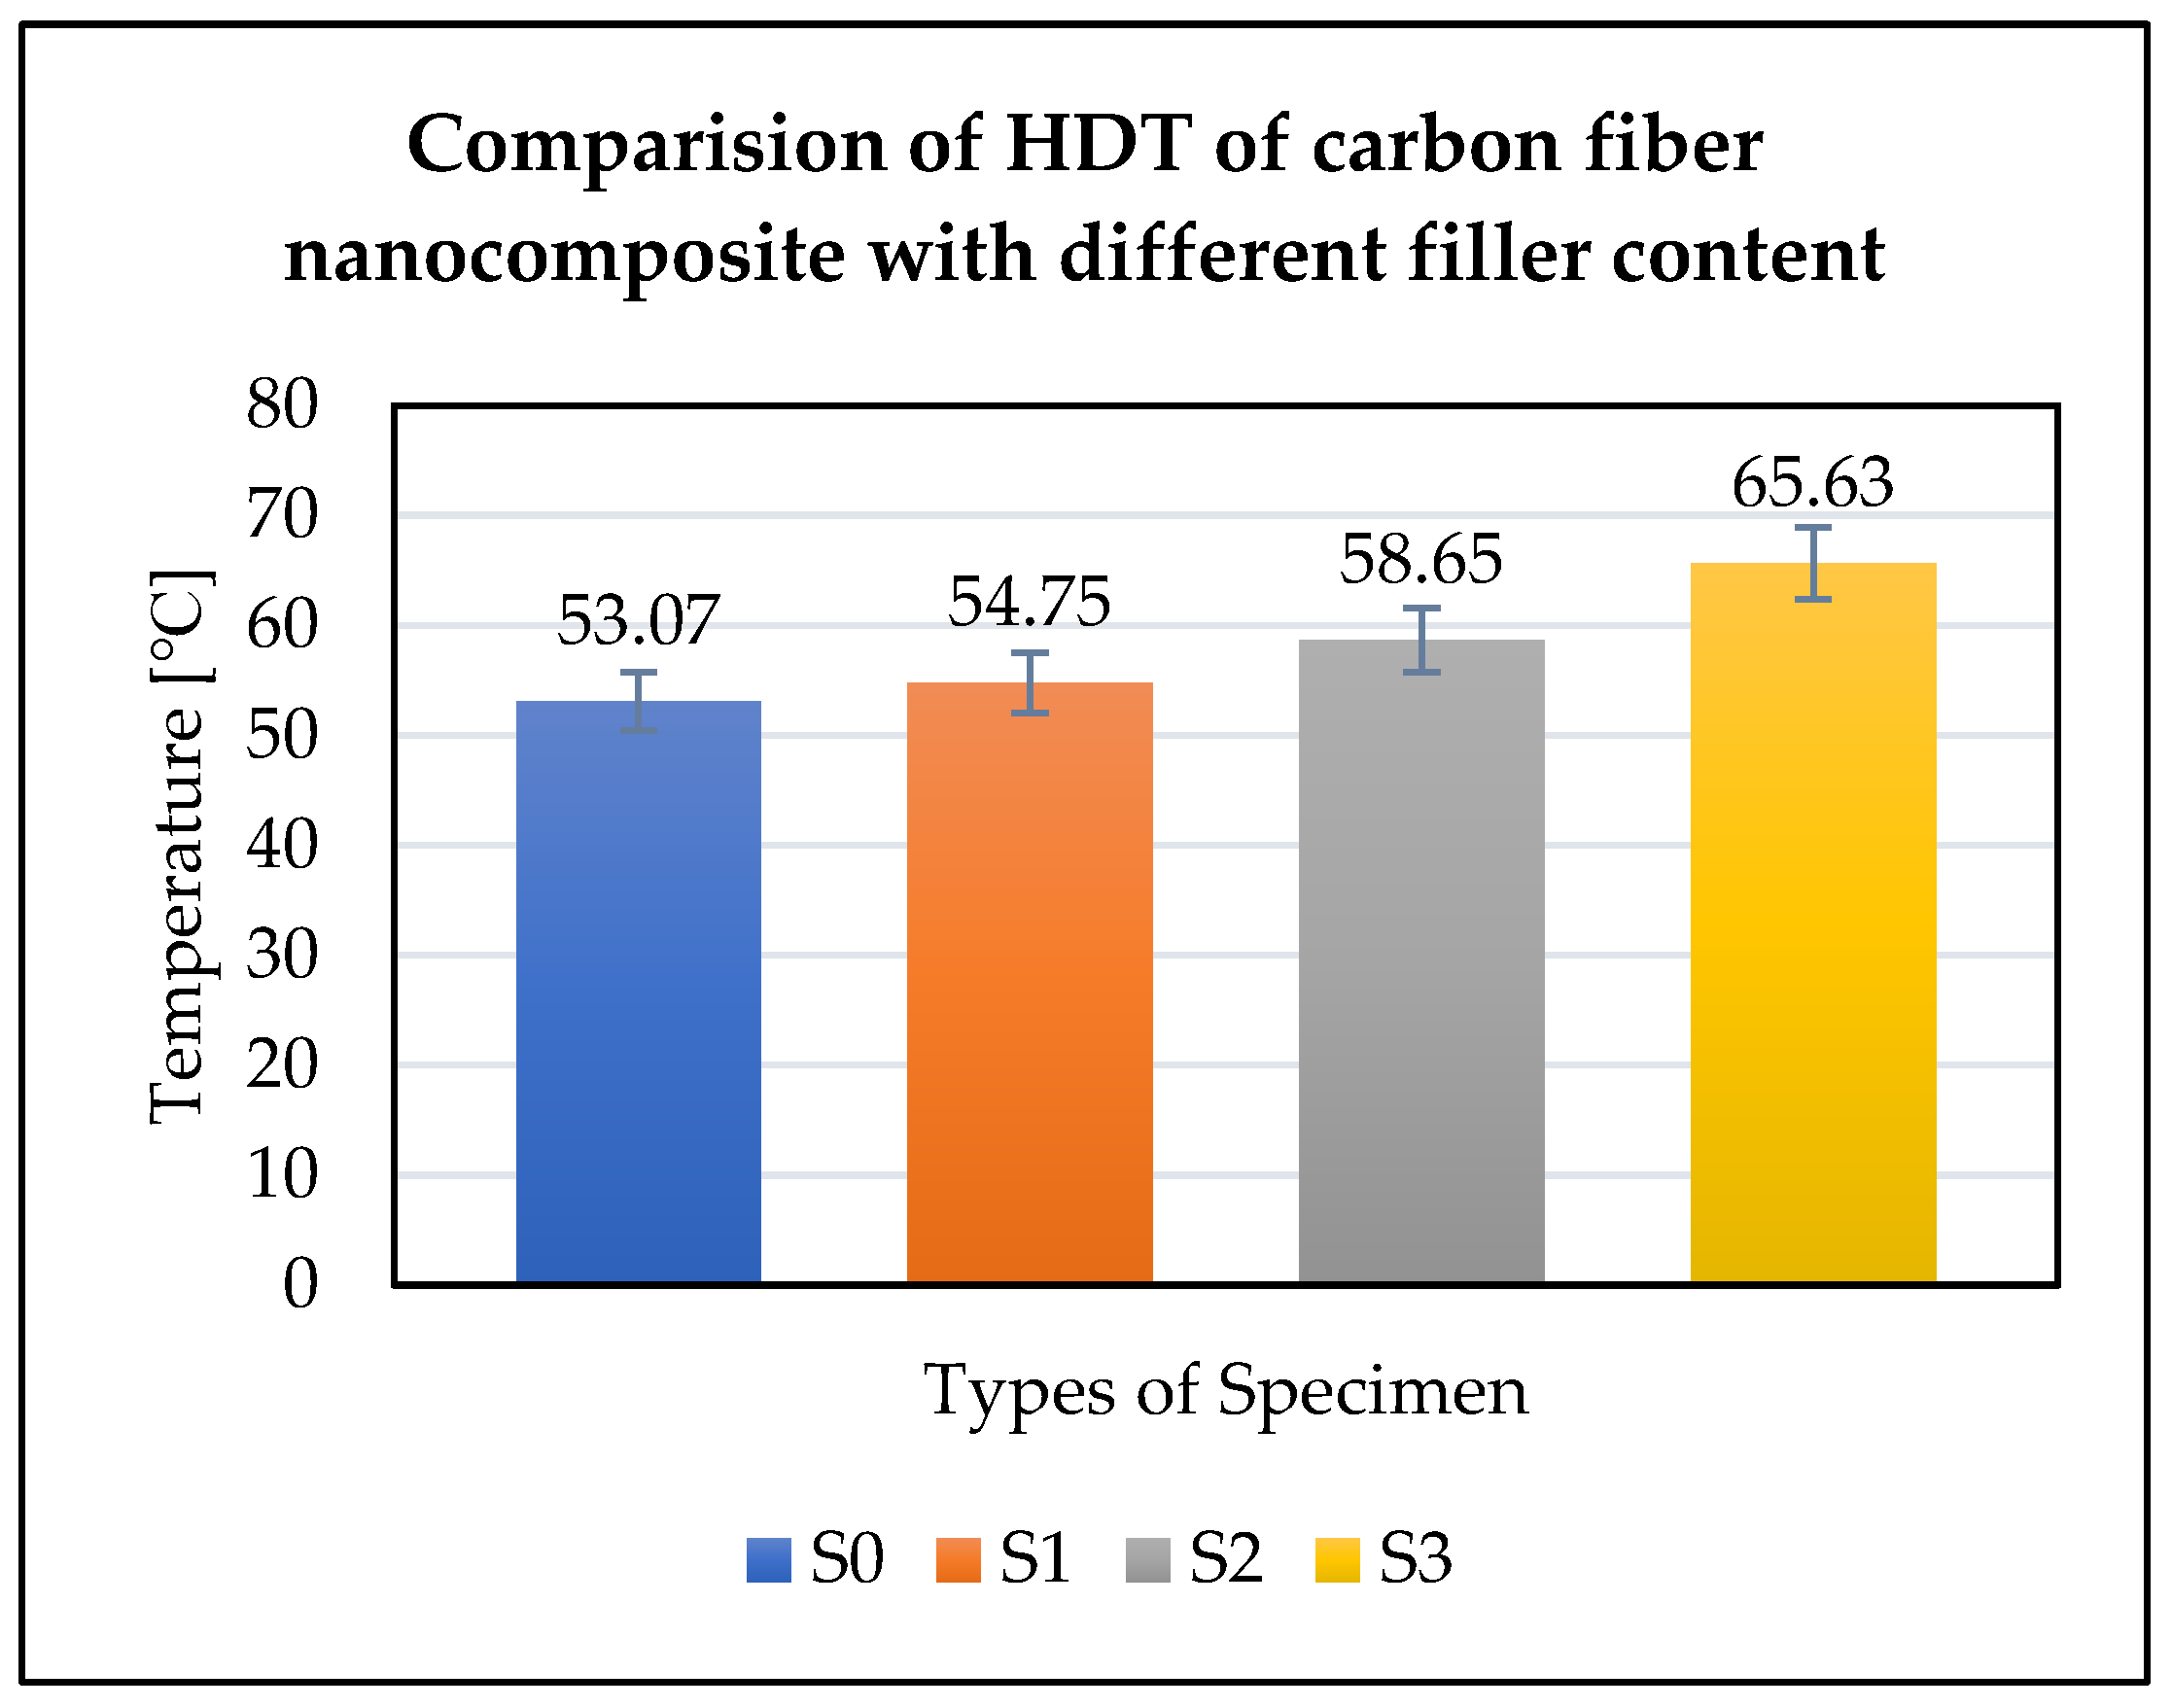
When applying an equal amount of load to all specimens, specimen S0 deflected at a temperature of 53.07 °C. And Specimen S2 deflected more i.e 0.02 mm at a temperature of 58.65 °C compared to the remaining 3 specimens. Meanwhile, specimen S3 deflected same as S0 and S1 i.e 0.01 mm.
The percentage of increase in average HDT between S0–S1, S1–S2, and S2–S3 is 3.11%, 6.87%, and 11.23%, respectively. The overall increase of HDT value from S0 to S3 is 53.07 °C to 65.63 °C, which forms an increase of 21.16%. The comparison between each composition is given in Figure 9.

4. Conclusions

TiO2 and SiC nanomaterials were used as fillers in this research work to develop carbon fiber nanocomposite with good properties. The findings revealed that the addition of nanomaterials influenced the mechanical and thermal properties of the carbon fiber nanocomposite. Better nanomaterial dispersion in the matrix attributed to the effective transfer of load from matrix to fiber. This mechanism, in turn, improved the load-carrying ability of the composite during tensile and flexural loading. The matrix started cracking first during loading then the load is transferred from the matrix to the high modulus reinforcing fiber by the nanomaterials via a mechanical interlocking system. As a result, the energy absorbing capability of the nanocomposite increased, enhancing the composite’s toughness.
The TiO2 nanomaterials have showcased the nano property of high thermal stability by withstanding high temperatures when compared with carbon fiber with no nano content (S0), and the hardness property of SiC nanomaterials has made its way into the composite, increasing the hardness of specimen S3 by 14.72% when compared to specimen S0.
Significant enhancements were observed in the performed tests. Between 0 wt.% and 2 wt.%, the tensile strength, flexural strength, impact strength, hardness and HDT properties were increased by 17%, 39%, 32%, 14% and 21%, respectively, due to the addition of nanomaterials into the resin. Among the weight percentage of nanomaterials used, the 2% (S3) was the most effective by showing an impeccable increase in properties.
5. Future Scope

In the future, engineers can continue this research by increasing the nano content to higher values and can expect very good results. This work can be further extended to study other aspects of such composites using other potential fillers for hybrid composites and the evaluation of their mechanical and physical behaviour.
It can also be proved that this nanocomposite might withstand UV radiation as the composite consists of nano TiO2, which is highly used in coatings to protect the material or surfaces from dangerous UV radiation, which opens a deep area of applications.

Author Contributions

S.C.R.M. contributed to data collection, synthesis, and writing of the initial drafts of the manuscript. J.S. helped with research progress and reviewing the report. Methodology and supervision were contributed by Y.P.S. All authors have read and agreed to the published version of the manuscript.

Funding

This research received no external funding.

Institutional Review Board Statement

Not applicable.

Informed Consent Statement

Not applicable.

Data Availability Statement

Not applicable.

Acknowledgments

I thank the Kaiserslautern University of Applied Sciences, Pirmasens Campus for financially supporting this research project. I would also like to thank Leibniz-Institut for Verbundwerstoffe GmbH (IVW), Kaiserslautern for allowing me to use the dissolver for nano-dispersion.

Conflicts of Interest

The authors declare no conflict of interest.

References

  1. Stefania, T.; Aikaterini-Flora, A.T.; Dimitrios, A.D.; Costas, A.C. Novel CNTs grafting on carbon fibres through CVD: Investigation of epoxy matrix/fibre interface via nanoindentation. MATEC Web Conf. 2019, 304, 01014. [Google Scholar]
  2. Suong, V.H. Principles of the Manufacturing of Composite Materials; DEStech Publications: Lancaster, PA, USA, 2009. [Google Scholar]
  3. European Commission. Nanomaterials. Available online: https://ec.europa.eu/environment/chemicals/nanotech/index_en.htm (accessed on 14 August 2022).
  4. John, C. Nanocomposites and Polymers with Analytical Methods; InTech Publications: Rijeka, Croatia, 2011; p. 3. [Google Scholar]
  5. Yi, S.; Du, S.; Zhang, L. Composite Materials Engineering; Springer: Singapore, 2018; Volume 2, p. 69. [Google Scholar]
  6. Robin, A.M. Common nano-materials and their use in real-world applications. Sci. Prog. 2012, 95, 8–12. [Google Scholar]
  7. TDMA—Titanium Dioxide Manufacturers Association. What Is Titanium Dioxide? Available online: http://tdma.info/what-is-titanium-dioxide/ (accessed on 1 August 2022).
  8. Guijun, X.; Rolf, W.; Frank, H. Friction and wear of epoxy/TiO2 nanocomposites: Influence of additional short carbon fibers, Aramid and PTFE particles. Compos. Sci. Technol. 2006, 66, 3199–3209. [Google Scholar]
  9. Shuqing, H.; Chunxiang, L.; Shouchun, Z. Facile and Efficient Route to Polyimide-TiO2 Nanocomposite Coating onto Carbon Fiber. ACS Appl. Mater. Interfaces 2011, 3, 4744–4750. [Google Scholar]
  10. Susan, M.R.; Mikayla, K.M.; Amit, K.N.; Christopher, C.B. Enhancing functionalities in carbon fiber composites by titanium dioxide nanoparticles. Compos. Sci. Technol. 2021, 201, 108491. [Google Scholar]
  11. Zhang, Z.; Breidt, C.; Chang, L.; Haupert, F.; Friedrich, K. Enhancement of the wear resistance of epoxy: Short carbon fibre, graphite, PTFE and nano-TiO2. Compos. Part A Appl. Sci. Manuf. 2004, 35, 1385–1392. [Google Scholar] [CrossRef]
  12. AZO Nano Website. Silicon Carbide (SiC) Nanoparticles—Properties, Applications. Available online: https://www.azonano.com/article.aspx?ArticleID=3396#:~:text=Silicon%20carbide%20(SiC)%20nanoparticles%20exhibit,to%20oxidation%20at%20high%20temperatures (accessed on 1 August 2022).
  13. Mantry, S.; Sankar, M.; Mohapatra, S.; Singh, S.K.; Mandal, A.; Satapathy, A. Erosion behaviour of glass-epoxy composites filled with SiC from bamboo leaf. Int. Polym. Process. 2011, 26, 164–172. [Google Scholar] [CrossRef]
  14. Subbaya, K.M.; Suresha, B.; Rajendra, N.; Varadarajan, Y.S. Grey-based Taguchi approach for wear assessment of SiC filled carbon–epoxy composites. Mater. Des. 2012, 41, 124–130. [Google Scholar] [CrossRef]
  15. Nallusamy, S. Characterization of epoxy composites with TiO2 additives and E-glass fibers as reinforcement agent. J. Nano Res. 2016, 40, 99–104. [Google Scholar] [CrossRef]
  16. Yong, L. Polymer nanocomposites: The nano effect on mechanical properties. Polym. Rev. 2007, 47, 217–229. [Google Scholar]
  17. Bello, S.A.; Agunsoye, J.O.; Adebisi, J.A.; Hassan, S.B. Effect of aluminium particles on mechanical and morphological properties of epoxy nanocomposites. Acta Period. Technol. 2017, 25–38. [Google Scholar] [CrossRef] [Green Version]
  18. Mohammad, A.C.; Nayem, H.; Bengir, A.S.; Arefin, K.; Akibul, I.; Ramjan, A.; Yaser, A.B.; Zeinhom, M.B. Improvement of interfacial adhesion performance of the kevlar fiber mat by depositing SiC/TiO2/Al2O3/graphene nanoparticles. Arab. J. Chem. 2021, 14, 103406. [Google Scholar]
  19. Nathaniel, C.; Hassan, M.; Vijaya, K.R.; Adnan, A.; Shaik, J. Fabrication and mechanical characterization of carbon/SiC-epoxy nanocomposites. Compos. Struct. 2005, 67, 115–124. [Google Scholar]
  20. Ghelich, R.; Mehdinavaz, A.R.; Jahannama, M.R. Elevated temperature resistance of SiC-carbon/phenolic nanocomposites reinforced with zirconium diboride nanofibers. J. Compos. Mater. 2018, 52, 1239–1251. [Google Scholar] [CrossRef]
Figure 1. Dissolver machine.
Jcs 06 00312 g001
Figure 2. Mixing of nanomaterials in resin at 5800 rpm.
Jcs 06 00312 g002
Figure 3. VARTM setup.
Jcs 06 00312 g003
Figure 4. Flexural strength.
Jcs 06 00312 g004
Figure 5. Tensile strength.
Jcs 06 00312 g005
Figure 6. Stress vs. Strain schematic diagram.3.3. Impact Tests.
Jcs 06 00312 g006
Figure 7. Impact strength.
Jcs 06 00312 g007
Figure 8. Shore D Hardness.
Jcs 06 00312 g008
Figure 9. Heat deflection temperature (HDT).
Jcs 06 00312 g009
Table 1. Carbon fiber properties.
S. NoPropertyValue
1Tensile strength4120 MPa
2Tensile modulus234 GPa
3Density1.79 g/cm3
4Filament diameter7 µm
5Filament count3000 (3k)
6Weave1 × 1 Plain
Table 2. Epoxy resin properties.
S. NoPropertyValue
1Max service temperature73 °C
2Tensile strength63.5–73.5 MPa
3Flexural modulus3.35 GPa
4Density1.15 g/cm3
5Viscosity (20 °C)200–450 mPa.s
Table 3. Titanium dioxide properties.
S. NoPropertyValue
1TypeMixed rutile and anatase phase
2Average particle size21 nm
3Specific surface area (BET)50 ± 15 m2/g
4Density4.23 g/cm3
Table 4. Silicon carbide properties.
S. NoPropertyValue
1Average particle size25–50 nm
2Specific surface area (BET)18 m2/g
3Density3.1 g/cm3
Table 5. Weight of materials used.
SpecimenWeight of Total Composite [g]Weight of Resin [g]Weight of Fiber [g]Weight of TiO2 [g]Weight of SiC [g]Total Nanomaterials [g]
S0285171.6113.4---
S1285170.1113.40.750.751.5
S2285168.6113.41.51.53
S3285165.6113.4336
Table 9. Results of flexural tests.
SpecimenEf [MPa]σfM [MPa]
S08554275.4
S18834292.4
S29016319.6
S310,928328
Ef—flexure modulus, σfM—flexural strength.
Table 10. Results of tensile tests.
SpecimenEt [MPa]σY [%]εY [%]σM [MPa]
S010,3002052.1205
S110,6002443.7244
S219,6002971.8297
S324,9003051.9305
Et—tensile modulus, σY—yield strength, εY—yield strain, σM—tensile strength.
Publisher’s Note: MDPI stays neutral with regard to jurisdictional claims in published maps and institutional affiliations.