Abstract
This study attempted to harness the dual benefit of adsorption and photocatalytic degradation for efficiently removing a model anionic azo dye, Orange G, from an aqueous solution. For this purpose, a series of bifunctional nanohybrids containing different proportions of naturally occurring biopolymer chitosan and ternary photocatalyst made of kaolinite, TiO2, and ZnO were prepared through the dissolution of chitosan in acid and subsequent deposition on ternary photocatalyst. The characterization through Fourier-transform infrared spectroscopy (FT-IR), X-ray diffraction (XRD), field emission scanning electron microscopy (FE-SEM), and energy dispersive X-ray spectrum (EDS) have confirmed the successful fabrication of nanohybrids from TiO2 and chitosan. The adsorptive separation of Orange G from the aqueous solution and subsequent degradation under solar irradiation was thoroughly studied by recording the λmax value of dye in the ultraviolet–visible (UV-Vis) spectrophotometer at various operating conditions of pH, dye concentration, contact time, and compositional variation. The nanohybrid (TP0.75CS0.25) fabricated from 75% ternary photocatalyst (w/w) and 25% chitosan (w/w) removed 97.4% Orange G within 110 min at pH 2.5 and 10 mg/L dye concentration. The relative contribution of chitosan and ternary composite on dye removal was understood by comparing the experimental results in the dark and sunlight. Recyclability experiments showed the suitability of the nanohybrid for long-term repeated applications. Equilibrium experimental data showed a better correlation with the Langmuir isotherm and pseudo-second-order kinetic model. The rapid and nearly complete removal capacity, long-term reusability, and simple fabrication technique make this novel nanohybrid a promising advanced material for removing hazardous azo dyes from industrial effluents.
1. Introduction
The textile and garments industries are recognized as major contributors to the severe deterioration of surface water quality [1]. Large quantities of dyestuff are used in these industries due to fabric processing and polishing the final products. These organic dyes are non-biodegradable and present in the range of 10 to 200 ppm concentration in wastewater. As a result, uptake of these wastewater causes serious health hazards, such as skin irritation, kidney failure, or even cancer [2]. In addition, this is also a source of threat to the environment. The natural photosynthetic phenomenon is interrupted by the inhabitation of sunlight into the stream due to the colored compounds of the dyes. For example, vinyl sulfone dyes, also known as azo dyes, are a class of reactive dyes effectively used for silk, cotton, and wool. It is reported in literature that more than 30% of the used dyes remain in the spent dye bath after the dyeing process [3,4]. Effluents from textile industries contain approximately 10–15% of the dyes used in the dyeing process and act as a source of harmful gases, numerous inorganic and organic compounds, and toxic metals [5]. As a result, the aquatic and terrestrial lives are adversely affected, and long exposure to these untreated discharge toxic effluents causes serious health hazards and neurological disorders [6,7,8]. Since these azo dyes are carcinogenic and mutagenic, it is necessary to remove these dyes from wastewater. The world is now seriously concerned with its environmental issues and has adopted several policies associated with ‘green technology’, ‘eco-friendly industry’, ‘green banking’, etc. Polluted wastewater from textile industries are definitely harmful for human beings and thus warrant us to seek the right initiatives for the remedies.
Environmental pollution is a ramification of the direct disposal of dyes to nearby water bodies. Wastewater originating from the dyeing and finishing process is considered high-strength wastewater due to the chemical oxygen demand (COD) concentration level exceeding 1600 mg/L and a persistent strong dark color [9,10]. These harmful dyes are taken up through the roots when high-strength wastewater comes in contact with plants that grow near the industries [8]. Hence, it is a burning issue to find ways to degrade these dyes from the effluents using simple and inexpensive materials so that they cannot come in contact with the plants.
Therefore, major attention has been drawn to remedying this environmental problem in the recent past [11,12]. Several chemicals, physical, and biological methods have been reported in the literature for the removal of dyes from industrial effluents, such as advanced oxidation, membrane filtration, coagulation, flocculation, biosorption, filtration, ozonation, and so on [13,14,15,16]. Most of these methods are costly and non-feasible due to high energy consumption [17]. However, the simplicity of design, effective nature of toxic substances, and lower cost make the adsorption technique superior to other available methods [18,19]. There are numerous adsorbents available that have been used in this method, such as activated carbon, biomaterials, chitosan, agro-biopolymers, and so on [18,19,20]. Activated carbon has a higher adsorption capacity for the efficient removal of organic contaminants, but the non-economic aspect of it, such as the difficulty in regeneration and high-cost operation, led to the consideration of other adsorbents available in nature. For example, chitosan, a biodegradable and non-toxic material used as an alternative adsorbent for the removal of anionic dyes as the amino (–NH2) and hydroxyl (–OH) functional groups of this can serve as the coordination and reaction sites [20,21,22,23,24]. The selective nature and high effectiveness for the reduction of dye concentration to ppb levels make it a more suitable adsorbent than any other conventional ion-exchange resins and commercial activated carbons [25]. Additionally, it can be prepared from waste prawn shells which cause waste problems and hazard to our environment. Thus, the use of chitosan is an excellent choice for the adsorption of these stubborn dyes to ensure efficient textile dye removal by using waste prawn shells to produce chitosan, a valuable material, recycle waste materials, and reduce environmental pollution.
There are some limitations of chitosan which have been reported in the literature in the recent past, such as the tendency to form a gel, float in water, and become soft in aqueous media due to the high hydrophilic nature, higher solubility in acidic medium, low specific gravity, low mechanical properties, and smaller surface area [26,27]. Therefore, these limitations needed to be addressed properly, and the formation of composites with chitosan resolve these issues. In a recent study, Soliman et al. designed a chitosan metal-oxide-based novel nanocomposite for the elimination of disperse red 60 dye from aqueous solutions which showed a maximum adsorption capacity of 100 mg/g [18]. In this regard, this study commenced by preparing a novel nanohybrid containing chitosan and a ternary composite (TiO2, ZnO, and kaolinite). The ternary composite has been studied and promised to be used as an efficient adsorbent for the removal of azo dyes from wastewater due to its high photocatalytic activity, non-toxicity, high photochemical stability, and low cost. Therefore, we are interested in developing a novel nanohybrid of ternary nanocomposite and chitosan for the most efficient removal of textile dyes by harnessing the dual nature of adsorption and photocatalytic degradation.
2. Materials and Methods
2.1. Materials
Chitosan was extracted from prawn shells obtained from a local prawn hatchery (Satkhira district, Bangladesh). Lab-grade commercial titanium dioxide (TiO2) and zinc oxide (ZnO) were purchased from MERCK KGaA (Darmstadt, Germany). Kaolinite is obtained from locally available Bijoypur clay. Lab-grade Orange G (C16H10N2Na2O7S2) dye was purchased from Sigma Aldrich, MERCK KGaA (Darmstadt, Germany). Purified NaOH pellets, hydrochloric acid (35%), and buffer solutions (pH 4 and pH 7) have been supplied by Active Fine Chemicals Ltd., Dhaka, Bangladesh. Acetic acid, acetone, methanol, and ethanol were procured from Merck KGaA, Darmstadt, Germany.
2.2. Methodology
2.2.1. Preparation of the Nanohybrids
Preparation of Chitosan from Waste Prawn Shells
Preparation of chitosan from prawn shells involves three main steps: deproteinization, demineralization, and deacetylation. About 10 gm of the prawn shell was first washed in a 2 L beaker with distilled water for about 90 min at 80 °C with occasional stirring to increase the rate of cleaning. After cleaning, the raw prawn shells were placed in an oven at 60 °C for about 10 h. The dried shells then underwent deproteinization and were treated with 3% NaOH (w/w) at a ratio of 1:18 (w/w) for about 3 h at 80 °C. Then, the proteins underwent decantation for removal. To demineralize the shells, 3 M HCl was used at a ratio of 1:18 (w/w) for about 4 h. In this step, the evolution of CO2 occurred, and chitin was obtained. Then, the chitin was neutralized by washing with distilled water and was placed in the oven at 60 °C for 10 h. To obtain chitosan from this dried chitin, it was deacetylated by using 50% NaOH (w/w) for about 4 h at a ratio of 1:18 (v/v). Then, the chitosan was obtained by filtering the solution and was washed with acid to remove the additional alkali. The solubility of chitosan was tested using a 1% (v/v) acetic acid solution [28]. Figure 1 shows the images of prawn shells at different steps of chitosan preparation:
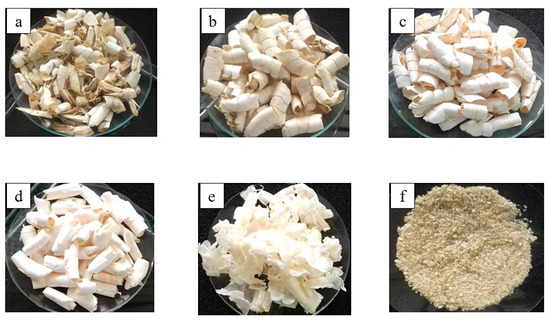
Figure 1.
Images of (a) raw prawn shells, (b) prawn shells after sorting, (c) prawn shells after washing, (d) prawn shells after deproteinization, (e) prawn shells after demineralization, (i.e., chitin) and (f) chitosan.
Preparation of Ternary Photocatalyst
The ternary photocatalyst was obtained from kaolinite, TiO2, and ZnO. These precursors were mixed at an optimized composition of 50% kaolinite, 45% TiO2, and 5% ZnO in deionized water. The mixture was then sonicated for about 60 min at 50 °C. The solid mass was then isolated by evaporation in the oven at 100 °C for about 60 min. Then, the dried product was ground to increase the surface area. The obtained powder then underwent calcination in a muffle furnace at different temperatures. The synthesis was facilitated by this high-temperature environment. Then, the calcined product was ground again to increase its reactivity in the dye removal operation [29]. Figure 2 illustrates the schematic diagram of the preparation steps of the ternary photocatalyst.
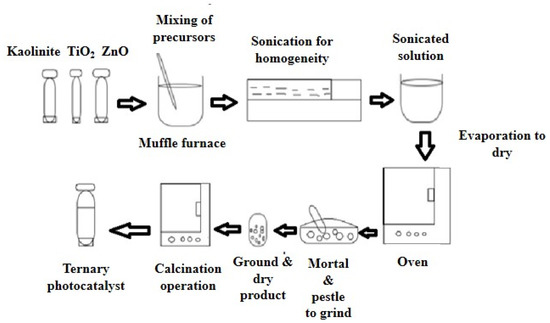
Figure 2.
Scheme of ternary photocatalyst preparation.
Preparation of Nanohybrid Material
Three different nanohybrids with different weight ratios of ternary photocatalyst and chitosan were prepared. The chitosan flakes were dissolved in 100 mL of 1 M acetic acid solution. After that, the prepared ternary photocatalyst was added to the solution, and the final mixture was sonicated for 50 min to obtain a homogenous viscous mixture. Then, the mixture was added to a solvent mixture (15% NaOH and methanol in a ratio of 4:1 (v/v)) at a constant rate in a drop-wise manner that led to the formation of the composite as beads. The beads were then washed multiple times to remove the additional NaOH and placed in the oven at 80 °C for about 10 h. The dried product was ground with mortar and pestle to make it finer and thus increase its surface area and reactivity [30,31]. The fabrication of the nanohybrid was strongly controlled by the pH of the medium. Three different nanocomposites were prepared with varying ratios of ternary photocatalyst and chitosan, as shown in Table 1.

Table 1.
Nanocomposites with varying ratio of ternary photocatalyst and chitosan.
2.2.2. Characterization of Chitosan, Ternary Photocatalyst, and Nanohybrids
Fourier-Transform Infrared Spectrophotometry (FT-IR) Analysis
To identify the functional groups present in the samples and any chemical interactions among the components of the nanohybrids, FT-IR spectra of samples were recorded on an FT-IR 8400S spectrophotometer (Shimadzu Corporation, Japan) in the wavenumber range of 4000 to 400 cm−1, resolution of 4 cm−1; and scans of 30. Approximately 1 mg of the samples were ground with 100 mg KBr by agate mortar, and then, the pellet was made from the mixture by applying pressure.
X-ray Diffraction (XRD) Analysis
To analyze the phase of the samples, XRD patterns of the samples were recorded by an X-ray diffractometer (Ultima IV, Rigaku Corporation, Tokyo, Japan) at room temperature. Prior to XRD analysis, the samples were ground into fine powders using mortar and pestle. Cu Kα radiation (λ = 0.154 nm) from a broad focus Cu tube operated at 40 kV and 40 mA was applied to the samples for measurement. The XRD patterns of the samples were measured in the continuous scanning mode with a scan speed of 3°/min and in the scan range of 5 to 100°. Bragg’s law was used to compute the basal spacing of the crystalline samples.
Scanning Electron Microscopy (SEM) and Energy Dispersive X-ray Spectrophotometry (EDS)
An analytical scanning electron microscope (JEOL JSM-6490LA, Tokyo, Japan) was used to analyze the sizes, surface morphologies, and shapes of the particles. The back-scattered electron mode was operated at 20 kV accelerating voltage. Magnification of the sample was employed to further investigate the samples in terms of their microstructures and morphologies. The elemental composition of the prepared composite was determined by taking its EDS spectra.
2.2.3. Removal of Orange G Dye
Preparation of Standard Solutions of Orange G
A stock solution of 500 ppm of Orange G was prepared by dissolving 0.125 g of Orange G in distilled water in a 250 mL volumetric flask to reach a total volume of 250 mL. A series of dilutions were made from this stock solution with concentrations of 5 ppm, 10 ppm, 20 ppm, 30 ppm, 40 ppm, 50 ppm, 60 ppm, 70 ppm, 80 ppm, 90 ppm, 100 ppm, and 150 ppm. The λmax was determined, and a calibration curve of absorbance versus concentration was drawn for Orange G. The concentration of Orange G in the aqueous solution was then determined at its λmax using a UV–visible spectrophotometer (UV-2100PC, Human Lab Instrument Co., Suwon-city, Korea).
Removal of Orange G Using the Nanohybrid Particles
Batch experiments were performed for the determination of the % removal of dye using the nanohybrid particles. A total of 25 mL of viscous solutions of Orange G solutions were taken in different 100 mL beakers. Then, 5 mg of nanohybrid was added to the beakers. A mechanical shaker was utilized to shake the beakers at 120 rpm at room temperature. Amounts of 0.1 M NaOH and 0.1 M HCl were introduced to optimize the pH of the solutions. The Orange G loaded composites were separated from the suspensions by centrifuging at 3000 rpm for 60 min, and the residual concentration of Orange G in the solutions was determined by taking absorbance at 478 nm (λmax of Orange G).
The percentage removal of dye was calculated using the following formula (Equation (1)):
where = the equilibrium concentration of Orange G (mg/L), and = the initial concentration of Orange G (mg/L).
To find the maximum dye removal efficiency for the synthesized nanohybrid material, several parameters were investigated to observe its behavior in different environments. These parameters may have lesser or greater effects on the efficiency, and thus, we will obtain the optimized situation for the nanohybrid to work in industrial applications. Therefore, we focused on pH, initial dye concentration, compositional variation of nanohybrid, contact time, degradation in dark and in sunlight, and desorption study while carrying out the application of the nanohybrid material on the removal of Orange G dye. The equilibrium adsorption data was tested by plotting in Langmuir and Freundlich adsorption isotherm equations. The kinetics of the dye removal process were studied using the pseudo-first-order and pseudo-second-order kinetic models.
Reusability Experiments
The reusability test was carried out for this nanohybrid and showed excellent removal efficiency up to four cycles at the optimized conditions (pH: 2.5, nanohybrid: TP0.75CS0.25, concentration: 10 mg/L, time: 110 min). After the end of each operation, the nanohybrid was filtered and washed with alkali (with pH ≈12) to remove the adsorbed dye. The treated dye was then washed with plenty of distilled water to remove extra alkali and finally dried in the oven again. Then, this recovered nanohybrid was reused for the next operation.
3. Results & Discussion
3.1. Fourier-Transform Infrared (FT-IR) Analysis
The FT-IR spectra of chitosan (Figure S1) and ternary composite (Figure S2) are presented in the supporting documentation. The characteristic peaks for the corresponding functional groups were observed in both spectrums. The FT-IR of the ternary composite, chitosan, and their composites of different compositions are compared in Figure 3. The surface chemistry of the quaternary nanohybrids represented in Table 1 could be well explained by comparing their FT-IR transmission spectrum with the starting ternary nanocomposite and chitosan. The comparison also provides valuable information on the interaction at the interface of the two components.
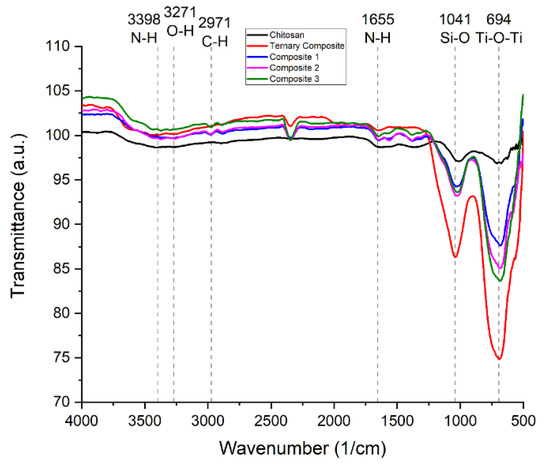
Figure 3.
FT-IR spectra of ternary composite, chitosan, and their three composites.
The characteristic peaks of kaolinite observed at 1115 and 1004 cm−1 were overlapped to give a new peak at 1035 cm−1 in the prepared ternary composite. Another two characteristic peaks of kaolinite at 3640 cm−1 and at 3670 cm−1, respectively, for the O-H stretching bond and the Al-O-H stretching bond also disappeared. The illustration in geometry and variation in intensity is shown in Figure 3. The peak of kaolinite that is gone completely in the ternary composite is due to the high-temperature calcination. However, the characteristic reflection from the (001) plane is visible in the spectra. All the characteristic peaks of both the chitosan and ternary composite were present in the nanohybrid. This information confirms the successful fabrication of the nanohybrid. Si-O stretching vibration of kaolinite in ternary composite at 1041 cm−1 is also present in the nanohybrid which justifies the presence of ternary composites [32,33]. Moreover, lower absorption intensity was observed for Ti-O-Ti stretching vibration in the ternary composite.
3.2. X-ray Diffraction (XRD) Analysis
The XRD pattern of commercial TiO2, ZnO, and ternary composite, as shown in Figure 4, revealed well-defined reflections at 2θ values of 25.34°, 37.82°, 48.07°, 53.92°, 55.09°, 62.71°, and 68.8° [34,35,36]. These are the typical characteristic peaks of tetragonal crystalline anatase-TiO2, and their matching (hkl) planes are (101), (004), (200), (105), (211), (204), and (116), respectively. The appearance of sharp diffraction patterns indicates the small size, high purity, and crystallinity of the sample [35,36,37]. The average crystallite size of titania was calculated by the Debye–Scherrer equation (Equation (2)). The full width at half maximum (FWHM) was calculated 2θ = 25.34°. This is the most intense anatase peak (101) in XRD. The Debye–Scherrer equation is given below:
where D is the crystallite size in nanometers, K is a constant known as Scherrer’s constant (K = 0.89), λ is the wavelength of X-ray for this analysis (λ = 1.54056 Å), β is full width at half maximum (FWHM) (in radian) of the diffraction peak and can be measured from the XRD pattern, and θ is the corresponding diffraction angle [34,37,38]. The crystallite size of the TiO2 was found to be 56.68 nm.
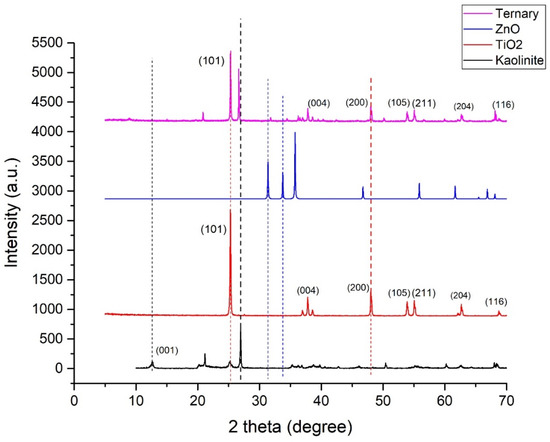
Figure 4.
XRD patterns for kaolinite, TiO2, ZnO, and ternary nanocomposite.
In Figure 5, sharp peaks reveal that the photocatalyst had high crystallinity, and the presence of characteristic peaks of starting materials of different intensities justifies their relative contributions accordingly. Characteristic peaks of kaolinite completely disappeared in the ternary composite due to high-temperature calcination. Apart from chemical interactions, it is also evident that the precursors underwent significant structural rearrangement during the formation of the ternary composite.
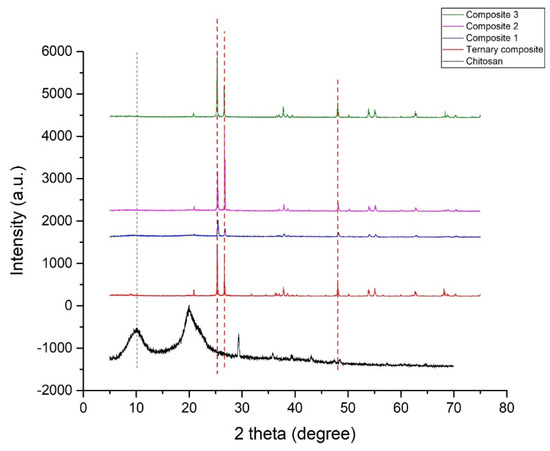
Figure 5.
XRD patterns for chitosan, ternary nanocomposite, and nanohybrids (composite 1, composite 2, and composite 3).
Two characteristic broad diffraction peaks were found in the XRD pattern of chitosan (Figure 5) at 2θ around 9.96° and 19.91°. This can be attributed to two crystalline regions in the semi-crystalline structure of chitosan. However, some small additional peaks appeared around 29.44°, 35.98°, and 39.44° [35,39].
3.3. Energy-Dispersive X-ray Spectroscopy (EDS) Analysis
EDS spectra of nanohybrid were recorded to investigate the elemental composition and presence of impurities. The EDS spectrum of the nanohybrid is displayed in Figure 6, which confirms the presence of six different elements (C, Al, Si, Zn, O, and Ti). Therefore, it could be stated without any doubt that TiO2, ZnO, kaolinite, and chitosan were present in the nanohybrid. Recording the EDS spectrum at different particles of the nanohybrid revealed nearly identical elemental composition, which strongly suggests the uniform chemical combination of ternary nanohybrid with chitosan. Additionally, the elemental composition found from the EDS analysis was identical to the theoretical calculation (Table 2). EDS spectrum also indicates that the nanohybrid was free from any impurities. The presence of impurities is undesirable since they often severely compromise the performance of the adsorbent/photocatalyst.
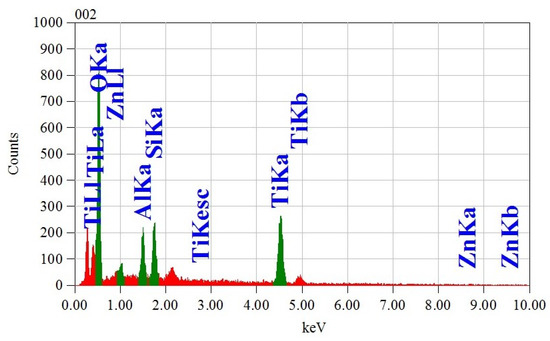
Figure 6.
Energy-dispersive X-ray spectroscopy (EDS) analysis of nanohybrid.

Table 2.
Elemental composition of the novel nanohybrid confirmed by EDS analysis.
3.4. Field Emission Scanning Electron Microscopy (FE-SEM) Analysis
The FE-SEM analysis was performed to investigate the surface morphology and particle size distribution. As shown in Figure 7, the surface of ternary particles was smooth with good dispersion. The magnification of a random particle, as displayed in Figure 7a, clearly demonstrates the flaky nature of the particles. The estimated particle size of TiO2 ranged from 50 to 250 nm, as shown in Figure 7b. It showed the majority of the particles duel within the 100 to 150 nm range (58.93%).
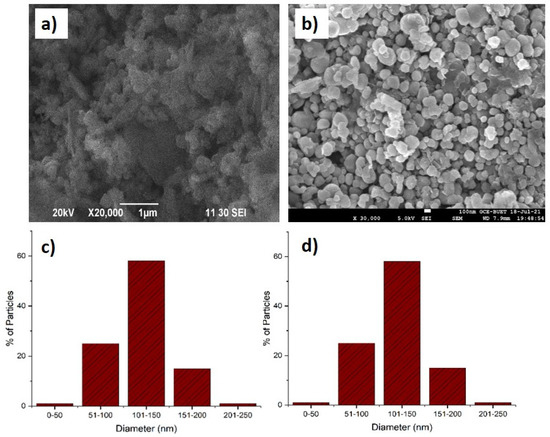
Figure 7.
FE-SEM images of ternary nanohybrid (a), TP0.75CS0.25 nanocomposite (b), histogram of particle size distribution for TiO2 (c), and TP0.75CS0.25 composite (d).
However, the FE-SEM images of the nanohybrid showed different morphological aspects compared to the ternary photocatalyst (Figure 7c). The hexagonal shape of the particles was achieved through the fabrication of the novel nanohybrid, confirmed by FE-SEM. The surface also showed no propensity to agglomeration with the majority of particles (44.68%) staying within 101–150 nm particle size. In general, the approximate sizes of the particles were found in a range of 50 to 250 nm. From Figure 7b,c, we can see that about 34% of nanohybrid particle sizes were in the nanoscale range (1–100 nm). However, in the case of the ternary photocatalyst, only 26% of particles were able to duel in this range. Therefore, it can be easily concluded that the obtained nanohybrid particles were at a higher percentage in terms of nanoscale range compared to the ternary photocatalyst. The uniform wrappings of the ternary nanohybrid by long molecular chains of chitosan with greater efficiency were able to prevent agglomeration. This phenomenon explains the lowering of particle size of nanohybrids. The wrapping of the TiO2 surface with soft and flexible chitosan could also explain the shift in morphology from flaky to hexagonal. This morphological shift also supports the interfacial interaction of ternary with chitosan. In addition, it should be stated that no odd structures were detected on the surface of the nanohybrid, which is highly expected considering the application point of view.
3.5. Application of the Nanocomposite for Removal of Orange G
3.5.1. Fixation of Wavelength of Maximum Absorbance (λmax) and Calibration Curve of Orange G
For the fixation of the wavelength of maximum absorbance (λmax) of Orange G, UV-visible spectrum of 5, 10, 20, 40, and 60 ppm standard solutions of dye were taken separately by UV-visible spectrophotometer (Human Lab instrument Co., Suwon-city, Korea) in the wavelength range of 200 to 800 nm. The wavelength where the maximum absorbance occurred was taken as the λmax of Orange G. As shown in Figure 8a, the λmax of Orange G was found to be 478 nm, and all the absorbances of the Orange G solutions were measured at this wavelength.
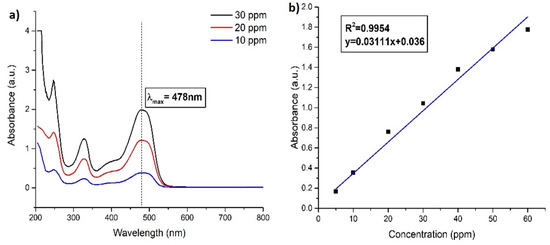
Figure 8.
(a) UV–visible spectrum of standard Orange G solutions at different concentrations and (b) calibration curve of Orange G.
The calibration curve (Figure 8) was drawn by plotting the data values of absorbance at 478 nm against various concentrations of Orange G. The curve was then used for the calculation of the unknown concentration of Orange G solutions.
3.5.2. Effect of Different Parameters on Removal of Orange G
To find out the maximum dye removal efficiency for the synthesized nanohybrid material, it would be wise to work with several parameters to observe its behavior in different environments. These parameters may have a lesser or greater effect on the efficiency, and thus, we will obtain the optimized situation for the nanohybrid to work in industrial applications. Therefore, we have focused on several parameters (discussed below) while carrying out the application of the nanohybrid material on the removal of Orange G dye.
Effect of Compositional Variation of Nanohybrids
Nanohybrids with three different compositions have been prepared to see how the efficiency changes with the variation in the composition of the raw material while being fabricated. The photocatalyst used in this study is an optimized ternary photocatalyst with a compositional ratio of 50% kaolinite, 45% TiO2, and 5% ZnO and was reported as highly efficient for low concentration of dye in literature by Hasan et al. [29]. The major incorporation of low-cost kaolinite without compromising its efficiency makes this photocatalyst far more viable for industrial application than other photocatalysts available on the scene. Therefore, it was chosen for this study to fabricate a novel nanohybrid with chitosan. Here, this photocatalyst was taken at ratios of 3:1, 1:1, and 1:3 with chitosan to fabricate a series of nanohybrids to demonstrate its relative efficiency, and the results are shown in Figure 9.
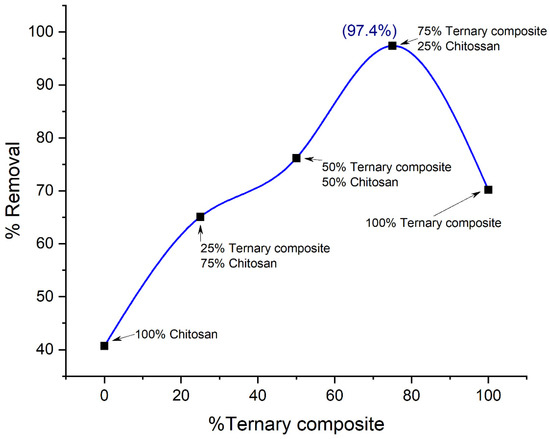
Figure 9.
Effect of compositional variation on the removal of Orange G by nanohybrids.
The nanohybrid (Composite 3) which contains 75% ternary photocatalyst and 25% chitosan showed maximum efficiency in dye removal. The efficient coating of all photocatalysts by the long-chained giant chitosan molecule can be attributed to this phenomenon. This causes an optimized synergistic effect of adsorption and photodegradation on dye molecules and a higher percentage of dye are removed. As for the other two nanohybrids composed of the ratios of 1:1 (TP0.5CS0.5) and 1:3 (TP0.25CS0.75), the adsorption property dominates more than the synergistic effect due to the lesser amount of photocatalyst coated by chitosan. Therefore, the dye removal efficiency experiences a regression, as shown in Figure 9.
Effect of pH
In Figure 10, the maximum efficiency has been found at pH = 2.5 for Composite 3 (TP0.75CS0.25). The nanohybrid material which has been used for the removal of anionic Orange G dye contains chitosan and a ternary photocatalyst. Since photocatalysis occurs on the surface, the performance of the photocatalyst is greatly influenced by the solution pH, the pollutant type, and the surface’s ability to adsorb the pollutant [30]. At pH = 2.5, chitosan is protonated at its optimum condition which pulls anionic Orange G dye towards it due to the electrostatic attraction force and results in maximum adsorption on the surface. The ternary photocatalyst, on the other hand, similarly shows maximum photocatalytic efficiency due to the occurrence of a high positive surface charge. As a result of these two optimum conditions for adsorption and photocatalytic degradation, the prime synergistic benefit from the nanohybrid has been obtained at pH = 2.5, justified by the peak at pH = 2.5 in Figure 10.
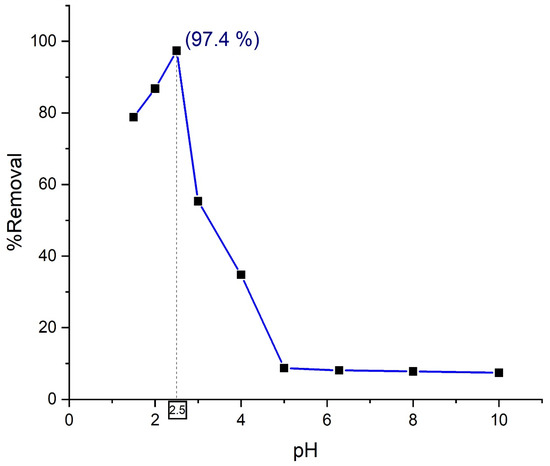
Figure 10.
Effect of solution pH on the removal of Orange G by nanohybrid Composite 3 (TP0.75CS0.25).
At a pH lower than 2.5, dye removal by nanohybrid decreased. Because at pH below 2.5, the dissolution of chitosan is higher due to increased protonation, and the interaction of protons with azo linkage causes a decrease in electron density at the azo group, resulting in lower photocatalytic degradation. The right-hand side of the peak also showcases a regression in dye removal efficiency for the synthesized nanohybrid. The environment where pH is higher than 2.5 contributes to the reduction of the degree of protonation of amino functional groups in chitosan. As a result, a lesser number of anionic dyes are attracted which eventually contributes to the rise of the abundance of negative charges. Thus, it can be assumed that repulsion forces overweighed the attractive forces as the pH of the environment increases. As a result, adsorption capability and photocatalytic efficiency of the nanohybrid compromises accordingly, and a decline in removal efficiency is observed at pH higher than 2.5.
Effect of Initial Dye Concentration
The initial dye concentration plays a pivotal role to overcome all the mass transfer resistance of dyes between the aqueous and solid phases. Therefore, the influence of different initial dye concentrations on the removal efficiency by Composite 3 (TP0.75CS0.25) has been examined in this study at pH 2.5 and 0.2 gL−1 adsorbent concentrations for 120 min. It is generally observed in the literature that dye removal efficiency is reported to increase initially with the increase of initial dye concentration up to a saturation point and then slowly decreases as a further increase of dye concentration occurred [40,41]. In this study, there is also an upward curve observed up to 10 mg/L followed by a decline in dye removal efficiency (Figure 11).
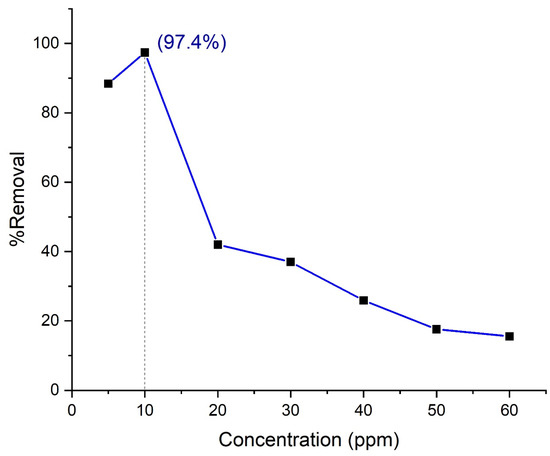
Figure 11.
Effect of solution concentration on the removal of Orange G by nanohybrid Composite 3 (TP0.75CS0.25). The pH was maintained at 2.5, and the amount of adsorbent was 0.2 g/L.
As initial dye concentration increases, the concentration gradient gradually rises between dye molecules and the nanohybrid surface. This gradient of concentration plays a pivotal role to draw dye molecules onto the surface of the material. As long as the saturation of the surface does not occur, the adsorption of the dye molecule continues to escalate. That is why a sharp upward curve has been found initially with the increase of dye concentration. The saturation of the material surface has seemingly occurred at 10 mg/L in this study, which can be attributed to the fact all the free active sites on the surface are covered by dye molecules at this concentration. Therefore, it is obvious that a decline in dye removal efficiency will happen at any concentration above 10 mg/L for a fixed dose of material, and it has been observed accordingly in the figure as well. Moreover, phenomena, such as an increase in intra-particle diffusion as a function of concentration, can also be responsible for this type of regression in dye removal efficiency.
As the material has photocatalyst activity, we should also carefully discuss this to find out how this behavior affects the dye removal efficiency along with adsorption. The photodegradation capability of the synthesized nanohybrid can be attributed to the probability of the formation of OH radicals (primary oxidants) that react with dye molecules. Initially, more dyes are found available for the nanohybrid to react as the concentration increases, as we discussed earlier. Until 10 mg/L, this process continues. However, the surface of the material seems to be fully covered by the presence of dye molecule due to enhanced adsorption brought by chitosan at 10 mg/L, and as a result, the penetration of light to the surface decreases. Thus, the relative number of available free radicals to attack the dye molecules decreases for the fixed amount of material dose, and thus, the rate of dye degradation also decreases. In addition, the adsorbed dye molecules also shield the UV light to penetrate the catalyst surface and absorb it. This phenomenon leads to lesser available UV photons to generate free radicals [42,43]. Therefore, the photocatalytic activity of the nanohybrid drops after 10 mg/L, and a gradual downward curve can be seen in % removal efficiency versus the initial dye concentration graph, as shown in Figure 11.
Effect of Contact Time
For practical application, it is essential to optimize the contact time for a material to harness the best possible outcome within a given time. Hence, the removal efficiency of Orange G dye by the synthesized nanohybrid material (Composite 3 (TP0.75CS0.25)) at an optimum pH of 2.5, dye concentration of 10 mg/L, and fixed adsorbent dose has been investigated and is shown as a function of time (0–140 min) in Figure 12.
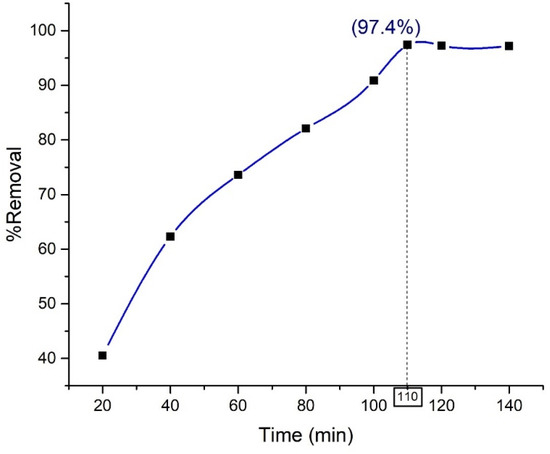
Figure 12.
Effect of contact time on the removal of Orange G by nanohybrid Composite 3 (TP0.75CS0.25).
The removal efficiency of the nanohybrid increases during its first 110 min of application followed by a steady equilibrium state until the end of the application. For materials with the dual properties of being an adsorbent as well as a photocatalyst, this initial rise in removal efficiency can be attributed to the ability of the vacant site of the adsorbent to draw more dye molecules onto it and the increased number of photogenerated free radicals with time [42,43]. The equilibrium state, however, can be caused by several reasons, such as the nearly complete coverage of the vacant site of the adsorbent by dye molecules, inhibition of the active site of the catalyst by the by-product deposits, and competition between dye molecules and the intermediate degraded product to reach the catalyst surface [43].
3.5.3. Control Experiments
For a better understanding of the dual effect of the nanohybrid (Composite 3,TP0.75CS0.25), it is important to carry out operations both in daylight and darkness. This will reveal to what extent the photocatalytic activity can affect the dye removal process along with the adsorption. The dual benefits were obtained when the process was optimized under solar irradiation. The blank experiments reveal the total percentage removal, whereas the experiment in the dark shows how much degradation occurred due to the photocatalytic activity of the catalyst. The results of the control experiment are displayed in Figure 13.
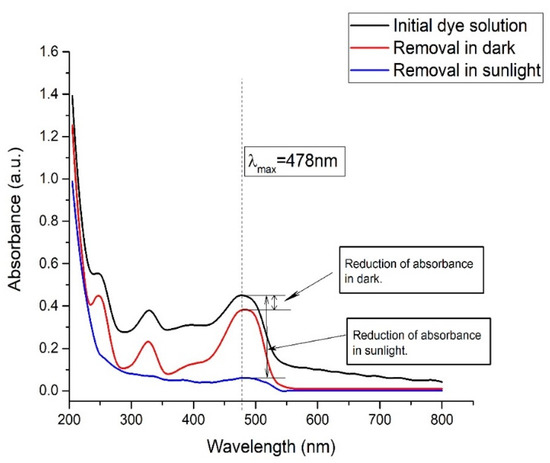
Figure 13.
Comparison of removal of Orange G in darkness and in presence of sunlight for Composite 3 (TP0.75CS0.25).
In the case of the experiment under direct sunlight with Composite 3 (TP0.75CS0.25), it is found that the concentration of the dye solution in optimum pH and concentration remained unchanged when it was irradiated without the catalyst. However, in the presence of the catalyst, 90% removal of dye was found in the first 15 min. These observations indicate that without the photocatalyst, the dye solution did not undergo any photodegradation. When the experiment was carried out in dark conditions, about 15% removal was obtained in the presence of the catalyst. As the dark environment excludes the possibility of any photodegradation occurrences, this phenomenon can be solely attributed to the ability of adsorption of the catalyst of the dye molecules. Hence, the rest of the percentage removal can be concluded due to photocatalytic degradation in the presence of solar radiation. From the control experiments, it is very clear that neither adsorption nor the photodegradation alone could lead to the highest achievable limit of dye molecules removal from the aqueous solution under the optimized conditions. The synergistic effects of both the adsorption and photocatalytic activities contribute to the almost complete removals of the dye molecules that strongly justify the fabrication of the quaternary nanohybrid.
3.5.4. Reusability/Recyclability Experiments
To be a suitable material in industrial application, repeated long-term use with easy regeneration and without compromising efficiency is essential. This will benefit the process by making it a cost-effective and more feasible one. In this study, the fabricated nanohybrid material was investigated for up to four cycles and showed almost the same efficiency in optimum conditions. The regeneration was done by treating with alkali (with pH ≈12) followed by the subsequent thorough washing with distilled water and drying after the end of each cycle. The results of this recyclability experiment are displayed as a bar chart in Figure 14.
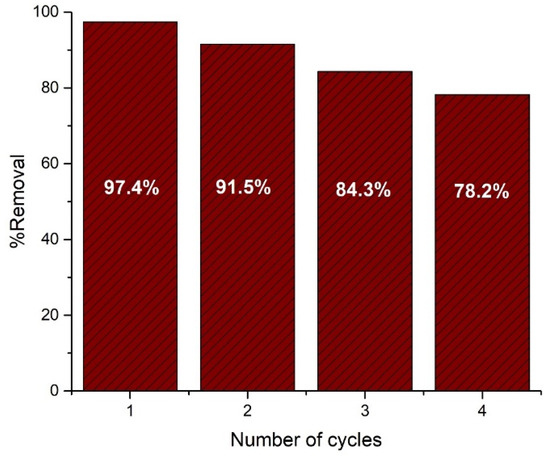
Figure 14.
Demonstration of reusability of the nanohybrid for the removal of Orange G up to four cycles.
The bar chart showed that the nanohybrid displayed a very satisfactory removal performance up to four cycles with a gradual decrease. This fall in performance can be attributed to the poisoning effect of degraded products on the active sites of the catalyst. This effect causes a blockage of solar radiation on the surface of the catalyst. The loss of material during the successive washing can also contribute to this deficiency in performance [44,45]. Nevertheless, the nanohybrid material showed satisfactory potential for long-term repeated use for the removal of dyes from wastewater. With the incorporation of very cheap kaolinite in large amounts and the ability of nearly complete and fast removal of azo dye with long-term reusability, it is very evident that this nanohybrid is a strong candidate for industrial scale uses.
3.5.5. Adsorption Isotherm
Adsorption isotherm provides valuable insights into the nature and mechanism of adsorption. The equilibrium adsorption data in dark was tested by plotting in Langmuir and Freundlich adsorption isotherm equations (Figure 15).
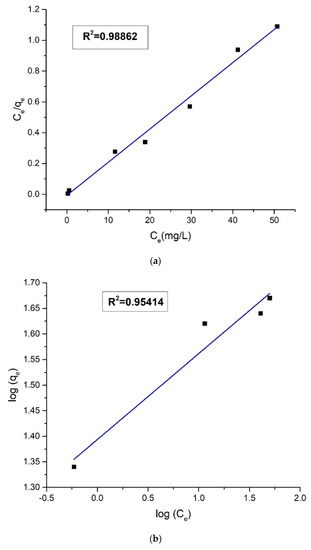
Figure 15.
(a) Plot of Langmuir isotherm and (b) plot of Freundlich isotherm for the adsorption of Orange G.
The value of the linear regression correlation coefficient (R2) was higher in the Langmuir isotherm plot (R2 = 0.98862) than the Freundlich isotherm plot (R2 = 0.95414), i.e., the experimental adsorption values were better fitted in the Langmuir isotherm model. The strong correlation of equilibrium adsorption data with Langmuir isotherm is indicative of homogeneous and monolayer adsorption of anionic Orange G molecules on the protonated chitosan part of the quaternary nanohybrid. The isotherms data were analyzed, and the list of the obtained parameters is provided in Table 3.

Table 3.
Parameters for Langmuir and Freundlich adsorption isotherms.
3.5.6. Kinetic Model Analysis
The kinetics of the dye removal process were studied using the pseudo-first-order and pseudo-second-order kinetic models. Figure 16 and Figure 17 shows the pseudo-first-order and pseudo-second-order kinetic plots for the adsorption of Orange G on the nanohybrid, respectively.
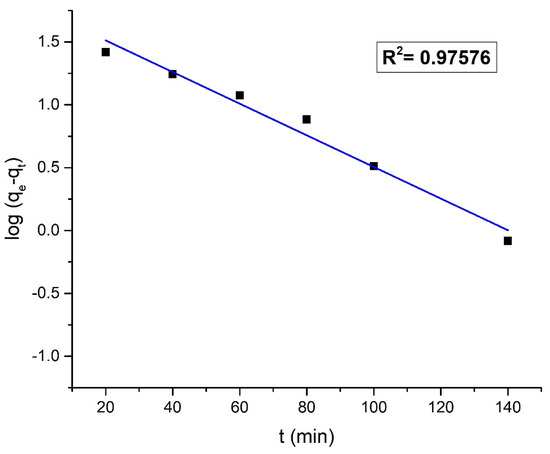
Figure 16.
Pseudo-first-order kinetic model plot.
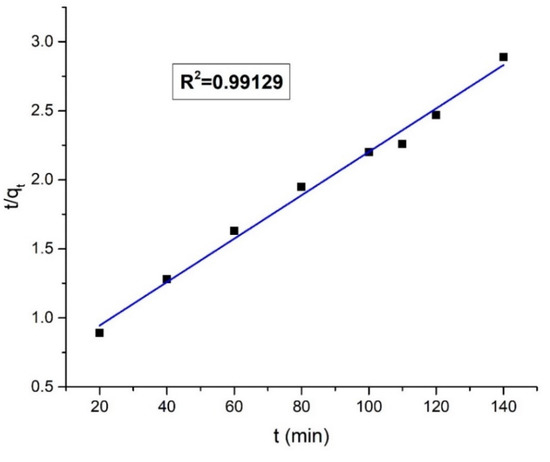
Figure 17.
Pseudo-second-order kinetic model plot.
The value of R2 was higher in the pseudo-second-order kinetic plot (R2 = 0.99129) than the pseudo-first-order kinetic plot (R2 = 0.97576). From the regression analysis, it suggests that to reach the equilibrium, the removal of Orange G dye followed the pseudo-second-order kinetics. The higher correlation of experimental data with pseudo-second-order kinetics indicates the chemisorption of anionic Orange G on the positively charged chitosan surface through the electrostatic forces of attraction. The adsorption of Orange G on chitosan is immediately followed by a very fast catalytic degradation by the ternary component in the nanohybrid under solar radiation [23,46]. The kinetics data were analyzed, and the list of the obtained parameters is provided in Table 4.

Table 4.
Comparison of pseudo-first-order and pseudo-second-order parameters.
4. Conclusions
This study demonstrates significant insights into the suitability the prepared novel nanohybrid for removing hazardous dyes from industrial effluents. A very simple and cost-effective method has been reported in this study for the fabrication of the nanohybrid at room temperature (25 °C). The surface chemistry, crystallinity, morphology, elemental distribution, and thermal stability of the nanohybrid were thoroughly illustrated using FTIR, XRD, FE-SEM, EDS, and TGA techniques, respectively. The successful binding of chitosan with the ternary photocatalyst at the interface was understood from different physico–chemical characteristics of the nanohybrid from the starting TiO2, ZnO, kaolinite, and chitosan, which have been elaborately described with the help of the aforementioned analytical techniques. Very fast and nearly complete removal of Orange G from the aqueous solution by the reusable nanohybrid was the fascinating feature of this study. The quaternary nanohybrid containing 75% ternary photocatalyst (w/w) and 25% chitosan (w/w) showed better performance in dye removal efficiency of 97.4% compare to either the ternary photocatalyst [29] or the chitosan [23] alone. The contribution of both ternary photocatalyst and chitosan in dye removal was understood by carrying out experiments with the nanohybrid in dark. The degradation process followed the Langmuir isotherm and pseudo-second-order kinetics. Finally, it can be concluded that this study has shown tremendous promise for the widespread applications of this novel nanohybrid in removing hazardous pollutants from industrial effluents.
Supplementary Materials
The following supporting information can be downloaded at: https://www.mdpi.com/article/10.3390/jcs6100304/s1, Figure S1: FT-IR spectra of chitosan.; Figure S2: FT-IR spectra of Ternary composite. References [23,28,33,34,37,47] are cited in Supplementary Materials.
Author Contributions
Conceptualization, M.R.H., T.U.R., S.C.D., M.S. and S.M.S.; methodology, M.R.H. and S.M.S.; software, M.R.H., N.P.L., and T.U.R.; validation, M.R.H. and N.P.L.; formal analysis, M.R.H.; investigation, M.R.H., N.P.L. and S.C.D.; resources, S.C.D., M.S., and S.M.S.; data curation, M.R.H.; writing—original draft preparation, M.R.H., T.U.R. and S.M.S.; writing—review and editing, M.R.H., T.U.R., S.C.D., M.S., and S.M.S.; visualization, M.R.H. and T.U.R.; supervision, S.C.D., M.S., and S.M.S.; project administration, M.S. and S.M.S.; funding acquisition, S.C.D., M.S., and S.M.S. All authors have read and agreed to the published version of the manuscript.
Funding
This research was funded by Centennial Research Grant, University of Dhaka, Bangladesh.
Acknowledgments
The authors are gratefully acknowledging the “Centennial Research Grant, University of Dhaka, Bangladesh” for funding this research works. We are also thankful to the Centre for Advanced Research in Sciences (CARS) and the Bangladesh Council for Scientific and Industrial Research (BCSIR) for the relevant analytical and technical support.
Conflicts of Interest
The authors declare no conflict of interest.
References
- Rashid, T.U.; Kabir, S.F.; Biswas, M.C.; Bhuiyan, M.R. Sustainable wastewater treatment via dye–surfactant interaction: A critical review. Ind. Eng. Chem. Res. 2020, 59, 9719–9745. [Google Scholar] [CrossRef]
- O’Neill, C.; Hawkes, F.R.; Hawkes, D.L.; Lourenço, N.D.; Pinheiro, H.M.; Delée, W. Colour in textile effluents–sources, measurement, discharge consents and simulation: A review. J. Chem. Technol. Biotechnol. Int. Res. Process Environ. Clean Technol. 1999, 74, 1009–1018. [Google Scholar] [CrossRef]
- Özacar, M.; Şengil, İ.A. Adsorption of metal complex dyes from aqueous solutions by pine sawdust. Bioresour. Technol. 2005, 96, 791–795. [Google Scholar] [CrossRef] [PubMed]
- Waghmode, T.R.; Kurade, M.B.; Kabra, A.N.; Govindwar, S.P. Degradation of Remazol Red dye by Galactomyces geotrichum MTCC 1360 leading to increased iron uptake in Sorghum vulgare and Phaseolus mungo from soil. Biotechnol. Bioprocess Eng. 2012, 17, 117–126. [Google Scholar] [CrossRef]
- Nordås, H.K. The Global Textile and Clothing Industry Post the Agreement on Textiles and Clothing; WTO Discussion Paper: Geneva, Switzerland, 2004. [Google Scholar]
- Wahaab, R.A. Upgrading of industrial wastewater treatment units at automobile industry. Biomed. Environ. Sci. 2000, 13, 219–224. [Google Scholar]
- Balaji, V.; Datta, S.; Bhattacharjee, C. Evaluation on biological treatment for industrial wastewater. Biomed. Environ. Sci. 2005, 85, 320–326. [Google Scholar]
- Islam, S. Concentration of international trade in high-technology products. Appl. Econ. Lett. 2001, 8, 95–97. [Google Scholar] [CrossRef]
- Gevrenova, R. Determination of natural colorants in plant extracts by high performance liquid chromatography. J. Serb. Chem. Soc. 2010, 75, 903–915. [Google Scholar] [CrossRef]
- Barba, A.O.; Hurtado, M.C.; Mata, M.S.; Ruiz, V.F.; De Tejada, M.L.S. Application of a UV–vis detection-HPLC method for a rapid determination of lycopene and β-carotene in vegetables. Food Chem. 2006, 95, 328–336. [Google Scholar] [CrossRef]
- Guleria, A.; Sharma, R.; Shandilya, P. Photocatalytic and adsorptional removal of heavy metals from contaminated water using nanohybrids. Photocatal. Adv. Mater. React. Eng. 2021, 100, 113–160. [Google Scholar]
- Fan, H.; Yi, G.; Zhang, X.; Xing, B.; Zhang, C.; Chen, L.; Zhang, Y. Facile synthesis of uniformly loaded Fe3O4–TiO2/RGO ternary hybrids for enhanced photocatalytic activities. Opt. Mater. 2021, 111, 110582. [Google Scholar] [CrossRef]
- Ghaedi, M.; Hassanzadeh, A.; Kokhdan, S.N. Multiwalled carbon nanotubes as adsorbents for the kinetic and equilibrium study of the removal of alizarin red S and morin. J. Chem. Eng. Data 2011, 56, 2511–2520. [Google Scholar] [CrossRef]
- Yao, Z.; Wang, L.; Qi, J. Biosorption of methylene blue from aqueous solution using a bioenergy forest waste: Xanthoceras sorbifolia seed coat. CLEAN-Soil Air Water 2009, 37, 642–648. [Google Scholar] [CrossRef]
- Abd El-Latif, M.; Ibrahim, A.M.; El-Kady, M. Adsorption equilibrium, kinetics and thermodynamics of methylene blue from aqueous solutions using biopolymer oak sawdust composite. J. Am. Sci. 2010, 6, 267–283. [Google Scholar]
- Vimonses, V.; Lei, S.; Jin, B.; Chow, C.W.; Saint, C. Kinetic study and equilibrium isotherm analysis of Congo Red adsorption by clay materials. Chem. Eng. J. 2009, 148, 354–364. [Google Scholar] [CrossRef]
- Das, D.; Mishra, S. Simultaneous reduction of phenol and chromium from textile industry effluent using mixed culture of microorganisms. J. Environ. Res. Dev. 2012, 7, 946–957. [Google Scholar]
- Soliman, N.; Moustafa, A.; Abd El-Mageed, H.; Abdel-Gawad, O.F.; Elkady, E.T.; Ahmed, S.A.; Mohamed, H.S. Experimentally and theoretically approaches for disperse red 60 dye adsorption on novel quaternary nanocomposites. Sci. Rep. 2021, 11, 10000. [Google Scholar] [CrossRef] [PubMed]
- Alburaih, H.; Aadil, M.; Mubeen, S.; Hassan, W.; Ejaz, S.R.; Anwar, A.; Aman, S.; Alsafari, I.A. Facile Synthesis of W1-yFeyO3@ NiO@RGO Ternary Nanohybrid with Enhanced Sunlight mediated Photocatalytic and Bactericidal Activities for Water Purification. FlatChem 2022, 34, 100380. [Google Scholar] [CrossRef]
- Biswas, S.; Fatema, J.; Debnath, T.; Rashid, T.U. Chitosan–clay composites for wastewater treatment: A state-of-the-art review. ACS EST Water 2021, 1, 1055–1085. [Google Scholar] [CrossRef]
- Oladipo, M.; Bello, I.; Adeoye, D.; Abdulsalam, K.; Giwa, A. Sorptive removal of dyes from aqueous solution: A review. Adv. Environ. Biol. 2013, 7, 3311–3327. [Google Scholar]
- Biswas, S.; Rashid, T.U.; Debnath, T.; Haque, P.; Rahman, M.M. Application of chitosan-clay biocomposite beads for removal of heavy metal and dye from industrial effluent. J. Compos. Sci. 2020, 4, 16. [Google Scholar] [CrossRef]
- Dey, S.C.; Al-Amin, M.; Rashid, T.U.; Sultan, M.Z.; Ashaduzzaman, M.; Sarker, M.; Shamsuddin, S.M. Preparation, characterization and performance evaluation of chitosan as an adsorbent for remazol red. Int. J. Latest Res. Eng. Technol. 2016, 2, 52–62. [Google Scholar]
- Rashid, T.U.; Islam, M.S.; Sharmeen, S.; Biswas, S.; Zaman, A.; Khan, M.N.; Mallik, A.K.; Haque, P.; Rahman, M.M. Applications of chitosan derivatives in wastewater treatment. In Handbook of Composites from Renewable Materials; Scrivener Publishing LLC: Beverly, MA, USA, 2017; pp. 471–517. [Google Scholar]
- Monvisade, P.; Siriphannon, P. Chitosan intercalated montmorillonite: Preparation, characterization and cationic dye adsorption. Appl. Clay Sci. 2009, 42, 427–431. [Google Scholar] [CrossRef]
- Hasan, S.; Ghosh, T.K.; Viswanath, D.S.; Boddu, V.M. Dispersion of chitosan on perlite for enhancement of copper (II) adsorption capacity. J. Hazard. Mater. 2008, 152, 826–837. [Google Scholar] [CrossRef]
- Crini, G. Recent developments in polysaccharide-based materials used as adsorbents in wastewater treatment. Prog. Polym. Sci. 2005, 30, 38–70. [Google Scholar] [CrossRef]
- Rashid, T.U.; Rahman, M.M.; Kabir, S.; Shamsuddin, S.M.; Khan, M.A. A new approach for the preparation of chitosan from γ-irradiation of prawn shell: Effects of radiation on the characteristics of chitosan. Polym. Int. 2012, 61, 1302–1308. [Google Scholar] [CrossRef]
- Hasan, A.; Dey, S.C.; Rahman, M.M.; Zakaria, A.M.; Sarker, M.; Ashaduzzaman, M.; Shamsuddin, S. A kaolinite/TiO2/ZnO-based novel ternary composite for photocatalytic degradation of anionic azo dyes. Bull. Mater. Sci. 2020, 43, 27. [Google Scholar] [CrossRef]
- Sultana, T.; Dey, S.C.; Molla, M.; Islam, A.; Hossain, M.R.; Rahman, M.M.; Quddus, M.; Moniruzzaman, M.; Shamsuddin, S.M.; Sarker, M. Facile synthesis of TiO2/Chitosan nanohybrid for adsorption-assisted rapid photodegradation of an azo dye in water. React. Kinet. Mech. Catal. 2021, 133, 1121–1139. [Google Scholar] [CrossRef]
- Chang, M.-Y.; Juang, R.-S. Adsorption of tannic acid, humic acid, and dyes from water using the composite of chitosan and activated clay. J. Colloid Interface Sci. 2004, 278, 18–25. [Google Scholar] [CrossRef] [PubMed]
- Saikia, B.J.; Parthasarathy, G. Fourier transform infrared spectroscopic characterization of kaolinite from Assam and Meghalaya, Northeastern India. J. Mod. Phys. 2010, 1, 206–210. [Google Scholar] [CrossRef]
- Wang, C.; Shi, H.; Zhang, P.; Li, Y. Synthesis and characterization of kaolinite/TiO2 nano-photocatalysts. Appl. Clay Sci. 2011, 53, 646–649. [Google Scholar] [CrossRef]
- Zainal, Z.; Hui, L.K.; Hussein, M.Z.; Abdullah, A.H. Characterization of TiO2–chitosan/glass photocatalyst for the removal of a monoazo dye via photodegradation–adsorption process. J. Hazard. Mater. 2009, 164, 138–145. [Google Scholar] [CrossRef] [PubMed]
- Zhu, H.; Jiang, R.; Fu, Y.; Guan, Y.; Yao, J.; Xiao, L.; Zeng, G. Effective photocatalytic decolorization of methyl orange utilizing TiO2/ZnO/chitosan nanocomposite films under simulated solar irradiation. Desalination 2012, 286, 41–48. [Google Scholar] [CrossRef]
- Ekka, B.; Sahu, M.K.; Patel, R.K.; Dash, P. Titania coated silica nanocomposite prepared via encapsulation method for the degradation of Safranin-O dye from aqueous solution: Optimization using statistical design. Water Resour. Ind. 2019, 22, 100071. [Google Scholar] [CrossRef]
- Saravanan, R.; Aviles, J.; Gracia, F.; Mosquera, E.; Gupta, V.K. Crystallinity and lowering band gap induced visible light photocatalytic activity of TiO2/CS (Chitosan) nanocomposites. Int. J. Biol. Macromol. 2018, 109, 1239–1245. [Google Scholar] [CrossRef] [PubMed]
- Ba-Abbad, M.M.; Kadhum, A.A.H.; Mohamad, A.B.; Takriff, M.S.; Sopian, K. Synthesis and catalytic activity of TiO2 nanoparticles for photochemical oxidation of concentrated chlorophenols under direct solar radiation. Int. J. Electrochem. Sci. 2012, 7, 4871–4888. [Google Scholar]
- Günister, E.; Pestreli, D.; Ünlü, C.H.; Atıcı, O.; Güngör, N. Synthesis and characterization of chitosan-MMT biocomposite systems. Carbohydr. Polym. 2007, 67, 358–365. [Google Scholar] [CrossRef]
- Saquib, M.; Muneer, M. TiO2-mediated photocatalytic degradation of a triphenylmethane dye (gentian violet), in aqueous suspensions. Dye. Pigments 2003, 56, 37–49. [Google Scholar] [CrossRef]
- Sakthivel, S.; Neppolian, B.; Shankar, M.; Arabindoo, B.; Palanichamy, M.; Murugesan, V. Solar photocatalytic degradation of azo dye: Comparison of photocatalytic efficiency of ZnO and TiO2. Sol. Energy Mater. Sol. Cells 2003, 77, 65–82. [Google Scholar] [CrossRef]
- Daneshvar, N.; Salari, D.; Khataee, A. Photocatalytic degradation of azo dye acid red 14 in water: Investigation of the effect of operational parameters. J. Photochem. Photobiol. A Chem. 2003, 157, 111–116. [Google Scholar] [CrossRef]
- Konstantinou, I.K.; Albanis, T.A. TiO2-assisted photocatalytic degradation of azo dyes in aqueous solution: Kinetic and mechanistic investigations: A review. Appl. Catal. B Environ. 2004, 49, 1–14. [Google Scholar] [CrossRef]
- Jiang, R.; Zhu, H.; Li, X.; Xiao, L. Visible light photocatalytic decolourization of CI Acid Red 66 by chitosan capped CdS composite nanoparticles. Chem. Eng. J. 2009, 152, 537–542. [Google Scholar] [CrossRef]
- Jiang, R.; Zhu, H.-y.; Zeng, G.-m.; Xiao, L.; Guan, Y.-J. Synergy of adsorption and visible light photocatalysis to decolor methyl orange by activated carbon/nanosized CdS/chitosan composite. J. Cent. South Univ. Technol. 2010, 17, 1223–1229. [Google Scholar] [CrossRef]
- Rahimdokht, M.; Pajootan, E.; Ranjbar-Mohammadi, M. Titania/gum tragacanth nanohydrogel for methylene blue dye removal from textile wastewater using response surface methodology. Polym. Int. 2019, 68, 134–140. [Google Scholar] [CrossRef]
- Nithya, A.; Jothivenkatachalam, K. Visible light assisted TiO2-chitosan composite for removal of reactive dye. J. Environ. Nanotechnol. 2014, 3, 20–26. [Google Scholar]
Publisher’s Note: MDPI stays neutral with regard to jurisdictional claims in published maps and institutional affiliations. |
© 2022 by the authors. Licensee MDPI, Basel, Switzerland. This article is an open access article distributed under the terms and conditions of the Creative Commons Attribution (CC BY) license (https://creativecommons.org/licenses/by/4.0/).