1. Introduction
Two classes of finite element methods are available: either the implicit or explicit method [
1]. The implicit method is widely available and used in a broad range of problems, including nonlinear stress analysis and static. The explicit method is widely used in highly nonlinear stress analysis and dynamics with contact-dominated problems. A car crash, for instance, or metal stamping simulations are applications well suited for the explicit method.
Due to the high cost of conducting experimental studies, there is a need for reliable computational models capable of predicting the crushing response of composite structures. There have been various attempts to develop explicit finite element models (FEMs), with different degrees of precision, for circular tubes [
2,
3,
4,
5,
6], square tubes [
4,
5,
6,
7,
8,
9,
10,
11,
12,
13], angle-stiffeners [
8], C-channels [
8] and hat-stiffeners [
14]. The classification of structural FEM can be divided into two groups. The first group is the micro-mechanical one [
15,
16,
17,
18,
19,
20]. In this group, the finite element models try to simulate the composite crushing phenomenon through a detailed modelling of its micromechanical behaviour. A very fine solid mesh is developed to accurately capture the micro-mechanics matrix crack propagation phenomenon. The computational effort demanded by this kind of model is very high, which makes it unpractical for engineering crash analysis. This approach is used mainly to perform simulations concerning the delamination phenomenon, in which the growth behaviour of a single crack is studied in a very detailed way [
7]. The second group is the macro-mechanical one [
3]. This type of model provides a macro-mechanical description of the material collapse. It is much more computationally effective, and consequently, it is a suitable choice for engineering crash analysis. However, it is not capable of precisely modelling all the main collapse modes that occur simultaneously during a crush event.
The FE modelling of composite structures can be either shell or solid elements. Solid element models require more computation time and are less widely used compared with shell elements used in the axial crushing of composite structures as mentioned above. A single layer [
17,
21,
22,
23,
24] or multiple layers [
3,
25] of shell elements can be used to model a laminate. In the single-layer model, this can be modelled as a single layer of shell elements, with each ply being represented by the thickness integration point, also referred to as the integration point in the thickness direction. This kind of model is not capable of modelling the interlaminar collapse modes shown by composites under crushing in an accurate way. However, it is useful if a detailed representation of the failure physics is not required and only load and energy level predictions are required. The main advantages are its simplicity and computational effectiveness, so for that point, they are highly suitable for practical engineering crash analysis. On the other hand, they have a notably lower level of robustness due to the large amount of parameter calibration required to obtain acceptable global results for a given test configuration [
7].
The authors of [
8] used this configuration for C-channel, angle-stiffeners and the hollow square tube modelling technique. In the multi-layer configuration model, the laminate is modelled by multiple shell elements, with each layer representing either a single ply or a group of plies, and the layers are glued together using an automatic contact definition (surface to surface).
In recent studies, the single-layer configuration model has been used to simulate the behaviour of various composite structures in the case of, for instance, thin-walled square sections. This method is capable of accurately capturing the local buckling and unstable collapse; however, due to the complex failure mechanism of composite structures, this method was ineffective in depicting the progressive failure process [
4]. Providing precise input of key material properties and numerical parameters in the material model (e.g., eleven parameters in MAT 54), and defining the contact definition between the test specimen and the impactor and applying an all degrees of freedom constraint on the end of the test specimen, the single-layer model was able to yield good correlation with the experimental load–displacement graph for cross-sections studied in [
8]. However, this configuration, as mentioned above, is not appropriate for failure mechanisms and the crushing behaviour, as these are mostly neglected.
The multi-layer modelling technique can be utilised for better capturing the failure process of the tubes undergoing progressive crushing [
3,
4,
5,
6,
7]. However, in the multi-layer model, the correlation with the experimental load–displacement was not always satisfactory. The composite hollow tube was modelled in LS-DYNA using MAT 54 to analyse its crushing behaviour. The FEA results were satisfactory and agreed with the experimental load–displacement graphs; however, instead of the brittle failure mechanism observed in experimental studies, a significant local buckling of the tube was observed in FEA.
A finite element model was developed by [
4]. This model was able to accurately predict the peak load of thin-walled square CFRP tube, although the specific energy absorption was underestimated by 33%. In the FEA simulation, the crushed elements were deleted instead of forming debris, as was observed in the experiment. One of the parameters that contributed to the energy absorption was the debris formation wedged between the fronds of the tube’s wall, which was neglected in the simulation. The author noted that this parameter alone affected the SEA value in a significant way. In [
5,
6], the FEM was developed to capture the crushing behaviour of hollow circular and square tubes and compare the results with the experimental observations. It was noted by the authors that the model was not able to reproduce the axial matrix splits observed experimentally. This resulted in different load–displacement curves, deformation, and failure behaviour when compared with the experiment. Several parameters that influenced the crushing behaviour of square hollow tubes were analysed in [
7]. The parameters were element size, number of shell layers, coefficient of friction and interlaminar material properties [
26,
27,
28]. The author noted that by increasing the number of shells, the main collapse mode was unchanged. The influence of the friction coefficient between the tube and the machine plate and of the element dimension was also studied. The element size was coarse mesh (7 mm) and fine mesh (4 mm). The static friction coefficient values were 0.1, 0.2 and 0.3, and the dynamic friction coefficient was kept constant at 0.65. The increase in the friction coefficient from 0.1 to 0.3 and the use of finer mesh did not significantly change the crush zone morphology in the sense that all three tubes collapsed in the same way. For all three values of friction, the load–displacement curves have almost the same shape. In this sense, the effect of the friction variation was similar to a scaling of the magnitude of the load curves. The model with bigger elements shows a magnitude of force oscillation higher than the one shown by the refined model; however, the average force value is the same.
The authors of [
10] combined a series of experimental investigations and examined their effect using finite element analysis and concluded proportional failure mechanisms leading to SEA, which is a result of dominated energy absorption mechanisms of approximately 60% material damage and 30% friction with 10% related to contact parameter [
29]. Although a detailed examination of the material behaviour is essential to reach a load adapted lightweight design. Axial finite element modelling of composite structures uses different modelling methods. Various approaches were developed to obtain ideal force–displacement curves that are aligned with experimental data. One approach includes a hybrid mesh of shell and solid elements to capture ideal load–displacement curves [
30]. This method is used for modelling of crack propagation with finite cohesion elements [
31] that consist of shell elements representing the material and a solid element to represent delamination failure. Alternatively, material 54 in LS-DYNA is used to predict crushing behaviour and the idealised force–displacement graph [
32]. One strategy is the SOFT parameter implemented in LS-DYNA to map pre-damage and consequently create a progressive crashfront of CFRP square tubes or composite sections, and the author concluded that Mat_Composite_Damage of LS-DYNA for GFRP box structures was found to be in accordance with experimental results when it was modelled as a double-shell configuration. Some similar conclusions were obtained by other researchers that used multi-shell configuration, which can predict energy absorption and maximum force under crushing [
32,
33].
Abdallah [
34] numerically optimised fibre orientation of glass/phenolic tubes under tensile and compression loadings. Failure parameters in the Mat_54 material card in the LS-DYNA Library are defined by ALPH (shear stress parameter for the nonlinear term), BETA weighting factor for the shear term in tensile fibre mode), FBRT (softening for fibre tensile strength), YCFAC (reduction factor for compressive fibre strength after matrix failure), TFAIL (time step size criteria for element deletion), SOFT (softening reduction factor for material strength in the crashfront element) and EFS (effective failure strain) to improve the accuracy of the final results. Abdallah concluded that the developed numerical models are capable of predicting tensile and compression loading of small and large scale GFRP specimens within 10% discrepancy. This trial-and-error or parametric study approach has also been used in References [
34,
35,
36,
37,
38]. However, in another study by Xiao [
39], axial crushing of braided carbon tubes was modelled using MAT58 in LS-DYNA to predict peak forces within 20% of the experimental values, but the predicted crushing forces and SEA were generally lower than experimental results. This is likely due to a deficiency in MAT_58 in modelling the subsequent unloading response of partially damaged material.
Many studies focused on the contact parameter [
29], crack propagation modelling with de-cohesion elements [
40] or user-defined material model, which requires extensive experimental investigations [
41].
In [
42,
43], the effect of failure trigger mechanisms on the energy absorption capability of CFRP tubes under axial compression is experimentally and numerically investigated. The conventional approach to introduce a failure mechanism is to apply a 45° chamfer on one end, and the failure could initiate progressively. Alternatively, an attachment of crush-cap can be utilised to initiate the progressive crushing. Two different types of crush-caps were studied, each causing the crushed material to fold either inward or splay outward. The effect of the corner radius of the crush-caps on the peak load, SEA, and crush behaviour was investigated. The author noted that the chamfer failure trigger was most effective at reducing the initial peak load while maintaining a high-sustained crush load and specific energy absorption (SEA). The inward-folding failure trigger approach was not as effective at reducing the initial peak load but was more effective than using a chamfer for maintaining a high-sustained crush load and SEA. However, the modelling technique of the simulation, which was based on a multi-shell configuration with failure a trigger, showed a high level of correlation with the experimental results for both the chamfer and combined failure trigger cases. The simulation was able to predict key deformation characteristics, which were observed during the experimental crushing process, and progression of matrix splits and the direction of splaying of plies.
In the modelling approach, it is necessary to develop models that are simple enough to be employed in practical analysis situations but at the same time capable of providing results with a suitable level of accuracy. At the same time, the approach shall be numerically robust and practical in the model build phase [
44,
45,
46].
The primary focus of this study is to develop a ‘multi-layer’ finite element modelling approach to capture the crushing behaviour of composite tubular structures. This approach requires a series of parametric studies to maximise prediction of FEM, i.e., failure trigger mechanism to initiate a progressive crushing, materials card formulation, delamination interface, element formulation, mesh sensitivity and number of shells. This paper illustrates the effect of the named parameters on the predictability of developed FEM compared to experimental studies.
The modelling techniques further investigate the effect of various loading on the crushing behaviour of composite tubes. The experimental and FEA results are compared based on force–displacement curves. The approach of FEM is categorised based on parameters affecting energy absorption capability and the ability of the model to capture real-life crashing and composite material behaviour. Hence, this review paper has covered the essential parameters and calibration procedures to establish the findings.
2. LS-DYNA Software
A commonly used piece of software for crashworthiness application by industry and academics is LS-DYNA, which was developed by LSTC and is suited for highly nonlinear transient dynamic finite element analysis.
LS-DYNA, within the past decade, has added many new features such as new material types, contact algorithms, element formulation, etc. LSTC has gradually expanded to develop a universal tool for most implicit and most vastly used explicit coding for aerospace, automotive, military and construction. LS-DYNA has its own pre-processor called LS-PrePost.
2.1. Material Models
New material models are developed and added to LS-DYNA regularly. Approximately 200 material models are implemented in the software. For unidirectional composite materials, these material models narrow down to the following [
47]:
Material mode—22: Composite Damage
Material model—54 and 55: Enhanced Composite Damage
Material model—58: Laminated Composite Fabric
Material model—59: Shell/Solid Composite Failure Model
Other material models are adopted to predict composite behaviour, i.e., MAT_161 and MAT_162, where the matrix phase is modelled within the material card and also these material cards can be used to model both unidirectional or bidirectional fibres; however, the concentration of this paper is to isolate material cards from the matrix phase.
Material properties such as shear modulus, elastic modulus, and Poisson’s ratio are essential parameters for a material model. Strength properties for failure analysis are also essential to predict material behaviour. These properties are transverse compressive strengths, longitudinal compressive strength, transverse tensile strength and shear strength. Each model has an option to determine the material axes, such as local and global orthotropic material axes. For a given geometry and load, the process of calculation is in three steps,
Stress and strain distributions around the stress concentrated areas are calculated,
Failure (maximum) load is predicted,
Mode of failure is determined.
The analysis consists of two major parts: stress analysis and failure analysis. The most often used material models are described with parametric studies to compare the differences.
2.1.1. MAT_022: Composite Damage Model
This is the first composite failure material model implemented in LS-DYNA, which was proposed by Chang–Chang [
48,
49]. The keyword for this model is *MAT_COMPOSITE_DAMAGE or *MAT_022. This model can be used in solid and shell elements. By using the user-defined integration rule, the constitutive constants vary through the thickness of the shell.
MAT-022 uses three criteria defined by Chang–Chang and five material parameters to define failure modes.
The three failure criteria used are:
A fibre breakage failure mode,
A compression failure mode,
A matrix failure mode.
The five material parameters are:
Shear Strength, S2,
Traverse tensile strength, S12,
Transverse compressive strength, C2,
Longitudinal tensile strength, S1,
Nonlinear shear stress parameter.
The matrix cracking failure mode is determined from Equations (1) and (2),
The failure is assumed when
Fmatrix is less than 1, then
E2,
G12,
and
are set to zero. The compression failure is determined from Equation (3). Failure is assumed when
Fcomp is less than 1 and
E2,
and
are set to zero.
The fibre breakage failure mode is determined from Equation (4). Failure is assumed when
Ffibre is less than 1, then
E1, E2,
G12,
and
are set to zero.
where
E1 and
E2 are the longitudinal and transverse elastic moduli, respectively,
G12 is the shear modulus, and
and
are the in-plane Poisson’s ratios.
C2 and
S2 are the transverse compressive strength and shear strength,
S1 is the longitudinal tensile strength and
S12 is the in-plane shear strength, and
is the nonlinear shear stress parameter.
2.1.2. MAT_54-55: Enhanced Composite Damage Model
These material models are improvised versions of the Chang–Chang composite damage model. The keyword for this model is *MAT_ENHANCED_COMPOSITE_DAMAGE or *MAT_054 or *MAT_055. This model is used for thin shells only. When the model is undamaged, the material is assumed to be orthotropic and linear elastic, and when the damage occurs, nonlinearity is introduced into the material. Material 54 is suggested by Chang, which is called the Chang matrix failure criterion, and material 55 is suggested by Tsai-Wu, which is called the Tsai-Wu matrix failure criterion. These two models have very similar formulations.
Material 54 is the same as material 22 but with added compressive fibre failure mode, and it also includes compressive and tensile fibre failure and compressive and tensile matrix failure modes.
The Chang–Chang criterion (MAT_54) is given below,
Tensile fibre (
All moduli and Poisson’s ratios are set to zero when the tensile fibre failure criteria are met, that is E1 = E2 = G12 = = = 0. All the stresses in the elements are reduced to zero, and the element layer has failed. Where E1 and E2 are the longitudinal and transverse elastic moduli, respectively, G12 is the shear modulus, and are the in-plane Poisson’s ratios.
Failure mode for compressive fibre (
For this mode, E1 = = = 0
Failure mode for tensile matrix (
For this mode, E2 = G12 = = 0
Failure mode for compressive matrix
where
and other parameters are defined in the above section. For this mode,
E2 =
G12 =
=
= 0. For brittle material, when the failure criterion is met, a reduction factor is applied to reduce the compressive fibre strength, and a softening factor is used to reduce tensile fibre strength.
When the nonlinear shear stress parameter is set to 0, all the above failure criteria reduce to the original failure criteria of Hashin [
43].
Material model 55 formulation is very close to the material model 54. It uses the Tsai-Wu failure criteria [
50] for compressive and tensile matrix failure modes, which are given in single expression as follows:
This material model (Mat_055) is similar to the Chang–Chang failure model except for the compressive and tensile matrix failure mode, which is replaced with the above expression and transverse shear parameters in this material model.
In the material input, additional parameters such as effective failure strain and maximum strains are required besides strengths. When the strains values are reached, then the element is deleted. The element is removed when failure occurs in all the composite layers, and these layers are defined through shell thickness integration points.
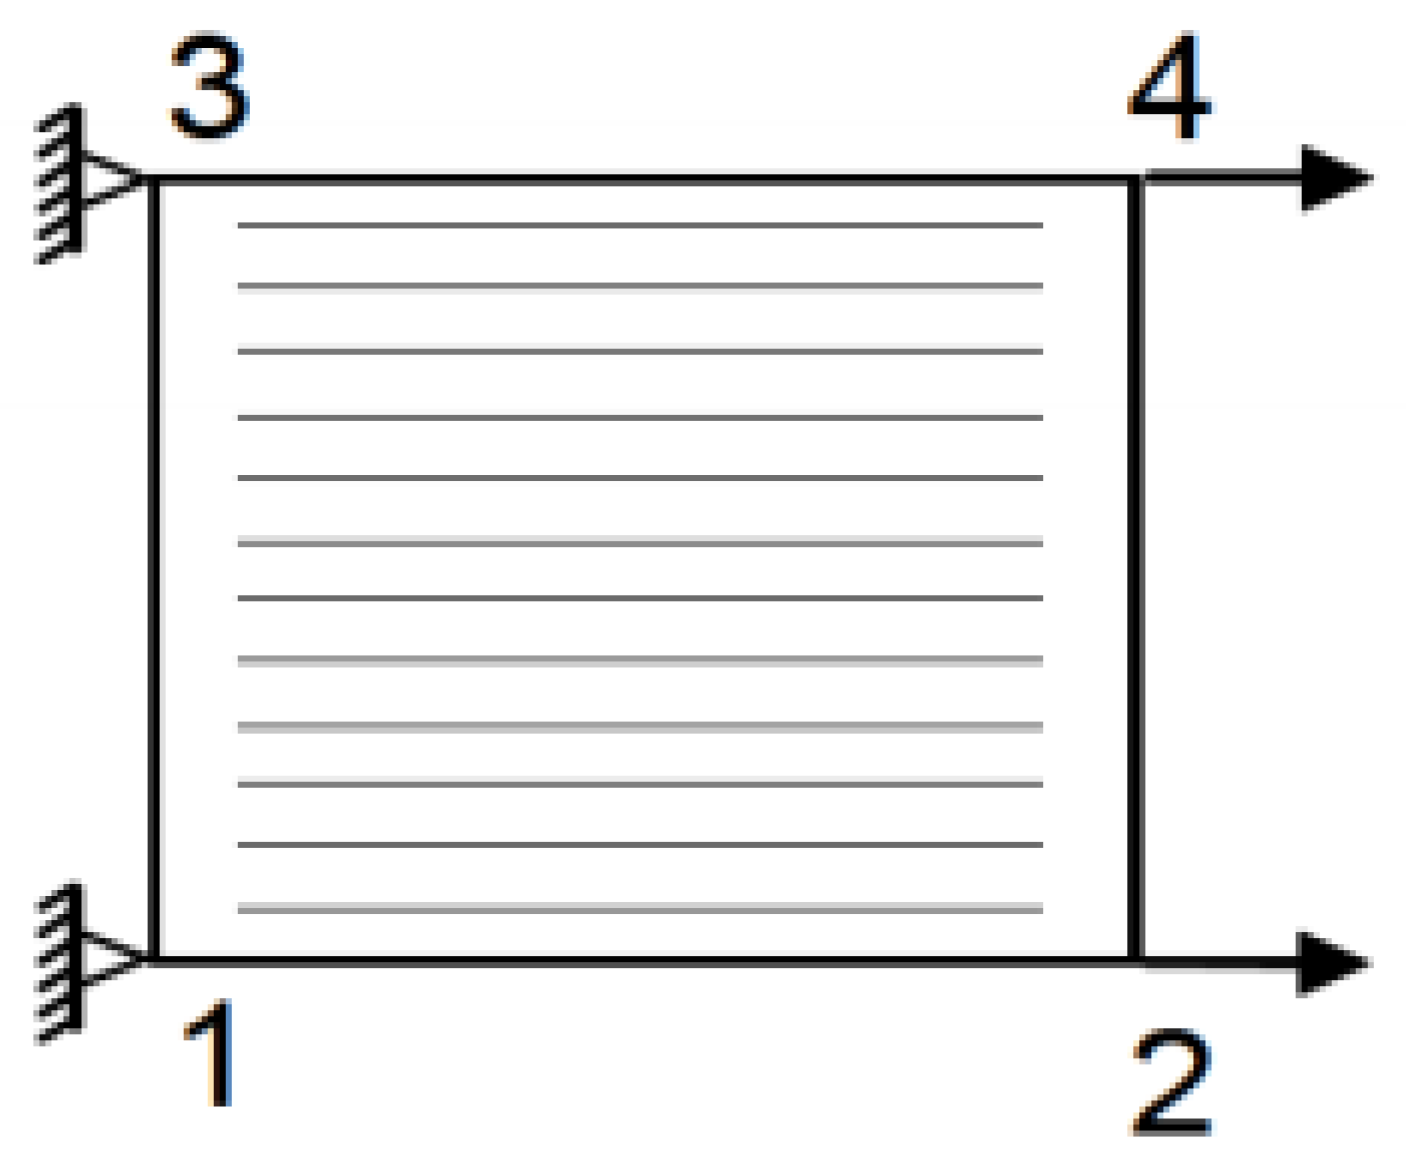
Elements having the same nodes with the deleted elements become “crashfront” elements. By using a softening reduction factor, the strengths can be reduced and become moduli of the crashfront elements; this fact results in a stable crushing process and, consequently, a sudden release of stress concentration is compensated. To understand the strain parameters, a four-node single-shell element undergoes a tensile load in the direction of the fibre, see
Figure 1. The material and strength properties are taken from [
51]. SOFT takes into account the softening strength effects on the crashfront elements by scaling down the initial input strength.
Initially, the element is loaded at a constant strain rate of 1/s in the fibre direction. The stress in the element increases linearly in the fibre direction up to the maximum value, and all elastic properties and stresses are reduced to zero in 100 time steps, as shown in
Figure 2. The maximum strain for fibre tension is set to a default value of 0.
Then, all the elastic properties and stresses are kept constant except the maximum strain for fibre tension, which is set to 0.02. After the value of maximum stress is reached, the elastic constants and the stresses remain constant until the maximum strain value is reached, then the element is deleted, immediately resulting in the stress being reduced to zero, as shown in
Figure 3.
Stresses are kept constant when compressive matrix and fibre criteria are met. In material models 54 and 55, ultimate failure can occur in any four different ways:
Chang–Chang failure criterion is satisfied in tensile fibre mode,
Maximum fibre tensile strain is met,
Maximum effective failure strain is met,
Minimum time step is met.
Softening Reduction Factor (SOFT)
A crashfront parameter is used to reduce the crush failure. This parameter is the softening reduction factor for the element material strength that nodes share of the crushed element. By default, this value is set to 1, which means that the element contains 100% of its strength, and when this value drops to 0.5, it indicates that the raw elements that share the same nodes of crashfront elements have only 50% of its original strength.
In numerical parameters, SOFT is considered as one of the influential parameters that could amend the shape of the force–displacement curve to match with the experimental results. For every geometric structure, this parameter value needs to be amended through trial and error to obtain a good agreement with the numerical and experimental force–displacement results. The SOFT parameter can be found in materials 54, 55, 58 and 59. This parameter can be activated by giving a positive value for TFAIL in materials 54 and 55, which is the time step size for element deletion, and by giving a positive value for TSIZE in materials 58 and 59, which is the time step for element deletion. When this time step is reached, the element is deleted. When the degree of curvature of the structure is higher, then the structure is more efficient in crushing by fragmentation. For lower value, the structure gives frond formation. These large fronds are accompanied by long delamination, which results in creating an effective damage length that is inefficient for energy absorption. Francesco Deleo, Wade, Paolo Feraboli [
8] simulated the model using material 54 in LS-DYNA and noted that by using the SOFT parameter, the damage length can be changed by this parameter to reduce the material strength of the row of the element that is ahead of the crashfront. Sivarama Krishnamoorthy [
52] showed that the crashfront parameter influences the mean crushing force in the force–displacement curve. Therefore, it can be concluded that the SOFT parameter significantly influences the amount of energy absorption. As the value of SOFT increases, more energy is absorbed by the composite structure due to the higher strength of the structure. Other authors claimed the similar conclusions [
53,
54,
55]
2.1.3. MAT_58: Laminated Composite Fabric Failure Model
Based on the strain-based failure surface, this model can be used for modelling composite materials, which have unidirectional layers, woven fibres and laminates. The keyword for this model is *MAT_LAMINATED_COMPOSITE_FABRIC or *MAT_058. This model is used for shell elements only. This model is implemented in LS-DYNA by Matzenmiller, Lubliner and Taylor [
56], which is also called an MLT composite model and is based on a plane stress continuum damage mechanic model.
In material 58, Hashin failure criteria [
49] are used with changes for different types of composites. The maximum effective strain is applicable for element layer failure for any different type of composites.
2.1.4. MAT_59: Composite Failure Model
This material model is also called an elastic-plastic material model, which is an enhanced version of Mat_022. It works on the basis of failure surfaces, which are: faceted failure surfaces and ellipsoidal failure surfaces. It will be able to model the progressive material failure due to many failure criterions, which includes longitudinal and transverse directions in tension and compression, respectively, and through-thickness direction in compression and shear.
2.2. Delamination Models
Delamination modelling has several approaches in LS-DYNA. Tiebreak contacts have been vastly used, and it is proven to be a robust contact algorithm and relatively simple. Depending on the model of study, different contacts can be employed to achieve better prediction.
One-way contact types allow for compression loads to be transferred between the slave nodes and the master segments. Tangential loads are also transmitted if relative sliding occurs when contact friction is active. A Coulomb friction formulation is used to transition from static to dynamic friction. This transition requires that the static friction coefficient is larger than the dynamic friction coefficient and a decay coefficient is defined. The one-way contact is used to indicate that only the user-specified slave nodes are checked for penetration of the master segments.
The algorithm ties nodes that are initially in contact by creating a linear spring, and the debonding of the surface initiates when the maximum stress criterion is met, which leads to scaling down of the stress by a linear damage curve until the critical separation is reached and the spring is removed [
47].
In which
and
are the normal and shear stresses acting at the interface, and
NFLS,
SFLS and
PARAM are the normal and shear strength of the tie and critical distance, respectively. Once the damage is initiated, the two surfaces begin to separate, and the interfacial stresses are then scaled down as a linear function of the separation distance.
PARAM is the critical distance at which the failure occurs (i.e., deletion of tiebreak and advancing of delamination) [
53].
where:
Due to the failure of the tiebreak interface,
is the energy released. With trial and error procedures, a sensitivity study was conducted of Mode-I and Mode-II to determine their relative effect(s) on the tiebreak failure process. It can be noted that for composite crushing simulations, Mode-I fracture is a dominant mode of failure during the tiebreak failure process. Thus, to simplify the simulations, a pure Mode-I delamination was assumed.
In Equation (13), the critical normal separation of the surface is determined, named PARAM, based on the energy release rate in Mode-I () and the critical normal stress.
The laminate of the open cross-sections was modelled as multi-shell configurations of shell elements, with each layer representing a various number of plies. In
Section 4.7, the effect of the number of plies in each shell was investigated based on energy absorption capability. Hence, the tiebreak was adopted for each case of study and the tiebreak contact was defined only between these shell layers, rather than between individual plies. However, delamination could occur along any of the plies, and if not all ply interfaces, during specimen crushing, as was observed experimentally [
56,
57,
58,
59,
60,
61,
62,
63,
64,
65,
66]. To account for the energy dissipated by these additional delamination interfaces,
PARAM was scaled by the ratio of the number of ply interfaces
to the number of tiebreak interfaces
defined as:
based on the experimental observations, it was assumed that delamination occurred among all plies. The values that were used and calculated in Equations (13) and (14) are listed in
Table 1.
2.3. Laminate Stiffness
Laminate stiffness is critical in designing composite structures. In crashworthiness, this can be a critical factor due to the complexity of energy transfer and dissipation through the structure against occupant safety. Four major categories are considered during the composite design approach,
Cost,
Mass,
Stiffness,
Geometrical stability.
Stiffness can be calculated from load–deflection graphs:
Equation (15) can help with experimental studies and obtaining the general performance from a specimen. However, due to the orthotropic behaviour of composite materials, the stiffness of a laminate, either symmetric or antisymmetric, depends on the angle of fibres, materials, and thickness of the plies, which can zero out some elements of the three stiffness matrices [A], [B] and [D]. This is known as ABD Matric and is used to calculate composite laminate stiffness. The stiffness matrix in the principal directions is:
These elements may result in reducing or zeroing out the coupling of forces, normal and shear forces, and twisting and bending moments. Hence, a balanced lay-up sequence can reduce or zero bending moments in a laminate, which improves mechanical performance under various loading conditions. It can be proved that the coupling matrix [B] = 0 for symmetric laminates, and hence, the force and moment equations can be decoupled.
A laminate is called quasi-isotropic if its extensional stiffness matrix [A] behaves similar to that of an isotropic material. This not only implies A11 = A22, A16 = A26, and A66 = (A11 − A12)/2 but also that these stiffnesses are independent of the angle of rotation of the laminate. It is called quasi-isotropic and not isotropic because [B] and [D] may not behave as an isotropic material. Examples of quasi-isotropic laminates include [0/±60], [0/±45/90]s, [0/36/72/−18/−54].
3. Simulation Setup
For the simulations, an Explicit FE LS-DYNA code is used with a multi-layered shell configuration to reduce numerical costs. Composite tubes were modelled as multi-layers of Belytschko–Tsay circular shell elements with one integration point in the element plane to represent the direction of the stacking sequence. In double-shell configuration, the GFRP innermost shell has six integration points, with another six integration points being assigned to the outermost shell to represent all twelve UD layers. In a GFRP tube, each individual layer has a thickness of 0.25 mm. The total thickness of both shells is 3 mm. Each fibre orientation is assigned with insertion of an integration point with respect to the stacking sequence used with its associated thickness. The material properties are obtained from [
56,
59,
60]; see
Table 2.
In shell theory, the thickness of the shell is considered as mid-plane. In double-shell configuration, two shells with radiuses of 37.75 and 39.25 mm to represent the inner and outer shells with lengths of 80 and 77.5 mm were modelled, respectively, using LS-PrePost representing the GFRP tube geometry. Each shell was glued to itself so that the triggering at the top of the shell would not detach during the crushing process, as a separate shell was used. In this triggering approach, two shells were used, one with 2.5 mm in height acting as the trigger (one element size), and the other, depending on whether it was the inner or outer shell, had its representative height assigned. Therefore, the top shell in each FEA case study represents the trigger. The quadrilateral shell element was used with each element size of 2.5 × 2.5 mm. The trigger mechanism was modelled by reducing the first-row thickness of the shell elements to represent the bevel trigger, from 1.5 to 0.05 mm in each shell. A solid element rigid block was modelled to represent the striker. The LS-DYNA material model of Enhanced_composite_damage (Mat_54-55), which is an orthotropic material, with the failure criterion of Chang–Chang was used. This failure criterion is a modification of Hashin’s failure criterion for assessing lamina failure. The hourglass was set at 10% [
3,
4,
5,
6,
7,
43,
53].
Modelling interlaminar separation or delamination failure (Mode-I) requires either detailed experimental investigation for the cohesive zone or three-dimensional representation that both result in an increase in computational and experimental costs. Delamination failure causes energy absorption, and this can be modelled with a multi-layered shell configuration with a contact card that is capable of a
GIC-implemented energy release rate [
40,
41,
42,
43]. The One_Way_Surface_To_Surface_Tiebreak contact between the two shells is defined, with the inner tube being the master and the outer being the slave.
Tiebreak contacts allow the modelling of interlaminar debonding, which transmits both compressive and tensile forces with optional failure criteria. The tiebreak option enables the detachment of the contact surfaces by creating springs between two surfaces, and after reaching maximum normal stress (NFLS) or shear stress (SFLS), if the failure parameter, driven by occurring normal and shear stresses, become 1, the contact forces soften linearly until contact distance PARAM is reached and the interface failure is completed. Based on the interlaminar utilisation of the contact, the parameters are determined by the mechanical properties of the matrix material. Consequently, shell layers detach when the interlaminar stress exceeds the matrix properties, which are mainly responsible for interlaminar strength. Maximum normal and shear contact stresses for the tiebreak contact is based upon the mechanical properties of the epoxy resin. The maximum contact distance is set to 0.15 mm. Automatic_Node_To_Surface contact was defined for the striker and inner shell, with the striker being the master and the inner shell being the slave. The Automatic_Single_Surface contact algorithm was utilised. This prevents penetration of the crushing tube by its own nodes.
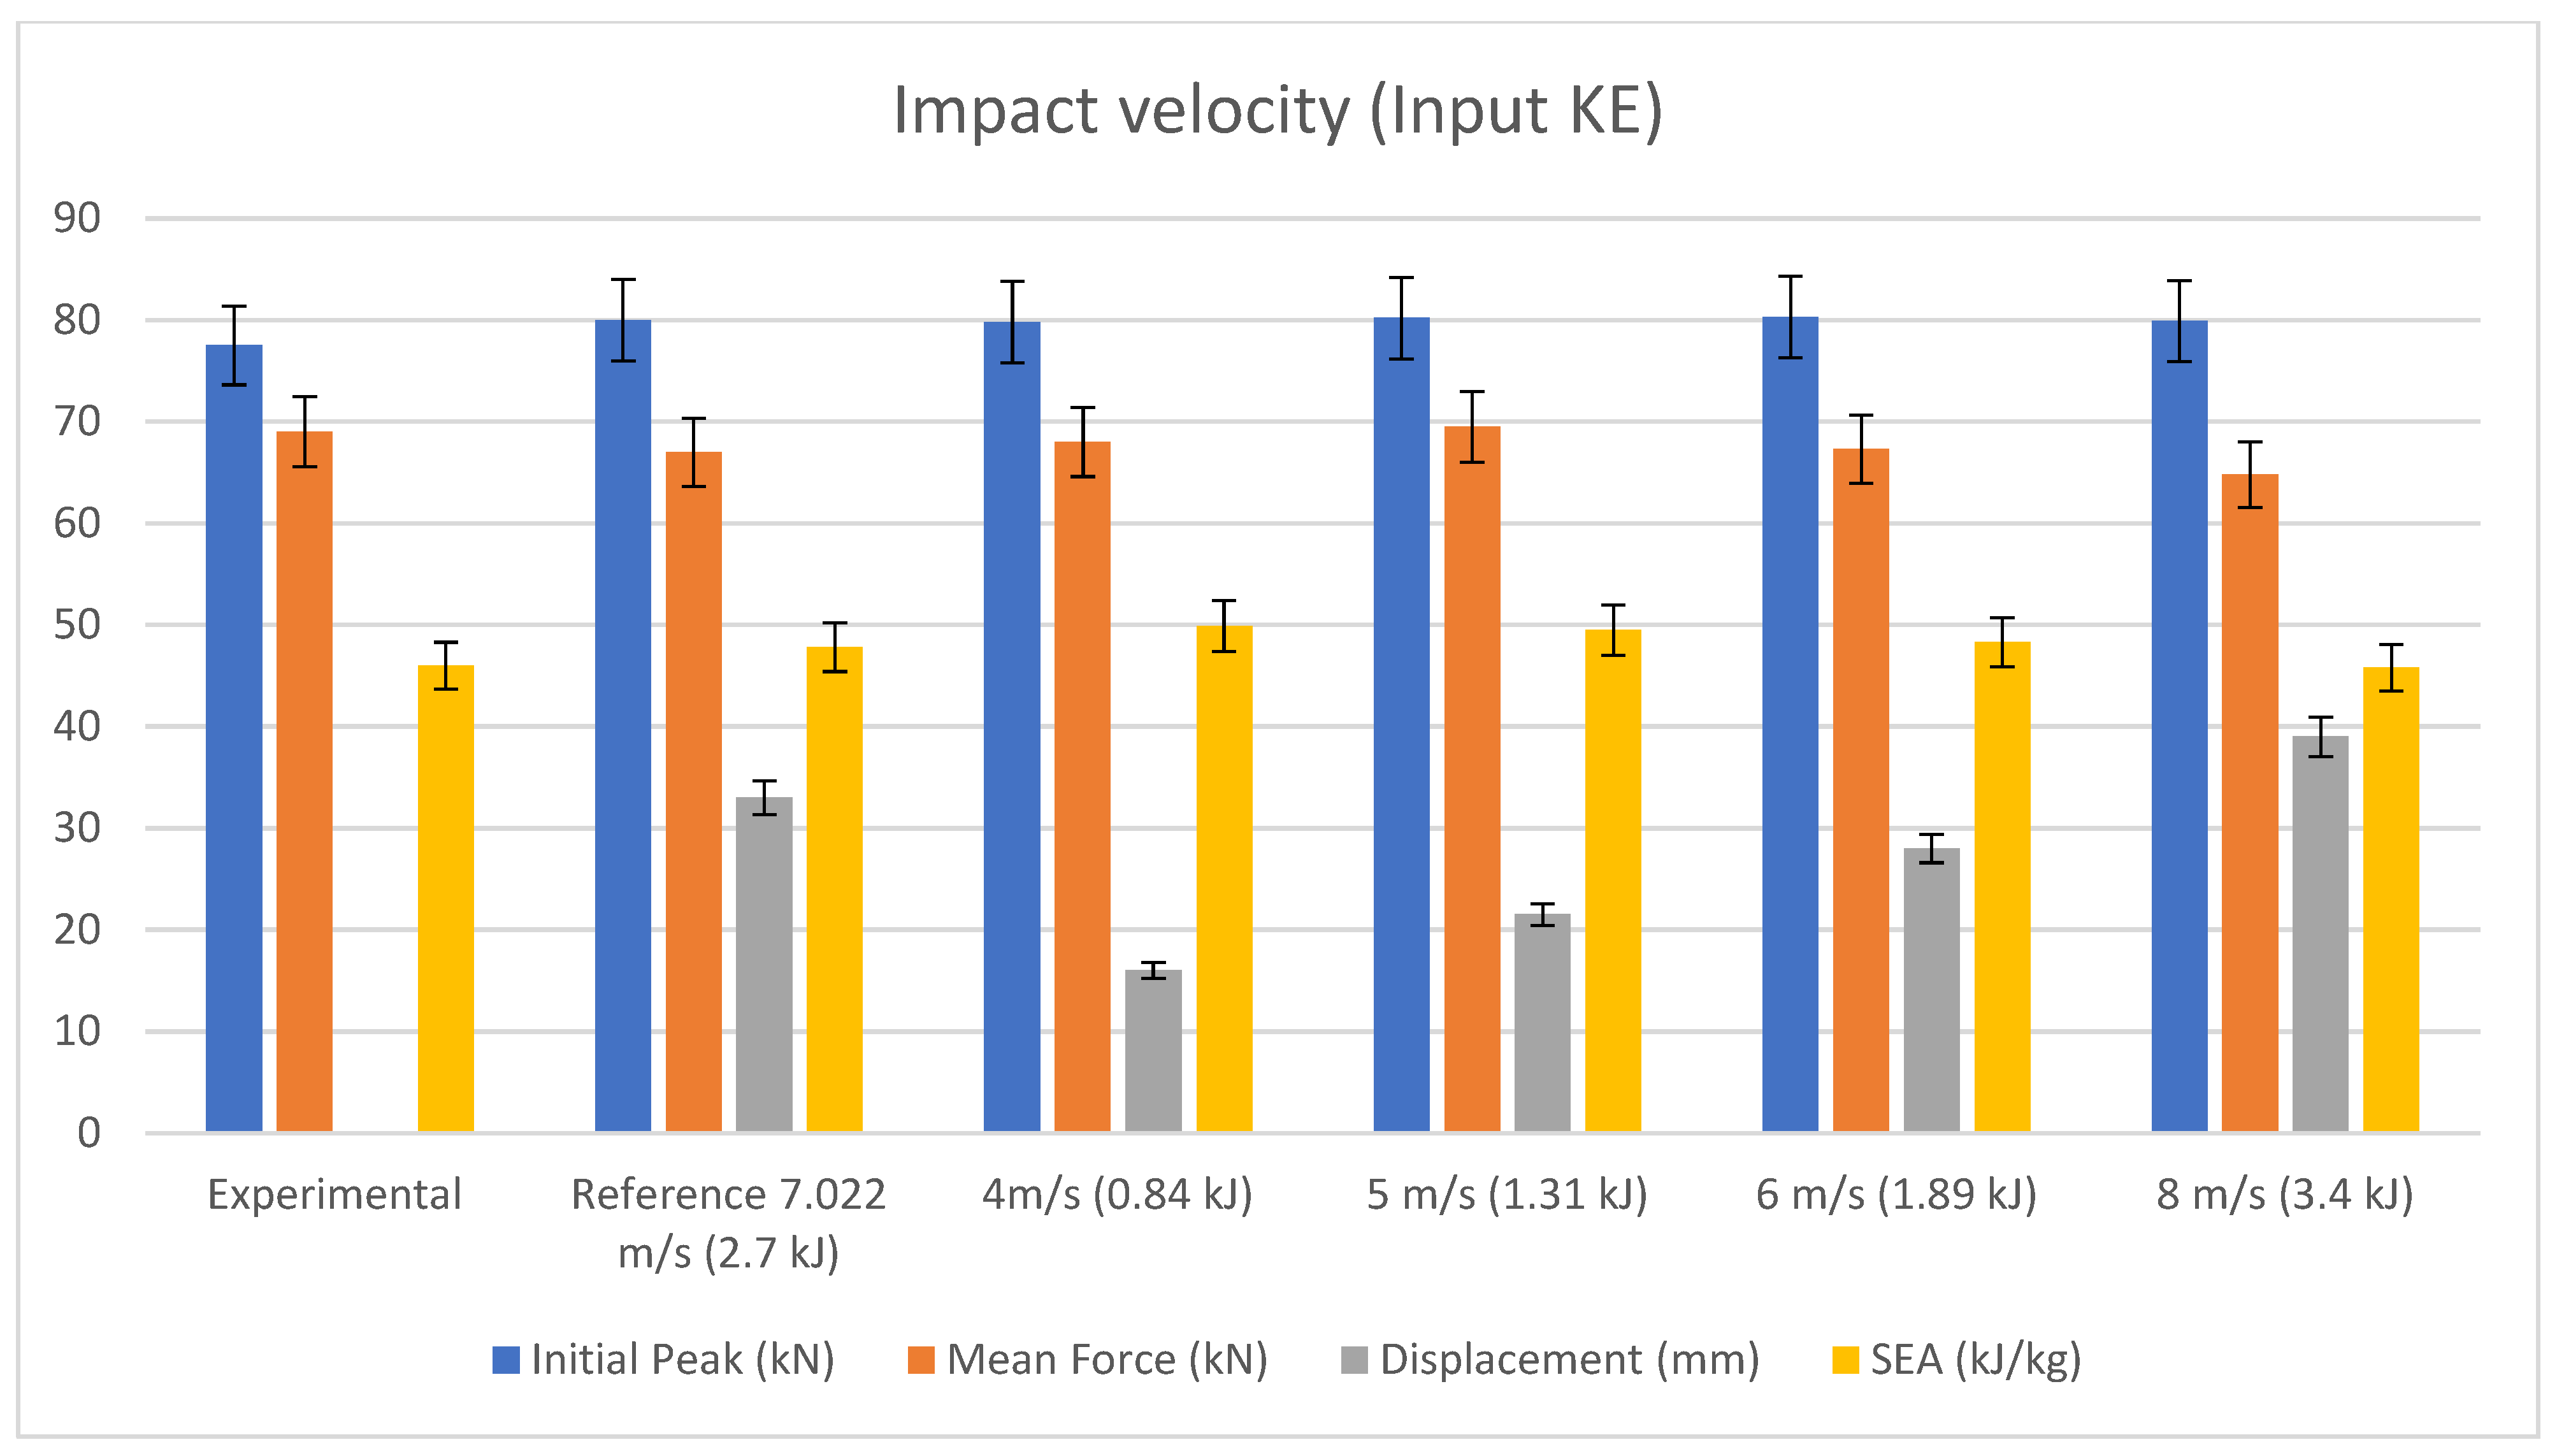
To satisfy quasi-static conditions, it is important that the load is applied in a manner that would yield a minimal inertial effect on the results, and the ratio of the kinetic energy to the internal energy must be reasonably small. Time-scaling was utilised to apply the load at a higher rate to reduce total simulation time. A constant loading rate of 0.65 m/s was applied, and the kinetic energy to the internal energy was less than 10% upon initial contact and less than 5% throughout the remainder of the crushing process.
All bottommost nodes of all shell element layers are constrained in their translational degrees of freedom. The impactor is modelled rigidly with a mass of 108.4 kg and a velocity of 7.022 m/s. Gravity is modelled with an acceleration factor of 9.81 m/s
2. All simulation results are smoothed using an SAE 300 Hz filter [
43].
4. Finite Element Modelling
4.1. Delamination Interface
Many researchers have used friction to simulate delamination, e.g., [
56,
57,
58,
59,
60]. Friction influences the energy absorption capability; however, using friction influences the SEA value, increases friction between the shells, and causes a higher SEA value (see
Section 5.3), and this compared with experimental data cannot be considered as a correct FEM. Due to this, a different approach was considered. Tiebreak option 8 was utilised instead of friction to model delamination as this contact card can define the Mode-I and Mode-II energy release rate, which simulates delamination.
The tiebreak contact definition implemented in LS-DYNA allows for the simulation of delamination at the interface between adjacent shell element layers. Tiebreak Option 8 formulations were investigated for this study, namely, tiebreaks with a bilinear traction-separation law. This requires interlaminar normal and shear strengths and a critical distance to interface failure as input parameters to model delamination in crush simulations [
10]. However, the optimal critical failure distance parameter selection has not been thoroughly studied in the open literature. The formulation of required input parameters, such as interlaminar normal and shear strengths, fracture toughness under pure Mode-I and Mode-II loading, and interfacial stiffness for normal and shear modes; a description of the model setup using each formulation is explained in
Section 4.3.1. To determine the energy rate of Mode-I and Mode-II, DCB and 3ENF tests were carried out.
DCB test determines the Mode-I energy release rate (
GI) for delamination growth. Unidirectional GFRP with resin E722 was used to manufacture 20 by 150 mm specimens with stacking sequence of (−45, 45, 0, 90)s. A thin Teflon film is placed at the mid-plane to avoid bonding and develop a pre-determined crack at 60 mm. The samples are cured at 120 degrees Celsius for an hour and a half under composite vacuum pressure in a sealed bag wrapped in breather cloth and two metal sheets to evenly apply pressure on the laminates. The delaminated end of the specimen is attached to two metal tabs. Load is then applied on the metal tabs to create a crack growth on the specimen at a rate of 2 mm/min (quasi-static). This is carried out by taking the difference in crack lengths. Unidirectional GFRP with resin E722 was used to manufacture 20 by 150 by 6 mm specimens according to ESIS standard with a stacking sequence of (−45, 45, −45, 45, 0, 90, 0, 90, 0, 90, 0, 90)s to carry out three end-notched flexure tests. The input parameters of tiebreak contact option 8 are shown in
Table 2.
4.2. Boundary Conditions and Contact Definitions
The loading striker was modelled as a rigid body. The tubes were placed in the Z-direction upright and the loading striker at the chamfered end of the tube. The interaction between the loading striker and the tube was modelled using a node-to-surface contact definition (automatic contact from node to surface). The tiebreak contact definition between the shell layers not only facilitates the simulation of delamination but also prevents layers from penetrating each other after the tiebreak has failed, as the contact definition would remain in effect. In summary, Automatic_Node_To_Surface contact was defined for the striker and inner shell with striker being the master and inner shell being the slave. The Automatic_Single_Surface contact algorithm was utilised. This prevents penetration of the crushing tube by its own nodes, which is due to the sticker’s nodes potentially causing disturbance to the model and the inner shell penetrating its own nodes and elements. All bottommost nodes of all shell element layers are constrained in their translational degrees of freedom.
4.3. Material Model
Material models Mat_022, Mat_054-055, Mat_058 and Mat_059 were used to capture an ideal initial peak and mean crushing force against computational costs. These parameters determine the reliability and the ability of these material models in cylindrical composite structures. The initial peak illustrates the stiffness of the material, and the mean crushing force shows the progressive crushing behaviour. In this section, the computational cost is one of the main parameters of case consideration. The time taken for the simulation to converge against the extracted results can be compromised to ideally have a model that converges within a reasonable timeframe and its effect on the extracted results. All bottommost nodes of all shell element layers are constrained in their translational degrees of freedom.
4.3.1. Material Modelling of Mat-045-055
This model allows the user to create a local material coordinate system to specify the orientation of each ply. There are 21 parameters in Mat_54 that need to be specified, 15 of which are physical parameters and 6 are numerical parameters [
47]. From the 15 physical parameters, 10 parameters are material constants, the values of which were obtained from [
55,
59,
60], as shown in
Table 1. The remaining five physical parameters are the tensile and compressive failure strains (element deletion strains) in the fibre direction (DFAILT and DFAILC), the matrix and shear failure strains (DFAILM and DFAILS), and the effective failure strain (EFS). The six numerical parameters can be adjusted to yield desired material behaviour. Based on an extensive parametric study, it was concluded that of these six parameters, the crashfront element softening parameter (SOFT) is of key importance to this study. This parameter reduces the strength of elements surrounding a damaged or deleted element.
As mentioned, there are five physical parameters (failure strains) and six numerical parameters in MAT54 whose values need to be determined numerically. A comprehensive parametric study was performed to investigate the effect of these parameters on the simulated load–displacement behaviour. It was determined that the physical parameter DFAILC (fibre compression failure strain) had the greatest effect on the value of initial peak load while the numerical parameter SOFT (crashfront element softening parameter) had the greatest effect on the value of sustained crush load, which determined the value of SEA.
Parameters DFAILT, DFAILM and DFAILS (shear failure strains) were found to have a marginal effect on the results and were kept constant at arbitrarily selected values of 0.02, 0.02 and 0.03, respectively. However, increasing the DFAILM value increased computational cost unreasonably (see
Section 6.1). It was found that simulations with DFAILC = −0.004 and SOFT = 0.75 yielded the mean crushing force value and displacement behaviour for chamfered tubes that matched very well with experimental data, as shown in
Table 3 and
Table 4.
A parametric study was conducted to determine the optimal values of the unknown parameters for the multi-layer modelling approach. The resultant values are presented in the above tables. This developed FEM, with the SOFT parameter set to 0.75 (75%) and DFAILC set to −0.004, can produce an accurate prediction of experimental results. The DFAILC value is negative due to compression.
4.3.2. Material Model Results
Figure 4 shows a comparison of the material models in the previous sections. MAT-022 has an initial peak of 141 kN with a mean crush force of 13 kN, and the displacement reaches 70 mm with a computational cost of 14 h. In comparison with the experimental data, this material model is inaccurate at predicting the experimental material behaviour. MAT_054-055, on the other hand, illustrates an ideal prediction of material prediction, with an initial peak value of 80 kN, mean crushing force of 67 kN, displacement of 33 mm and computational cost of 28 h. In comparison with the experimental data, which included an initial peak of 78 kN and mean crush force of 69 kN, Mat_054-055 was on average 5% off. Mat_058 illustrated that it over-predicts the mean crushing force by 7 kN, although the initial peak value has been improved to 79 kN compared with Mat_054-055. The displacement reduced to 31 mm and the computational cost increased to 36 h. The difference between the two material models lays in the mean crushing force, and Mat_058 over predicts, which results in a reduction in the displacement value, resulting in greater difference to the experimental data, with a 7.5% overall difference. Mat_059, which is a modified version of Mat_022, has shown greater improvement in the prediction of crushing behaviour in composites. However, the initial peak is 10 kN off, the mean crushing force value is underpredicted by 11 kN, and the displacement value is 36 mm. The overall difference is 9%. The computational cost value is 45 h.
By considering all four reviewed parameters, Mat_054-055 can predict the material behaviour with respect to the energy absorption capability and having a reasonable computational cost compared with the extracted results, as predicted by [
3,
4,
5,
6,
7,
43,
53,
59,
60].
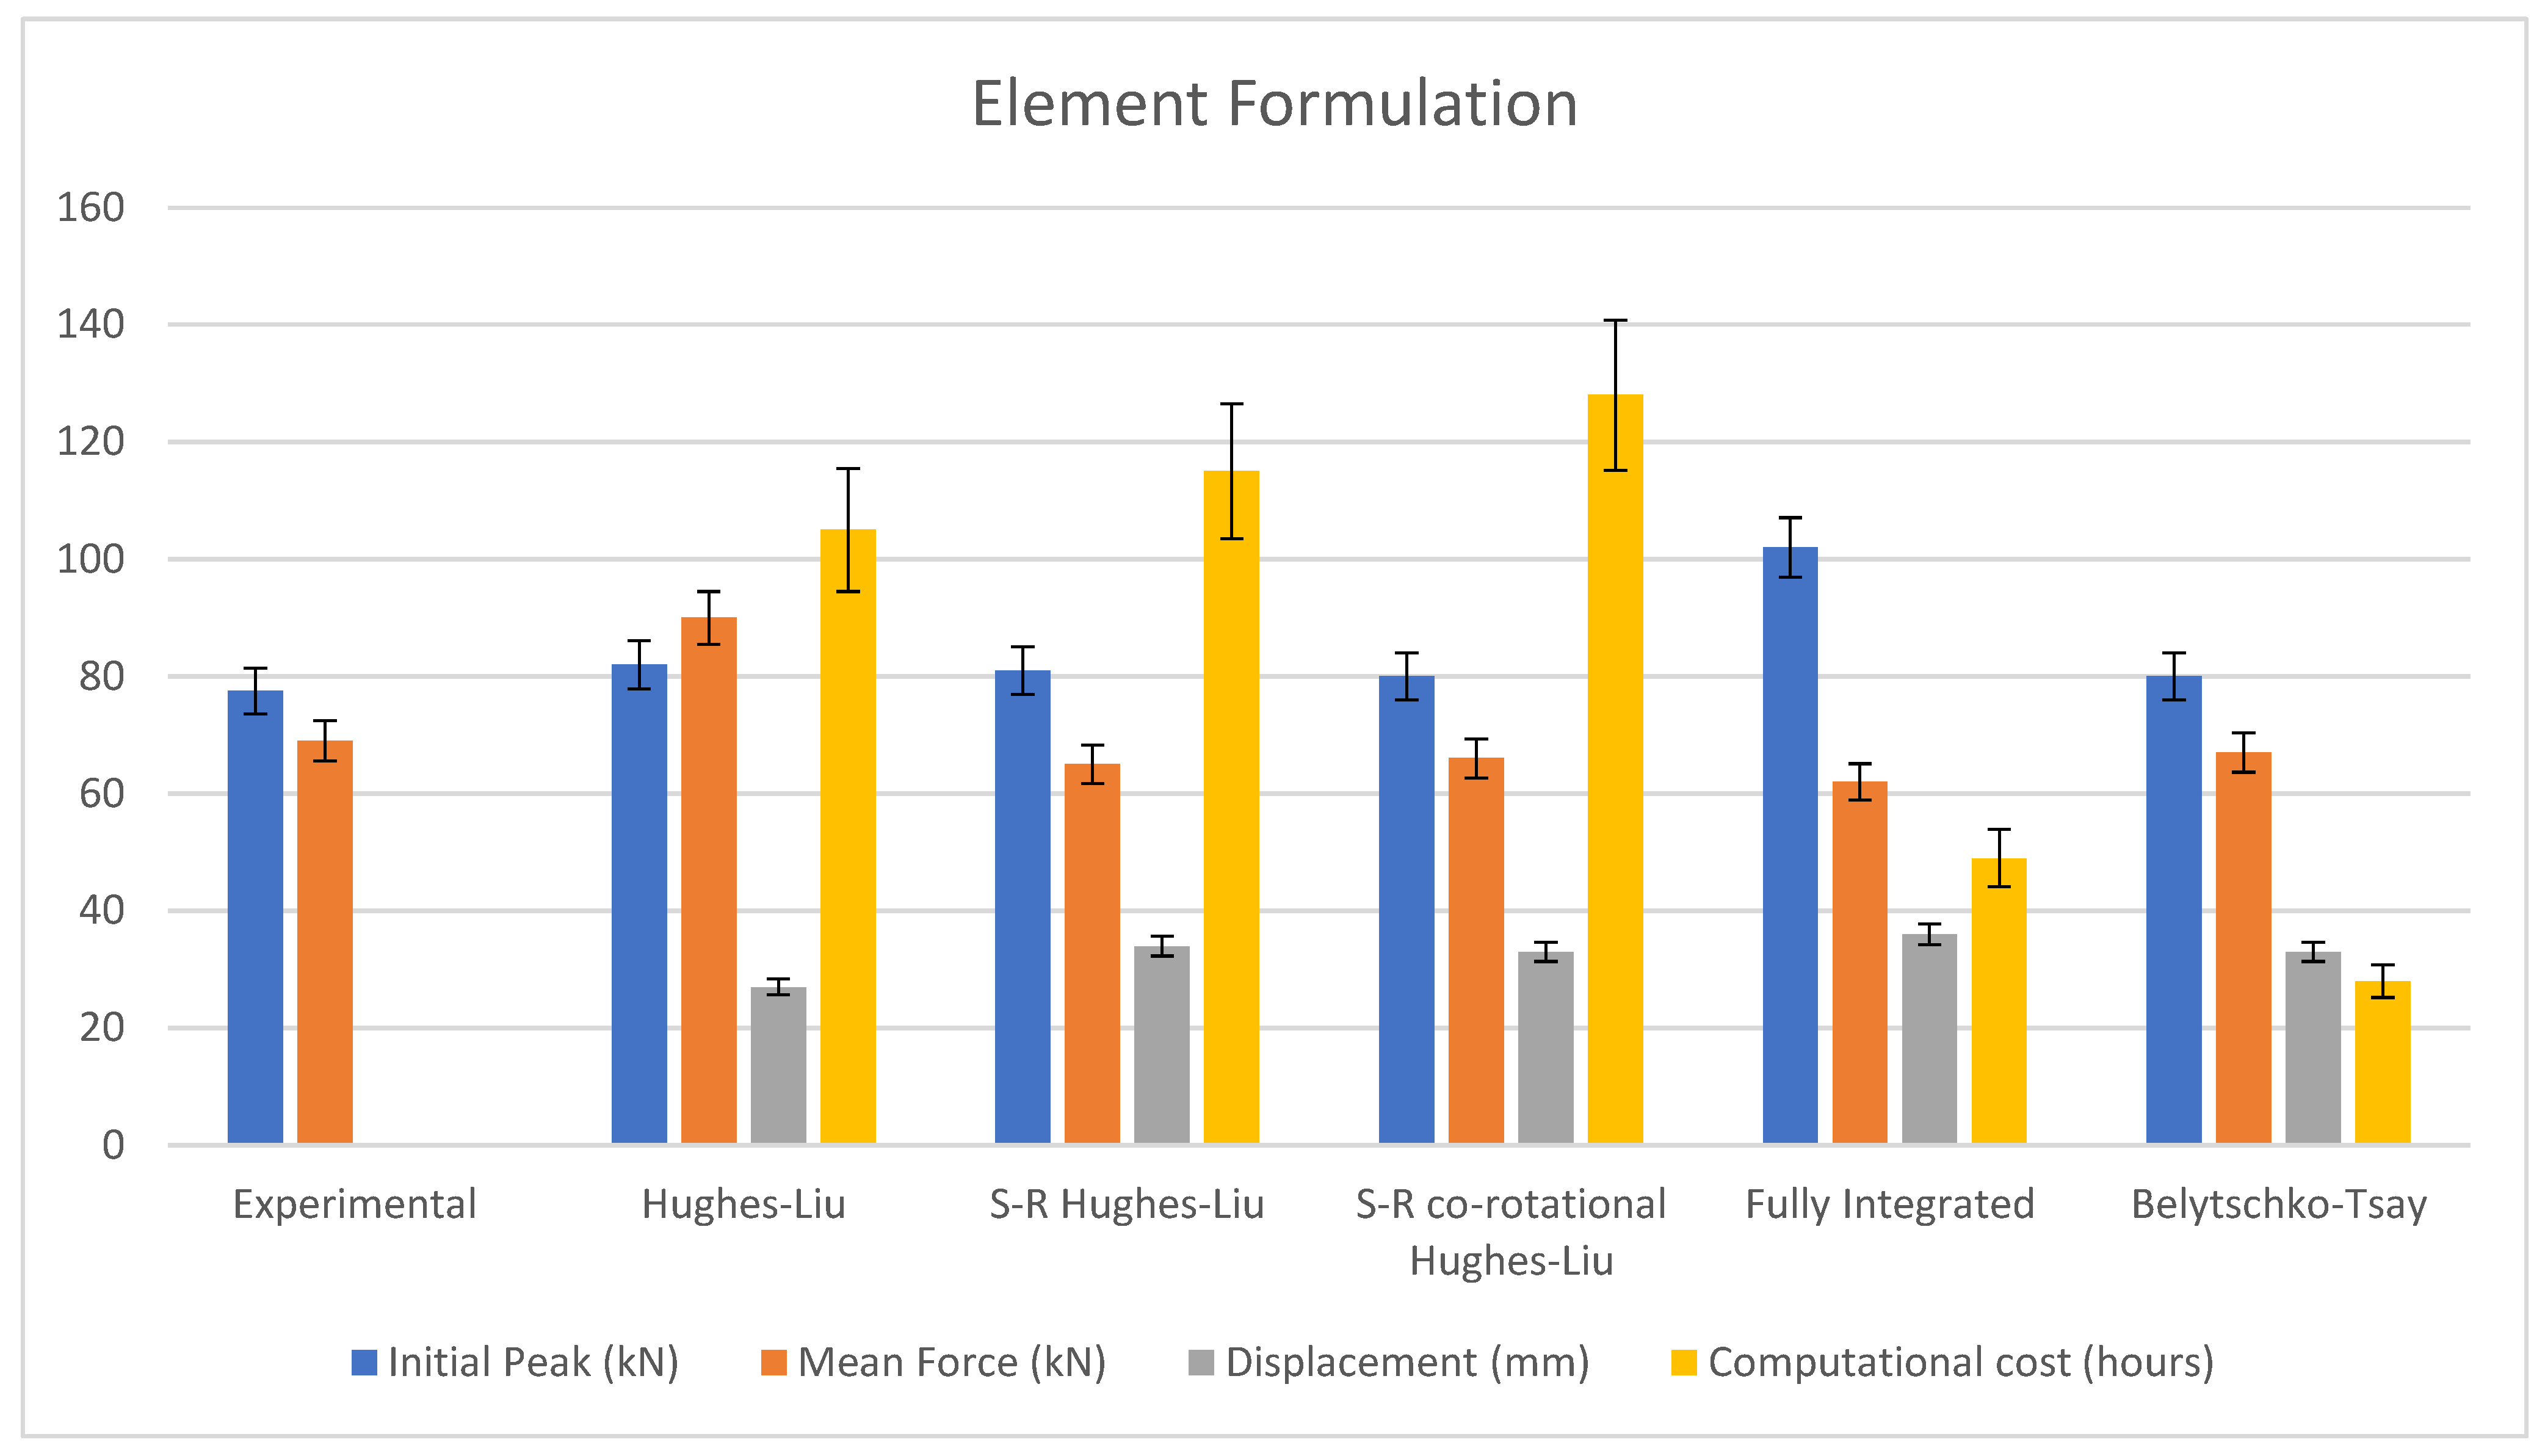
4.4. Element Formulation
The possibility of using under-integrated elements results in a reduction in computational cost and compromises the accuracy of the prediction. To compare the performances, several relevant element formulations were employed, and the results have been discussed. The relevant chosen element formulations are Hughes–Liu, S/R Hughes–Liu, S/R co-rotational Hughes–Liu, fully integrated and Belytschko–Tsay (default). In consideration of this test, since energy absorption capability is the main concern, the parameters chosen are the initial peak, mean crush force and displacement; however, in numerical studies, the computational cost plays a major role, and therefore, this parameter is also considered.
Figure 5 shows the differences between the chosen element formulations against the reference parameter of experimental data. The result of Hughes–Liu element formulation showed an initial peak of 82 kN, mean crush force value of 90 kN with displacement of 27 mm, and computational cost of 105 h. The total difference in performance value was 13% compared with experimental data. The extracted result from S/R Hughes–Liu showed an initial peak of 81 kN, mean crush force of 65 kN and displacement of 34 mm, and the computational cost was 115 h. The mean difference from the experimental data was 7%.
Both element formulations have staggering computational costs with around 4 to 5 days to converge each of the simulations. The results obtained from S/R co-rotational Hughes–Liu showed an initial peak value of 80 kN, mean crush force of 66 kN, displacement of 33 mm and computational cost of 128 h. Fully integrated element formulation, on the other hand, was off by 24 and 7 kN in the initial peak value and mean crush force, respectively. Although the computational cost is much lower compared with mentioned element formulations, both element formulations were off by 6% and 12%, respectively.
The Belytschko–Tsay element formulation, which is the default parameter in LS-DYNA, was rather close to the experimental data with a computational cost of 28 h. The initial peak value was 80 kN, mean force value was 67 kN, and the displacement was 33 mm, with a total mean difference of 5%.
By taking into account all four reviewed parameters, the Belytschko–Tsay element formulation is the cheapest computational cost compared with other element formulations, as supported by other researchers [
3,
4,
5,
6,
7,
43,
53,
59,
60], which leads to the use of this type of element formulation hereafter.
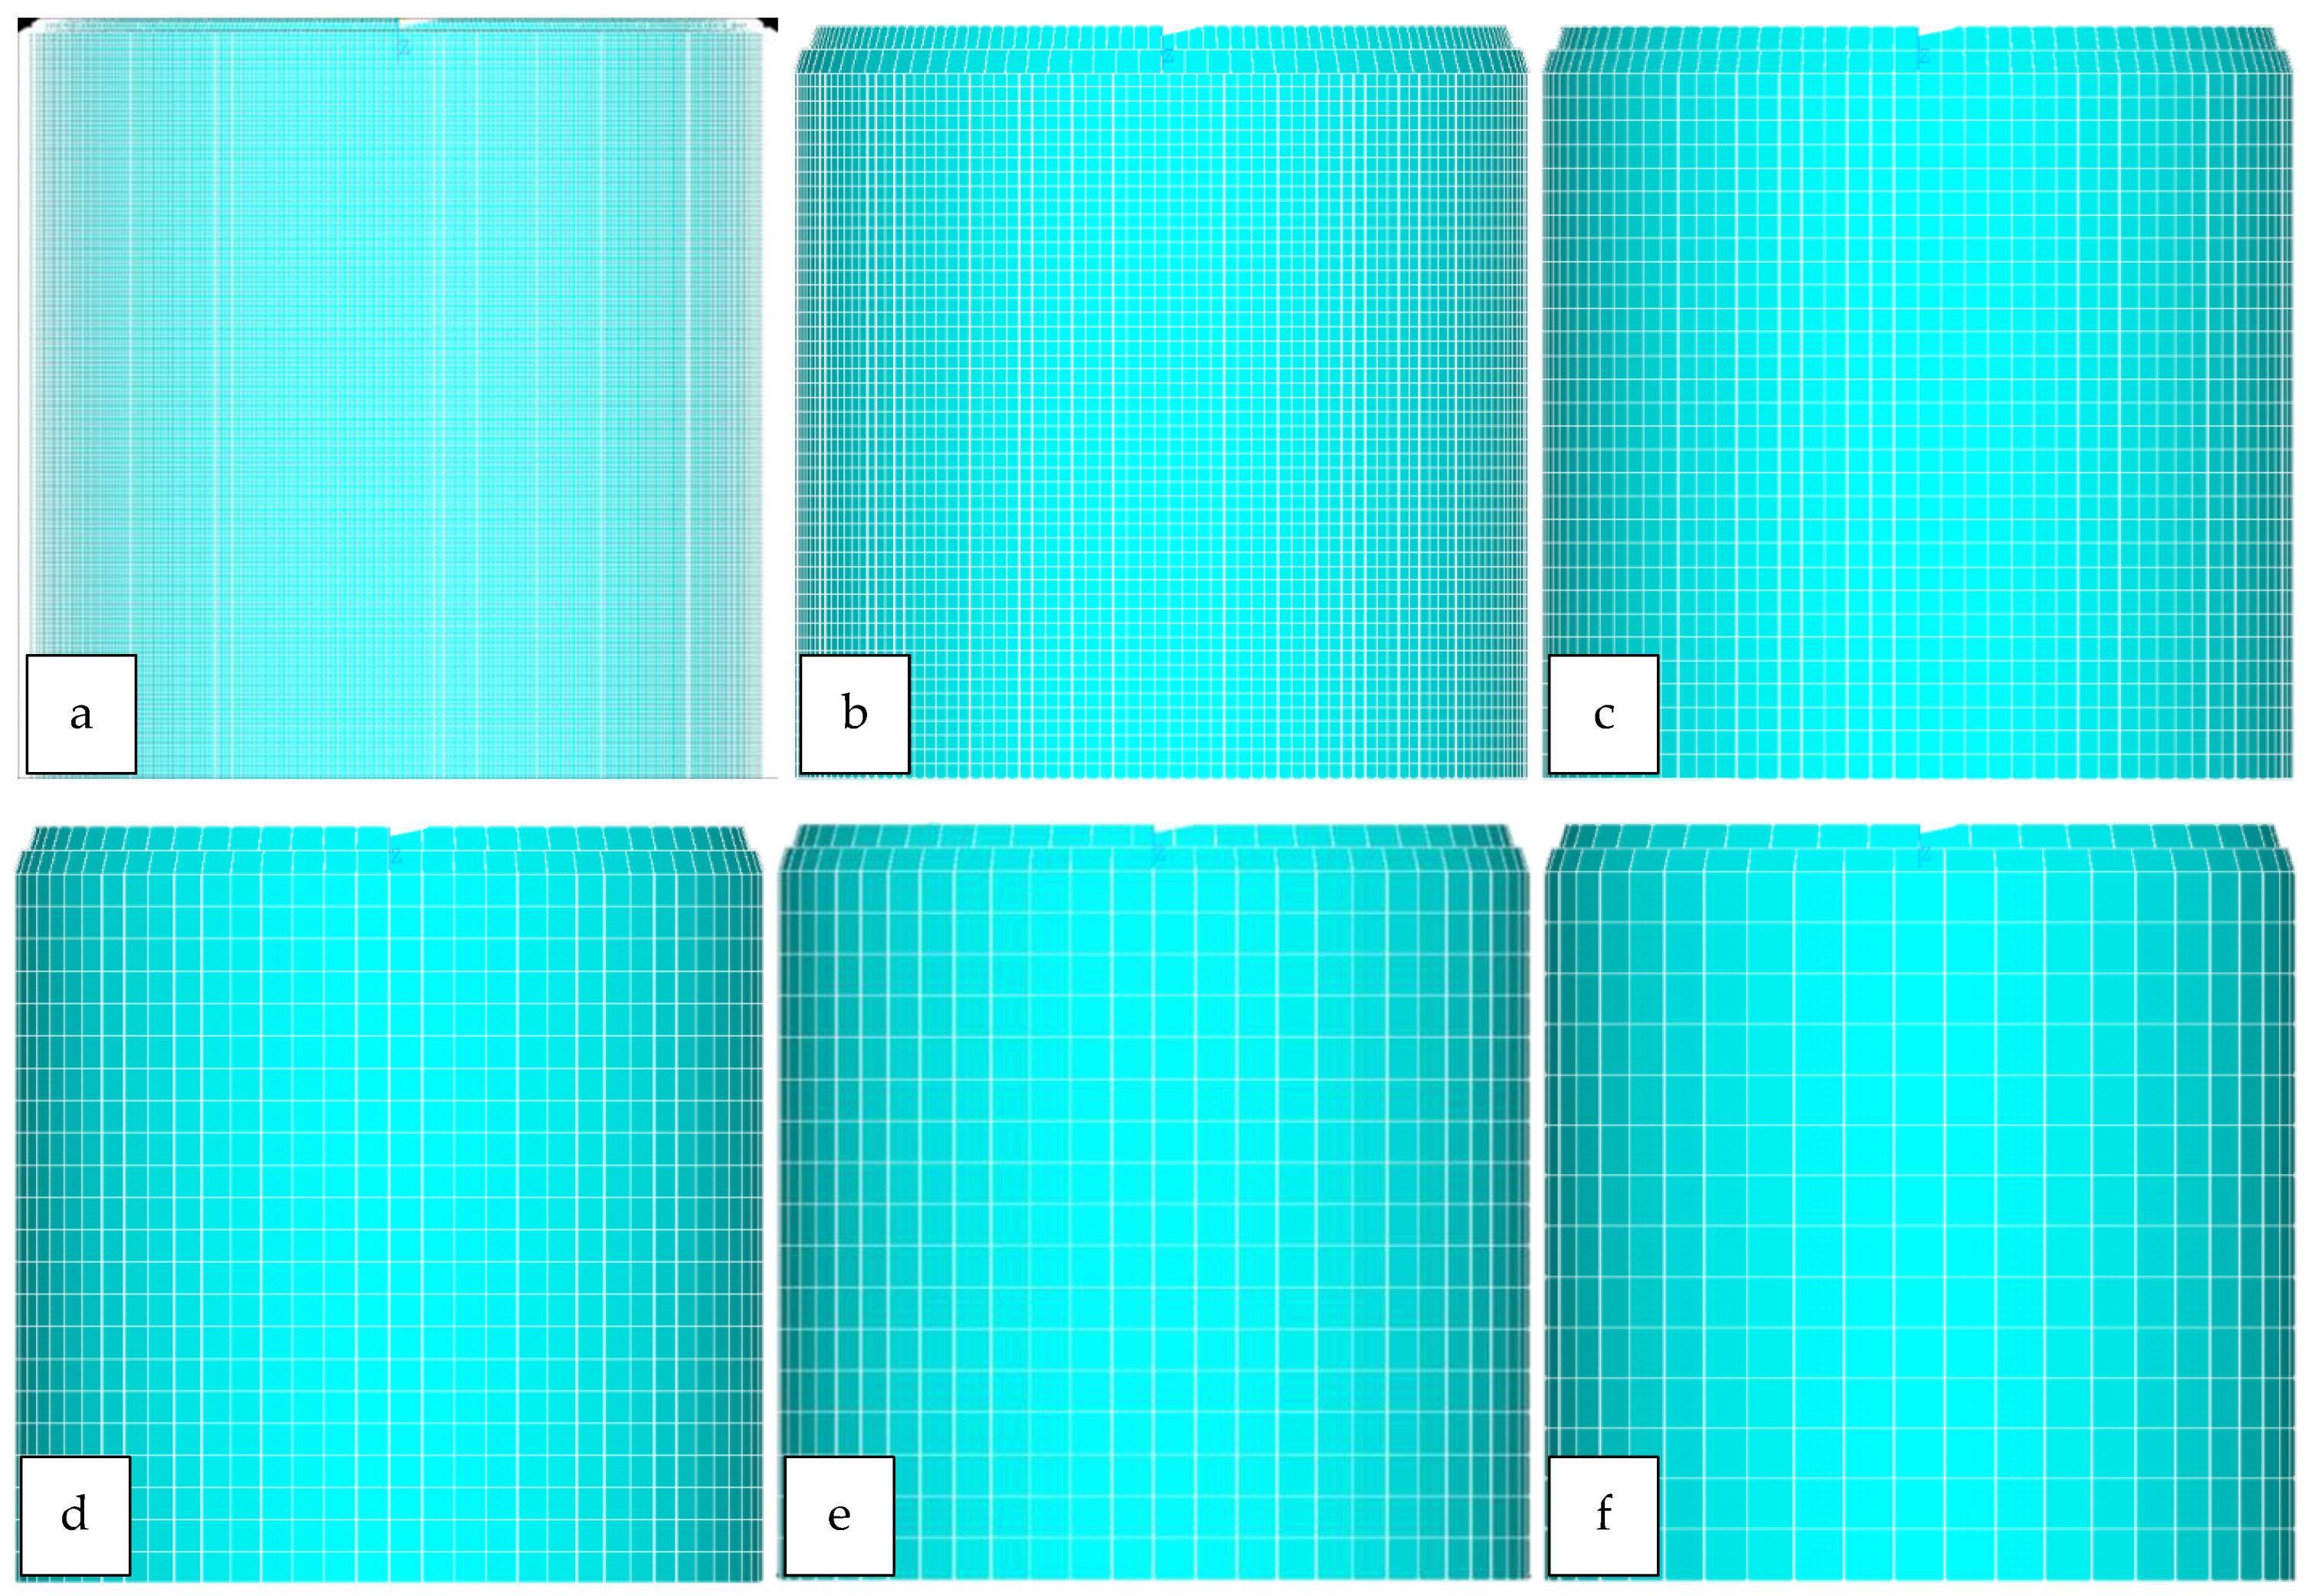
4.5. Mesh Size
In numerical modelling, one of the influential parameters is the mesh size. The mesh sensitivity test is beneficial for establishing a mesh size regarding a specific model to obtain an acceptable accuracy. In a numerical study, compromising acceptable accuracy for computable costs is also relatively important. Six different element sizes were modelled with 5.5, 4.5, 3.5, 2.5, 1.5, 0.5 mm quad elements (see
Figure 6).
From a design point of view, the aim is to achieve the cheapest model in terms of computational cost and predict energy absorption capability with an acceptable accuracy. As the mesh becomes increasingly finer, the computational cost increases dramatically, and relatively higher accuracy is achieved. A balance of the two needs to be chosen in that the energy absorption capability of the model is within an acceptable range and the computational cost is within an acceptable range.
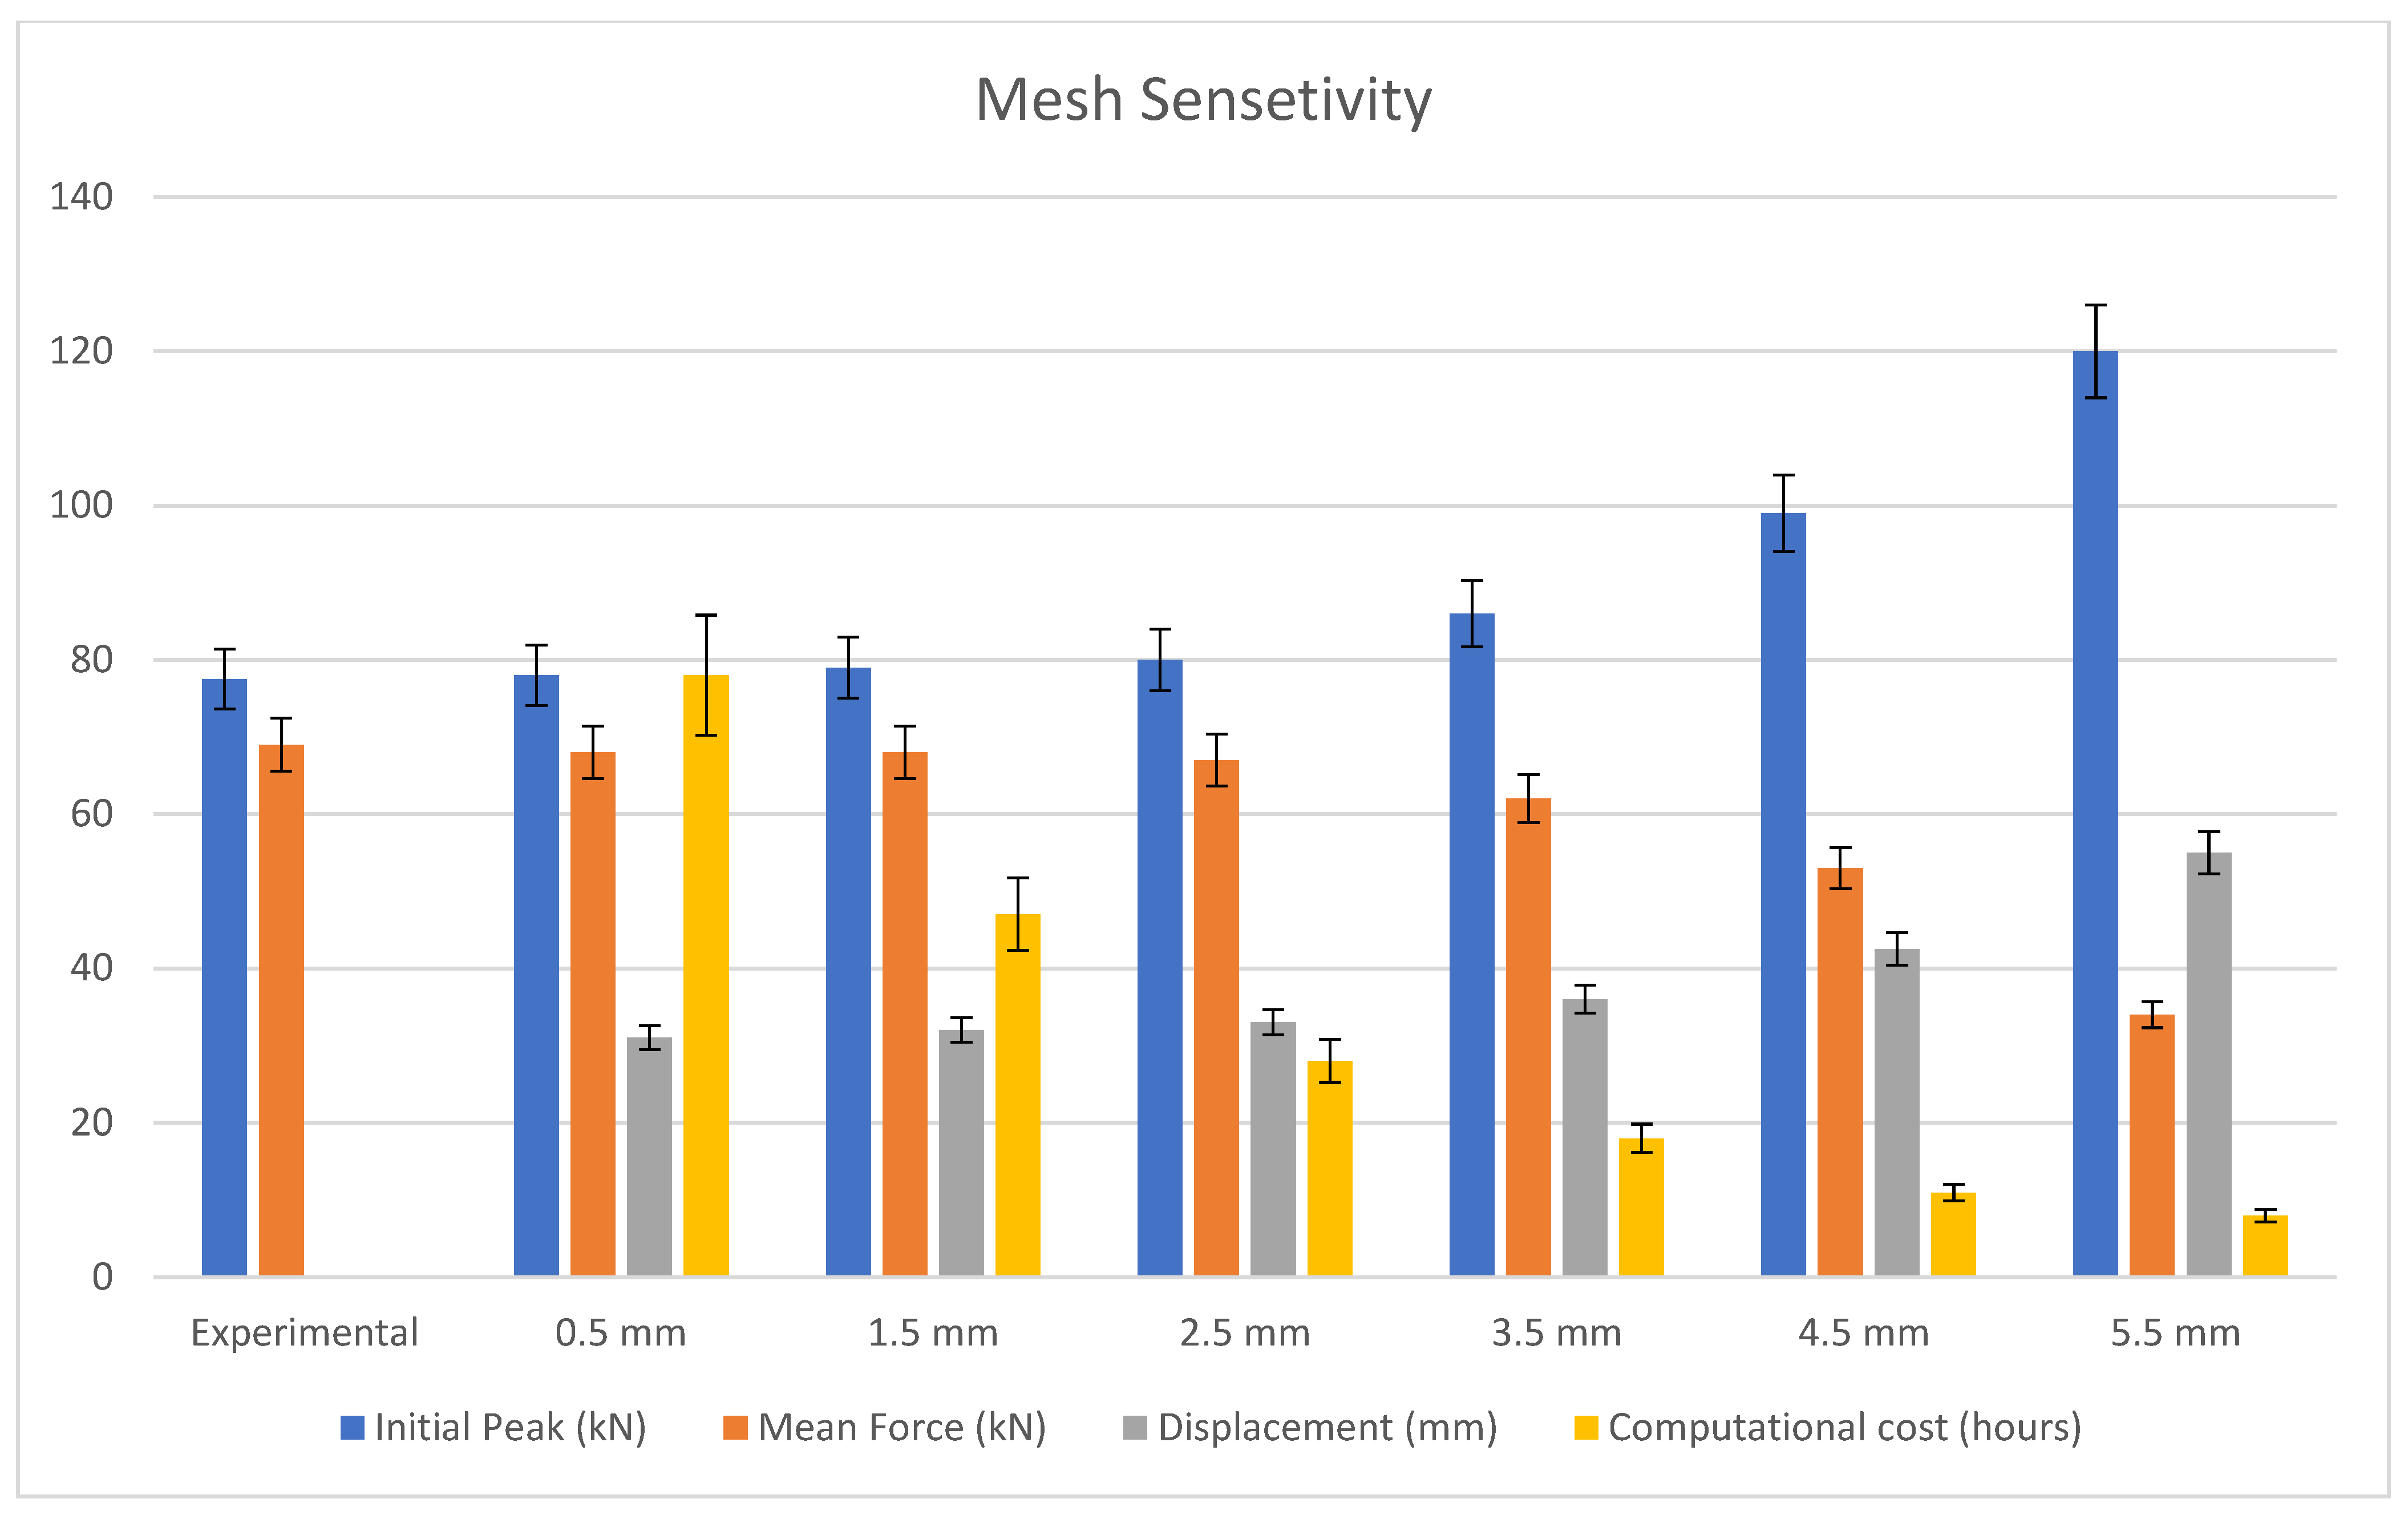
Figure 7 shows the mesh sensitivity comparison of the modelled mesh sizes mentioned in
Figure 6. The results illustrate a noticeable fact that the mesh 5.5 mm size is too coarse with very high peak forces and low mean crushing force, with 86 kN difference between the two. This mesh size has the lowest computational cost; however, the result is nearly 40% off from the experimental data. As the mesh size becomes smaller, the accuracy improves. At 4.5 mm, the results improved from the 5.5 mm case study, although the difference is 29% and at 3.5 mm, the difference is 18%. The peak is higher than the experimental study by 8 kN, and the mean crushing force is lower by 7 kN.
At a mesh size of 2.5 mm, the result is in line with experimental data. The difference is 5%, and the computational cost is lower than the mesh size of 1.5 and 0.5 mm by 170% and 280%, respectively. Although the accuracy is 1.5% for both cases, the balanced case to accurately calculate and predict energy absorption is 2.5 mm, which is supported by many studies [
43,
53,
59,
60].
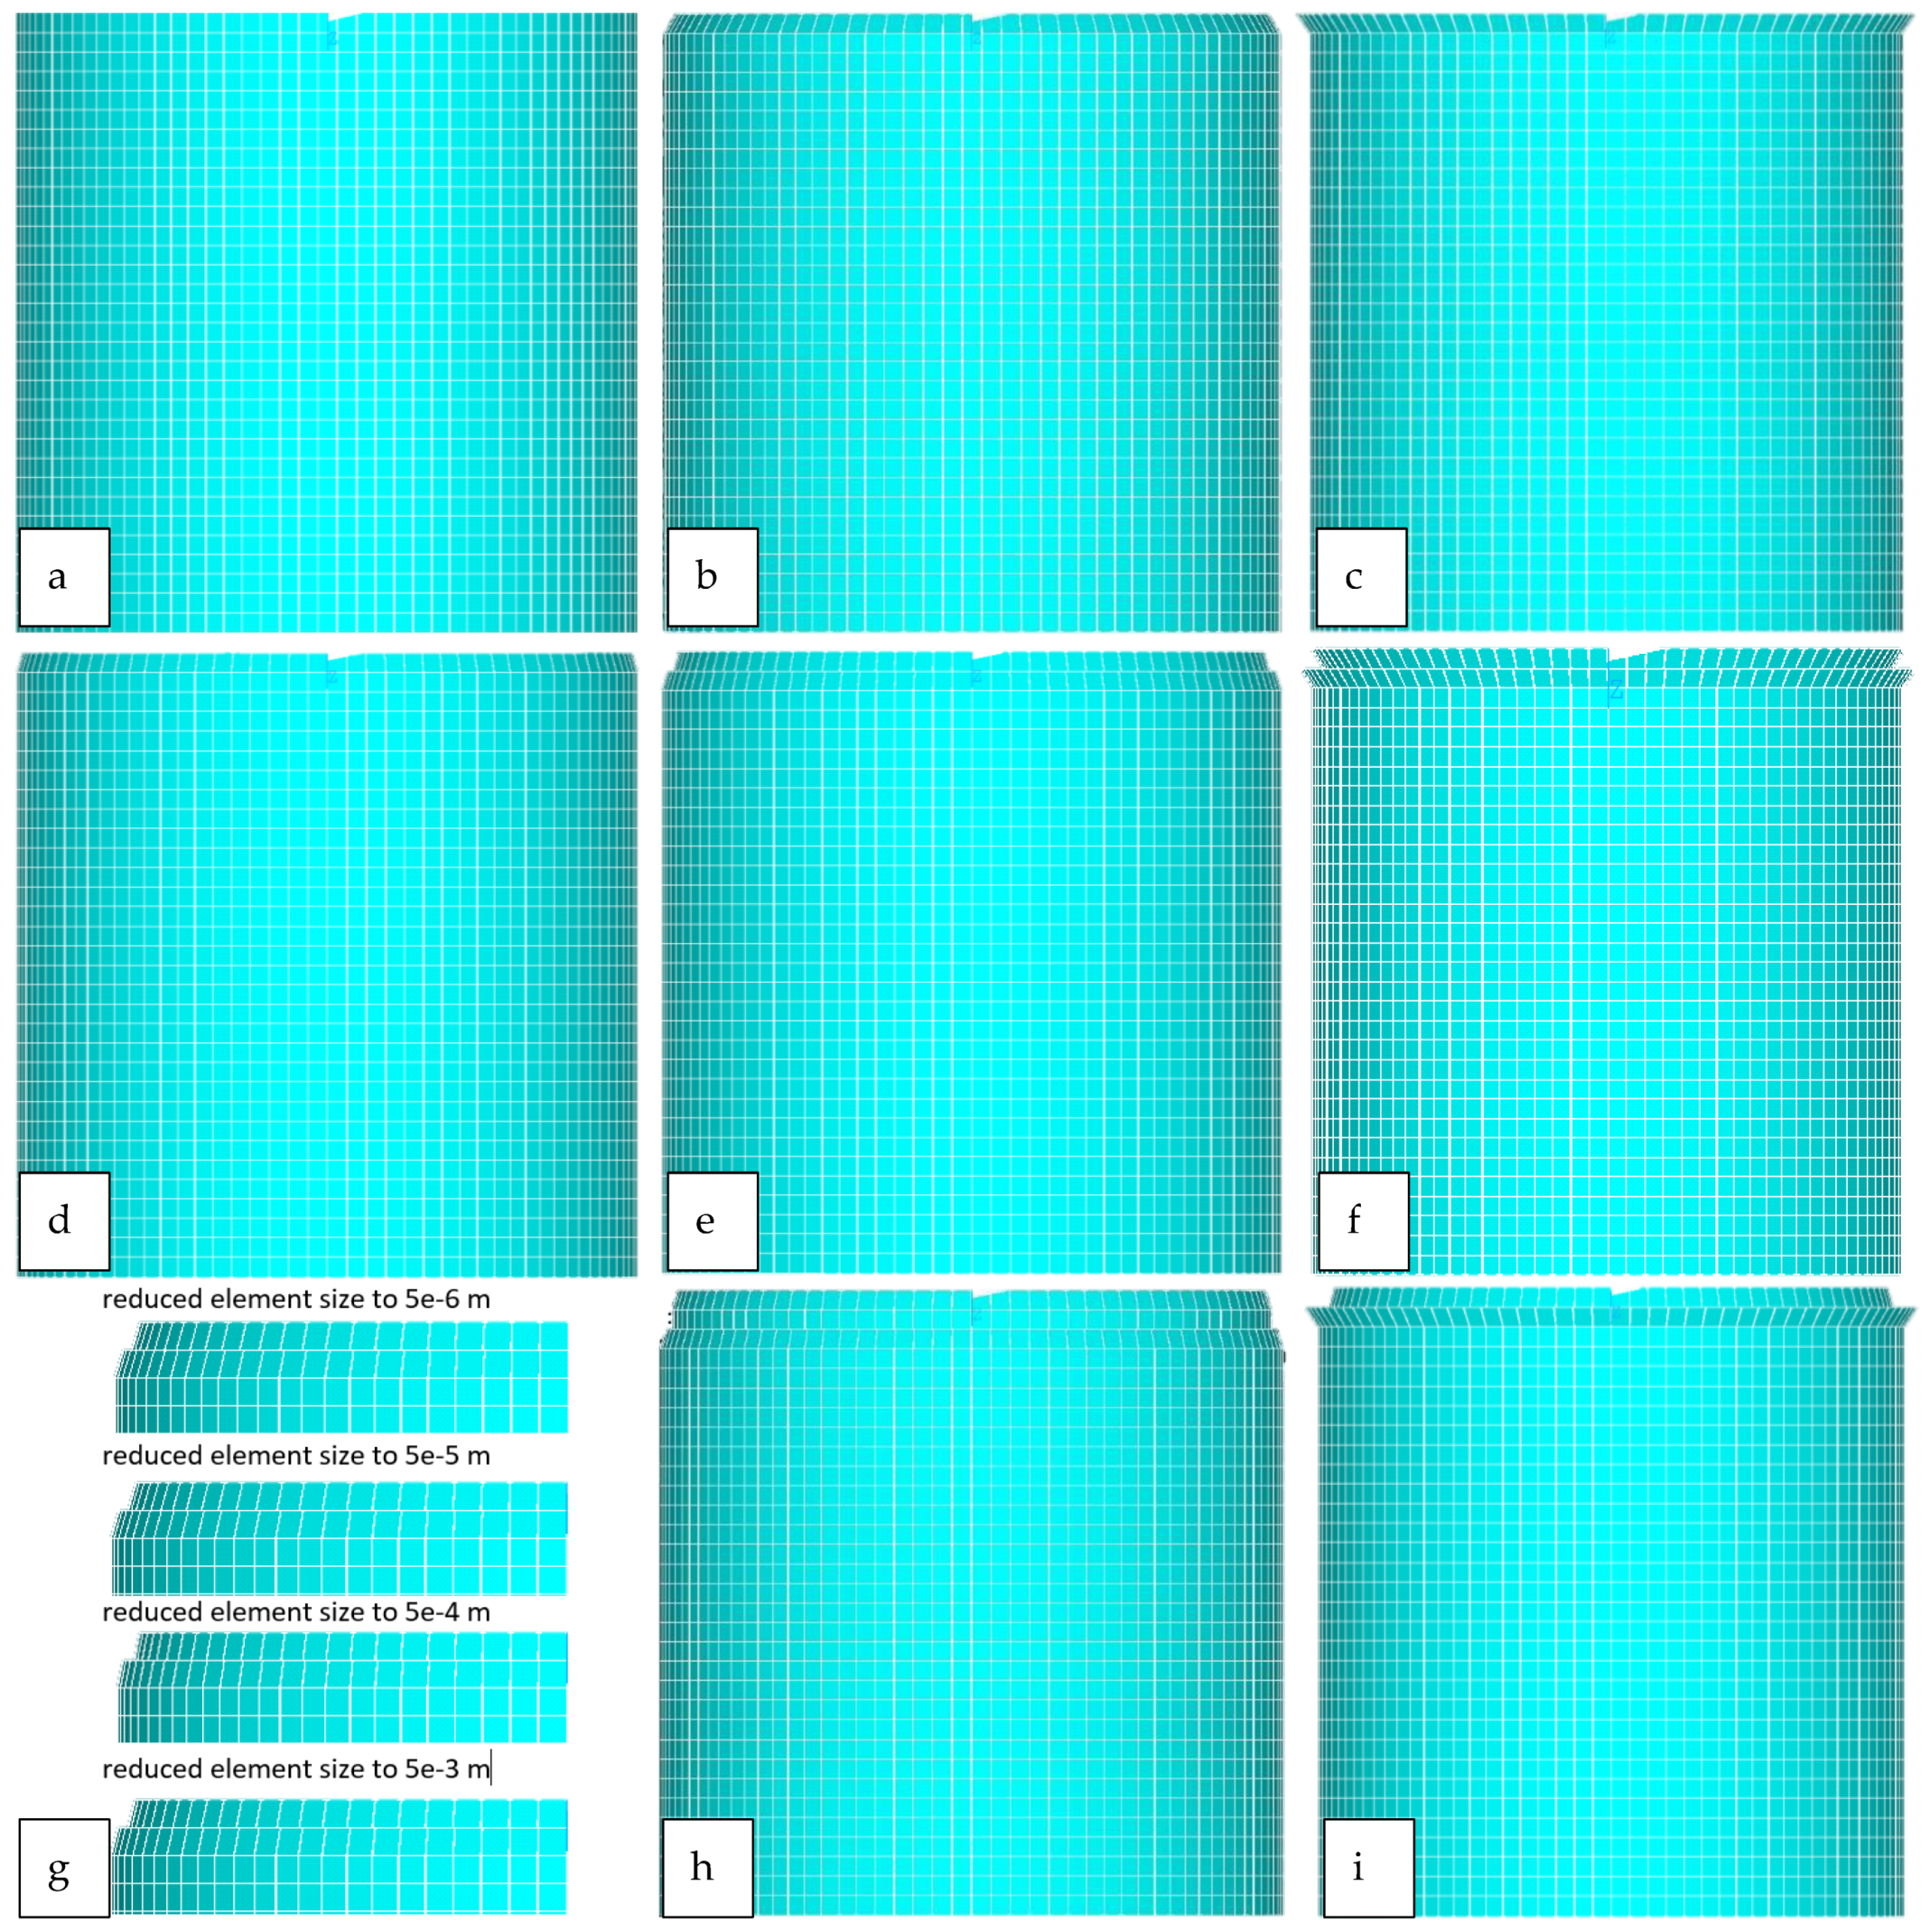
4.6. Trigger Modelling
In experimental studies, a 45° bevelled trigger mechanism was utilised, and similarly, in numerical studies, a suitable trigger mechanism is needed to initiate the progressive failure that matches the experimental studies. The maximum crush force in the FEA model tends to be overestimated significantly [
10,
54]. Few approaches were raised to study the effect of different trigger mechanisms on the initial peak value of the load and mean crushing force (see
Figure 8). These case studies are, (a) single-shell with no trigger, (b) single-shell inward-chamfer, (c) single-shell outward-chamfer, (d) double-shell level size inward-chamfer, (e) double-shell with 2.5 mm shell size difference inward-chamfer, (f) double-shell with 2.5 mm shell size difference outward-chamfer, (g) double-shell with 2.5 mm shell size difference inward-chamfer with different reduced element sizes, (h) double-shell with 5 mm shell size difference inward-chamfer, (i) double-shell with 2.5 mm shell size difference inward and outward-chamfer.
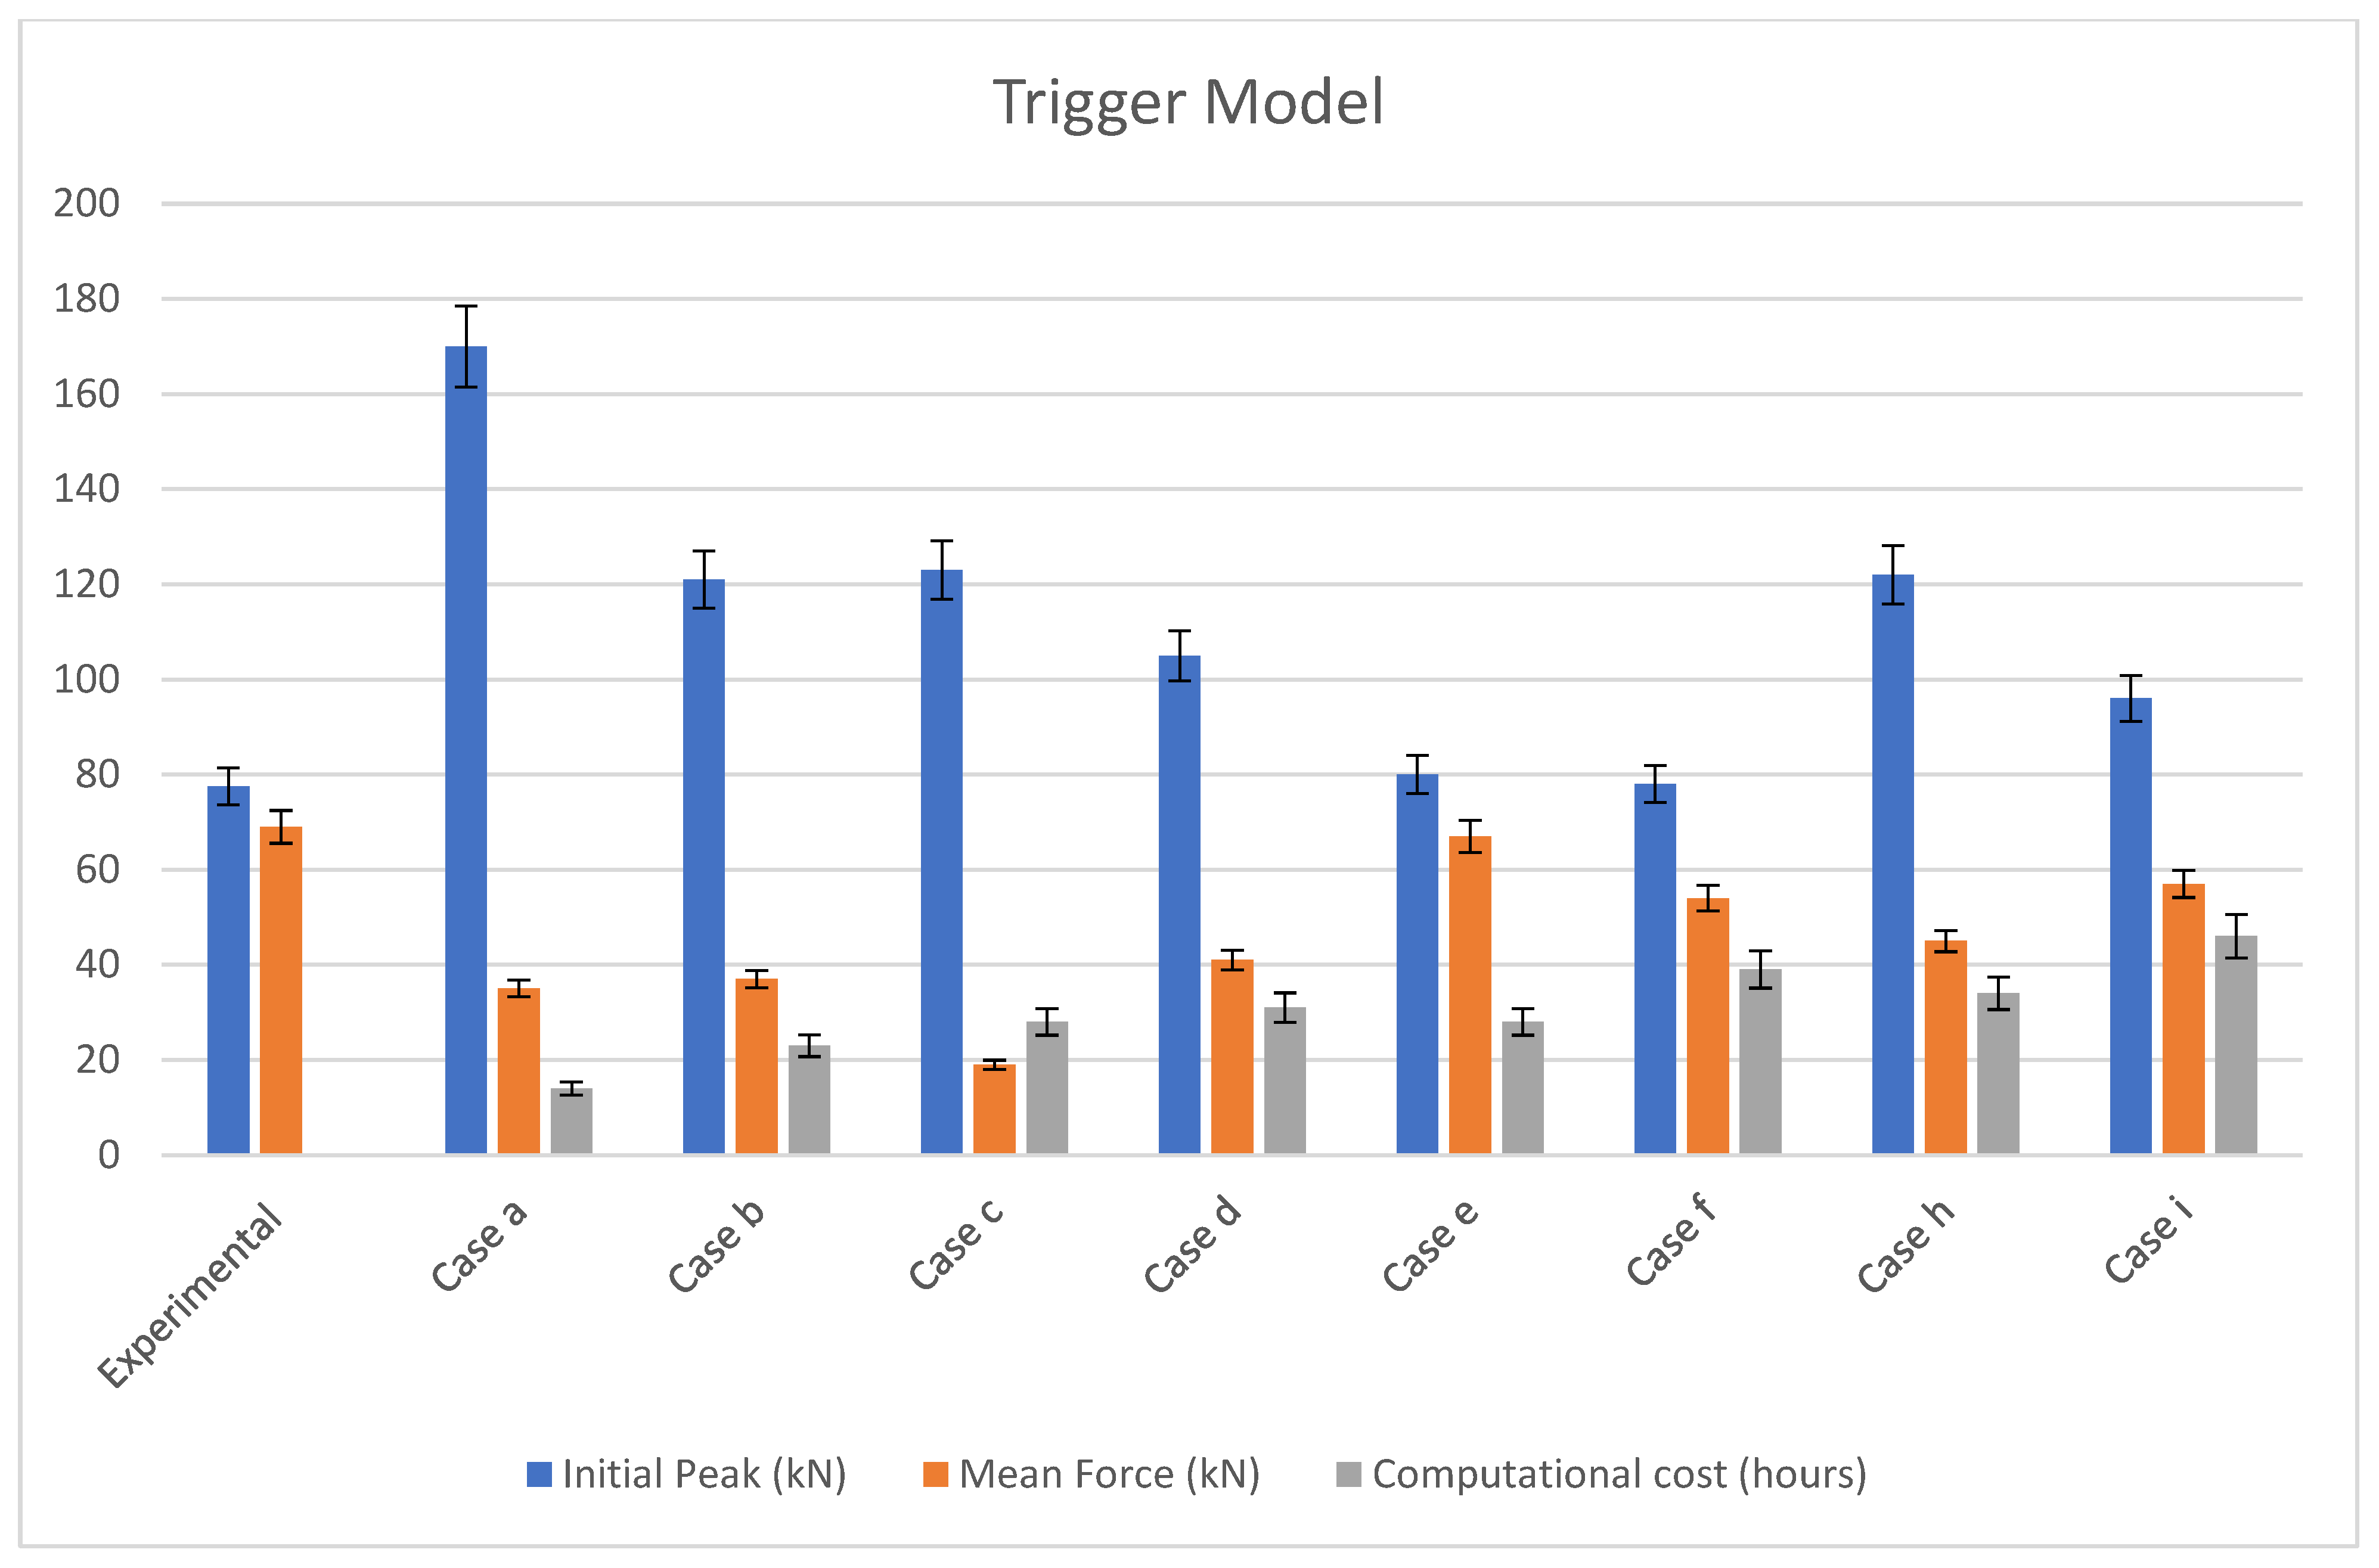
The results from the case studies are compared in
Figure 9 and
Figure 10. The aim of this research is to find the optimum finite element modelling case to obtain a prediction of the initial peak force value.
Single-shell configuration with trigger mechanism has shown better peaks and mean crushing force prediction (case b and c) than the one without the trigger mechanism (case a). However, the double-shell configuration has led to better prediction with less than 5% error compared with experimental data. Outward-chamfer in all cases lead to an increase in computational costs with lower mean crushing force. Cases (e) and (f) have shown better prediction of the initial peak values of 80 and 78 kN. The configurations of the two are similar in sectioning and positioning of the shells, with the outer shell being 2.5 mm (one element size) shorter than the inner shell. However, the difference lays in the computational costs, in which the outward-chamfer, as shown in all cases, increases by 5–15 h. Furthermore, the trigger mechanism affects progressive crushing behaviour. The mean crushing force in case (f) has a lower value than the one in case (e).
Case (g) is based on case (e), and the configuration of the trigger is the same. In this trigger mechanism, the element size is reduced to a smaller size, and this acts as the trigger mechanism. This technique is supported by [
43,
44,
59,
60]. In
Figure 10, the reduced element sizes are compared against their initial peak value and mean crushing force and computational costs. It can be concluded that as the element size becomes thicker, the peak value increases and from 0.05 mm onwards, and this reduction in element size has no effect on initial peak value.
The prevailing case that matches experimental results is a 2.5 mm sectioned double-shell configuration with an inward-chamfering trigger mechanism and a reduced element size of 0.05 mm.
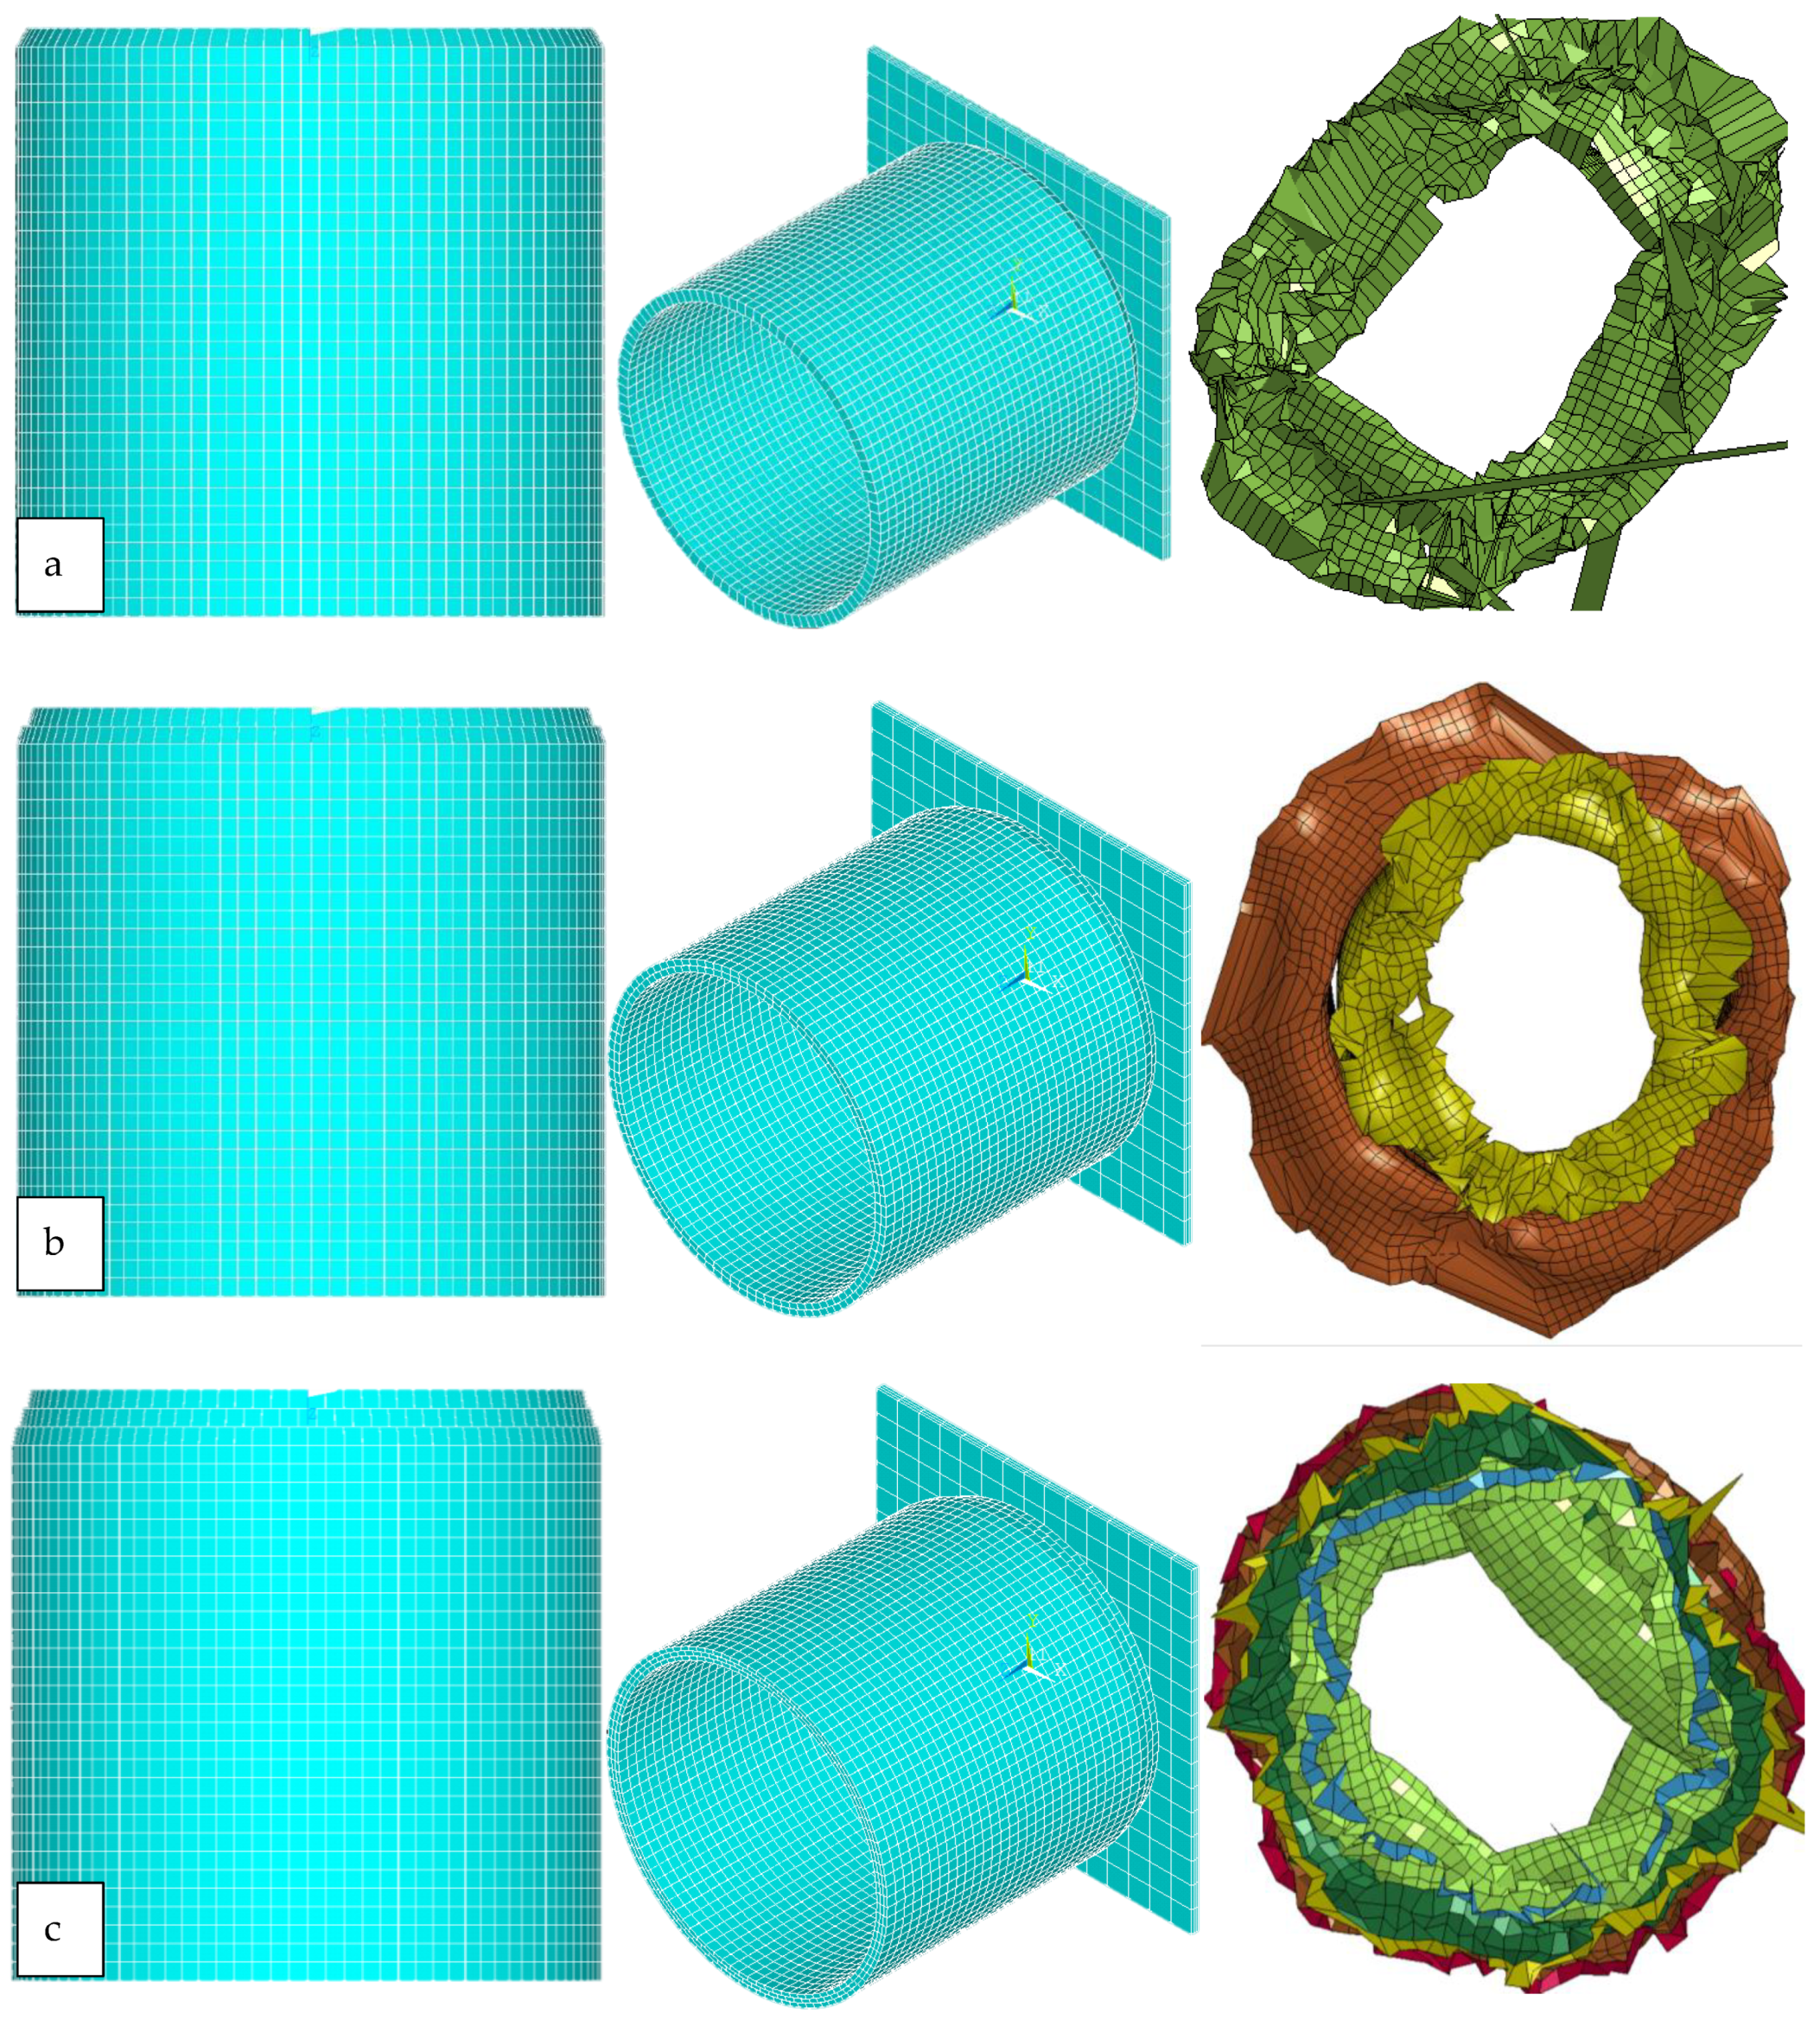
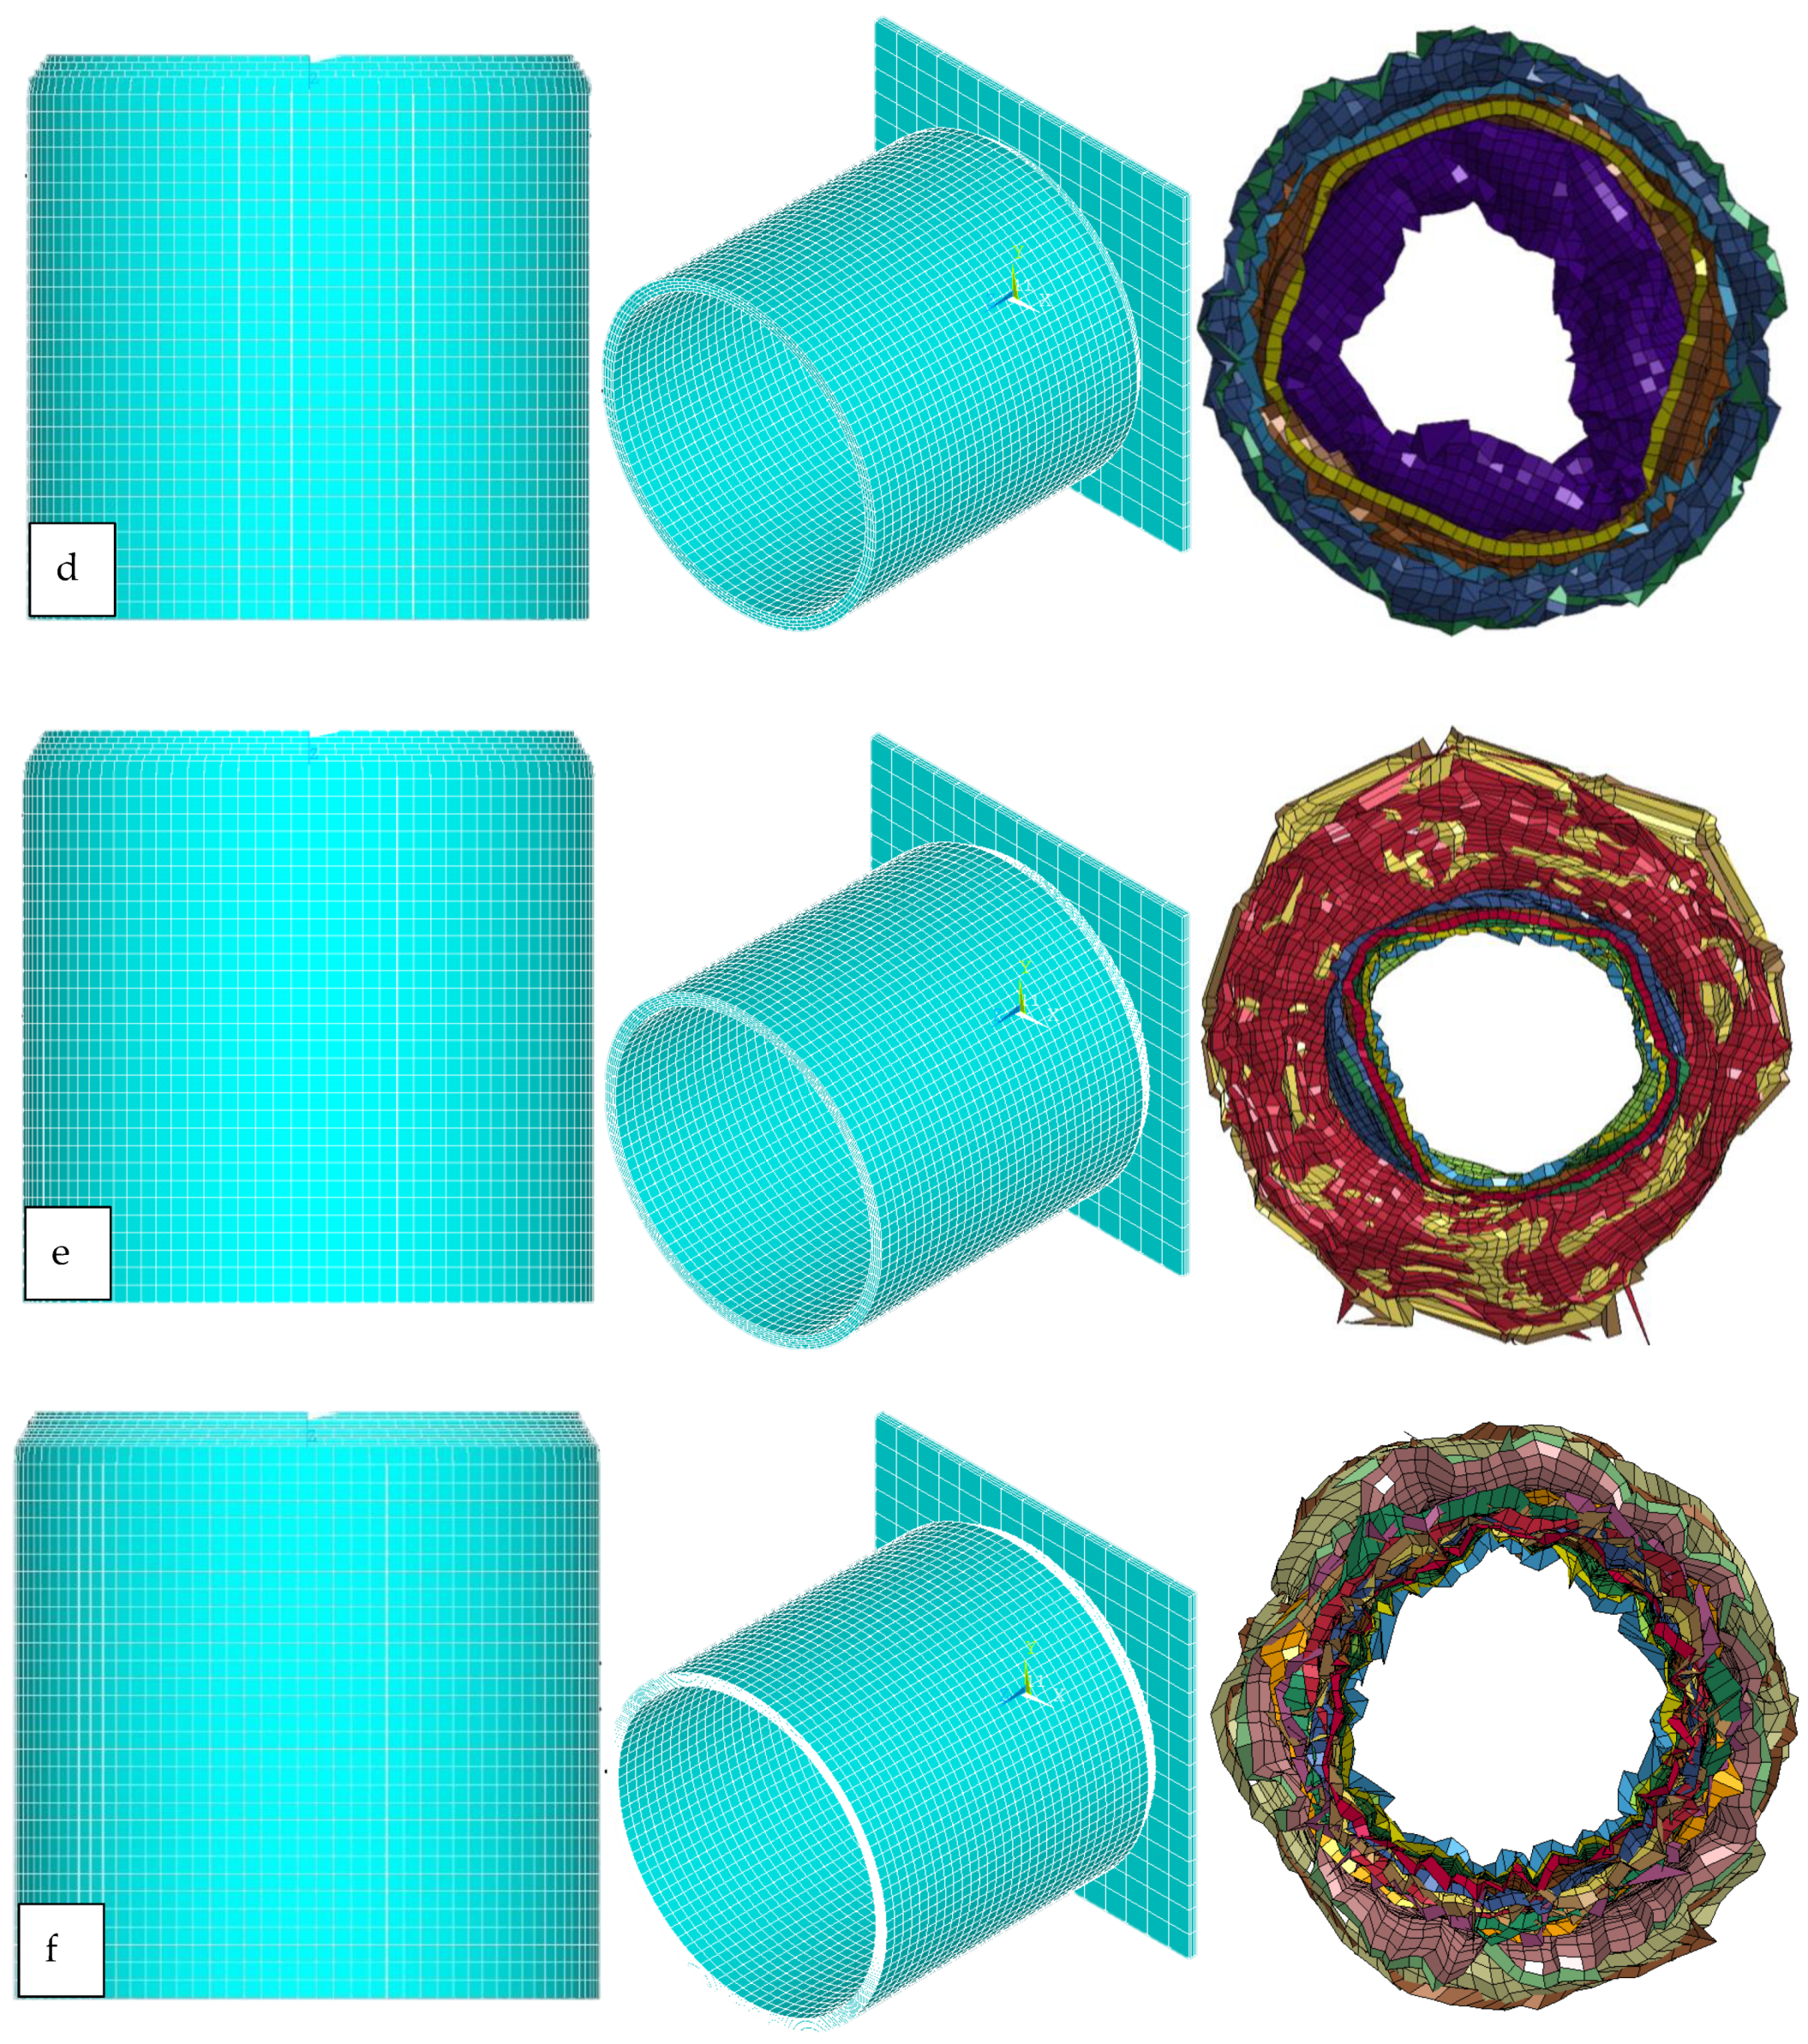
4.7. Number of Shell(s) Configuration
The effect of the number of shells on the energy absorption prediction of FEM is investigated. The case studies are 1, 2, 3, 4, 6, and 12 shells (see
Figure 11).
In this study, the crushed morphology is one of the factors that is greatly influenced, as seen in
Figure 11. From the crushed morphology point of view, it can be concluded that, as the number of shells increase, the symmetricity and prediction of crushing behaviour improves. Since 12 plies were used in experimental studies, six cases were considered. All cases were subjected to the same trigger mechanism and applied energy.
In
Figure 12, the shell configurations are compared. In single-shell configuration, the initial peak and mean crushing force is off by 45%. However, in double-shell configuration, this improves to a 5% difference. The initial peak value is 80 kN with a crushing force of 67 kN. Hereafter, the computational cost is the deciding parameter. Since the crushing behaviour slightly or minimally improves by adding more shells. This improvement is in both the initial peak value and mean crushing force value. However, the computational cost increases rapidly by adding more shells to the model. Using the 12 shell configuration compared with experimental data, it has a 1.5% difference, and using a double-shell configuration, it has a 5% difference. From an engineering point of view, this compromising 3.5% results in solving the problem with 4.5 times less computational costs; one takes 28 h to converge and the other 123 h.
At this stage, since the main concentration is energy absorption capability, the reliable and cheaper computational cost of double-shell configuration is considered in this study and is also supported by [
43,
54,
59,
60].
6. Modelling limitations
Based on the study carried out in
Section 5, sensitivity towards physical parameters was studied based on the developed model. The FEA results are influenced by many input parameters. To develop a model that is capable of predicting energy absorption in an accurate enough format, a few extracted results must also be acceptable. These parameters are computational cost, initial peak force, mean crushing force, displacement and specific energy absorption. A relatively simple model approach leads to high efficiency, and this was the main concentration of this section. There is a balance between computational cost and final results that needs to be within an acceptable range of up to 10% [
59].
In Mat_54, some parameters have no physical meaning, which means some limitations might cause the simulation model to be ruled by non-physical parameters. Therefore, the applicability of the model to another crush scenario must be carried out with care. A change in geometry and the mechanical properties mean that the model can be adapted to that specific crash scenario with care and some adjustments.
More advanced material cards are developed with solid elements to improve capturing delamination energy. Further studies are needed on the mechanical properties of the material and energy release rate in Mode-I and Mode-II. Most importantly, using solid elements rapidly increases computational costs compared with shell elements. This technique increases accuracy, although both testing and computational costs increase.
Increasing the material model complexity leads to further test data but is expensive and increases computational costs. Depending on case studies, from an engineering point of view, a finite element model with an accuracy of up to 10% is acceptable [
59,
60]. However, the developed model has its limitation in showing the fracture and crushing on a smaller scale, force–displacement characteristics, and debris wedge.
6.1. Fracture Morphology
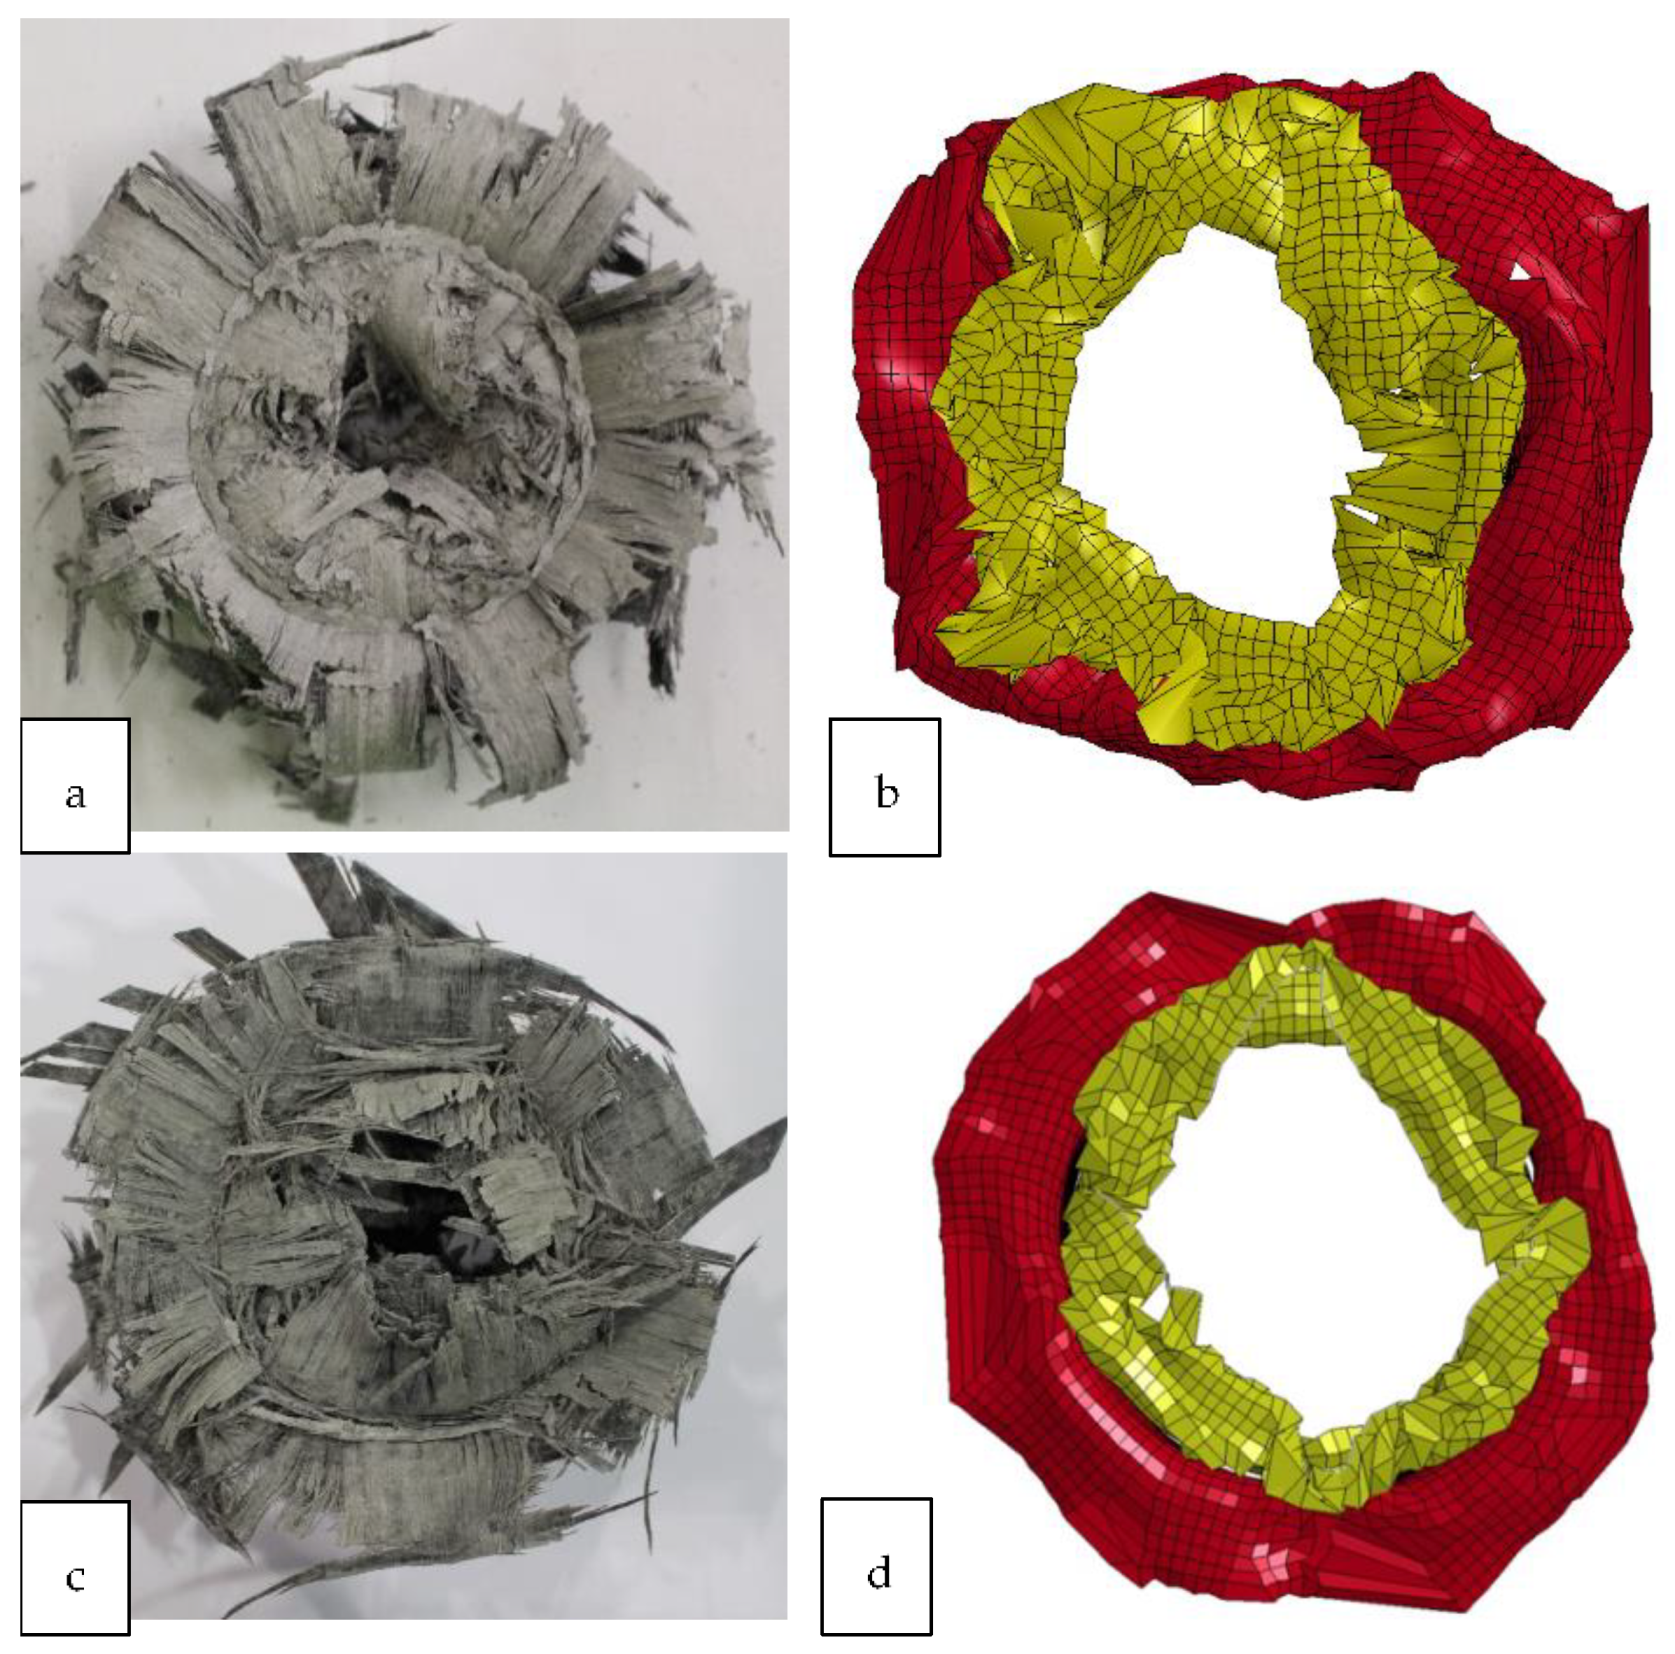
Regarding crushed morphologies, to capture axial splits using Mat_54, the DFAILM, which is the failure strain in the matrix direction [
47], can be utilised. Adjusting the value of DFAILM enables matrix splitting to occur (see
Figure 23), as observed in the experiments. However, this parameter influenced the computational costs to be unreasonably high. Due to this fact and keeping a reasonable experimental efficiency, DFAILM values were retracted to original values. It is worth mentioning that, in this research, the main concentration was capturing energy absorption capability. DFAILM had a marginal effect on energy absorption capability, as mentioned above. In the material model Mat_54-55, the stacking sequence plays an important part in crushed morphologies. In
Figure 24, the FEM crushed morphologies of [0]
12 are shown, which resembles the experimental crushed morphologies. However, using ±45 leads to inadequate failure modes if DFAILM values exceed 10% to obtain matrix splitting/separation (see
Figure 23b).
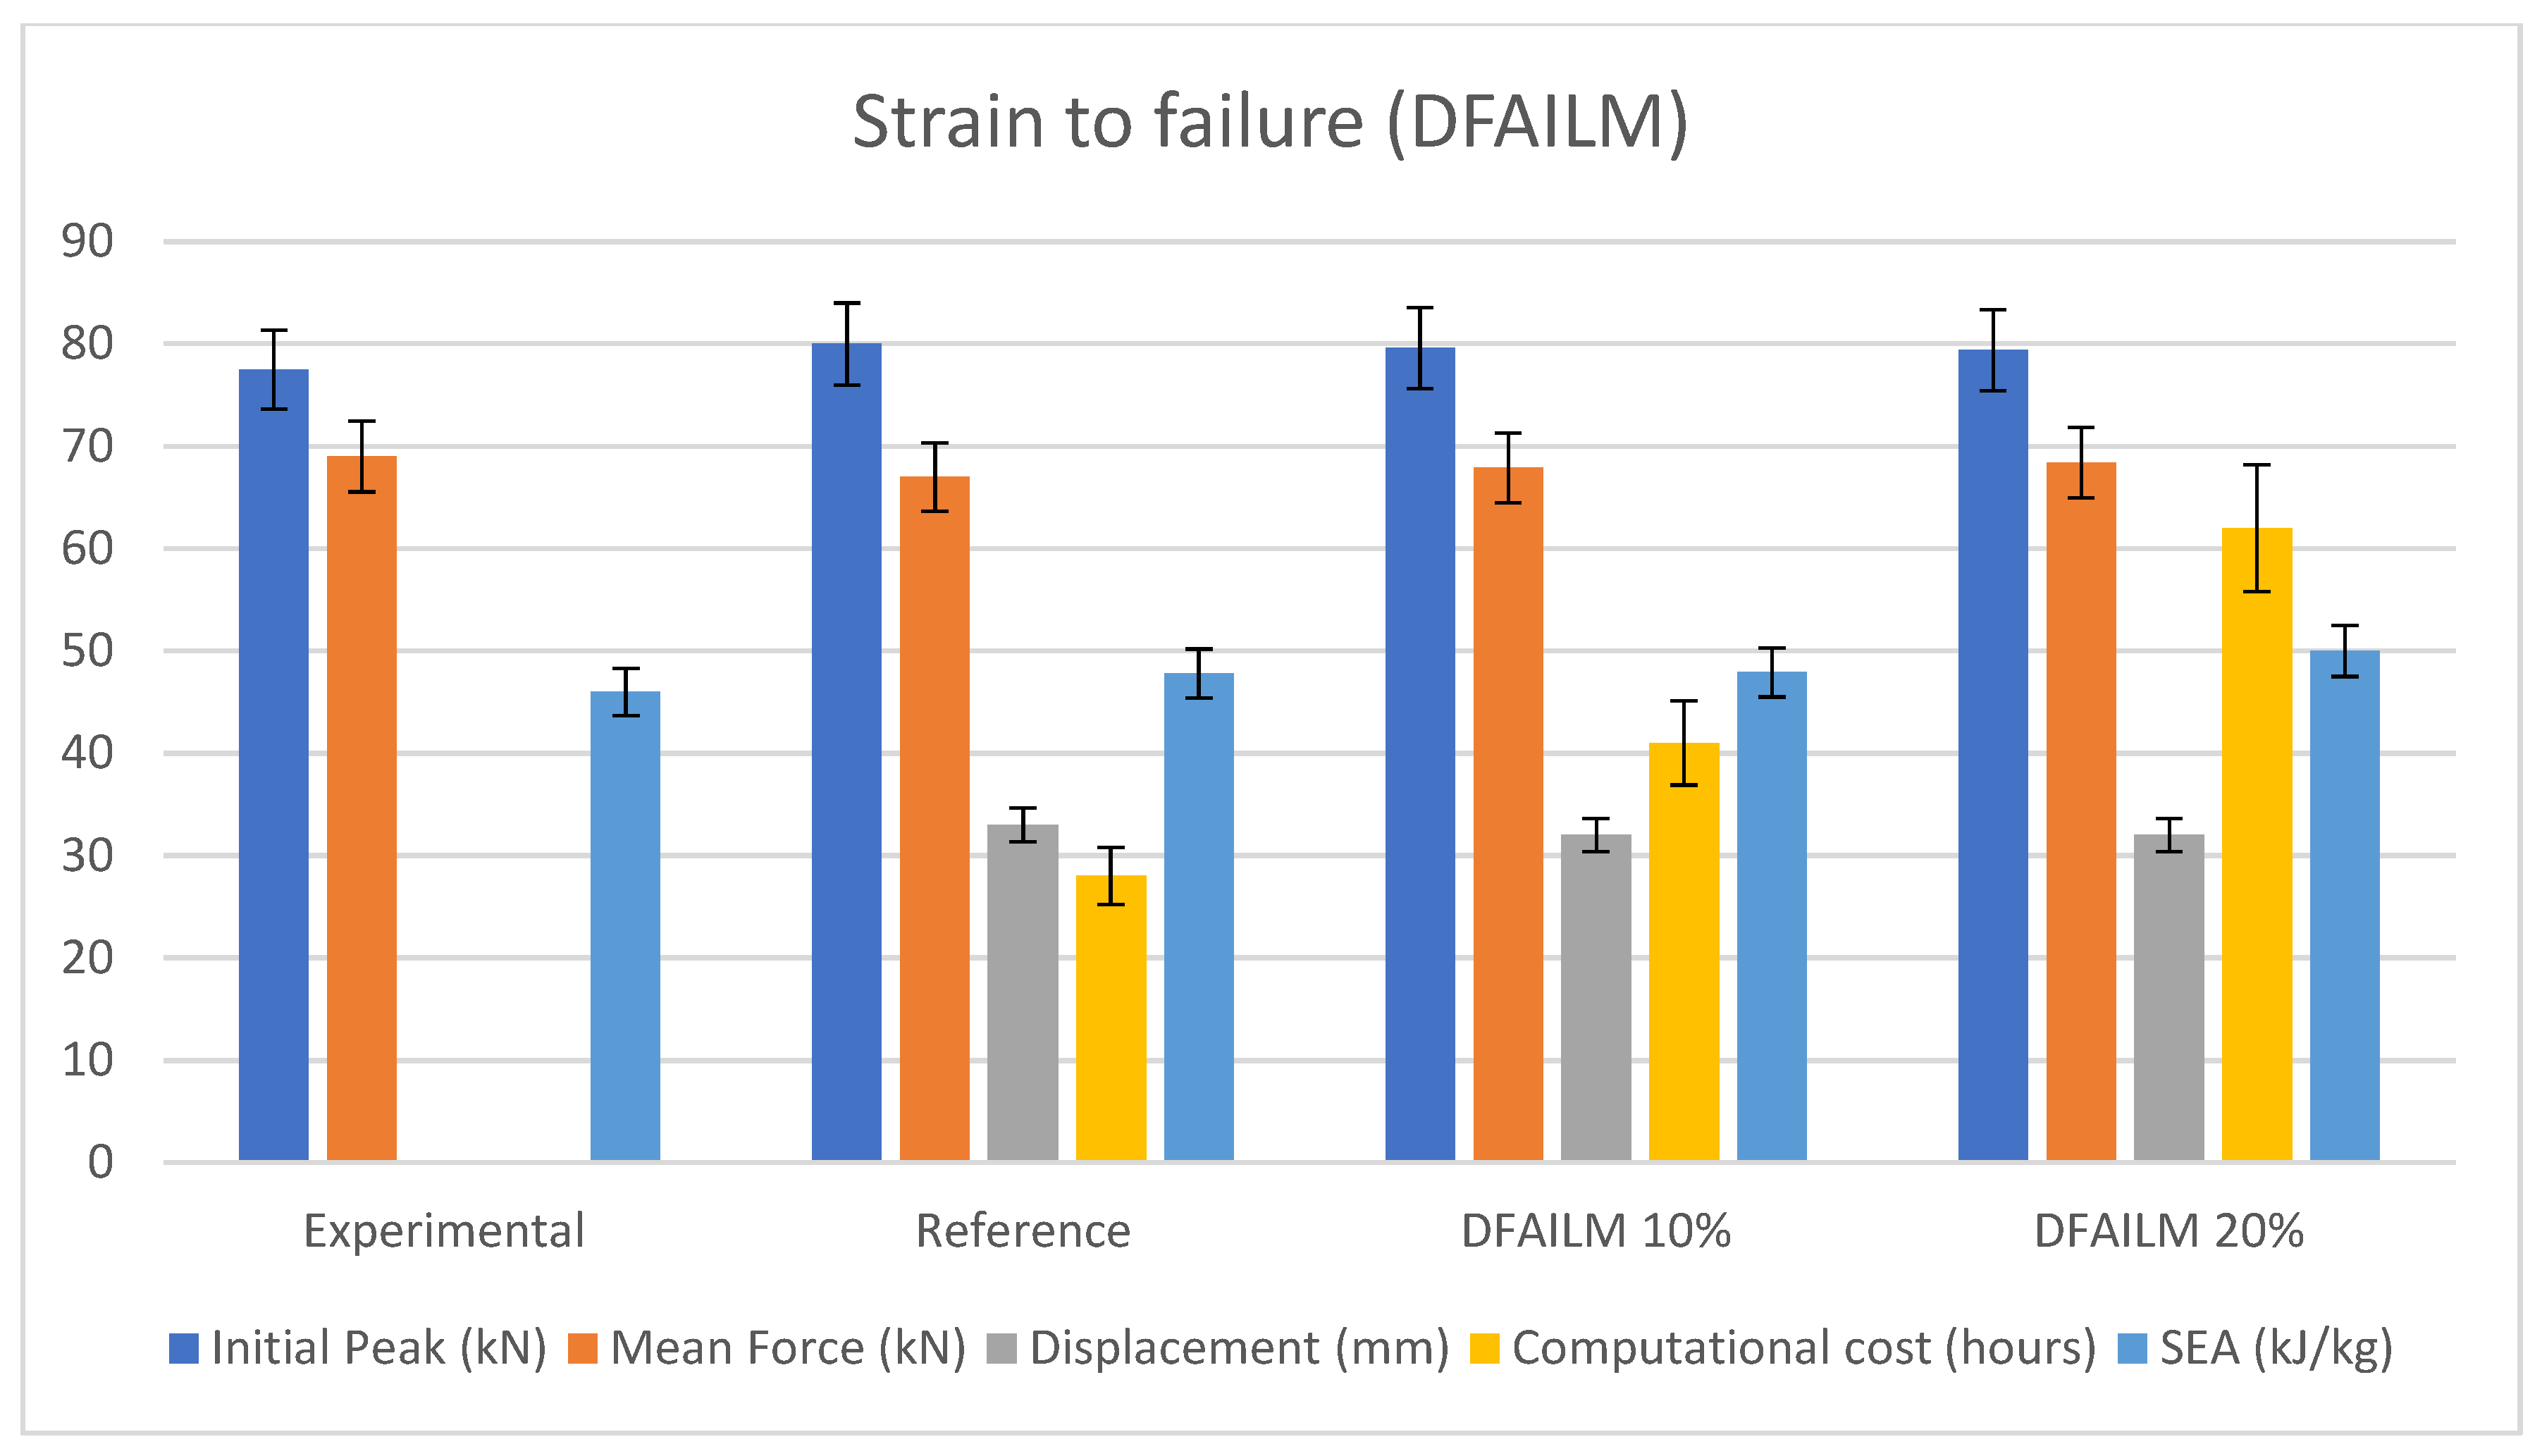
Figure 25 shows the comparison between the reference FEM and increase in DFAILM by 10% and 20%. The effect of DFAILM on the axial split is shown in
Figure 23, which improves the crushed morphology representation. Although, the results regarding energy absorption capability, including SEA values, were unaffected by this parameter. At a 10% increase, the axial split occurs in this FEM, which causes a 138% increase in computational costs. Increasing DFAILM by 20% causes a 176% increase in computational costs.
In consideration of these results, capturing an axial split seems rather unreasonable due to its effect on computational costs. Increasing the DFAILM value by 10 to 20% had minimal or no effect on the results, and an axial split below 10% in this FEM does not occur.
6.2. Force–Displacement Characteristics
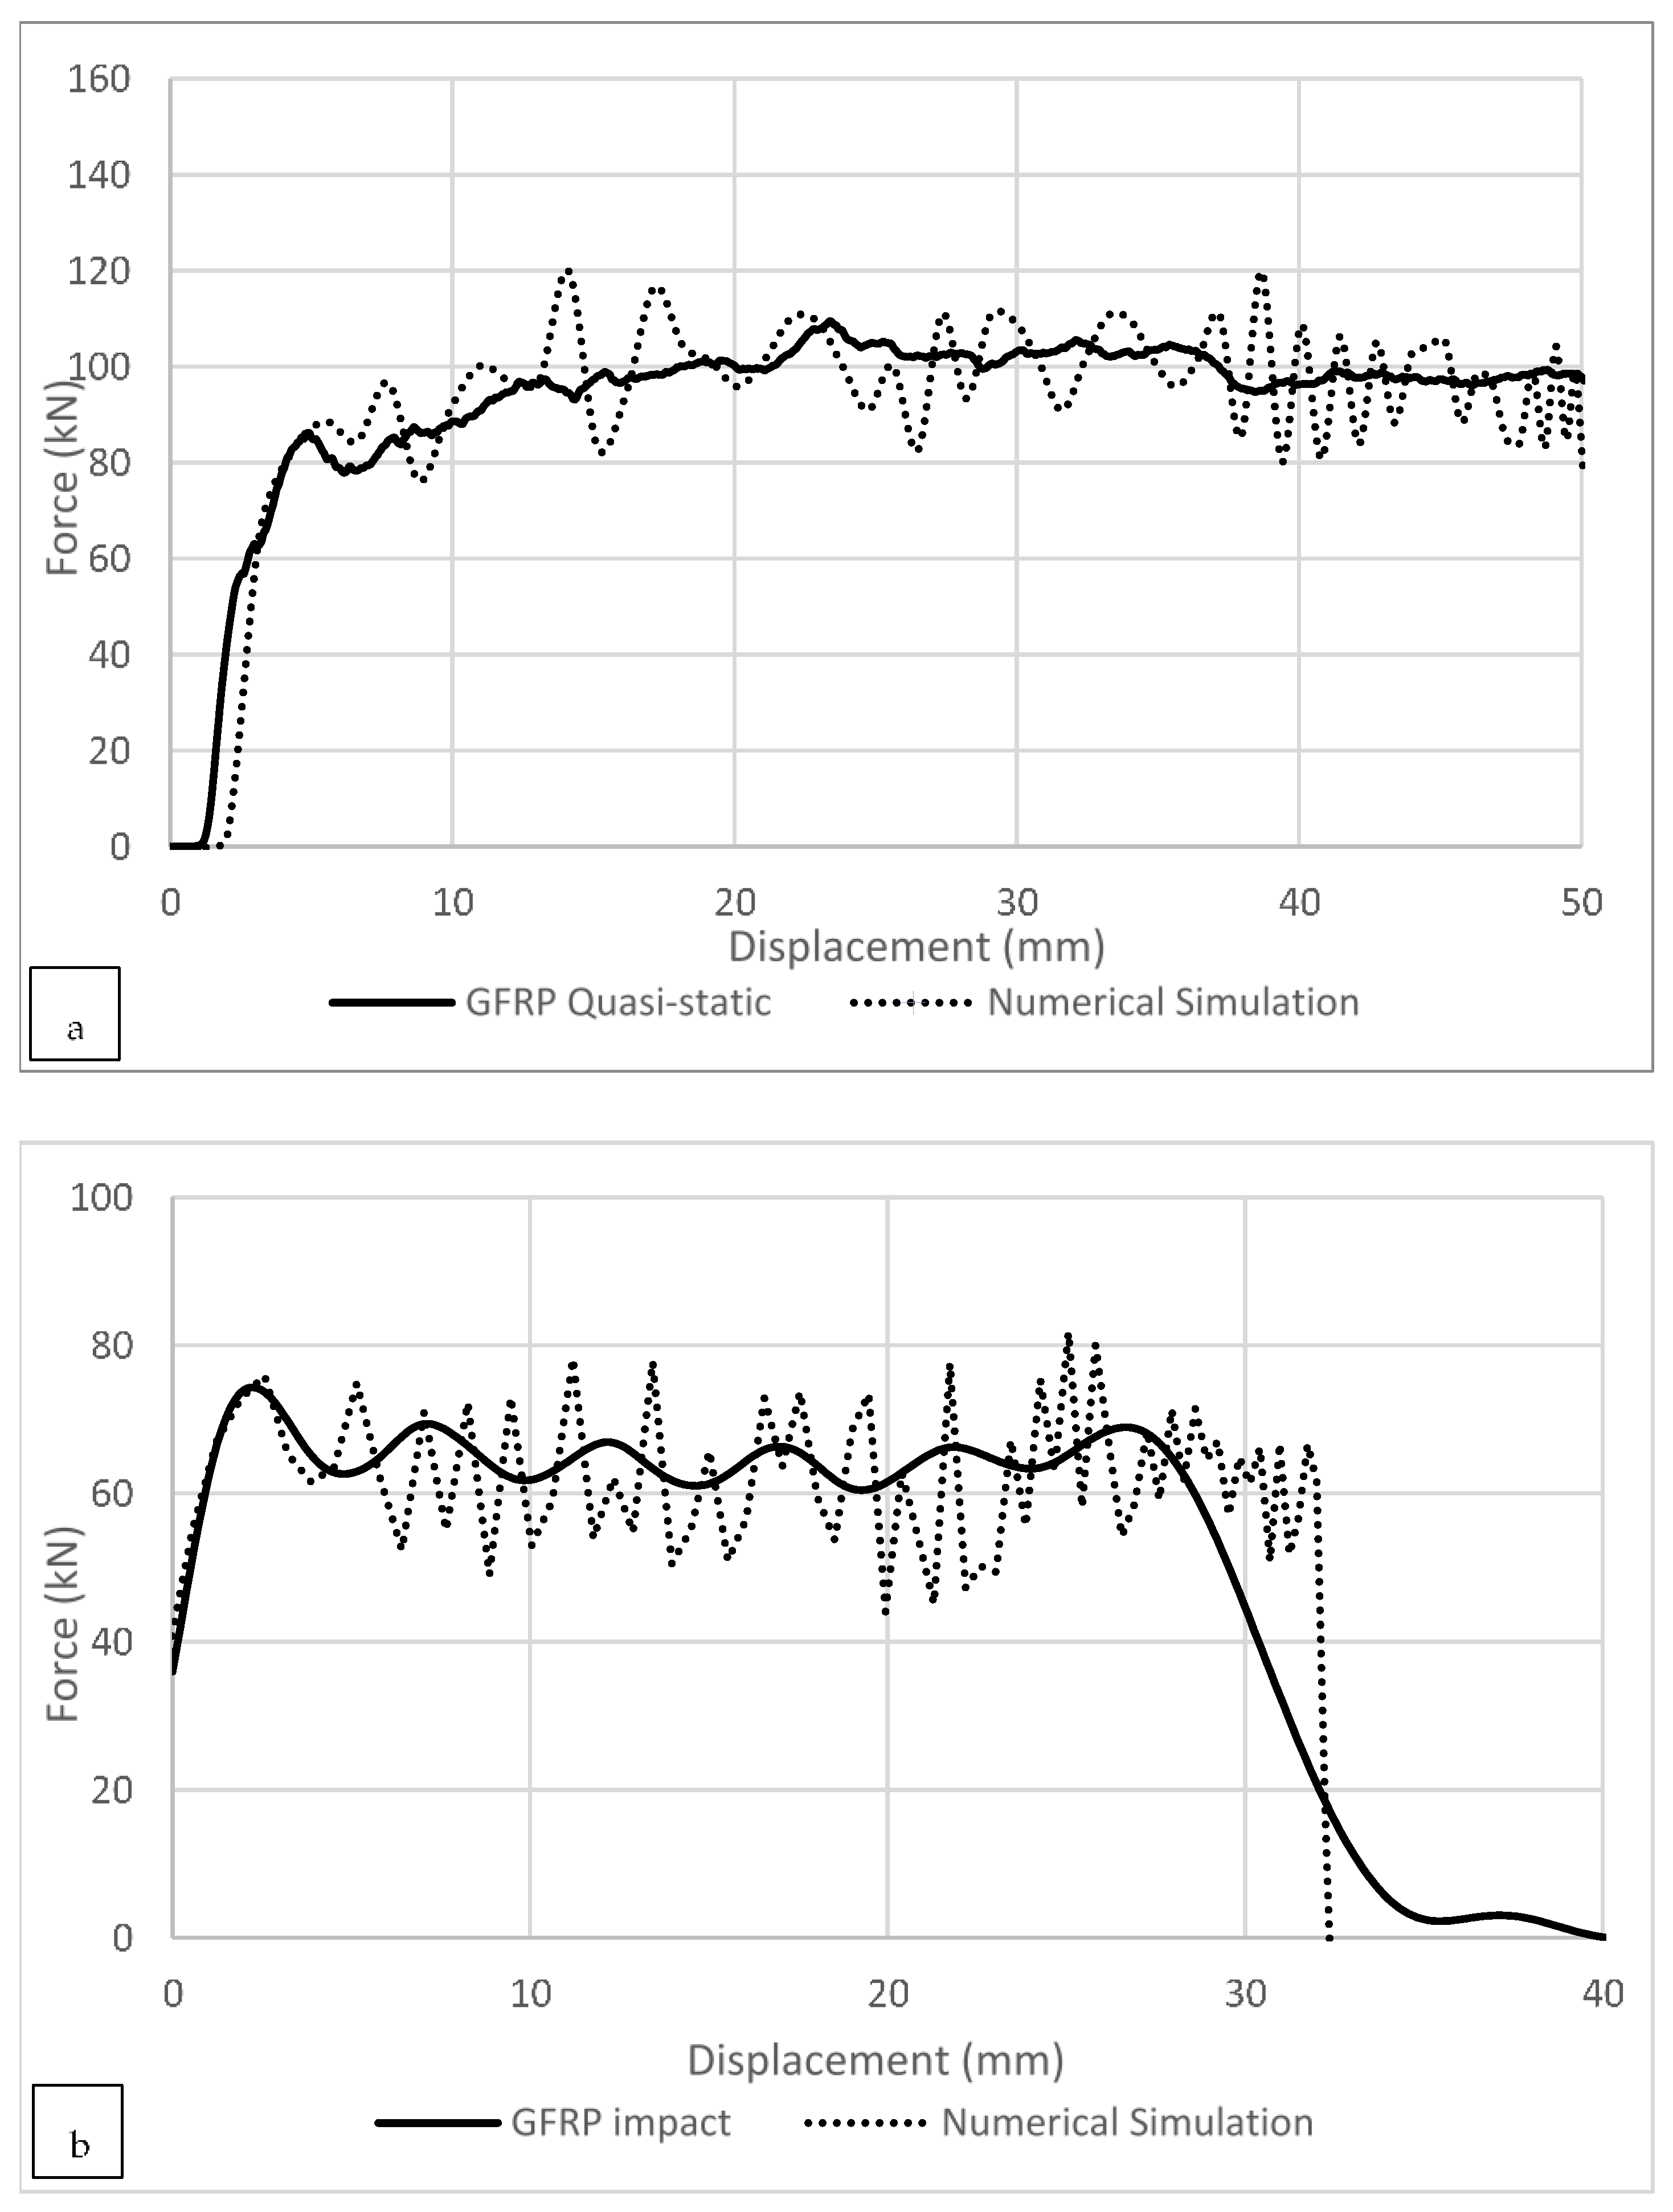
The visual differences in crushed morphologies and the crushing process of composite tubes and FEA are captured by the force–displacement curve diagram.
Figure 26 shows a comparison between numerical and experimental data.
As described by Hall [
17], the experimental data have a serrated shape where the positive slope segments, e.g., (ab) represents the increase in resistance load due to multiple crack propagations until point (b) is reached. Further crushing is initiated, causing a negative slope or drop in resistance force.
In the finite element (dotted black), the oscillations are governed by the element deletion between fronds, and the amplitudes are a function of the strain to failure of the element controlling the tearing and the mode-I delamination resistance.
At any stage of the crushing process, the experimental resistance force is governed by the weakest possible collapse mode(s). The curves from the FEA and experiment have different amplitudes and ranges (see
Figure 26). The amplitudes of the curve and wavelength of FEA are governed by element deletion, and the element size affects the wavelengths. Nevertheless, this leads to collapse modes, which are not captured by the model properly.
6.3. Debris Wedge
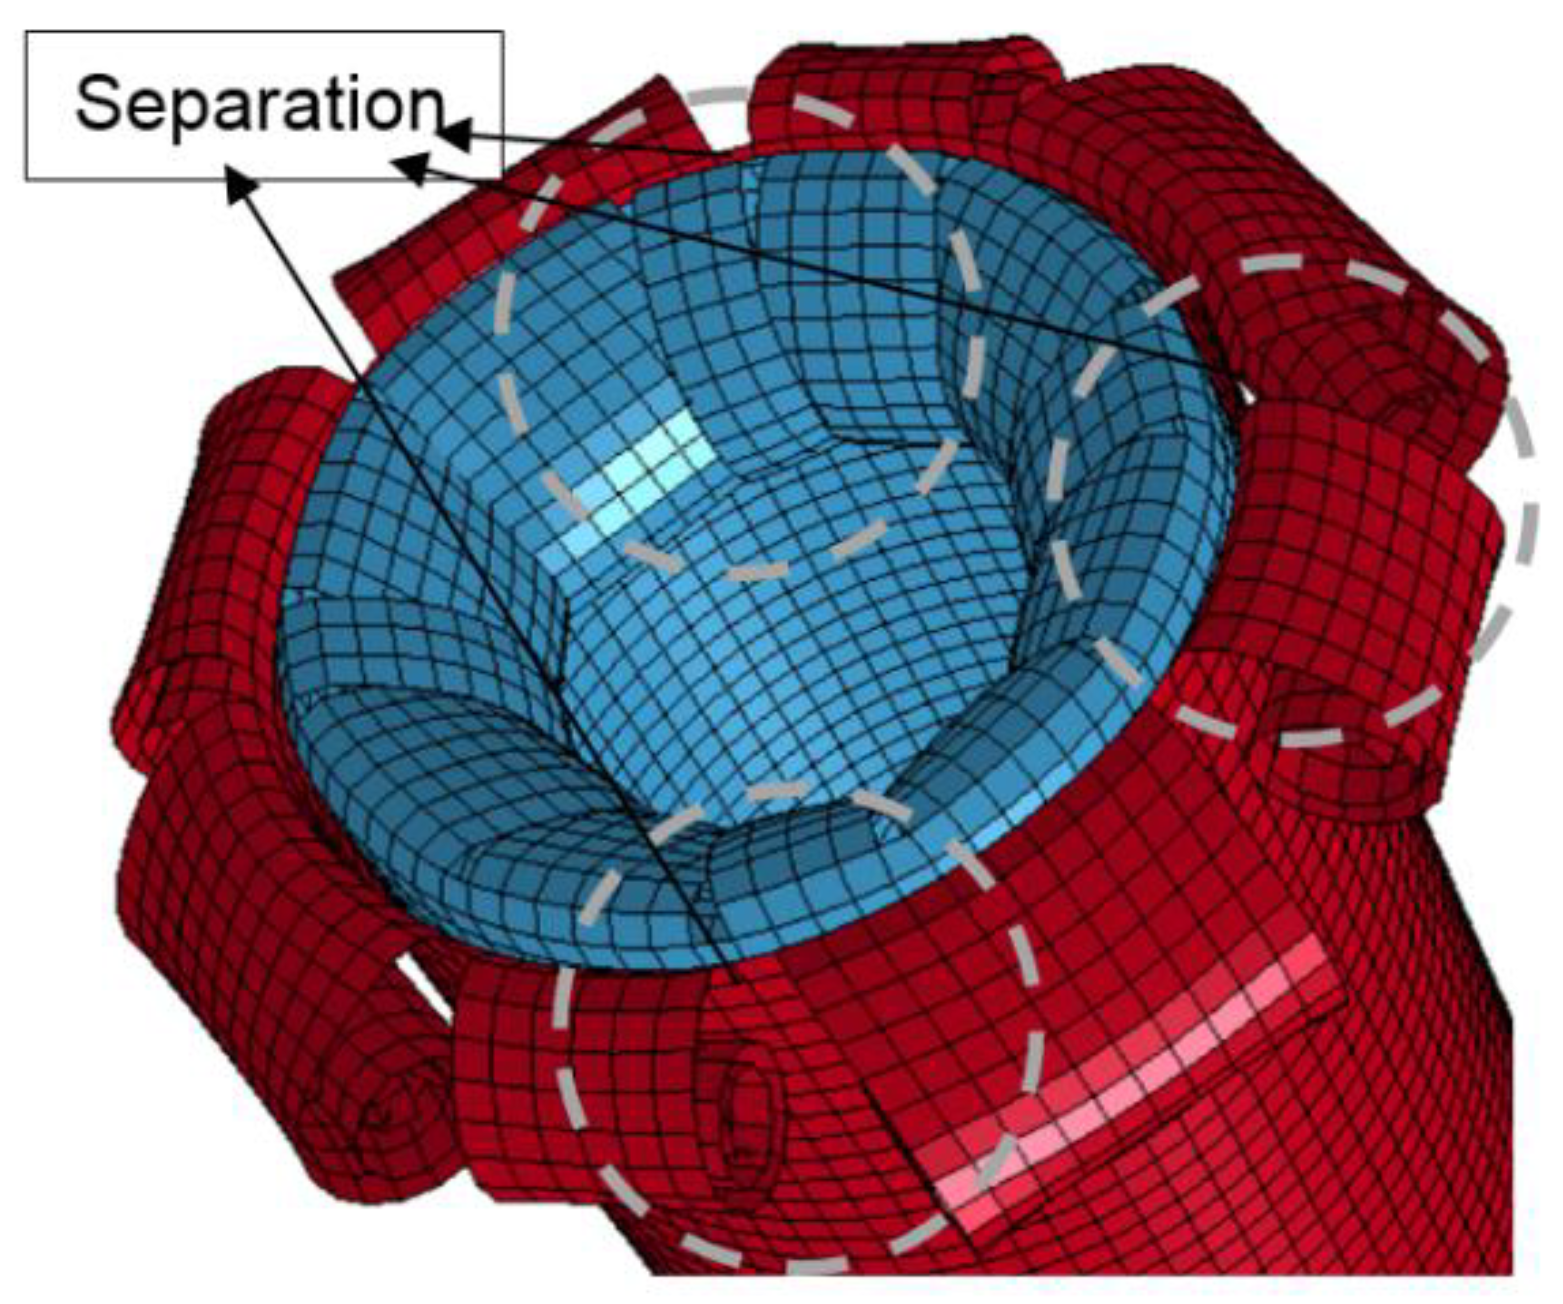
During the progressive crushing process, the fractured material within the Mode-I opening of the tube becomes trapped in the Mode-I opening mode. This increases the friction and affects the crack growth and delamination resistance.
The FEM is not able to simulate this effect if element deletion takes place and does not interfere any longer with the remaining structure. This issue can be resolved by increasing delamination resistance or increasing friction between the shells if a multi-shell configuration is utilised.
Some researchers have tried modelling a debris wedge. McGregor [
10] used a predefined debris wedge designed as rigid, and Mamalis [
4] defined an intermediate layer trying to represent the pulverised material.
8. Conclusions
The aim of this paper was to develop a finite element model using LS-DYNA to simulate the crushing behaviour of composite tubes with a chamfer failure trigger mechanism under various loadings. Various shell configurations were studied, and a multi-layer shell element with double-shell configuration produced accurate enough results with a difference of less than 5% with minimal computational costs compared with other configurations. This configuration was used to predict energy absorption capability and specific energy abortion, and other considerations were deformation and damage progression of the composite tubes. Each shell element or layer can contain either a single ply or multiple plies. The layers were tied using tiebreak option 8 contact definitions. This contact card has the capability of modelling delamination between the layers through an energy-based approach. The material card of Mat_54 was used to represent each ply, and a few parameters in the material cards were studied to find the optimum configurations to match the experimental studies. SOFT and DFAILC (compression failure strain) were the main parameters that affected the energy absorption capability, and specific energy absorption was influenced by these parameters. The sensitivity of the model was studied against the material model, delamination model, friction and impact velocity. The results show that the model is sensitive towards minimal input change. The simulation results showed that the failure peak load, mean crushing force, and SEA all compared very well with the experimental results.
Numerical models are commonly used to predict the mechanical response of simple to complex geometries as this is a cost-effective approach compared to experimental results. FEM is utilised to predict various conditions and scenarios and relative optimisation takes place; however, numerical models, for instance, the one developed in this paper, have their limitations in showing the fracture and crushed zones on a smaller scale, force–displacement characteristics, and debris wedges, which are all contributing factors to energy absorption. Each developed numerical model has its range of validation, which means the model is capable of accurate prediction to a certain level, and the model is incapable of good prediction if the input values exceed the range or the input values are amended. It is critical to experimentally obtain this range if various scenarios are intended to be studied [
66,
67]. Therefore, Double Cantilever Beam (DCB), End-Notched Flexure (ENF), Three Point Bending, compression, tensile testing, and many more can be utilised to improve material behaviour and prediction. Maximising resolution of numerical models can be obtained for various application such as [
68,
69], by improving prediction of material behaviour i.e., the mechanical properties, via physical and non-physical parameters, the discrepancy between experimental and numerical data can be minimised.
The standard deviation between experimental and numerical studies is very low due to calibration of the model based on trial and error and the parametric study to improve resolution. However, different scenarios were conducted, impact and quasi-static, to further understand the discrepancy between a calibrated model and a different scenario without calibration; hence, in this paper, this was utilised as an indication of prediction. The calibrated model had a discrepancy of 5% in the experiment, and when the scenario changed, a similar discrepancy was observed (5%) in the relative experiment.
The calculation errors are all dependent on boundary conditions, mechanical properties inputs, mesh sensitivity and all other parameters discussed in this paper. The model is as accurate as the input values. The calculation error might occur in experimental studies, and measuring the crushed zones, for instance, can make a difference in SEA values.
In conclusion, the developed model in this study has shown to be capable of accurately capturing the crushing behaviour of the tubes with minimal differences whilst being computational cost-efficient. The numerical and experimental studies are in good agreement.


