Article

Fibre-Reinforced Geopolymer Composites Micro-Nanochemistry by SEM-EDS Simulations

Centro di Ricerca Interdisciplinare di Biomineralogia, Cristallografia e Biomateriali, Dipartimento di Scienze Biologiche, Geologiche e Ambientali, Università di Bologna “Alma Mater Studiorum”, Piazza P. San Donato, 1-40126 Bologna, Italy
*
Authors to whom correspondence should be addressed.
J. Compos. Sci. 2021, 5(8), 214; https://doi.org/10.3390/jcs5080214
Submission received: 9 July 2021 / Revised: 5 August 2021 / Accepted: 9 August 2021 / Published: 12 August 2021
(This article belongs to the Special Issue Polymer Composites and Fibers)

Abstract

:
The focus of the present study is on fibre-reinforced geopolymer composites, whose optimization and application necessarily need a detailed chemical characterization at the micro-nanoscale. In this regard, many geopolymer composites presenting micro and nanometric architectures pose a challenge for scanning electron microscopy with energy dispersive X-ray microanalysis (SEM-EDS) quantification, because of several potential sources of errors. For this reason, the present work reports a SEM-EDS Monte Carlo approach to carefully investigate the complex physical phenomena related to the cited quantification errors. The model used for this theoretical analysis is a simplified fibre-reinforced geopolymer with basalt-derived glass fibres immersed in a potassium-poly(sialate-siloxo) matrix. The simulated SEM-EDS spectra showed a strong influence on the measured X-ray intensity of (i) the sample nano-to-micro architecture, (ii) the electron beam probing energy and (iii) the electron probe-sample-EDS detector relative position. The results showed that, compared to a bulk material, the X-ray intensity for a nano-micrometric sized specimen may give rise to potential underestimation and/or overestimation of the elemental composition of the sample. The proposed Monte Carlo approach indicated the optimal instrumental setup depending on the sample and on the specific SEM-EDS equipment here considered.

1. Introduction

There is an urgent need to find an alternative to the ordinary Portland cement (OPC) with new materials with the same, or even improved, performance and lower environmental impact [1,2]. In this context, fibre-reinforced geopolymers, where natural or synthetic fibres are immersed in a geopolymer matrix, are promising materials that can fulfil the requests mentioned above [3,4]. For structural applications, carbon, basalt-derived or glass fibres are commonly employed to enhance strength and fracture toughness of the composite, but also the use of alumina, silicon carbide and mullite is under investigation [5,6,7,8]. The geopolymer matrix is an inorganic ceramic-like material that presents chains or network of covalently bonded molecular units, as described by Davidovits in 1979 [9,10]. Rock-forming minerals, industrial by-products and amorphous silica are used as starting raw materials due to their mineralogical and crystallo-chemical properties, which must be carefully taken into account and investigated [10,11,12]. The most common raw material employed to synthesize geopolymers is metakaolin (MK), i.e., dehydroxylated kaolinite, together with properly selected amounts of alkaline activators such as sodium or potassium hydroxides and/or soluble alkali-silicates (e.g., sodium silicate Na2SiO3). The result of this geopolymerisation reaction is a three-dimensional network of covalently bonded SiO4 and AlO4 tetrahedra, called (Na,K)-poly(sialate-soloxo) geopolymer [10]. Both the reinforcing fibres and the matrix may present micro-nanometric features that, for geopolymers, may be down to 5 nm [10,13,14,15].
Hence, the use of analytical techniques at the micro and nano-scale, such as scanning electron microscopy (SEM) and energy dispersive X-ray microanalysis (EDS), transmission electron microscopy (TEM) and electron energy loss spectroscopy (EELS), nuclear magnetic resonance (NMR), micro-computed tomography (µCT) and scanning probe microscopy (SPM), is required to obtain information of these composite materials, which are fundamental to better understand their mechanical performances at the macroscopic scale [13,16,17,18,19,20]. From this perspective, SEM coupled with EDS is a suitable instrumental approach to characterize the micro/nanomorphology, the texture and architecture and the local chemistry of both freshly synthesized geopolymeric composites and mechanically stressed specimens [21,22]. Indeed, the correlation between morphology and local chemistry is of utmost importance to devise fibre-reinforced geopolymeric composites with desired mechanical properties because these are controlled by several factors. For instance, it is expected a deep influence on the quality of the final product from the formulation of the geopolymeric matrix, which in turn affects the rate of the reaction and the homogeneity of the geopolymer, the resistance to corrosion of the geopolymer particles/fibres, the distribution of the fibres, and the interface between the fibres and the matrix.
However, qualitative and quantitative SEM-EDS analyses at the micro/nanoscale are extremely challenging, because typical corrections for matrix effects, such as ZAF procedures (where Z, A and F are the atomic number, absorption and characteristic fluorescence corrections, respectively), cannot be applied since their supporting hypothesis (the specimen is neither “infinitely” thick nor flat) falls in the considered space domain [23]. For this reason, the X-ray microanalysis of features such as inhomogeneities, reaction products, inclusions, particles, fibres at the micro/nanoscale requires particular attention because several effects may affect the measurement, leading to erroneous results and interpretations. Just to cite some examples reported by Ritchie [24] and in recent literature [25,26,27], we can list the following: the specimen-to-EDS detector configuration, the size and penetration depth of the electron probe with respect to the size and shape of the feature (particle/fibre), inelastic and elastic electron scattering, the X-ray adsorption paths toward the EDS detector, and the specimen-to-EDS detector configuration.
To overcome this issue, the use of SEM-EDS Monte Carlo simulations is a powerful approach to better understand the physical phenomena giving rise to measurement errors. By modelling the electron transport and generation of X-rays in solids under realistic experimental conditions [25,26,27], it is possible to devise a suitable and practical analytical protocol for fibre-reinforced geopolymer composites. To this aim, in the present work, we performed SEM-EDS Monte Carlo simulations, considering different instrumental operating conditions for the analysis of a geopolymer composite with a potassium-poly(sialate-siloxo) matrix (K-PSS) and basalt-derived glass fibres reinforcement.

2. Materials and Methods

2.1. SEM-EDS Monte Carlo Method

The Monte Carlo method is an invaluable tool to calculate the electron trajectories inside materials, where realistic EDS detectors and the generation and transport of X-rays can be accounted for in the simulation of the X-ray spectrum [25,27]. Since fibre-reinforced geopolymers are composites with complex micro-/nanosized substructures, a complete understanding of the physical phenomena occurring during SEM-EDS measurements is of the utmost importance for a precise and accurate quantitative X-ray microanalysis.
The SEM-EDS Monte Carlo model considers the three-dimensional trajectories of electrons as sequences of straight segments, each weighted by the mean free path and ended by an elastic scattering event, which is modelled with different methods as described in [28,29,30]. The average energy loss due to inelastic collisions is modelled within the continuous slowing down approximation [31], with the energy loss in the travelled distance described by the Joy-Luo expression [32]. The ionisation cross-section is modelled according to the parameterized analytical expression of Bote and Salvat [33,34]. The fluorescence yields tabulated by Perkins and co-workers are employed to model the relaxation process of core-shell vacancies for the characteristic X-rays generation, in isotropic conditions and without considering photon polarization [35]. To obtain the primary continuum (Bremsstrahlung) non-isotropic emission, the simulations considered the tabulated partial and total cross-sections for Bremsstrahlung production of Seltzer and Berger [36,37,38,39]. X-ray absorption considers the photoelectric component of the mass absorption coefficients calculated by Chantler and co-workers [40].
In the present modelling, both characteristic primary and continuum (Bremsstrahlung) X-ray photons propagate in random directions and could either be absorbed by photoionization or escape the materials. Following the specific probabilities, the relaxation yields secondary X-ray fluorescence of the absorbing element [24].
A realistic SEM-EDS setup was modelled, considering a modern silicon drift detector (SDD) and an electron probe of 5 nm. The SDD energy dispersive X-ray detector was simulated taking into account its resolution and efficiency: an ultrathin polymer window (Moxtek AP 3.3 film), an Al layer of 30 nm, a dead layer of 10 nm, a detector crystal thickness of 0.45 mm, a sample-to-detector distance of 57 mm, a detector area of 30 mm2, 2000 channels each of 10 eV and a resolution of 124 eV (FWHM at Mn Kα). The detector elevation angle was set to 35°. An electron source with a Gaussian profile (5 nm Gaussian width) and in parallel illumination (zero beam divergence) was employed.

2.2. Fibre-Reinforced Geopolymer Model

We considered a geopolymer composite with a potassium-poly(sialate-siloxo) matrix (K-PSS) and basalt-derived glass fibres as reinforcement.
In detail, a 3D cylindrical basalt-derived glass fibre embedded in a K-PSS geopolymer matrix, infinitely thick compared to the depth of penetration of the electrons, was simulated to study the case of a fibre-reinforced geopolymer composite sectioned for SEM-EDS microanalysis, as shown in Figure 1a. In our model, the fibre is perpendicularly oriented with respect to the sample surface; hence, the section of the basalt-derived glass fibre is circular. The radius of the fibre (in our model, the radius of the circular section) was varied between 0.1 and 20 μm (0.1, 0.3, 0.5, 0.75, 1, 3, 5, 7.5, 10 and 20 μm), with a fibre length of 50 μm, investigating the effects of different electron beam energies between 2 keV and 20 keV, which are commonly used in SEM-EDS analysis. The surface roughness of the sample is assumed to be atomic-flat, not influencing the EDS analysis. We employed a typical composition of basalt-derived glass fibre, as reported by [41,42,43], whose chemical composition, expressed as the mass fraction of oxides, is reported in Table 1, with a mass density 2.66 g/cm3 [41,44,45]. Basalt fibres are produced by melting volcanic basalt rocks at 1450–1500 °C at atmospheric pressure into a furnace, and forcing the molten material through platinum/rhodium crucible bushings to create fibres (see [7] for details of the process). The resulting glass fibres are thus expected to retain only the mean elemental chemistry of the starting minerals. A K-PSS geopolymer produced by the reaction of metakaolin and potassium-bearing alkaline activators was considered. Metakaolin is a very common starting raw material that can be obtained by thermal dehydroxilation of natural kaolin, whose structural properties also depend on the microstrain [46]. The K-PSS geopolymer had oxide molar ratios K2O:Al2O3:4SiO2:6H2O, identified as the typical stoichiometric composition of K-PSS [10], and a mass density of 1.50 g/cm3 [10].
The simulations were performed considering both the electron beam focused on the centre of the circular section of the fibre (see Figure 1a) and several focussing points with the distance varying between 250 nm and 100 μm, to investigate the fibre-to-matrix interface (see Figure 1b for the sake of a graphical example).

3. Results and Discussion

The general hypothesis governing the quantitative SEM-EDS microanalysis is that the sample behaves as a bulk material, which in the present work is defined as a material sufficiently large enough to contain all the electron trajectories and the generated X-rays. This assumption is not valid when the features and architectures of the sample are in the micro- or nano-domain, because of the scattering volume of the electrons, which can be larger than the size of the investigated object. Hence, the occurrence of large quantification errors in such cases is expected. In addition, shape-dependent factors may have a non-negligible effect on the microchemical analysis. For these reasons, it is necessary to understand and evaluate the complex physics behind these issues, and a detailed SEM-EDS Monte Carlo investigation is a suitable approach for this purpose [25,26,27].
In the present work, we performed Monte Carlo simulations to obtain the SEM-EDS spectra of a basalt-derived cylindrical glass fibre embedded in a K-PSS geopolymer matrix. The fibre was oriented with its axis perpendicular to the sample surface, resulting in a circular section (see Figure 1a,b). This model was employed to produce two sets of data related to:
  • different combinations of fibre size and electron beam energy (Figure 1a);
  • the position of the electron probe focussing point with respect to the centre of the circular section of the fibre (Figure 1b).
The simulations considered realistic experimental conditions to obtain useful indications for a precise and accurate quantitative microanalysis on this composite material.

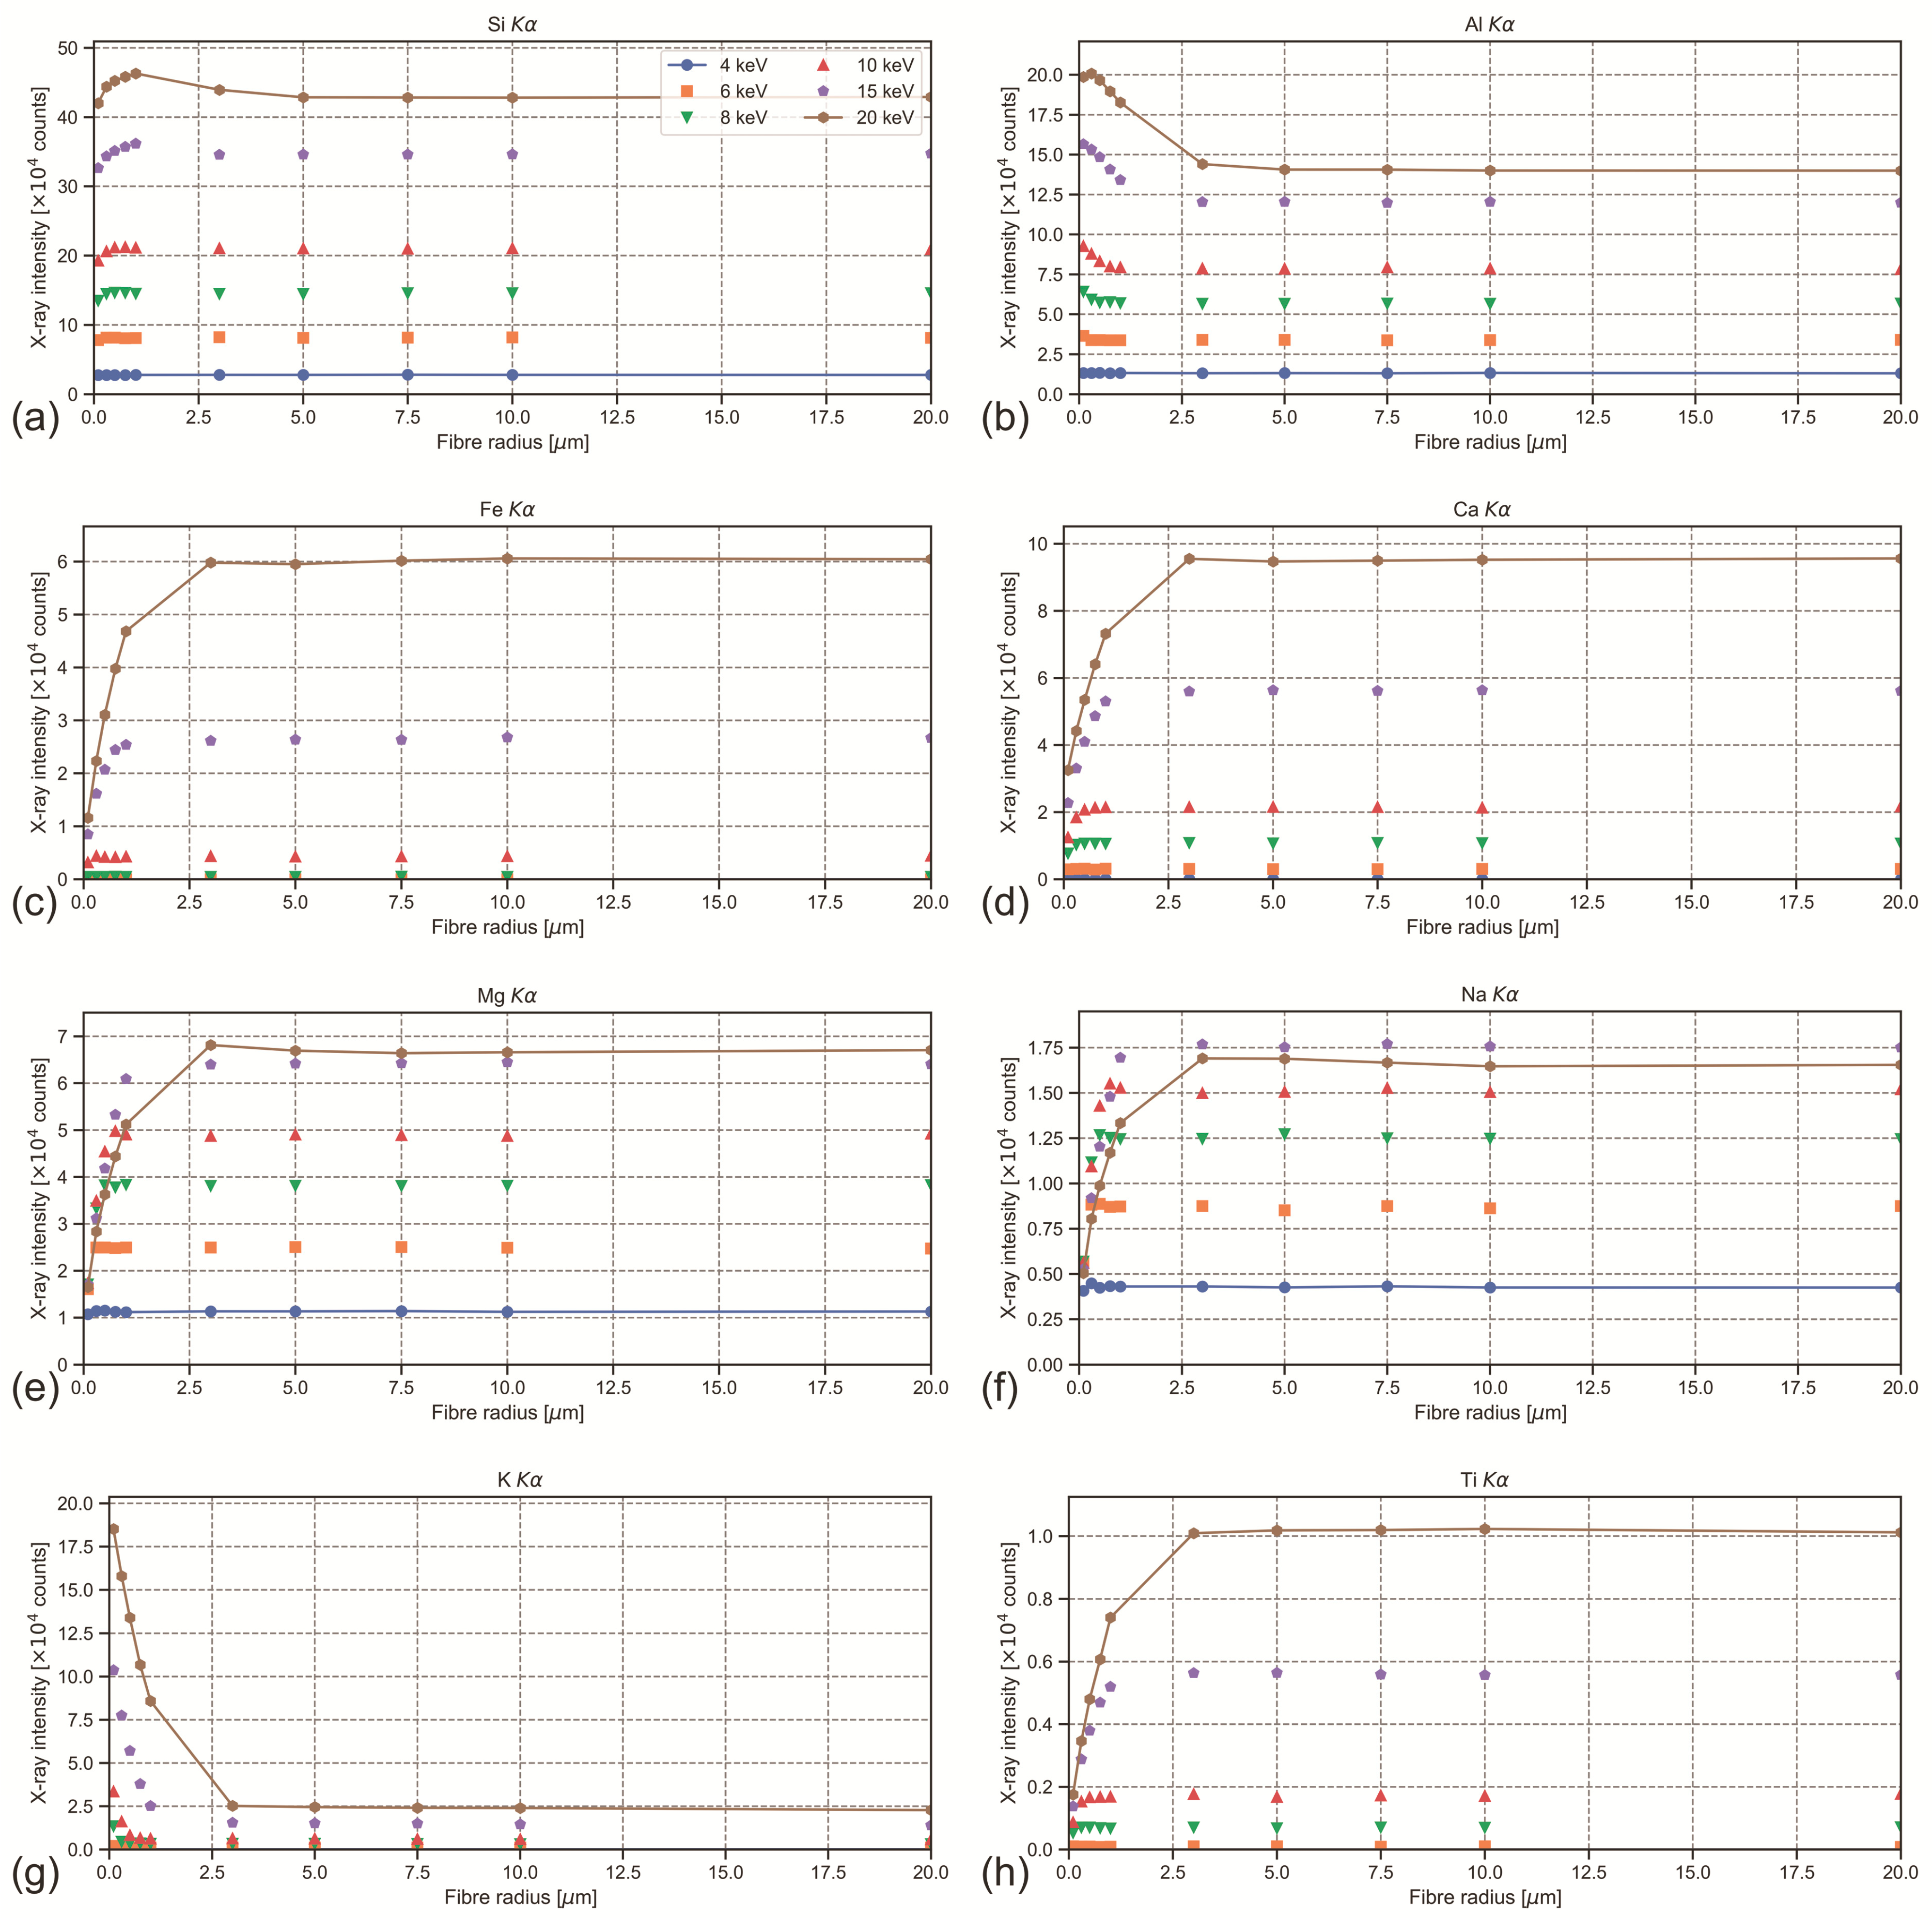
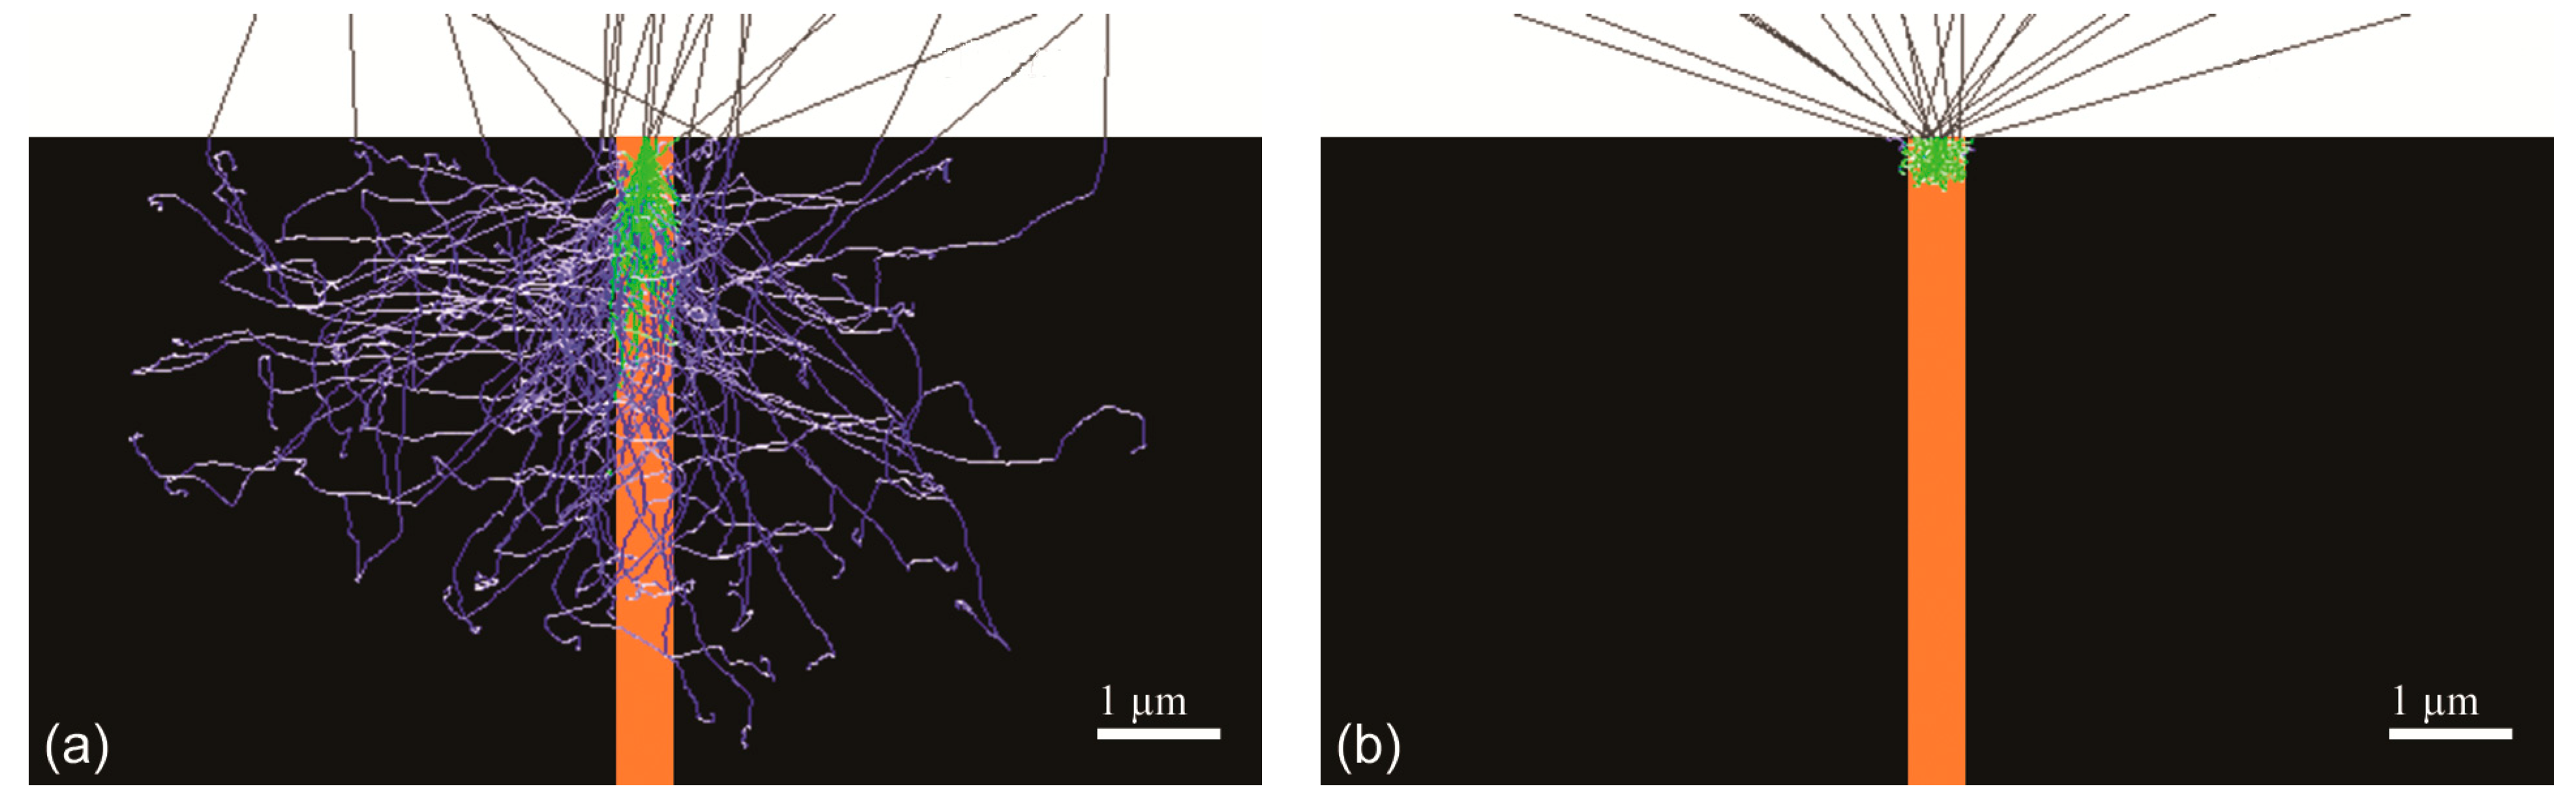
3.1. Fiber Core Analysis

In the first case, we considered the electron probe focused on the centre of the circular section of the fibre, investigating how the sample geometry (radius of the fibre) and the chosen electron beam energy influence the X-ray microanalysis. The radius of the basalt-derived glass fibre and the electron beam energy were varied in the range 100 nm–20 µm and 2–20 keV, respectively. The aim is finding the optimal working setting that should be used to avoid quantification errors when using a SEM-EDS instrumental setup as described in Section 2.
To show how the cited parameters (electron beam energy and radius of the fibre) may influence the microchemical quantification, we report in Figure 2a,b an example of the three-dimensional electron trajectory images generated by the Monte Carlo simulations, reported as bidimensional projections on the xz plane. It can be noted that, despite the size of the electron probe is only 5 nm and the beam is focused on the centre of the circular section, when the acceleration voltage is the typically used 20 kV, the electrons are able to pass through a fibre with radius of 300 nm (green trajectories) and penetrate the geopolymer matrix (blue trajectories) for up to about 5 µm in depth and laterally scattering for about 8 µm (Figure 2a). For these measurement conditions, the SEM-EDS spectrum is obviously a combination of X-rays generated from both the fibre and the matrix, with the latter giving a very high contribution. Additionally, the backscattered electrons (grey trajectories) escape mostly from the matrix rather than the fibre.
By varying the instrumental configurations via Monte Carlo simulation, it was observed that the electron trajectories are confined inside the fibre when using an acceleration voltage of 6 kV, or lower, for a fibre with a radius of 300 nm and for the specific conditions considered in our model (Figure 2b). In this case, the backscattered electrons only escape from the fibre.
The SEM-EDS spectra were simulated as if they were acquired from the specific silicon drift detector and SEM chamber setup described in Section 2, as a function of both the glass fibre radii and electron beam energies. All the contribution to the X-ray generation (even secondary fluorescence from primary characteristic X-rays and Bremsstrahlung) were included in the simulated spectra. Before performing the integration of each characteristic X-ray line, the background was subtracted from the SEM-EDS spectra.
The results of the described Monte Carlo approach are reported for the main elements composing the basalt-derived glass fibre and the geopolymer matrix in Figure 3. In detail, Figure 3a–h show how the integrated X-ray intensity varies for the X-ray Kα lines of Si, Al, Fe, Ca, Mg, Na, K, Ti depending on the selected electron beam energy. The figures report the simulated intensities for both a glass fibre with variable radius in the range 100 nm–20 µm (continuous lines for the extreme values) and the reference bulk material (black dashed line). A non-linear reduction of the X-ray intensities of Si Kα, Fe Kα, Ca Kα, Mg Kα, Na Kα, Ti Kα as a function of the radius of the circular section of the fibre can be observed, down to the minimum value of 100 nm.
Conversely, the intensity of the Al Kα and K Kα lines increases because these elements are present also in the Al- and K-rich geopolymer matrix. Furthermore, considering the bulk material as a reference, the intensity deviates for radii of the basalt-derived fibre lower than about 5 μm at 20 keV, 3 μm at 15 keV, 1 μm at 10 keV and 0.3 μm at 5 keV. Hence, below these sizes, the X-ray generation volume is greater than the fibre radius.
More into details, if we consider the variation of the X-ray intensity as a function of the fibre radius (see Figure A1 in the Appendix A), the Si Kα (1.740 keV) presented a very peculiar trend (Figure A1a). In fact, by reducing the radius of the glass fibre, there is an initial increase of the integrated intensity below 5 µm, then the intensity abruptly decreases below 1 µm. Such a trend is more evident at 20 keV, then it gradually decreases by reducing the acceleration voltage. From the point of view of the microchemical analysis of the fibre, these results suggest that the measurement of Si Kα X-rays would be overestimated for fibre with a radius in the range 0.3–5 µm, underestimated when the radius is lower than about 0.3 µm, and correct for fibre radii greater than 5 µm. The origin of this trend for fibre with a radius of 0.3–5 µm resides in the finite-size (mass) effect being lower than the reduced X-ray absorption. The results seem to suggest that an electron beam of 6 keV would produce X-ray intensities for most of the elements in the basalt-derived glass fibre very close to those of the bulk of this material (see Figure 3). However, this beam energy is not enough to induce the generation of the Fe Kα X-ray line, whose K absorption edge is higher than 6 keV (7.112 keV). Furthermore, the K absorption edges of Ti, Ca and K atoms (4.967 keV, 4.038 keV and 3.607 keV, respectively) are too close to the electron probe energy of 6 keV to produce a useful X-ray intensity.
The present Monte Carlo simulations, performed with the considered experimental conditions, clearly show that it is of the utmost relevance accounting for the measurement issues here described; otherwise, performing a quantitative SEM-EDS microanalysis of a basalt-derived glass fibre would result in erroneous determinations and/or interpretations of the local chemistry. For the sake of an example, if a fibre of 500 nm radius is analysed with a 15 keV electron beam, the microchemistry from the Kα lines of Fe, Ca, Mg Na and Ti would be underestimated by about 22, 27, 35, 30 and 32%, respectively, whereas the Si Kα, Al Kα and the K Kα lines would be overestimated by 1, 24 and 320%, respectively.

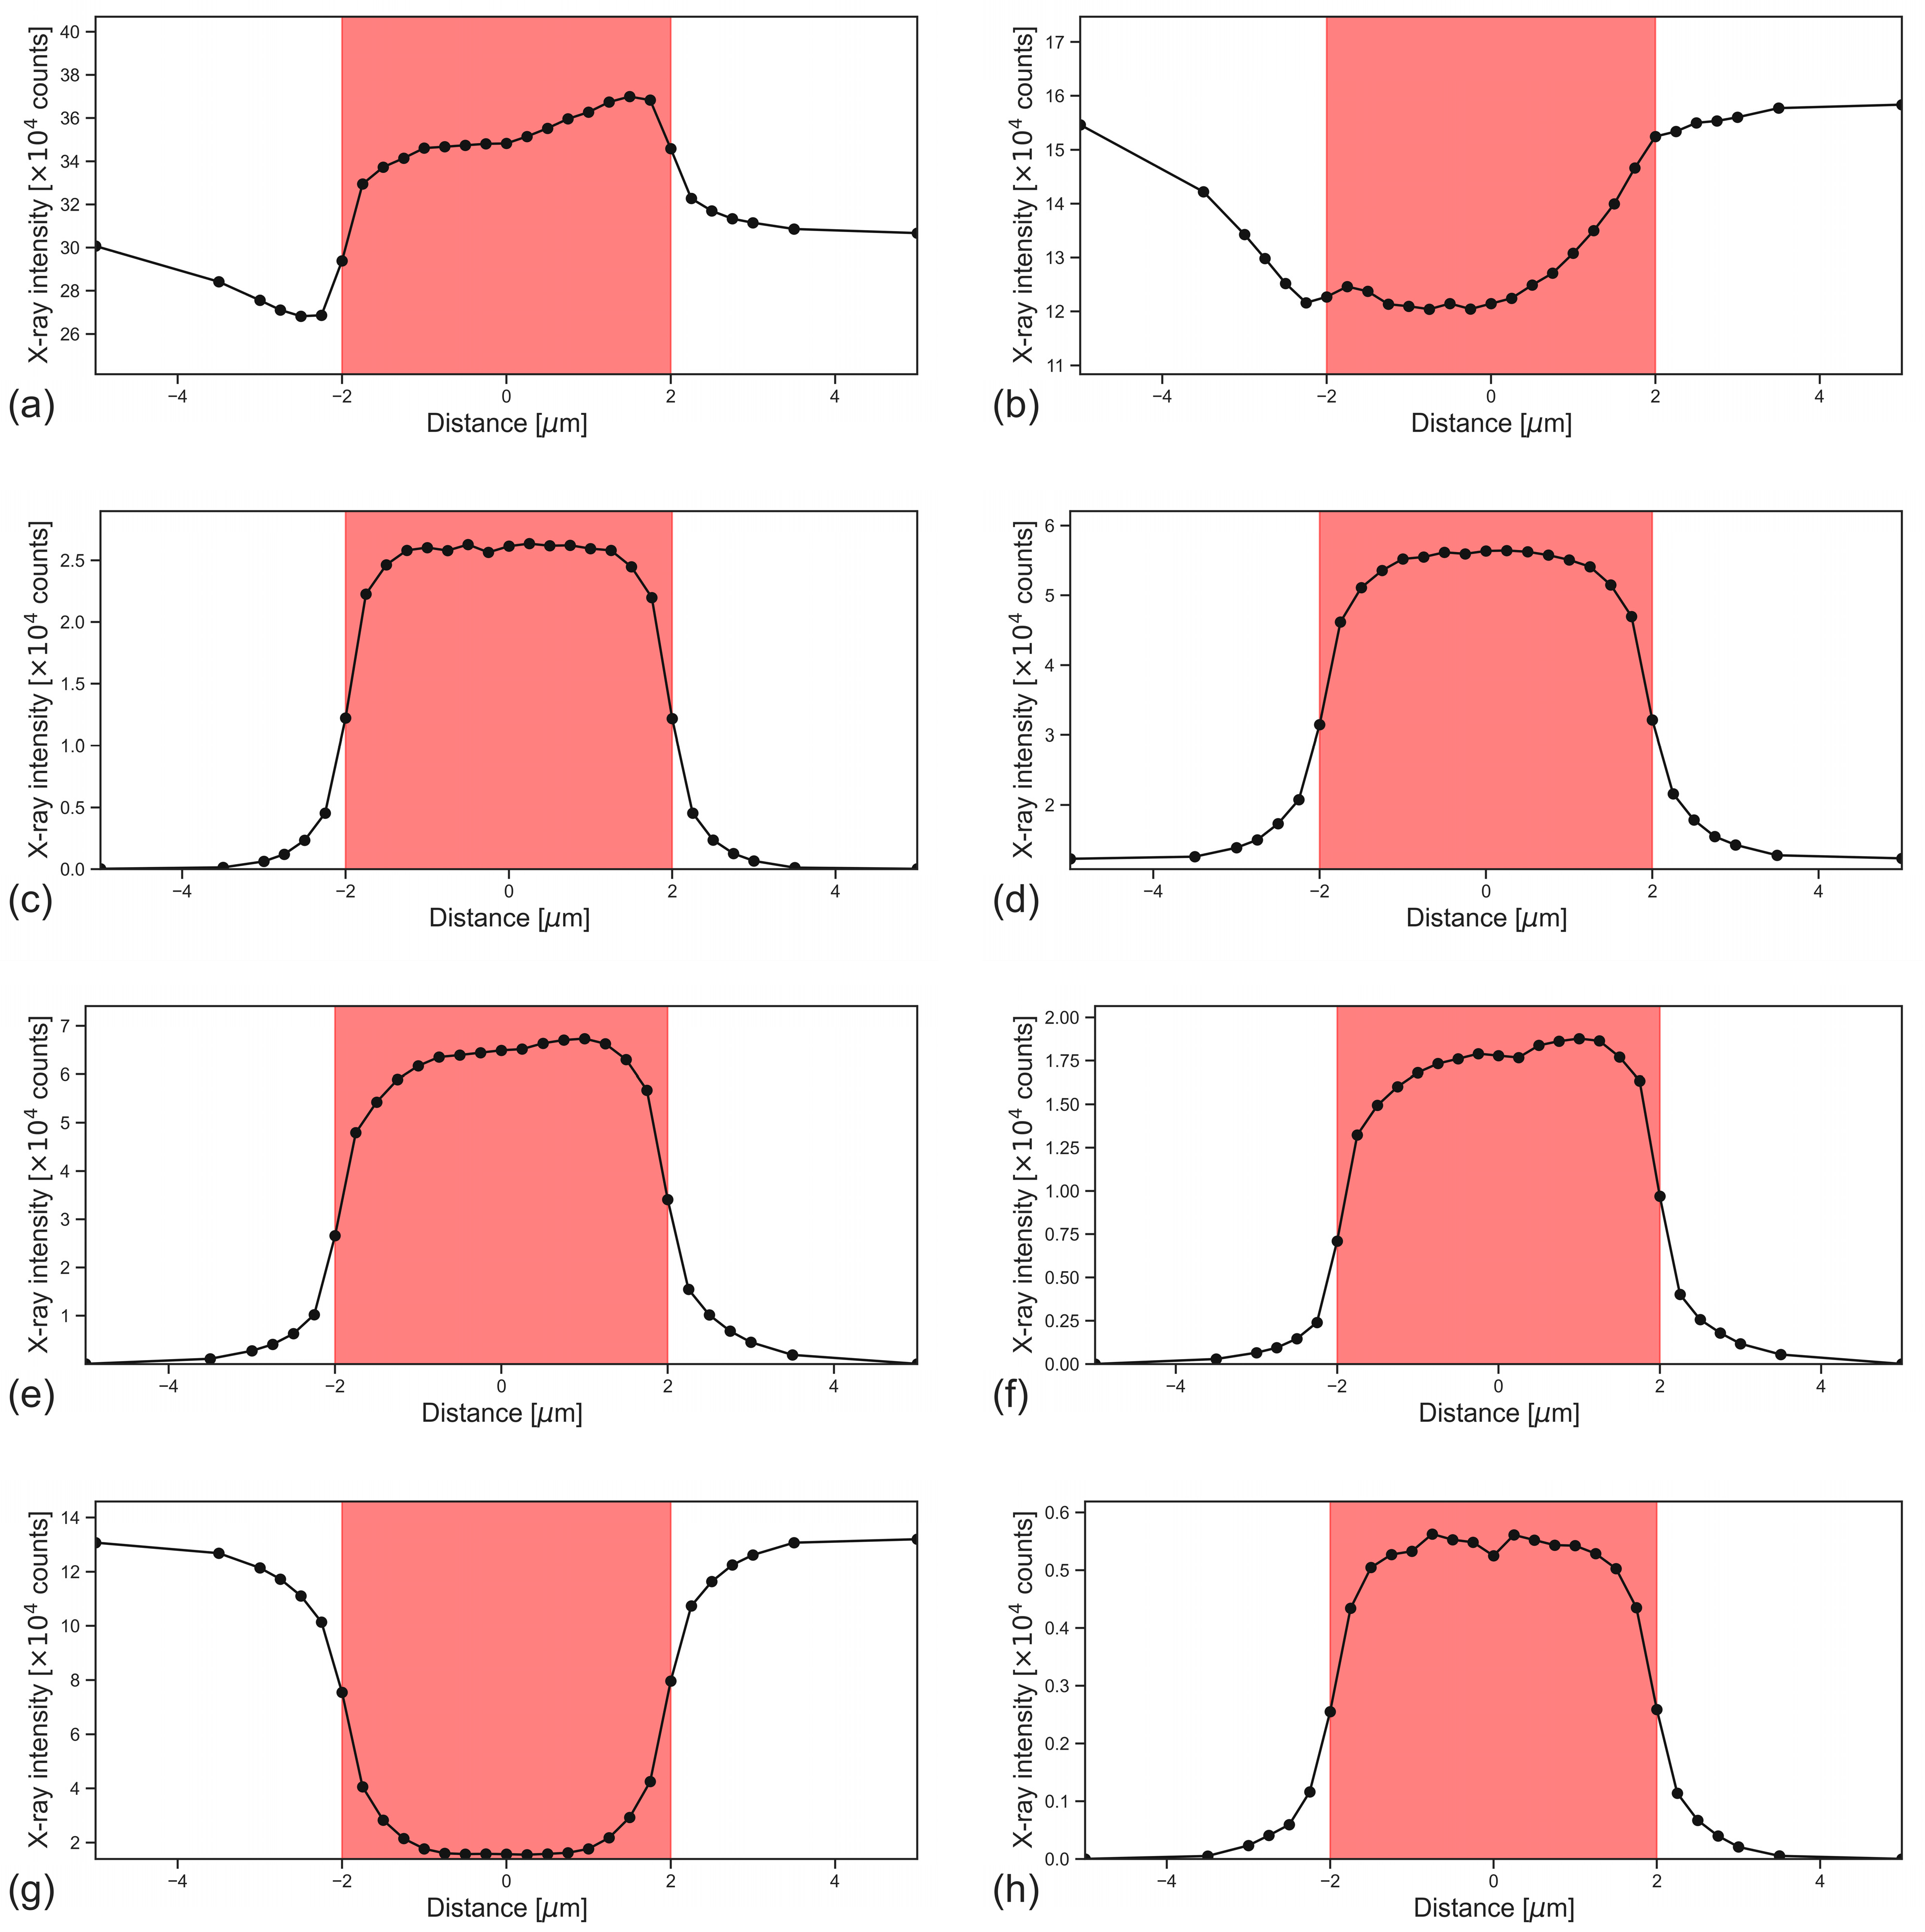
3.2. Fibre-Geopolymer Interface Analysis

When dealing with a composite material with micro-to-nanometric features and architectures, a major role in determining the properties of the whole composite is played by the chemistry, the structure and the features of the interface between the different components. However, for this kind of investigation, it is of the utmost importance to understand both the potentials and the limits of the SEM-EDS microanalytical technique by accurately considering the underlying physical phenomena. In fact, it is known that the spatial resolution of the secondary electrons can reach the nanometre level, but the spatial resolution of the microanalysis (chemical resolution) is much lower. Hence, the analytical focussing point must be carefully chosen to avoid possible quantification errors.
For this reason, here, we proposed an example consisting of the analysis of the same kind of composite material (basalt-derived fibre embedded in a K-PSS geopolymer matrix), moving the position of the focussing point along the x direction at different distances, as shown in the model of Figure 1b. For these simulations, we set the electron beam energy to 15 keV and the fibre radius to 2 μm, whereas the position of the electron beam probe was varied between −100 μm and 100 μm with respect to the centre of the circular section of the fibre (see Figure 1b).
The results of this analysis are graphically reported in Figure 4, which shows the integrated X-ray intensity of the X-ray Kα lines of Si, Al, Fe, Ca, Mg, Na, K, Ti as a function of the position of the electron probe. For the sake of clearness, the relative position of the silicon-drift detector is, as shown in Figure 1b, on the right part of the axis of the graphs reported in Figure 4. The plots are zoomed between −5 μm and 5 μm, with the position of the basalt-derived fibre highlighted in red.
It is possible to distinguish different effects, trends and features according to the elements present in the fibre and/or in the matrix. The simplest one is given by some elements present only in the fibre (Fe, Ca, Mg, Na, Ti) or also in the geopolymer matrix (K), where the integrated X-ray intensities follow a “hat-/muffin-shaped” curve with its maximum (minimum in the case of potassium) inside the fibre. The results show that, when the point of analysis is on the matrix, for distances lower than about 1 μm from the edge of the fibre, there is a significant contribution from the fibre X-ray lines of Fe, Ca, Mg, Na, Ti and, conversely, a non-linear reduction of the X-ray intensity of potassium. In addition, it can be noted that the “hat/muffin-shaped” curves are symmetric with respect to the origin (zero distance, centre of the circular section of the fibre) for Fe Kα, Ca Kα, Ti Kα and K Kα, but they are asymmetric and show a slight decrease of the X-ray intensities at negative displacements of the focussing point for the lines Mg Kα and Na Kα.
This difference is due to the energy of the characteristic X-rays of magnesium and sodium, which is lower than that of the other, heavier elements, and to the relative position of the focussing point, fibre and EDS detector. In fact, moving the focussing spot in the negative x axis of the graphs reported in Figure 4 means that the generated X-rays must travel a longer path to reach the detector (placed on the positive axis) and/or pass through the fibre that has a mean atomic number and a density higher than the matrix. Since low-energy X-rays have a higher probability of being adsorbed than high-energy ones, this explains the asymmetry and the different shapes of the curves for the light elements (Mg, Na) with respect to heavier ones (Fe, Ca, Ti, K).
A very interesting and relevant behaviour is observed for the Kα lines of Si and Al, basic and important elements present in both the basalt-derived glass fibre and the geopolymer. Monte Carlo simulations resulted fundamental to understand the chemical contribution of the two constituting components. In fact, for these characteristic X-rays, moving from the matrix to the fibre means changing the contributions to the EDS spectra arising from the different components, with a non-linear, asymmetric trend. Using the Si Kα line as an example (Figure 4a), displacing the focussing point from −100 μm to 100 μm resulted in an initial intensity plateau corresponding to the geopolymer matrix (data not shown), which started dropping at about −4 μm from the left fibre’s edge (−2 μm). Then, from about −2.2 μm from the fibre centre, the X-ray intensity rose to a first local maximum at about −0.5 μm. The second (absolute) maximum was found inside the right fibre’s edge (+2 μm), at about +1.5 μm from the centre of the fibre. Finally, the intensity of the Si Kα reaches the same plateau value found on the negative axis at about +4 μm from the right edge of the fibre. This trend can be explained by the geopolymer matrix being less dense and less rich in silicon than the basalt-derived fibre, resulting in the observed lowered X-ray intensities outside the fibre, and by the different paths travelled by the generated characteristic X-ray radiations to reach the detector, as previously discussed. Similar considerations can be extended to the Al Kα line, but for this element, the concentration is higher in the geopolymer matrix than in the fibre.
Finally, the results here obtained for the analysis of the proposed composite material provide further implications for other analytical circumstances, where both the instrumental settings and sample geometry (size, shape) could play an important role. For example, here, a single straight fibre was modelled, but more fibres could be present, with complex geometries, e.g., twisted and/or tangled. Additionally, according to the interest in characterizing the matrix, the fibre and/or their interface, it could be important considering the position of the focussing point for the microanalysis.

4. Conclusions

The present work highlighted that several effects influence both qualitative and quantitative X-ray microanalysis of geopolymer composite materials, with important repercussions on the correct interpretation of the results. In this context, Monte Carlo simulations of the generation of the SEM-EDS spectra are an effective and powerful tool to predict the several potential issues associated with the investigation of the nano-micro sized architecture of the composite materials. In general, the results suggested a necessary compromise between operative parameters of the SEM-EDS instruments because the use of high acceleration voltages, on the one hand, increases the intensity of the X-ray lines and excites heavier elements, but on the other hand, the chemical spatial resolution worsen because of the increased electron penetration and scattering. By taking into account different combinations of the experimental conditions, specific sample geometries (thickness and shape), features, chemistry and electron beam energy, it is possible to obtain “a priori” knowledge that could help the experimentalist in performing a correct SEM-EDS analysis, avoiding errors that may be up to several tens of percentages in the X-ray intensity measurements. Finally, Monte Carlo simulation can be used to devise and assess the correct nano-microanalytical spatially resolved methodology for the specific sample and chemistry involved, for instance, the use of TEM-EDS and EELS instead of SEM-EDS.

Author Contributions

Conceptualization, D.M., G.U. and G.V.; methodology, D.M.; validation, D.M., G.U. and G.V.; formal analysis, D.M.; investigation, D.M., G.U. and G.V.; data curation, D.M., G.U. and G.V.; writing—review and editing, D.M., G.U. and G.V.; visualization, D.M. and G.U.; supervision, G.V. All authors have read and agreed to the published version of the manuscript.

Funding

This research received no external funding.

Conflicts of Interest

The authors declare no conflict of interest.

Appendix A

Figure A1. Simulated SEM-EDS integrated X-ray intensities of (a) Si, (b) Al, (c) Fe, (d) Ca, (e) Mg, (f) Na, (g) K and (h) Ti Kα lines, plotted as a function of the fibre radius, for selected electron beam energies and with the analytical point on the centre of the circular section of the fibre.
Jcs 05 00214 g0a1

References

  1. Davidovits, J. Geopolymers. J. Therm. Anal. 1991, 37, 1633–1656. [Google Scholar] [CrossRef]
  2. Catauro, M.; Tranquillo, E.; Barrino, F.; Dal Poggetto, G.; Blanco, I.; Cicala, G.; Ognibene, G.; Recca, G. Mechanical and thermal properties of fly ash-filled geopolymers. J. Therm. Anal. Calorim. 2019, 138, 3267–3276. [Google Scholar] [CrossRef]
  3. Samal, S.; Blanco, I. An Application Review of Fiber-Reinforced Geopolymer Composite. Fibers 2021, 9, 23. [Google Scholar] [CrossRef]
  4. Ranjbar, N.; Zhang, M. Fiber-reinforced geopolymer composites: A review. Cem. Concr. Compos. 2020, 107, 103498. [Google Scholar] [CrossRef]
  5. Lin, T.; Jia, D.; He, P.; Wang, M. In situ crack growth observation and fracture behavior of short carbon fiber reinforced geopolymer matrix composites. Mater. Sci. Eng. A 2010, 527, 2404–2407. [Google Scholar] [CrossRef]
  6. Monaldo, E.; Nerilli, F.; Vairo, G. Basalt-based fiber-reinforced materials and structural applications in civil engineering. Compos. Struct. 2019, 214, 246–263. [Google Scholar] [CrossRef]
  7. Fiore, V.; Scalici, T.; Di Bella, G.; Valenza, A. A review on basalt fibre and its composites. Compos. Part B Eng. 2015, 74, 74–94. [Google Scholar] [CrossRef]
  8. Akono, A.T.; Koric, S.; Kriven, W.M. Influence of pore structure on the strength behavior of particle- and fiber-reinforced metakaolin-based geopolymer composites. Cem. Concr. Compos. 2019, 104, 103361. [Google Scholar] [CrossRef]
  9. Davidovits, J. Polymère Minéral 1979. French Patent, No. FR2464227A1, 7 July 1979. [Google Scholar]
  10. Davidovits, J. Geopolymer Chemistry and Applications, 5th ed.; Davidovits, J., Ed.; Institut Géopolymère: Saint-Quentin, France, 2020; ISBN 9782954453118. [Google Scholar]
  11. Ulian, G.; Valdrè, G.; Corno, M.; Ugliengo, P. DFT investigation of structural and vibrational properties of type B and mixed A-B carbonated hydroxylapatite. Am. Mineral. 2014, 99, 117–127. [Google Scholar] [CrossRef]
  12. Ulian, G.; Valdrè, G. Density functional investigation of the thermophysical and thermochemical properties of talc [Mg3Si4O10 (OH)2]. Phys. Chem. Miner. 2015, 42, 151–162. [Google Scholar] [CrossRef]
  13. Duxson, P.; Provis, J.L.; Lukey, G.C.; Mallicoat, S.W.; Kriven, W.M.; Van Deventer, J.S.J. Understanding the relationship between geopolymer composition, microstructure and mechanical properties. Colloids Surf. A Physicochem. Eng. Asp. 2005, 269, 47–58. [Google Scholar] [CrossRef]
  14. Duxson, P.; Fernández-Jiménez, A.; Provis, J.L.; Lukey, G.C.; Palomo, A.; van Deventer, J.S.J. Geopolymer technology: The current state of the art. J. Mater. Sci. 2007, 42, 2917–2933. [Google Scholar] [CrossRef]
  15. Giannopoulou, I.; Panias, D. Hydrolytic stability of sodium silicate gels in the presence of aluminum. J. Mater. Sci. 2010, 45, 5370–5377. [Google Scholar] [CrossRef]
  16. Moro, D.; Ulian, G.; Valdrè, G. Nanoscale cross-correlated AFM, Kelvin probe, elastic modulus and quantum mechanics investigation of clay mineral surfaces: The case of chlorite. Appl. Clay Sci. 2016, 131, 175–181. [Google Scholar] [CrossRef]
  17. Gatti, A.; Valdre, G.; Tombesi, A. Importance of microanalysis in understanding mechanism of transformation in active glassy biomaterials. J. Biomed. Mater. Res. 1996, 31, 475–480. [Google Scholar] [CrossRef]
  18. Valdrè, G.; Botton, G.A.; Brown, L.M. High spatial resolution PEELS characterization of FeAl nanograins prepared by mechanical alloying. Acta Mater. 1999, 47, 2303–2311. [Google Scholar] [CrossRef]
  19. Borgia, G.C.; Brown, R.J.S.; Fantazzini, P.; Mesini, E.; Valdre, G. Diffusion-weighted spatial information from 1 H relaxation in restricted geometries. Nuovo Cim. D 1992, 14, 745–759. [Google Scholar] [CrossRef]
  20. Samal, S.; Kolinova, M.; Rahier, H.; Poggetto, G.D.; Blanco, I. Investigation of the Internal Structure of Fiber Reinforced Geopolymer Composite under Mechanical Impact: A Micro Computed Tomography (µCT) Study. Appl. Sci. 2019, 9, 516. [Google Scholar] [CrossRef] [Green Version]
  21. Frydrych, M.; Hýsek, Š.; Fridrichová, L.; Le Van, S.; Herclík, M.; Pechočiaková, M.; Le Chi, H.; Louda, P. Impact of Flax and Basalt Fibre Reinforcement on Selected Properties of Geopolymer Composites. Sustainability 2019, 12, 118. [Google Scholar] [CrossRef] [Green Version]
  22. Guo, Z.; Wan, C.; Xu, M.; Chen, J. Review of Basalt Fiber-Reinforced Concrete in China: Alkali Resistance of Fibers and Static Mechanical Properties of Composites. Adv. Mater. Sci. Eng. 2018, 9198656. [Google Scholar] [CrossRef] [Green Version]
  23. Ritchie, N.W.M. Using DTSA-II to Simulate and Interpret Energy Dispersive Spectra from Particles. Microsc. Microanal. 2010, 16, 248–258. [Google Scholar] [CrossRef] [Green Version]
  24. Ritchie, N.W.M. Efficient Simulation of Secondary Fluorescence Via NIST DTSA-II Monte Carlo. Microsc. Microanal. 2017, 23, 618–633. [Google Scholar] [CrossRef]
  25. Moro, D.; Ulian, G.; Valdrè, G. Monte Carlo SEM-EDS micro- and nanoanalysis of ultrathin gold leaves in glass mosaic tesserae: Thickness effects and measurement strategy. Measurement 2018, 129, 211–217. [Google Scholar] [CrossRef]
  26. Valdrè, G.; Moro, D.; Ulian, G. Monte Carlo simulation of the effect of shape and thickness on SEM-EDS microanalysis of asbestos fibres and bundles: The case of anthophyllite, tremolite and actinolite. In Proceedings of the IOP Conference Series: Materials Science and Engineering, Konstanz, Germany, 7–11 May 2018; Volume 304. [Google Scholar]
  27. Moro, D.; Ulian, G.; Valdrè, G. SEM-EDS microanalysis of ultrathin glass and metal fragments: Measurement strategy by Monte Carlo simulation in Cultural Heritage and Archaeology. Int. J. Conserv. Sci. 2020, 11, 223–232. [Google Scholar]
  28. Myklebust, R.; Newbury, D.; Yakowitz, H. NBS Monte Carlo Electron Trajectory Calculation Program; Heinrich, K., Yakowitz, H., Newbury, D., Eds.; National Bureau of Standards Special Publication: Washington, DC, USA, 1976. [Google Scholar]
  29. Czyżewski, Z.; MacCallum, D.O.; Romig, A.; Joy, D.C. Calculations of Mott scattering cross section. J. Appl. Phys. 1990, 68, 3066. [Google Scholar] [CrossRef]
  30. Jablonski, A.; Salvat, F.; Powell, C.J. NIST Electron Elastic-Scattering Cross-Section Database 2010; National Institute of Standards and Technology: Gaithersburg, MD, USA, 2010. [Google Scholar]
  31. Ritchie, N.W.M. Spectrum Simulation in DTSA-II. Microsc. Microanal. 2009, 15, 454–468. [Google Scholar] [CrossRef] [Green Version]
  32. Joy, D.C.; Luo, S. An empirical stopping power relationship for low-energy electrons. Scanning 1989, 11, 176–180. [Google Scholar] [CrossRef]
  33. Bote, D.; Salvat, F.; Jablonski, A.; Powell, C.J. Cross sections for ionization of K, L and M shells of atoms by impact of electrons and positrons with energies up to 1 GeV: Analytical formulas. At. Data Nucl. Data Tables 2009, 95, 871–909. [Google Scholar] [CrossRef]
  34. Bote, D.; Salvat, F. Calculations of inner-shell ionization by electron impact with the distorted-wave and plane-wave Born approximations. Phys. Rev. A 2008, 77, 042701. [Google Scholar] [CrossRef]
  35. Perkins, S.T.; Cullen, D.E.; Chen, M.H.; Rathkopf, J.; Scofield, J.; Hubbell, J.H. Tables and Graphs of Atomic Subshell and Relaxation Data Derived from the LLNL Evaluated Atomic Data Library (EADL), Z = 1–100; Lawrence Livermore National Laboratory: Berkley, CA, USA, 1991. [Google Scholar]
  36. Acosta, E.; Llovet, X.; Salvat, F. Monte Carlo simulation of bremsstrahlung emission by electrons. Appl. Phys. Lett. 2002, 80, 3228. [Google Scholar] [CrossRef]
  37. Salvat, F.; Fernandez-Varea, J.M.; Sempau, J. PENELOPE 2014: A Code System for Monte Carlo Simulation of Electron and Photon Transport; OECD: Issy-les-Moulineaux, France, 2015. [Google Scholar]
  38. Seltzer, S.M.; Berger, M.J. Bremsstrahlung energy spectra from electrons with kinetic energy 1 keV–10 GeV incident on screened nuclei and orbital electrons of neutral atoms with Z = 1–100. At. Data Nucl. Data Tables 1986, 35, 345–418. [Google Scholar] [CrossRef]
  39. Seltzer, S.M.; Berger, M.J. Bremsstrahlung spectra from electron interactions with screened atomic nuclei and orbital electrons. Nucl. Instrum. Methods Phys. Res. Sect. B Beam Interact. Mater. Atoms 1985, 12, 95–134. [Google Scholar] [CrossRef]
  40. Chantler, C.T.; Olsen, K.; Dragoset, R.A.; Chang, J.; Kishore, A.R.; Kotochigova, S.A.; Zucker, D.S. X-ray Form Factor, Attenuation, and Scattering Tables (Version 2.1) 2005; National Institute of Standards and Technology: Gaithersburg, MD, USA, 2005. [Google Scholar]
  41. Lipatov, Y.V.; Gutnikov, S.I.; Manylov, M.S.; Zhukovskaya, E.S.; Lazoryak, B.I. High alkali-resistant basalt fiber for reinforcing concrete. Mater. Des. 2015, 73, 60–66. [Google Scholar] [CrossRef]
  42. Tang, C.; Jiang, H.; Zhang, X.; Li, G.; Cui, J. Corrosion Behavior and Mechanism of Basalt Fibers in Sodium Hydroxide Solution. Materials 2018, 11, 1381. [Google Scholar] [CrossRef] [PubMed] [Green Version]
  43. Pastsuk, V.; Kiisk, M.; Lõhmus, R.; Merisalu, M.; Kovaljov, S.; Biland, A.; Gulik, V. Selection of basalt fiber with resistance to concrete alkaline environment. SN Appl. Sci. 2020, 2, 1–17. [Google Scholar] [CrossRef]
  44. Sim, J.; Park, C.; Moon, D.Y. Characteristics of basalt fiber as a strengthening material for concrete structures. Compos. Part B Eng. 2005, 36, 504–512. [Google Scholar] [CrossRef]
  45. Li, W.; Xu, J. Mechanical properties of basalt fiber reinforced geopolymeric concrete under impact loading. Mater. Sci. Eng. A 2009, 505, 178–186. [Google Scholar] [CrossRef]
  46. Dellisanti, F.; Valdrè, G. The role of microstrain on the thermostructural behaviour of industrial kaolin deformed by ball milling at low mechanical load. Int. J. Miner. Process. 2012, 102–103, 69–77. [Google Scholar] [CrossRef]
Figure 1. Geometrical models of the simulated SEM-EDS setup. (a) Circular section of a basalt-derived glass fibre embedded in a potassium-poly(sialate-siloxo) geopolymer matrix, with the electron beam focussed on the centre of the fibre top-surface. The silicon drift EDS detector was set with an elevation angle of 35°. (b) Example of spots for EDS microanalysis. The surface roughness of the sample is assumed not to influence the EDS analysis. Images created with the POV-Ray software.
Jcs 05 00214 g001
Figure 2. Bidimensional projections of the three-dimensional electron trajectories simulated inside a basalt-derived glass fibre (orange area, radius of 300 nm, “infinite” height) embedded in a K-PSS geopolymer matrix (black area) for an electron beam energy of (a) 20 keV and (b) 6 keV. When the electrons are moving inside the fibre or the matrix, or when they are escaping the sample surface, the trajectories are coloured in green, blue and grey, respectively.
Jcs 05 00214 g002
Figure 3. Integrated X-ray intensities of (a) Si, (b) Al, (c) Fe, (d) Ca, (e) Mg, (f) Na, (g) K and (h) Ti Kα lines, plotted as a function of the electron beam energy and for different radii of the basalt-derived glass fibre. The graphs report also the trend simulated for the bulk-like material (black dashed line). Legend in (a).
Jcs 05 00214 g003
Figure 4. Integrated X-ray intensity calculated from simulated EDS spectra of the composite sample as a function of the distance of the analytical point from the centre of the circular section of the glass fibre (see Figure 1b). The red area in the various plots represents the fibre vertical section, with a radius of 2.0 μm. The reported trends are those calculated for the Kα X-ray emission line of (a) Si, (b) Al, (c) Fe, (d) Ca, (e) Mg, (f) Na, (g) K and (h) Ti.
Jcs 05 00214 g004
Table 1. Oxides mass fraction (wt%) of basalt-derived glass fibre.
SiO2Al2O3Fe2O3CaOMgONa2OK2OTiO2P2O5MnO
501514962.31.71.60.20.2
Publisher’s Note: MDPI stays neutral with regard to jurisdictional claims in published maps and institutional affiliations.

